Abstract
We describe the second of two large-scale atomic simulation projects on materials failure performed on the 12-teraflop ASCI (Accelerated Strategic Computing Initiative) White computer at the Lawrence Livermore National Laboratory. This investigation simulates ductile failure by using more than one billion atoms where the true complexity of the creation and interaction of hundreds of dislocations are revealed.
What Distinguishes Brittle From Ductile Behavior?
If brittle fracture were the sole mechanism for materials failure, our world would be quite fragile. However, there are two generic types of materials failure: brittle fracture and ductile bending. In the first case, atomic bonds are broken, and such a failure is easily recognized when you see glass shatter. For ductile failure, such a catastrophic event does not occur. Tough materials like metals do not shatter; they bend because plastic deformation occurs by the motion of rows of atoms sliding past one another on preferred slip-planes (dislocations).
We briefly review some basic fundamentals of fracture mechanics (1). They are simple to understand even though we all know that fractured glass can look very complicated, because there are lots of cracks when glass shatters. As a matter of fact, micocracks are the seeds for both brittle and ductile failure. To understand the failure of solids, we must go to an atomic picture of matter. It is because a solid is made up of atoms, and not a continuum, that a solid can break. Fracture is a consequence of breaking atomic bonds by separating atoms from their neighboring atoms, which can happen because the bonds have a limited strength, the strength depending on the particular material. The solid is said to be brittle when this happens; this has the special meaning that the solid fails by the permanent breaking of atomic bonds. Solids can fail a second way; by rows of atoms slipping past their immediate nearest neighbors much like a “ripple in a rug” being pushed across a stationary floor. However, the atomic-level ripple is now called a line dislocation. Also, while atomic bonds are broken by stretching the solid, the sliding between planes is achieved by shearing the solid. The ease of the atomic slip depends on the atomic arrangement of the slip planes. The more compact (less bumpy) planes slip best. When the solid fails by atomic sliding through dislocation motion, the solid is described as ductile. The face-centered-cubic (FCC) packing is known to have a strong propensity toward ductility; body-centered-cubic much less so. Glasses do not have extended crystallinity because atoms are packed randomly. They have no slip-planes and hence no ductility. Glasses exhibit brittle failure. These descriptions are oversimplified, and there are clear exceptions to them.
Molecular Dynamics Experiments on ASCI (Accelerated Strategic Computing Initiative) White Computer
We have described our simulation tool in the accompanying paper (2). We give a very brief summary. Our simulation tool is computational molecular dynamics (3), which is very easy to describe. Molecular dynamics predicts the motion of a large number of atoms governed by their mutual interatomic interaction, and it requires the numerical integration of the equations of motion, force equals mass times acceleration or F = ma. In the present simulations, we adopt simple interatomic force laws because we want to investigate the generic features of a particular many-body problem common to a large class of real physical systems and not governed by the particular complexities of a unique molecular interaction.
Furthermore, for our billion atom simulation here, total simulation time, as well as total clock time, is of real concern. A factor of 3 increase in execution time using a favored interatomic potential describing a “real” material (e.g., the embedded atom potential for metals) may result in an excessive computational burden when simulating lots of atoms. This was our situation because our billion atom simulation required more than one million computer hours and 4 clock days to complete. A simple interatomic potential may be thought of as a model potential, and the model potential for the present study is the Lennard-Jones 12:6 potential.
Second Study: Ductile Failure Of A Flawed FCC Solid Under Tension
This simulation of ductile failure and work-hardening is for a crystal sample approaching the μm length scale and for a total simulation time sufficient to achieve the evolving rigid-junction microstructure. This has important significance in helping the development of continuum theories for plastic deformation in small structures. Before this study, it was widely believed that one needed a mesoscopic bridge coupling the atomic scale to the macroscopic scale (4). Because the smallest dimension for an accurate continuum prediction corresponds to the largest attainable size of an atomistic simulation, the need for a mesoscopic bridge may not be so pressing.
The Plastic Deformation Scenario.
We quote from page 284 of Cottrell's book (5):
“… plastic deformation and multiplication of glide dislocations, particularly in soft metals such as pure copper, increase the glide stress. This work-hardening can be very striking. A 1-in diameter single-crystal copper bar, for example, can easily be bent to a horseshoe shape between the hands, but not straightened out again. Figure 9.23 [in ref. 5] shows the usual shape of (shear) stress-strain curve obtained from an FCC metal crystal. Stage I (also called easy glide) of the plastic range is entered at the initial yield stress. In this stage the crystal glides to a strain usually 0.01–0.1, on a single set of parallel slip planes, and there is little work-hardening, because the glide dislocations mostly escape through the free surface. Eventually the deformation becomes ‘turbulent,’ and strong work-hardening (stage II, also called linear hardening) sets in as the dislocations moving on intersecting systems mutually entangle one another.”
This description of plasticity will become much clearer when you see our atomistic simulation of the phenomenon. We emphasize the word “see.” While a general understanding has been known for quite some time, it has been impossible to observe the rich microscopic details of the many-body dislocation dynamics in the laboratory. With the advent of teraflop computing, this has become a reality.
The Computer Experiment Setup.
This simulation builds on our earlier studies of a single crack in a three-dimensional FCC solid under mode I loading (6, 7). The interatomic forces are treated as central forces, modeled as a Lennard-Jones 12:6 potential, and we express quantities in terms of reduced units. This Lennard-Jones potential has been used successfully in several simulation studies concerning the mechanical properties of copper (8–11), with its shortcomings well documented. As mentioned earlier, total simulation time, as well as total clock time, for our billion atoms simulation is of real concern. A factor of 3 increase in execution time using a favored interatomic potential describing a “real” material (e.g., the embedded atom potential for metals) would result in an excessive computational burden when simulating lots of atoms. Also, it is important to note that the generalized stacking fault energy, which is the key property for the dislocation creation, is the same for the Lennard-Jones and the embedded atom potentials when proper normalization is made for the comparison (12).
Our model for simulating work-hardening is very simple. We have two opposing surface cracks on opposite faces of a three-dimensional FCC solid cube and apply mode I loading. The system is a slab with 1,008 atoms along the three orthogonal sides. Two notches are centered midway along the x direction, at y = 0 and y = Ly, with a y extension of 90 atomic layers extending although the entire thickness Lz. The exposed notch faces are in the y-z planes with (110) faces, and the notch is pointed in the <1 1̄ 0 > direction. Periodic boundary conditions are imposed between the x-y faces at z = 0 and z = Lz. This notched slab geometry has a total of 1,023,103,872 atoms. The total simulation time for this study is 200,000 time steps or 900 in reduced units. It takes 1.7 s per time step for a 4,096-node spatial decomposition simulation on the Accelerated Strategic Computing Initiative (ASCI) White computer that translate into approximately 4 clock-days of total simulation time.
The slab is initialized at zero reduced temperature, and an outward strain of 4% is imposed on the outermost columns of atoms defining the opposing vertical yz faces of the slab. To see into the interior of the solid, we show only those atoms that have potential energy greater than or equal to −6.1, where the ideal bulk value is −6.3. This trick was used very effectively in our earlier studies using a single crack for displaying dislocations, microcracks, and other imperfections in crystal packing. This reduces the number of atoms seen by approximately 2 orders of magnitude in three dimensions; the visible atoms are associated with faces of the slab and initial notch, surfaces created by crack motion, local interplanar separation associated with the material's dynamic failure at the tip, and topological defects created in the otherwise perfect crystal. Because of periodic boundary conditions, all vertical faces are not exterior surfaces and are therefore transparent.
The Computer Experiments Results and Discussion.
A movie of the work-hardening simulation may be viewed and downloaded from the following web address: http://www.almaden.ibm.com/st/Simulate/.
We encourage the reader to view this movie in conjunction with the reading of this section because “a picture is worth a thousand words and the movie is worth at least a thousand pictures.” We should keep in mind that the movie and Figs. 1–4 show only atoms with the potential energy filtering, resulting in the selected visualization of atoms neighboring surfaces and dislocations. Why do dislocations appear? As mentioned earlier, a dislocation can be viewed much like a ripple in a rug that is being moved across a floor. In our case, the ripple is only a few atomic spacings in width, and at any instant in time those atoms associated with the ripple are distorted from their lowest energy lattice site. The distortion and associated energy increase are sufficient to be captured by the energy filtering.
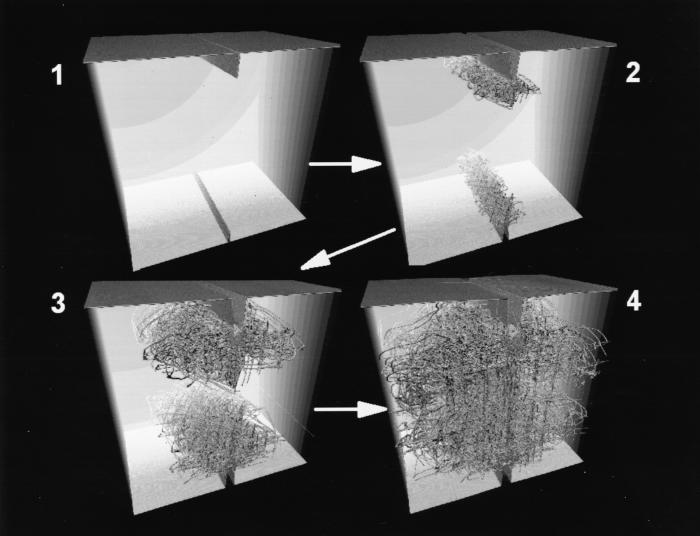
Figure 1.
Early-time sequence of the propagating dislocations is shown growing as partial landscapes and the subsequent collision of the dislocations from the opposing notches. The reduced times in a clockwise sequence are 0, 22.5, 45 and 67.5 (reduced time units). Only atoms with a potential energy less than 97% of the bulk value are displayed, resulting in the selected visualization of atoms neighboring surfaces and dislocations.
Figure 4.
Magnified view of the rigid junction network at a reduced time of 900.
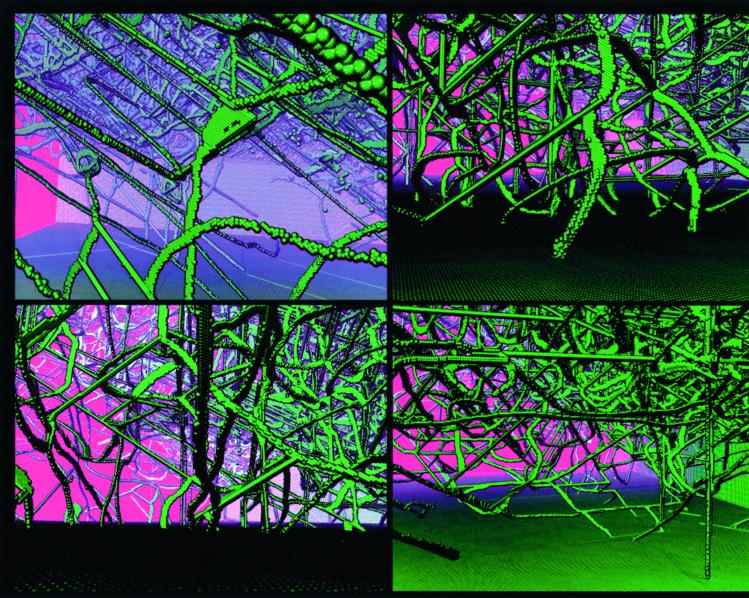
In Fig. 1, we present a temporal sequence of snapshot pictures for the early time evolution of the dislocations dynamics. From two virgin cracks, we see a spaghetti-like network of atomic strings flying from the vertices of the two opposing crack edges. This is simply a large number of mobile dislocations being created at each crack edge, rapidly flowing through the stretched solid in a wiggly manner, and eventually colliding with intersecting dislocations from the opposite edge. For the simple FCC solid, dislocations are easily created at the apex of the two micocracks where the stress is maximum and easily flows through the solid, giving rise to the ductility of the solid. Because the stacking fault energy for our model potential is zero, the mobile wiggly dislocations are a particular kind, called a partial. The simulation supports our early assertion that creation of vast amounts of dislocations can occur at severe stress concentrations, such as at crack tips. This enables a stressed solid to be rapidly filled with dislocations, which gives rise to material deformation under a steady load. Zooming into subvolumes of the “transparent solid” in Fig. 2 yields magnified views of the local dynamical topology of the dislocations that is evolving during the work-hardening process. Colliding dislocations can cause permanent atomic relocation along a line, called a rigid junction or sessile dislocation. These sessile dislocations are quite apparent in these pictures as being very straight in comparison to the wiggly, mobile partial dislocations.
Figure 2.
Close-up snapshots of the propagating dislocations and rigid junctions evolving into a complex topology of the defect-solid landscape. The time interval in the dynamics is 290 to 430 (reduced time units).
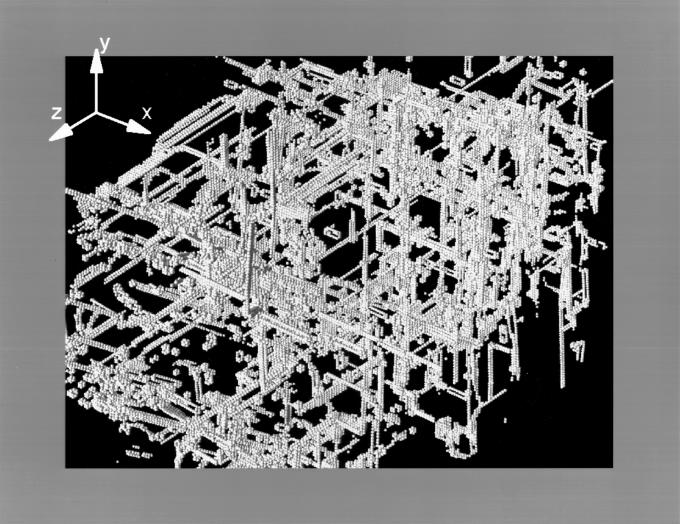
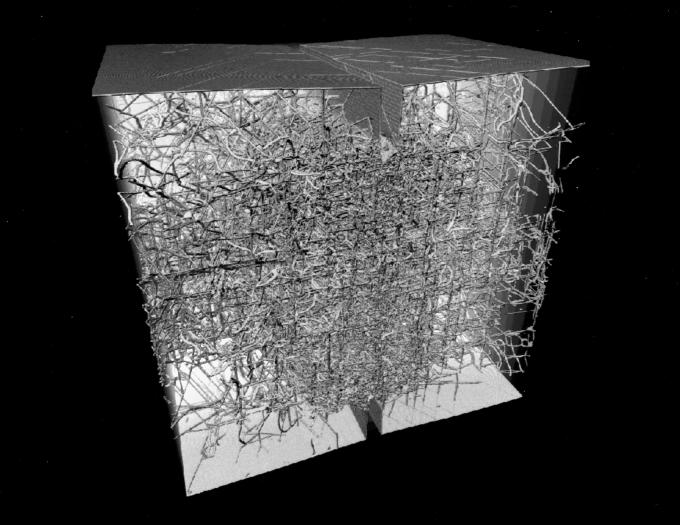
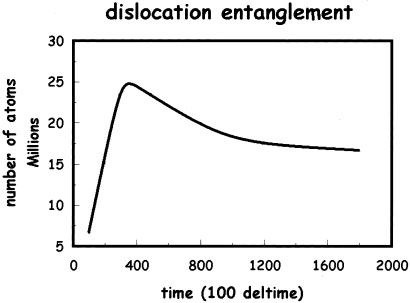
In Fig. 3, we present a late-time snapshot of the dislocation distribution in the billion atom slab. A coarse grain cubical skeleton of rigid junctions (sessile dislocations) becomes apparent from a distant view. In Fig. 4, we present a magnified view of the rigid junction network for a small interior section of the solid. A detailed analysis of the sessile network is in progress (Maria Bartelt and James S. Stolken, personal communication; a preliminary analysis suggests the following sessile structures. In the 110 directions, two partials on {111} planes interact to form a Lomer Lock. In the 001 direction the Lomer locks react to form a Hirth lock). These rigid junctions are obstacles to further dislocation mobility. If the junction density is sufficiently high, dislocation mobility becomes insignificant, and ductility of the solid ceases. The solid no longer can bend through dislocation motion. The ductile solid becomes brittle through this work-hardening process. In Fig. 5, the total number of atoms associated with dislocation of all types is plotted versus time. The number grows rapidly, reaches a peak, and eventually relaxes to constant nonzero value. This represents the creation of partial dislocations from the two crack edges and their eventual conversion to a smaller total line length of sessile dislocations resulting in work-hardening.
Figure 3.
Late-time snapshot picture of the dislocation network of the billion atom slab. A coarse grain cubical skeleton of rigid junctions (sessile dislocations) becomes apparent from a distant view. The reduced time is 700.
Figure 5.
The total number of atoms associated with dislocations of all types is plotted versus time (in units of 100 time steps equal to 0.045 reduced time units).
The mechanisms giving rise to work-hardening are very apparent from the atomistic simulation of the phenomenon. We reiterate that while a general understanding has been known for quite some time, it is presently impossible to observe the rich microscopic details of the many-body dislocation dynamics in the laboratory. Teraflop computing makes this a reality. We must keep in mind that this present atomistic simulation of work-hardening is just a beginning. We have given a very qualitative description of the dynamics, and much needs to be accomplished before a detailed understanding is achieved. Many such simulations using a variety of model configurations, interatomic potentials, and clever analysis schemes are required. Our solid was composed of a little more than one billion atoms, a significant level of achievement in atom system size. However, this still represents a very small solid, only 0.3 microns on a side. Also, the dynamical time span is on the order of a few nanoseconds, enough time for the phenomenon to achieve a final structure state for our size solid cube. With the near-future petaflop computers, μm-size solids simulated for microseconds will become a possibility.
Our present simulation of ductile failure and work-hardening in crystal samples approaching μm-size scale has significance in helping the development of continuum theories for plastic deformation in small structures. Recent studies (13, 14) have shown that materials display strong size effects when the characteristic length scale associated with nonuniform plastic deformation is on the order of microns. The classical plasticity theories cannot predict this size dependence of material behavior at the μm scale because their constitutive models possess no internal length scale. As a result, intensive efforts are currently being made on developing strain gradient plasticity theories (13, 14) that contain an intrinsic material length in their constitutive equations. One bottleneck in this field of research is that it is generally very difficult to conduct experiments at μm scales. So far only a few experiments including microtorsion, microbending, and microindentation have been developed. These experiments are not enough to distinguish among several plausible gradient theories that have been proposed in the literature. It is now possible to use molecular dynamics simulations, such as those presented in this article, to “design” and perform mechanical tests that complement laboratory experiments. We have demonstrated that with today's powerful computers it has become a reality to perform molecular dynamics calculations on material samples approaching μm size scale. Such computer experiments on mechanical properties of materials will surely play a more important role in micro- and nano-technologies.
Acknowledgments
F.F.A. acknowledges the essential contributions of Brian Wirth and the Lawrence Livermore National Laboratory Accelerated Strategic Computing Initiative (ASCI) White team under the guidance of Steve Louis and Terry Heidelberg. F.F.A. is indebted to Charles Rettner at the IBM Almaden Research Center for creating the web pages related to this paper. The work of H.G. is supported by National Science Foundation Grant CMS-9820988 and the Max Planck Society.
Abbreviation
- FCC
face-centered-cubic
References
- 1.Gordon J E. The New Science of Strong Materials or Why You Don't Fall Though the Floor. Princeton: Princeton Univ. Press; 1988. [Google Scholar]
- 2.Abraham F F, Walkup R, Gao H, Duchaineau M, De La Rubia T D, Seager M. Proc Natl Acad Sci USA. 2002;99:5777–5782. doi: 10.1073/pnas.062012699. [DOI] [PMC free article] [PubMed] [Google Scholar]
- 3.Allen M P, Tildesley D J. Computer Simulation of Liquids. Oxford: Clarendon; 1987. [Google Scholar]
- 4.Bulatov V, Abraham F F, Kubin L, Yip S. Nature (London) 1998;391:669–672. [Google Scholar]
- 5.Cottrell A H. The Mechanical Properties of Matter. New York: Wiley; 1964. p. 284. [Google Scholar]
- 6.Abraham F F. Phys Rev Lett. 1996;77:869–872. doi: 10.1103/PhysRevLett.77.869. [DOI] [PubMed] [Google Scholar]
- 7.Abraham F F, Schneider D, Land B, Lifka D, Skovira J, Gerner J, Rosenkrantz M. J Mech Phys Solids. 1997;45:1461–1471. [Google Scholar]
- 8.Schonfelder B, Wolf D, Phillpot S, Furtkamp M. Interface Sci. 1997;5:245–262. [Google Scholar]
- 9.Cleri F, Yip S, Wolf D, Phillpot S. Phys Rev Lett. 1997;79:1309–1312. [Google Scholar]
- 10.Cleri F, Phillpot S, Wolf D. Interface Sci. 1999;7:45–55. [Google Scholar]
- 11.Wolf D, Merkle K. In: Materials Interfaces. Wolf D, Yip S, editors. London: Chapman & Hall; 1992. pp. 87–150. [Google Scholar]
- 12.Zimmerman J A, Gao H, Abraham F F. Modeling Simulation Mat Sci. 2000;8:103–115. [Google Scholar]
- 13.Fleck N A, Hutchinson J W. J Mech Phys Solids. 1993;41:1825–1857. [Google Scholar]
- 14.Gao H, Huang Y, Nix W D, Hutchinson J W. J Mech Phys Solids. 1999;47:1239–1263. [Google Scholar]


