Abstract
The main advantage of confocal microscopes over their conventional counterparts is their ability to optically “section” thick specimens; the thin image slices thus obtained can be used to reconstruct three-dimensional images, a capability which is particularly useful in biological applications. However, it is well known that the resolution and optical sectioning ability can be severely degraded by system or specimen-induced aberrations. The use of high aperture lenses further exacerbates the problem. Moreover, aberrations can considerably reduce the number of photons that reach the detector, leading to lower contrast. It is rather unfortunate, therefore, that in practical microscopy, aberration-free confocal imaging is rarely achieved. Adaptive optics systems, which have been used widely to correct aberrations in astronomy, offer a solution here but also present new challenges. The optical system and the source of aberrations in a confocal microscope are considerably different and require a novel approach to wavefront sensing. This method, based upon direct measurement of Zernike aberration modes, also exhibits an axial selectivity similar to that of a confocal microscope. We demonstrate an adaptive confocal fluorescence microscope incorporating this modal sensor together with a deformable membrane mirror for aberration correction. Aberration corrected images of biological specimens show considerable improvement in contrast and apparent restoration of axial resolution.
In a confocal fluorescence microscope, light from a laser is focused by an objective lens into the specimen, where it excites fluorophores that either may be a natural part of the specimen or deliberately introduced as a contrast mechanism (1, 2). This excitation occurs not only in the focal region but also throughout the illumination cone. The fluorescent emission is then collected by the same objective lens, which forms part of an optical system that images the focal spot onto a pinhole detector. The role of the pinhole is to obscure fluorescent light emitted from outside of the focal region—this ability is the origin of the confocal microscope's axial sectioning ability and the reason for its superior contrast in comparison with conventional fluorescence microscopes. The image is constructed by scanning the specimen in three-dimensions relative to the focal spot. The effects of aberrations on the imaging quality of confocal microscopes have been extensively investigated (3–6), because they fundamentally limit the final image resolution and signal level. This fact may be understood by considering an object point located at a certain depth below the surface of the specimen. Fluorescence must first be excited at this point by a well focused diffraction-limited spot of light. It is then necessary to reimage the excited volume back through the specimen and the rest of the optical system to the detection pinhole. Any imperfections, however introduced, will cause spreading of the focused spot and will inevitably lead to a reduction in signal level as well as impaired imaging. One of the major sources of imperfection is that of specimen-induced spherical aberration. This aberration occurs when focusing through an interface between materials of different refractive index. Such refractive index mismatches occur, for example, between the immersion medium, the coverglass, and the specimen. The specimen may introduce further aberrations if it consists of regions of differing refractive index. In general, aberrations cause a reduction in lateral resolution and, more significantly, degrade the axial resolution and cause a fall in signal intensity. As the aberrations increase, for example, when focusing deeper into a specimen, the image contrast rapidly deteriorates. The specimen itself can therefore limit the useful focusing depth. Despite the practical limitations they have presented, specimen-induced aberrations have long been recognized as a problem, but there have been relatively few attempts to overcome their deleterious effects. Some static aberration correction methods have been proposed (7–10), but these can provide only a partial solution, because each specimen introduces different aberrations into the optical system. Alternatively, one could use image deconvolution methods that take account of variations in specimen-induced aberrations, although these techniques can be computationally very intensive (11). The techniques of adaptive optics, however, offer a versatile solution because they are able to adjust optically the correction required for different specimens and even for different parts of the same specimen.
Adaptive optics systems have been widely used in astronomy to measure and correct the aberrations caused by atmospheric turbulence (12). However, the origin and nature of the aberrations that deteriorate telescope images are quite different to those encountered in confocal microscopy and present fresh challenges when designing an adaptive optics system. Existing sensing methods, such as Shack-Hartmann or curvature sensors, relied upon the subdivision of the aperture into numerous zones (12). In each zone, a local property of the wavefront, such as the gradient or Laplacian, would be measured and the overall wavefront shape would be inferred from this information. Mathematically, an aberrated wavefront can be conveniently described as a series of Zernike polynomials, a set of orthogonal polynomials defined over the unit circle (13). In microscopy, specimen-induced aberrations tend to be dominated by a small number of low-order Zernike aberration modes (6) and, hence, wavefront sensing by direct measurement of these modes would be ideal in an adaptive microscope.
It was previously considered difficult if not impossible to measure aberration modes directly (14). However, we have developed a method which does exactly that (15). Positive and negative bias aberrations (equal but opposite amounts of the Zernike mode Zi we wish to measure) are deliberately added to the input wavefront. When focused by a lens, the positively and negatively biased wavefronts result in two focal spots whose peak intensities differ. These two intensities are easily measured by placing a pinhole detector at the center of the focus. The output signal of the sensor, defined as the difference between these two measured intensities, is found to be proportional within a certain range to the amount of the aberration mode in the input wavefront. This sensor is, therefore, ideal for use in a closed-loop adaptive system. A number of modes could be measured by the sequential application of relevant bias aberrations by using an adaptive element, such as a deformable mirror. Alternatively, one could use a binary-phase optical element to allow simultaneous, spatially multiplexed measurement of the modes (16).
We have developed the wavefront sensor concept further for implementation in a confocal microscope. In this case, the focal spot itself acts as the source of the measured wavefronts in an analogous manner to the artificial guide-star method in astronomical adaptive optics (17). In a confocal microscope, the illumination and emission light follow reciprocal optical paths and, hence, pass through the same aberrating medium. Therefore, it is necessary to perform aberration correction in both paths, which is conveniently implemented by using a single adaptive element through which both the illumination and emission light pass. For simplicity, this element can be the same adaptive element that applies the bias aberrations. The operation of the sensor in a confocal fluorescence microscope can be outlined mathematically as follows. Imagine we wish to measure the Zernike mode Zi. As already mentioned, the output signal of an aberration mode sensor is taken as the difference between the two signals obtained at the pinhole detector with the positive bias aberration applied first and the negative bias aberration applied second. These two signals are referred to as W1 and W2, respectively, and the output signal is given by
 |
If we approximate the specimen as a fluorescent sheet object lying perpendicular to the optic axis, then the detected signals can be calculated as:
 |
where ⊗ is the correlation operator, v and φ are normalized polar coordinates in the focal plane (1), vp is the detector pinhole radius, and H represents the intensity point spread function (PSF) of the optics, including the objective and the aberrations introduced by the specimen and the adaptive element. Here, we have made the approximation that the excitation and emission wavelengths are identical, and the coordinates are referred to the object space. If we consider further that an “input aberration” aZi(r,θ) is introduced by the specimen, the PSF is given by
 |
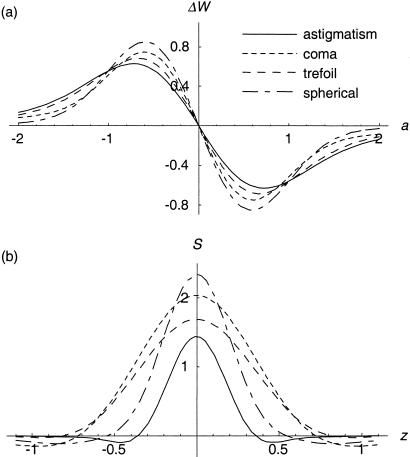
where F is the Fourier transform operator, j is the imaginary unit, r and θ are normalized polar coordinates in the pupil plane, and b is the amplitude of the bias aberration added by the adaptive element. The normalized axial coordinate u describes the displacement of the fluorescent sheet object from the focal plane (1). First, we consider the response of the sensor when the object lies in the focal plane (u = 0). Fig. 1a shows the output response of several aberration mode sensors as a function of the input amplitude a. Each sensor shows linear response to its design mode in the region about a = 0 and is, therefore, well suited to use in a closed-loop adaptive system where iterative measurement and correction of each mode gives rapid convergence to the optimum aberration correction (16).
Figure 1.
Characteristics of the modal wavefront sensor. (a) The output signal of the sensor is shown as a function of the amplitude a of the input mode for the primary Zernike aberration modes astigmatism (index i = 5,6), coma (i = 7,8), trefoil (i = 9,10) and spherical (i = 11). The specimen was modeled as a fluorescent sheet in the focal plane, the bias amplitude b was set as 0.5, and the pinhole radius was 80% of the radius of the Airy disk. Each curve is linear in a region about a = 0. (b) The sensitivity is shown of each sensor S when the fluorescent sheet is situated a distance of z μm from the focal plane. This distance was calculated for the properties of the objective lens and illumination wavelength used in the experimental work. Each sensor shows good rejection of out-of-focus fluorescence.
The sensor implementation presented here is convenient for confocal microscopy because the microscope's pinhole detector also functions as the wavefront sensor pinhole. In fact, one major advantage of this sensor in adaptive confocal microscopy arises from its use of a detector pinhole. The sensor, like the confocal microscope, exhibits inherent axial selectivity: it only responds to light emanating from the focal plane. If we define the sensitivity S of the sensor as the gradient of the response curve at the origin, i.e.,
 |
we can plot S as a function of the axial displacement of the fluorescent plane to examine the axial selectivity of the sensor (see Fig. 1b). It can be seen that the sensors only respond to the fluorescent sheet object when it is close to the focal plane. We can infer from this result that, even if the specimen contains fluorescent material throughout its volume, the sensors will only respond to the light emitted in the focal region. Conventional sensors, which have no means of obscuring out-of-focus light, would be swamped by fluorescence from throughout the illumination cone. They are, therefore, of limited use in this application.
We describe here an adaptive confocal fluorescence microscope incorporating this modal wavefront sensor. This simple implementation involves little more than the inclusion of an adaptive correction element in standard confocal microscope hardware. For the purposes of aberration correction and the application of the bias aberrations, we elected to use a membrane mirror (OKO Technologies, Delft, The Netherlands) that consisted of an aluminized silicon nitride membrane positioned above an electrode structure of 37 hexagonal electrodes (18, 19). The shape of the membrane mirror is controlled by the application of voltages to the electrode structure. To allow deflection of the mirror surface both toward and away from the electrodes, a constant bias voltage is applied to the electrodes, thus deforming the mirror surface to approximately half of its maximum deflection. The resulting mirror curvature is simply compensated for by the introduction of a small amount of defocus to the incoming wavefronts by axially displacing the preceding lens. To a reasonable approximation, the local deflection of the surface depends quadratically upon the applied voltage; so, for linearity, we use control signals, represented by the vector cn, which are proportional to the square of each electrode voltage. The mirror control signals ζi that generate a unit amount of each Zernike mode Zi were determined experimentally.
Aberration measurement and correction proceeded as follows. First, a preset positive bias aberration, bZi, was introduced by the mirror. The bias amplitude, b, can be chosen by the user, for example, to maximize the sensitivity S. An image scan was taken and all of its pixel values were summed and averaged to give the value of W1. The equivalent negative bias aberration, −bZi, was then added to the mirror, a second scan was taken, and the pixel average, W2, was calculated. It was shown before that the value of the difference signal, ΔW = W1-W2, is approximately proportional to the amount of the Zernike mode Zi present. Here, ΔW was derived from frame averages and was, therefore, equivalent to the average of the difference signal measured at each individual pixel. Hence, we measured only the frame-independent component of the induced aberrations. The updated mirror control signals, cn+1, after correction of the mode, Zi, were then found by calculating
 |
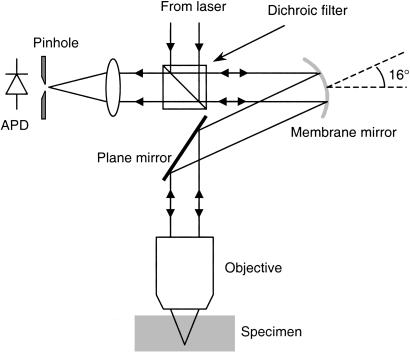
where γ is the gain, a parameter chosen by the user to control the convergence rate. These updated control signals were applied to the mirror and used as the new datum for correction of the next Zernike mode. The different modes were corrected sequentially. A single correction sequence through the Zernike modes of interest was sometimes sufficient. A further sequence of mode measurements and corrections was performed when necessary to obtain full aberration correction. This method has the inherent advantage that uncertainties in the behavior of the mirror, in terms of the relationship between the mirror shape and the applied voltages, are automatically compensated for by the closed-loop nature of the correction scheme. The experimental set-up is shown in Fig. 2.
Figure 2.
The experimental set-up. A beam from a frequency-doubled Nd:YAG laser (wavelength 532 nm) was passed through a beam expander; it then entered a filter block designed to reflect the shorter wavelength illumination light while passing the longer wavelength fluorescence light. The illumination beam was reflected by the membrane mirror such that the angle between the incident and reflected beams was 16°. The wavefront incident on the mirror was slightly diverging to compensate for the curvature of the mirror. The illumination beam then passed via a plane mirror and relay lenses (not shown) into the objective lens focusing the light into the specimen. The specimen was mounted on a scanning stage to facilitate three-dimensional scanning. Fluorescence light from the specimen was collected by the same objective and followed a reciprocal path, through the membrane mirror, and then was transmitted through the filter block. The light was focused through a pinhole onto an avalanche photodiode (APD). In this configuration, the membrane mirror can compensate for aberrations introduced into both the illumination and emission optical paths.
We investigated the effects of aberration correction on the PSF of the confocal microscope by measuring the axial intensity distribution of images of 200-nm diameter fluorescently labeled polystyrene beads (F-8887, Molecular Probes). The objective lens used was an Olympus 60× U-PlanApo water-immersion lens (1.2 N.A.) with a coverglass correction collar that was set to the nominal coverglass thickness of 170 μm. Correction was performed for seven low-order Zernike modes (two orthogonal modes each of astigmatism, coma, and trefoil, in addition to one mode of spherical aberration). After aberration correction, the PSF was found to be shorter by a factor of 1.8. This reduction in the axial extent of the PSF corresponds to a restoration of the axial sectioning ability of the confocal microscope. Naturally, the degree of correction required, and hence the degradation and restoration of the axial resolution, depends to an extent upon the nature of each individual specimen.
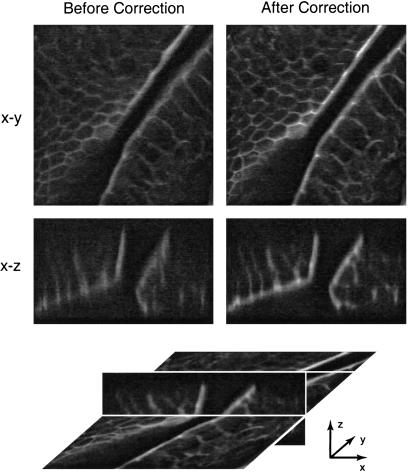
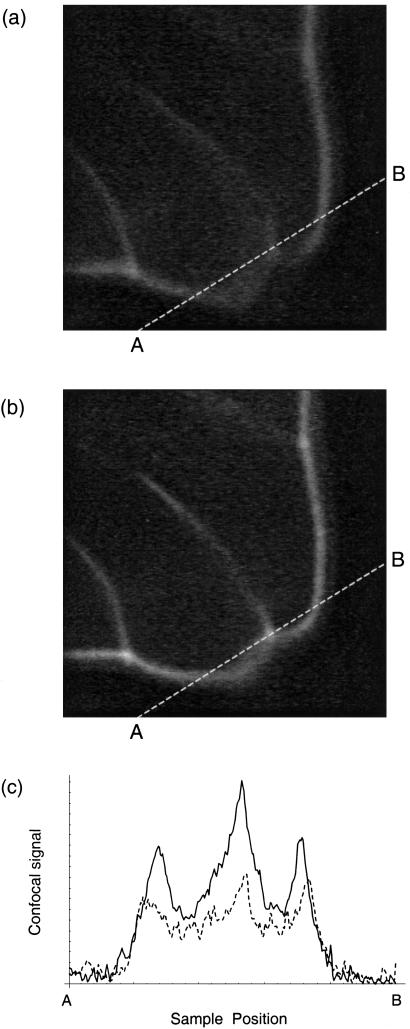
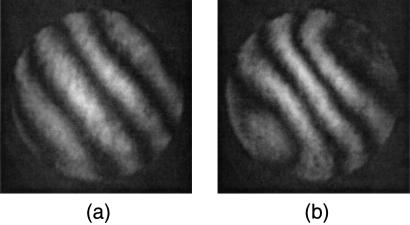
The abilities of the adaptive system in imaging biological specimens were investigated. We selected a section of mouse intestine stained with Alexa Fluor 568 phalloidin fluorescent dye (Molecular Probes). The correction collar on the objective lens was set manually to provide optimum correction of the spherical aberration. A region of the specimen was selected and correction was carried out for the same seven Zernike modes. Two correction cycles were necessary, a total of 28 scans. During the correction cycle, the laser power was reduced to minimize the effects of photobleaching. Scans of the specimen in the x-y and x-z planes were then taken with and without the correction applied. These are shown in Fig. 3. The corrected x-y image shows improved contrast and is sharper than the uncorrected image. This improvement is a consequence of the reduced axial extent of the PSF which leads to greater discrimination between adjacent planes in the specimen. The aberrated PSF is elongated and has the same effect as averaging over several axially displaced confocal x-y scans. The resolution in the x-z images is improved owing to the better axial discrimination obtained when the correction is applied. Fig. 4 shows confocal x-y scans from a different location in the mouse intestine specimen at a higher magnification. Again, we see better distinction of features in the aberration corrected image because of the reduced axial extent of the PSF and improved contrast. This improvement is most noticeable where the cell walls, which are not perpendicular to the image plane, appear blurred in the uncorrected image and distinct in the corrected image. To illustrate the improvement of image contrast in this particular case we chose to examine a sampled line between the points marked A and B in both images. These results are shown in Fig. 4c. We also note the apparent shift in the locations of the peaks in this figure which, again, can be attributed to the averaging effect of the aberrated PSF. An interferometer built into the experimental system allowed visualization of the mirror surface deformation and, hence, the aberration correction applied. The resulting interferograms taken in a plane conjugate to the pupil plane of the objective are shown in Fig. 5.
Figure 3.
Confocal microscope scans before and after aberration correction. x-y (lateral) and x-z (axial) scans of a fluorescently labeled section of mouse intestine specimen are shown. The schematic beneath illustrates the relative three-dimensional orientation of the x-y and x-z scans. The image dimensions in the x and y directions are 80 μm; the z dimension is 15 μm.
Figure 4.
Confocal x-y scans of the fluorescently labeled mouse intestine before correction (a) and after correction (b). The image dimensions in the x and y directions are 20 μm. Both images were sampled with a bilinear interpolation method at 250 sample points along the line marked AB. The results are illustrated in c, where the dashed line corresponds to the uncorrected image (a), and the solid line corresponds to the corrected image (b).
Figure 5.
Interferograms of the wavefronts produced by the membrane mirror before aberration correction (a) and after aberration correction (b). Additional wavefront tilt has been introduced into the reference beam to aid visualization of the wavefront aberration. These interferograms correspond to the mirror deformation used during the scans in Fig. 3 a and b, respectively. The wavefront in b compensates for aberrations induced by the optical system including the specimen. The actual induced aberration could be larger than that inferred by the interferogram because the built-in coverglass correction of the lens provides partial correction of spherical aberration.
We have demonstrated the first implementation of an adaptive confocal microscope. Central to this system was a modal wavefront-sensing method which, like a confocal microscope, only responds to light from the focal region. A single deformable membrane mirror provided aberration correction in both the illumination and collection paths of the microscope and, additionally, functioned as the wavefront sensor-biasing element. The aberration corrected images obtained with the microscope show enhanced contrast and improvement in axial resolution. This implementation, which simply requires the addition of a deformable mirror to standard microscope hardware, could be widely beneficial in confocal and multiphoton microscopes (20) that often suffer from the detrimental effects of system and specimen-induced aberrations. Because the demonstrated correction scheme uses frame averages, we naturally measured and corrected field-independent aberrations. In many biological specimens, aberrations also could arise from local variations in refractive index close to the focal plane and, hence, the induced aberrations would differ at various points in the image. Further advances could involve aberration measurement in smaller regions, perhaps pixel by pixel, and adaptive adjustment of the correction element during the scan. This refinement would require a more rapid method of aberration measurement, for example, by simultaneous measurement of the Zernike modes that use the multiplexed method we described (15, 16).
Table 1.
Zernike polynomials used in this paper
| Zernike mode | Type | Form |
|---|---|---|
| Z5 | Astigmatism | 2 r2cos(2θ) r2cos(2θ) |
| Z6 | Astigmatism | 2 r2sin(2θ) r2sin(2θ) |
| Z7 | Coma | 2 (3r3 − 2r)cos(θ) (3r3 − 2r)cos(θ) |
| Z8 | Coma | 2 (3r3 − 2r)sin(θ) (3r3 − 2r)sin(θ) |
| Z9 | Trefoil | 2 r3cos(3θ) r3cos(3θ) |
| Z10 | Trefoil | 2 r3sin(3θ) r3sin(3θ) |
| Z11 | Spherical (1st) |
 (6r4 − 6r2 + 1) (6r4 − 6r2 + 1) |
The definition of the Zernike polynomials and the indexing scheme are explained in ref. 15.
Acknowledgments
This work was supported by the Biotechnology and Biological Sciences Research Council, United Kingdom.
Abbreviation
- PSF
point spread function
Footnotes
This paper was submitted directly (Track II) to the PNAS office.
References
- 1.Wilson T, editor. Confocal Microscopy. London: Academic; 1990. [Google Scholar]
- 2.Pawley J B, editor. Handbook of Biological Confocal Microscopy. New York: Plenum; 1995. [Google Scholar]
- 3.Gibson S F, Lanni F. J Opt Soc Am A. 1991;8:1601–1613. [Google Scholar]
- 4.Hell S W, Reiner G, Cremer C, Stelzer E H K. J Microsc (Oxford) 1993;169:391–405. [Google Scholar]
- 5.Török P, Hewlett S J, Varga P. J Microsc (Oxford) 1997;187:158–172. [Google Scholar]
- 6.Booth M J, Neil M A A, Wilson T. J Microsc (Oxford) 1998;192:90–98. [Google Scholar]
- 7.Sheppard C J R, Gu M. Opt Commun. 1991;88:180–190. [Google Scholar]
- 8.Sieracki C K, Levey C G, Hansen E W. Opt Lett. 1995;20:1213–1215. doi: 10.1364/ol.20.001213. [DOI] [PubMed] [Google Scholar]
- 9.Wan D S, Rajadhyaksha M, Webb R H. J Microsc. 2000;40:274–284. doi: 10.1046/j.1365-2818.2000.00635.x. [DOI] [PubMed] [Google Scholar]
- 10.Booth M J, Wilson T. J Microsc. 2000;200:68–74. doi: 10.1046/j.1365-2818.2000.00735.x. [DOI] [PubMed] [Google Scholar]
- 11.Kam Z, Hanser B, Gustafsson M G L, Agard D A, Sedat J W. Proc Natl Acad Sci USA. 2001;98:3790–3795. doi: 10.1073/pnas.071275698. [DOI] [PMC free article] [PubMed] [Google Scholar]
- 12.Hardy J W. Adaptive Optics for Astronomical Telescopes. Oxford: Oxford Univ. Press; 1998. [Google Scholar]
- 13.Born M, Wolf E. Principles of Optics. Oxford: Pergamon; 1975. [Google Scholar]
- 14.Tyson R K. Principles of Adaptive Optics. London: Academic; 1991. [Google Scholar]
- 15.Neil M A A, Booth M J, Wilson T. J Opt Soc Am. 2000;17:1098–1107. doi: 10.1364/josaa.17.001098. [DOI] [PubMed] [Google Scholar]
- 16.Neil M A A, Booth M J, Wilson T. Opt Lett. 2000;25:1083–1085. doi: 10.1364/ol.25.001083. [DOI] [PubMed] [Google Scholar]
- 17.Primmerman C A, Murphy D V, Page D A, Zollars B G, Barclay H T. Nature (London) 1991;353:141–143. [Google Scholar]
- 18.Vdovin G V, Sarro P M, Middelhoek S. J Micromech Microeng. 1999;9:R8–R20. [Google Scholar]
- 19.Zhu L, Sun P C, Bartsch D U, Freeman W R, Fainman Y. Appl Opt. 1999;38:6019–6026. doi: 10.1364/ao.38.006019. [DOI] [PubMed] [Google Scholar]
- 20.Denk W, Strickler J H, Webb W W. Science. 1990;248:73–76. doi: 10.1126/science.2321027. [DOI] [PubMed] [Google Scholar]


