

Abstract
The design of insider threat detection models utilizing neural networks significantly improve its performance and ensures the precise identification of security breaches within network infrastructure. However, developing insider threat detection models involves substantial challenges in addressing the class imbalance problem, which deteriorates the detection performance in high-dimensional data. Thus, this article presents a novel approach called Hybrid Optimized Generative Pretrained Neural Network based Insider Threat Detection (HOGPNN-ITD). The proposed approach is composed of an Adabelief Wasserstein Generative Adversarial Network (ABWGAN) with Expected Hypervolume Improvement (EHI) of hyperparameter optimization for adversarial sample generation and an L2-Starting Point (L2-SP) regularized pretrained Attention Graph Convolutional Network (AGCN) to detect insiders in the network infrastructure. The structure of the proposed approach involves three phases: (1) Chebyshev Graph Laplacian Eigenmaps solver (CGLE) for selecting the user-designated samples by reducing the dimensionality of the data and Insider State clustering via Density-Based Spatial Clustering of Applications with Noise (IS-DBSCAN) (2) The EHI of multi-objective Bayesian optimization for optimizing the sensitive learning rate hyperparameter to ensure the stability of the Adabelief optimized WGAN and improve the quality of the generated adversarial samples. (3) The L2-SP regularization technique effectively fine-tunes the pretrained AGCN, which identifies the user behavioural pattern to detect the insiders. Thus, the performance of the proposed approach was examined using the benchmark insider threat dataset. The experimentation of the proposed approach ensures the detection of the skeptical behaviour of the insider with a high detection rate and minimal false alarm rate.
Keywords: Generated adversaries, Chebyshev solvers, Pretrained model, Regularization, Hyperparameter optimization, Insider threat detection
Subject terms: Computer science, Information technology
Introduction
In network infrastructure, cyberattacks are malicious actions that initiate from agitating services to theft the confidential data and frequent vulnerability exploits. It aims to affect the confidentiality, integrity, and authentication (CIA) factors of the entire digital network infrastructure of organizations1. Recently, most network systems have been affected by internal attacks, known as insider threats, which exist because of the abnormal activities of individuals, increasing vulnerability across global organizations2. The major insider threat instances affecting the network system are data exfiltration by a former employee, selling the organization’s confidential data for personal financial needs, sabotaging company data, and leaking client data3. The 2024 insider threat report4 reveals that 76% of organizations are affected by insider attacks, which is 20% of the increase reported in 20195. Based on this current report4, cybersecurity researchers have ensured that 90% of organizations face high risk in the detection and mitigation of insider threats.
The high risk of insider threat detection (ITD) is solved by employing various types of ITD approaches, such as anomaly-based, physiological-based, role-based, and scenario-based. Among these approaches, the most commonly used ITD approach is anomaly-based, where users abnormal behaviour activities are highly symbolized threats. In reality, an ITD uses an organization’s employee activity and threat vigilance to detect the primary activity of insiders6. However, the existing traditional ITD7 approaches have less adaptability and low flexibility in analysing the pattern of recent insider threats and lack of knowledge to identify the emerging forms of threats8. To address the complexities of the ITD approaches, deep learning-based ITD approaches are designed to improve the detection rate with minimal time consumption and ensure viability in defending network security9. However, the available insider threat benchmark dataset from Carnegie Mellon University’s Computer Emergency Response Team (CMU CERT) for ITD10 is high dimensional and multimodal data that has a skewed class distribution, which leads to class imbalance problems while training with neural network models.
To discourse the aforementioned issue, this article presents a novel Hybrid Optimized Generative Pretrained Neural Network-based Insider Threat Detection (HOGPNN-ITD) approach. To formulate the importance of the research problem presented in this work: the following set of research critics was framed to claim the significance of the HOGPNN-ITD approach.
RC1: How does the Chebyshev Graph Laplacian Eigenmaps (CGLE) solver can select the user designated samples with improved computational efficiency for insider detection within the network infrastructure?
RC2: Does the incorporation of the density-based spatial clustering of applications with noise (DBSCAN) algorithm enhance the identification of specific, crucial patterns of insider behaviour within clustered samples? “If yes, how?
RC3: Describe the workflow of integrating CGLE solver with the DBSCAN algorithm, and explain the impact of this model on preserving the structural integrity of data.
RC4: How does the proposed optimized generative model determine the generated adversarial samples exhibit improved quality, stability, and robustness against class imbalance problems?
RC5: Does the proposed regularized pretrained model effectively identify the insiders behavioural patterns and classify users as insiders or non-insiders?
RC6: Compute the latency test on existing CMU CERT log data and edge devices to ensure the practicality of real-world deployment.
Through intuitions of the research problem and accurately defined necessities for the design of an effective insider threat detection approach, the main contributions of this research work are highlighted as follows.
The Chebyshev graph Laplacian eigenmaps solver (CGLE) is used as a dimensionality reduction technique to extract the time-aggregated user-designated samples with improved computational complexity, increasing the ITD approach’s performance.
Insider state clustering via density-based spatial clustering of applications with noise (IS-DBSCAN) is employed to cluster three different insider states in time-aggregated user-designated samples that preserve the original structure of the dataset with improved cluster quality and robustness.
The optimized generative model “Adabelief Wasserstein generative adversarial network hybridized with expected hypervolume improvement (ABWGAN-EHI)” is used to generate the minority insider samples.
Expected hypervolume improvement (EHI) is a multi-objective Bayesian optimization for optimizing the sensitive learning rate hyperparameter of the Adabelief optimized WGAN to ensure stability and improve the quality and diversity of generated adversarial samples.
A pretrained attention graph convolutional network (AGCN) with the L2-Starting Point (L2-SP) regularization technique solves the overfitting and catastrophic forgetting problem and improves generalization without information loss by reducing the irrelevant features with high convergence speed
An L2-SP regularized pretrained AGCN is used to identify the user behavioural patterns to detect the insiders with high detection rates and minimal false alarm rates
The rest of the article is structured as follows: Sect. 2 presents the various studies that identify and detect insiders using machine learning and deep learning models. Section 3 presents insights into the Chebyshev graph Laplacian eigenmaps solver (CGLE), the Adabelief WGAN with expected hypervolume improvement (ABWGAN-EHI), and the (L2-SP) regularized pretrained AGCN. Section 4 provides a comprehensive description of the proposed HOGPNN-ITD approach. Section 5 provides exhaustive experimentation and ensures the supremacy of the HOGPNN-ITD approach over different existing approaches. Section "The rescaled Laplacian matrix based on the Chebyshev polynomial given in Eq. (1)" concludes the paper with future research directions.
Related works
This section discusses the periodical literature on existing works in ITD approaches using machine learning and deep learning techniques. Recent studies on developing ITD approaches comprise three important modules: the class imbalance problem, dimensionality reduction, and detection of insiders.
2024’s ITD approaches
Behaviour rhythm insider threat detection (BRITD)11 was developed to detect abnormal behaviour. It is composed of a feature extraction technique that encodes the temporal data in user behavioural series through covariance and combines the deep learning models of stacked bidirectional long short-term memory (BiLSTM) and a feed-forward neural network (FFNN) to detect the insiders in the CMU CERT dataset. However, the class imbalance problem fails to attain model reliability. The adaptative sliding window generative adversarial network (ASW-GAN)12 was designed to detect insiders based on user behaviour within the network infrastructure. The attribute similarity modifies the serialized user data into matrix data and computes the correlation among the user behaviours via an adaptive sliding window. The simple generative adversarial network (GAN) was used to generate both adversarial samples and detect insiders. The Otsu algorithm was employed for threshold segmentation automatically, which increases accuracy and decreases the false positive rate. Nevertheless, the proposed model does not ensure the extracted samples of the adaptative sliding window are related to insiders. The hybrid E-Watcher13 was framed to detect the insider, and it is composed of three modules: (1) data collection for both temporal-based aggregation and user-based segregation; (2) feature engineering, which was granted for context-based analysis; (3) hybrid ITD which was designed to detect insiders and classify insiders as malicious or non-malicious with a parametric threshold. However, the proposed model was not feasible for cyberattack-based real-time applications. The combined neural network architecture of a stacked convolutional neural network with an attentional bidirectional gated recurrent unit model14 was developed to detect the insiders on the basis of temporal classification. The proposed model obtains the complicated features of the activity logs with less model complexity. Nevertheless, important features are not extracted from the data, which affects the model’s performance.
2023’s ITD approaches
An ensemble of stacked long short-term memory (LSTM) and gated recurrent unit (GRU)-based attention models15 is designed for an ITD, which includes temporal feature aggregation attention in user activity logs. An equally weighted random sampling method was used to solve the class imbalance problem, and the unique user activity ID can easily categorize malicious activities, which improves the performance of the proposed model. However, the essential samples are not extracted, and the proposed model will consume more training time. Long- short term memory (LSTM)16 which includes the Gray encoding for extracting time-based user behaviour activities and sentimental analysis for user activity classification was designed to detect insider threats. The proposed model was evaluated on the CMU CERT dataset. However, the model experiences overfitting due to the class imbalance problem. The data leakage detection model was proposed to detect insiders17, and various random sampling techniques used are baseline, random oversampling, random undersampling to solve the class imbalance problem, and machine learning approaches to classify malicious and non-malicious samples. It was evaluated using the CMU CERT r4.2 dataset with performance metrics such as precision, recall, F-measure, and receiver-operating characteristics curve -area under the curve (ROC-AUC). However, the model has high computational and time complexities due to high dimensional data. An image-based model using a wavelet convolutional neural network (WCNN) has been suggested to detect insider threats18. It performs spatial and spectral analyses for insider threat classification using image-based features with scenario-based single-day features and user activity as a 1-D feature vector. The oversampling technique is used to solve the data imbalance problem. The model was evaluated using the CMU CERT benchmark insider threat dataset with accuracy and false positive metrics. However, converting numerical data to image data requires much time for the model to train and classification affected.
Table 1 lists a comprehensive survey from 2018 to 2022 on existing ITD models and techniques to solve class imbalance and dimensionality reduction problems and the need to develop a neural network to protect organizations from insider threats with limitations.
Table 1.
Comprehensive survey on ITD models.
| Technique proposed | Dataset | Validation | Advantage | Limitations |
|---|---|---|---|---|
| Class imbalance problem in insider threat detection | ||||
| Data augmentation technique-under sampling | CMU CERT r4.2 dataset |
Precision Recall f-Score |
Reduction in time |
Cost-sensitive sampling technique Chance of losing significant data19 |
|
Combination of synthetic minority oversampling technique (SMOTE) and random undersampling (RUS) SMOTE is an oversampling technique for increasing minority class data RUS is an undersampling technique for reducing majority class data |
CMU CERT dataset r6.2 |
Precision Recall F1-score AUC ROC |
Reduce the task of security officers practically by reducing the presence of false positives |
SMOTE oversampling had a chance of creating uninformative data RUS had a chance of ignoring the essential data20 |
|
Deep adversarial insider threat detection The Generative adversarial technique (GAN) is a data augmentation technique used for generating minority data Discriminator separates actual data and generated data |
CMU CERT r4.2 |
Accuracy Precision Recall f-score |
This method defines insider threat detection as a transfer-learning issue | Difficult to analyze anomalies of pattern recognition21 |
|
SMOTE oversampling method is used for solving data imbalance issue Implemented a one-hot encoding method for data leakage detection |
CMU CERT r4.2 dataset |
Precision Recall f-measure |
Robust | The proposed model failed to define the scalability factor16 |
| Dimensionality reduction in insider threat detection | ||||
|
User-activities depend on time-series classification for insider threat detection First, single-day features are extracted from user logs Second, a time series-based feature vector is designed from step 1 |
CMU CERT r4.2 dataset |
Precision Recall F-score |
Simple to collect frequent changes in user behavior | However, insider threat scenarios cannot occur in a single day19 |
|
Two ways of feature extraction Frequency Feature—No. of user activities in load time Statistical feature-Determine mean, median, and SD of user logging activities |
CMU CERT r5.2 dataset |
False positive rate Detection rate Precision F1-score AUC ROC Computed in both idealistic & realistic |
Maintain a record that contains excess data | Feature extracted data occur with data granularity22 |
|
Multi-fuzzy classifier model For feature extraction and feature selection Using an Isometric feature map (ISOMAP)– had limited data loss and extracted essential features for the classification model The Emperor Penguin algorithm is used to obtain only the best features |
CMU CERT r4.2 dataset |
Accuracy Precision Recall f-score False positive rate Detection rate |
Achieve good results by calculating the geodesic distance between two data points Highly maintain the low dimensional structure of data which is a high dimensional |
Taking three types of extracted features as input to a multi-fuzzifier takes more time to process14 |
| ITD in diversified data using deep learning | ||||
|
Dual-layered Autoencoder Neural Network A model trained with time series feature extracted data and single-day features |
CMU CERT dataset version r4.2 |
Precision Recall F-score |
Reduction in high dimensionality dataset | No guarantee, whether the proposed model work for synthetically generated real-world data19 |
|
Seven-layer convolutional neural network (7-CNN) Conversion of user’s mouse movements into behavior-based image dataset CNN itself extracts the features to complete its generalization phase in training data, and then it classifies |
User’s mouse behavior based Balabit Mouse Dynamic Challenge Dataset |
False alarm rate False positive rate Authentication Time |
Taking less time to achieve authentication with high accuracy | It applies only to user behavioural scenarios22 |
|
Long short-term memory (LSTM) Human brain waves are collected through Electroencephalogram (EEG) sensors It utilizes three-layered LSTM for analyzing the prior mental ability of the attacker It is compared to the present mental ability of an attacker to know the stage of mental risk by classification |
EEG brain signal dataset of seven research scholars of khalifa University Compliance Committee | Accuracy |
It is mainly designed to secure SCII’s resources Highly reliable |
The presence of noise in the dataset leads to achieving only 80% of accuracy23 |
|
Long short-term memory-Autoencoder (LSTM-AE) User behavior-based insider threat detection is accomplished through the set of selected user events and user activities |
CMU CERT r4.2 dataset |
Accuracy Precision F1-score |
Less memory and processor are adaptable Modest and flexible |
LSTM-AE is applicable to only the scenarios of r4.224 |
|
Multi-edge weight relational graph neural network (MEWRGNN) User behavior features are extracted and ranked using edge measurements |
CMU CERT r6.2 dataset |
Precision Recall Accuracy F1-score |
Highly robust | Model performance is too slow for hourly based insider threat detection25 |
Thus, the proposed HOGPNN-ITD approach has been designed to address the identified research gap in the literature as dimensionality reduction using CGLE solvers, the class imbalance problem by the optimized generative ABWGAN-EHI model and detecting the insiders by identifying the user behavioural patterns using L2-SP regularized pretrained AGCN to achieve improved performance in network infrastructure with high detection rate and minimal false alarm rate.
Materials and methods
This section discusses the fundamentals of CGLE solvers, optimized generative ABWGAN-EHI, and L2-SP regularized pretrained AGCN.
CGLE solvers
GLEM cannot be directly applied to work with high dimensional datasets and large graphs because of the Laplacian matrix size. This makes the GLEM computationally expensive for solving the eigenvalue problem26. To address this issue, Chebyshev polynomials are used to estimate the eigenvalue of the eigen spectrum27. It performs iterations to reach sufficient eigenvalues of the graph Laplacian matrix28. The following CGLE steps are
The high dimensional data are represented in the form of epsilon graph
 . Here V is the node and E is the edge.
The weight matrix
 is constructed by presenting the value between nodes and the degree matrix
  , by adding the weights that are connecting the nodes.
Determine the unnormalized graph Laplacian matrix
 . However, the eigenvalue spectrum lies between
  where 0 is small and
  is the maximum value differs according to the graph shape and size with less convergence.
To achieve better convergence for large graphs, the Chebyshev polynomial approximation is used for examination and optimization over the interval [− 1, 1] in the graph Laplacian matrix.
To set the values of the Chebyshev polynomial approximation, rescale the unnormalized graph Laplacian matrix where the eigenvalue spectrum should fall within the range [− 1, 1].
- The rescaled Laplacian matrix
 based on the Chebyshev polynomial given in Eq. (1)
where
1  is the minimum eigenvalue spectrum;
  is unnormalized graph Laplacian matrix and
  is the identity matrix.
 - By applying Chebyshev polynomial recursion, the initial vectors assigned are
 , the iterative computation with the recurrence relation given in Eq. (2)
where
2  polynomial approximations of the eigenvalue spectra are generated on the basis of n iterations.
 Based on dependent iterations, the eigenvalue and eigenvector approximations of the Laplacian matrix are defined and obtained. Using a sufficient eigenvector, a structured graph is formed with reduced dimensional data with the corresponding smallest numerical values of eigenvalues, and the eigenvector is selected29.
Thus, the selected eigenvector forms a structured graph of lower-dimensional data with high scalability, less memory, and computational cost. Owing to the iteration process, a large dataset is used to parallelize the data to the graph structure30. This reduces numerical errors and makes the data more stable with reduced dimensional space.
Optimized generative ABWGAN-EHI
Wasserstein Generative Adversarial Network (WGAN) aims to provide improved stability and solve the mode collapse problem of generative adversarial network (GAN) using Wasserstein distance. It defines a new loss function for computing the difference in real and generated adversarial samples. WGAN architecture comprises a generator and discriminator that includes an input layer, a fully connected layer, activation functions, and an output layer31. However, the major challenges in WGAN are hyperparameter sensitivity, instability while training, and difficulty in converging. Among these challenges, the hyperparameter sensitivity is too complex, affecting the model’s stability and performance while working with high-dimensional datasets32. To address this challenge, WGAN is fine-tuned using Adabelief optimizer (AB)33, expected hypervolume interchange (EHI)34, and hinge loss35. The Adabelief optimizer was derived from the Adam and root mean squared propagation (RMS prop) optimizers, where belief aims to adapt the parameter’s step sizes according to gradient position. EHI is a multi-objective hyperparameter tunning method obtained from Bayesian optimization. It is used to optimize the sensitive learning rate hyperparameters of WGAN, which makes the finest equilibrium between the stability and model performance. It makes the model more robust and flexible to ensure the quality of generated samples. The final one is the Hinge loss introduced in the critic’s, which replaces the Wasserstein loss in the case of separating the real and generated samples. It collects all the real samples when they are greater than one and fake samples when they are less than one; the major advantage of Hinge loss is that it reduces the importance of weight clipping, which shows better convergence. The Adabelief and EHI target the learning rate parameter of WGAN, which shows better stability and less tunning and optimizes the real and generative data distribution.
The following steps for integrating AB optimizer, EHI and hinge loss in WGAN
-
Step 1Construct the WGAN includes the generator
 , critic
  with loss (
 ) and adabelief optimizer in Eq. (3).
3 -
Step 2With observed gradients includes the moment estimation of first moment (mean) in Eq. (4) and second moment (variance) in Eq. (5) to optimize the learning rates36,

4 
5 In first moment, represents the decay rate and
  is the gradient over time. Here, it collects the common paths of gradients within time. In second moment,
  states computing the average on squaring the difference between the mean and gradient with time is called as “belief”. Then, update the learning parameter as per the rules defined for gradient. Now, the learning parameter of WGAN have been updated with adabelief optimizer’s moments in Eq. (6).
where
6  denotes numerical standard with constant value; ηT represents the learning rate. Depending on the upgradation on generator
  , the discriminator
  gets the update several times which shows smoother convergence.
 -
Step 3Then apply EHI as Bayesian optimization to fine-tune the learning parameter of optimized WGAN. In generator and critic losses, EHI estimate the expected improvement in hypervolume of learning rate. Initiate the hypervolume for WGAN is given in Eq. (7)37

7 To maximize the hypervolume within the objective space of generator and critic, set a reference position to denote the specified space
 . Then, compute the present hypervolume by
  of learning rate as configuration for the corresponding reference position.
 -
Step 4Compute EHI, identifying the improved region in objective space that shows the predicted value
 to be higher when compared to
  . It indicates the predicted
  improves the generator and critic losses eventually in Eq. (8).
where
8  denotes the learning rate;
  is the expected hypervolume improvement for learning rate
  ;
;  is the current best hyperparameter configured for learning rate. The highest EHI value of learning rate parameter is declared as optimized learning rate.
 -
Step 5Integrate hinge loss instead of Wasserstein loss in discriminator to improve its decision limits. To enhance the stability training, the update critic loss in Eq. (9),38
where
9  represents real sample and
  is the generated samples and in the above given Eq. (7) assures the discriminator distributes the data within the range 1
  . Then the generator loss with Wasserstein distance in Eq. (10)
10
Equation (10) shows the generator increases the samples by improving the discriminator’s rank of generated data. Thus, the integrated generative model of ABWGAN-EHI with hinge loss is more robust and stable with diversified generative samples. It improves the quality of generated samples, improves the alignment of data distribution among the generated and real samples.
L2-SP regularized pretrained AGCN
An L2-SP regularized pretrained AGCN is a deep learning model that combines both pretraining and fine-tuning to influence former information when processing the model for a huge dataset39. In the pretraining phase, attention mechanisms in the graph convolutional network dynamically acquire the attention scores of neighbour nodes for single nodes. Depending on attention scores, the rationalized node collects the information from the neighbour nodes40. While fine-tuning the AGCN with pretrained weights without information loss, apply L2-SP regularization41.
The steps to develop L2-SP regularized pretrained AGCN
-
Step 1
Construct graph with nodes and edges where the nodes connected together by edges. Then, represent the graph in both feature matrix
 and adjacent matrix where
  when the node 1 connected with node 2 or else
  .
. -
Step 2Develop AGCN by presenting graph attention layer, multi head attention normalization and feature aggregation.
- Compute attention scores between the pair of graph nodes using graph attention layer in Eq. (11)
where
11  is the attention score based on unnormalized graph of (x, y) nodes;
  are the feature vector of the node(x, y);
  is the weighted matrix;
  is the attention vector with transpose; LeakyReLU is the non-linear activation
- Use SoftMax function to Normalization the attention score in Eq. (12)
where
12  is the normalized attention coefficient;
 is the exponential attention score used to find high score nodes after normalization;
  denotes the summation of exponential unnormalized attention score of node x and its corresponding neighbours
  also known normalization factor.
 - Update feature rule using attention scores aggregates the neighbouring node features in Eq. (13)
where
13  update feature rule;
  -non-linear activation function;
  —aggregates the summation of node y neighbours with weight and
  is the normalized attention coefficient with weighted matrix and feature vector (
 .
. - Using cross entropy loss function in Eq. (14), train the AGCN model
where z is the true label and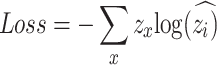
14  is the predicted probability that can castigate incorrect and recompense correct predictions.
 - Once the model is trained, then save model weights as “pretrained weight” with the attention parameters.
-
Step 3To fine-tune AGCN using L2-SP regularization technique, to avoid model overfitting and authorizes the model yields important data from pretraining
- Compute the total of normal loss (cross entropy) and Loss (L2-SP) given in Eq. (16) and train the fine-tuned pretrained AGCN model.

16


While training the model, the calculate gradient of  and use adam optimizer to update the weights. It will not concentrate only on minimizing the loss and shows the minimization by computing the difference between the pretrained weights and fine-tuned weights. If necessary, further tune the regularization strength λ and optimize the AGCN model.
Proposed methodology
The proposed HOGPNN-ITD approach is composed of three modules: (1) Selection of optimal time aggregated user-designated samples using CGLE solvers and insider state clustering using Density-Based Spatial Clustering of Applications with Noise (IS-DBSCAN), (2) ABWGAN hybridized with EHI to solve class imbalance problems by generating insider samples (3) A L2-SP regularized pretrained AGCN is used to identify the user behavioural patterns to detect insiders with high detection rate and minimal false alarm rate. The framework of the proposed HOGPNN-ITD approach is shown in Fig. 1
Fig. 1.

Proposed HOGPNN-ITD approach framework.
Module 1: Time aggregated user designated samples using CGLE and insider states based DBSCAN
Dataset collection & preprocessing
In Carnegie Mellon University (CMU), the time-based user activities are captured from different log records of computer emergency response team (CERT) within the network infrastructure, as shown in Fig. 2. The network log records of CMU CERT consist of file, device, http, email, and user logs. Installing the log collection agent across the entire infrastructure to accumulate the logs from various sources43. The files accessed by users are stored in the file server, user activities are placed in the log server, and devices enabled by the users are stored in the device server. All these servers (file, log, network) are forwarded to network devices, where the router logs record the problems related to network bandwidth, and the firewall logs collect the suspicious activities, intruders, and traffic filtering. Then, all http logs (access and error logs) are stocked in the web server, and email communications are gathered in the email server. The central server collects and stores all the records from the network device, web server, and email server. The reports for collected logs are visualized through a user interface like a dashboard. The logs obtained from the dashboard are interpreted in CSV format by unified indexing.
Fig. 2.

Structure to demonstrate the collection of log records from Network infrastructure.
All five log records of the network system are combined as a single homogenous file to detect the insiders, which are high-dimensional and heterogeneous data. To obtain auxiliary data and improve the proposed ITD’s performance, the initial preprocessing step is to modify the categorical and ordinal values of the insider threat network system data. The label encoding is deployed to convert categorical data into numerical values44. The algorithm 1 defines the timestamp-based user activity filtering and aggregation method to extracts the timestamped user activities by aligning the timestamps, fixation of time constraints, user activities in off-hours, and aggregating the user activities.
Algorithm 1.

Timestamp based user activity filtering and aggregation.
Optimal sample selection and insider states clustering
CGLE solver is used as the optimal sample selection technique to select time aggregated user-designated samples given in algorithm 2, and algorithm 3 describes the density based spatial clustering of applications with noise (DBSCAN) clustering technique is used to cluster the insider states (IS) depending on selected user-designated data in network infrastructure. CGLE reduces the dimensionality of observed insider threat data without modifying the basic data interrelation. The following steps are designed to construct a CGLE solver to select the optimal user-designated samples
-
Step 1
Construct the Epsilon graph (V, E) for Z-score normalized data, where V represents the nodes and E denotes the line connecting nodes by computing the Euclidean distance to find similarity between nodes based on attributes. Then, update the Epsilon threshold
 ,should be less than Euclidean distance and form weighted adjacency matrix.
 -
Step 2Compute the Degree matrix
 and unnormalized graph Laplacian matrix
  , it shows the robust connection where edge is connected to entire node. This matrix representation provides the information about the global and local structure of the graph. Using spectral decomposition, the eigenvalues are obtained with eigenvectors in Eq. (17)
where
17  is the eigenvector and
  is the eigenvalue. The spectrum range
  where 0 defines the smaller eigenvalues that describe the absence of nodes interconnection and
  represent the importance of entire graph structure and nodes connectivity.
 -
Step 3
The convergence is very low for huge insider threat dataset; to improve the convergence, the Chebyshev polynomial approximation is used in the graph Laplacian matrix within interval
 . To update the Chebyshev polynomial in the graph, the unnormalized graph Laplacian matrix to be restructured where the eigen spectrum to be fall within
  . It assures the improved convergence, stabilized numerical values are computationally effective. The updated unnormalized graph is shown in the above given Eq. (1) of CGLE solvers.
 -
Step 4
Estimate the functions of updated unnormalized graph Laplacian matrix by applying Chebyshev polynomial recursions in Eq. (2) of CGLE solvers. Through iterative performance of recurrence in higher order relationships, the CGLE collects the original structure of the insider threat data after reducing the dimensionality with sufficient eigenvalue and eigenvectors.
-
Step 5
The iteration indicates the importance of Chebyshev based solvers in obtaining the eigenvalue and eigenvectors of the Unnormalized Graph Laplacian Matrix (UGLM) where the eigenvectors are used to signify the graph for newly formed lower-dimensional data. Depending on smallest eigenvalue, the eigenvectors are obtained to form a structured graph with reduced dimensional data.
-
Step 6
Once the dimensionality is reduced by selecting the smallest eigenvalue, then apply Density-Based Spatial Clustering of Applications with Noise (DBSCAN) to group the three different insider states based time aggregated user designated samples.
Algorithm 2.

Time aggregated User designated samples using CGLE solver for optimal sample selection.
Algorithm 3.

Insider state clustering based DBSCAN.
Module 2: An optimized generative ABWGAN-EHI model to solve class imbalance problem
The ABWGAN-EHI deep generative network architecture is shown in Fig. 3 consist of latent space, generator, and discriminator. The procedure for optimized generative ABWGAN-EHI model is narrated in algorithm 4. The latent space takes the input data that encrypts the original pattern and inconsistency of target sample occurrences. The random noise with latent space aids as an initial point for the generator to generate samples with fully connected layers, nonlinear activation function, and batch normalization with Wasserstein loss that ignores vanishing or exploding gradients problems and decreases mode collapse with increased stability. The presence of an adabelief optimizer in the generator improves the convergence rate by adjusting learning rates depending on belief with a gradient that ensures the generator acquires faster convergence. The structure of the discriminator includes the input layer, fully connected layers, nonlinear activation functions (Leaky ReLu), and adabelief optimizer with Hinge loss in critic differentiates the real and generated samples. The expected hypervolume improvement (EHI) of Bayesian optimization for optimizing the hyperparameter, such as the learning rate in both the generator and discriminator, improves the performance of ABWGAN.
Fig. 3.

Optimized generative ABWGAN-EHI architecture.
Algorithm 4.

Optimized generative ABWGAN-EHI model.
Module 3: A (L2-SP) regularized pretrained attention graph convolutional network for insider threat detection
An L2-Starting Point (L2-SP) is a regularization technique developed to control the information fixed and fine-tune the pretrained weights of Attention Graph Convolutional Network (AGCN)by adjusting the model to work with insider threat data to identify the user behavioural patterns of insiders within a network infrastructure. The structure of L2-SP regularization based pretrained AGCN is shown in algorithm 5. The Pretrained AGCN architecture is composed of a graph convolutional layer (GCL1 & GCL2), a multi-head attention mechanism, and an output layer which is constructed to progress the data in the form of the graph by aggregating the attributes from neighbouring nodes in graph convolutional layer. Using the multi-head attention mechanism, the weights are assigned dynamically to the aggregated attributes that allocate importance scores to all neighbour nodes. Then, the attention coefficient collects each node’s relative importance scores from a the center node that updates each node’s feature in the output layer. For ITD, the fine-tuning is done in pretrained AGCN by altering the weights, which adapt to the new graph structure. However, the performance of fine-tuning leads to overfitting and catastrophic forgetting. To overcome the aforementioned challenges. The L2-SP regularization technique is employed to penalize distractions from fine-tuned pretrained AGCN. It conserves the fundamental information by controlling the model training process to rank the prior learned patterns that ensure the model does not exist to overfit the insider threat dataset. Similarly, the L2-SP regularization provides high scalability and flexibility in the top layer of AGCN for adjusting the precise requirements of the ITD. L2-SP regularization in pretrained AGCN is important to avoid overfitting and catastrophic forgetting and provide better convergence and generalization. The L2-SP regularization in pretrained AGCN aims to provide a mutual understanding between user behavioural patterns learning of ITD and knowledge retention of insider threat approaches. It improves the performance of pretrained AGCN by identifying the user behavioural patterns to detect the insiders and classifying the insiders and non-insiders samples in network infrastructure with a high detection rate and minimal false alarm rate.
Algorithm 5.

Insider threat detection (L2-SP regularized pretrained AGCN).
Experimentation and results
Experimental setup
The proposed HOGPNN approach was executed using Python 3.7 with the Pytorch library and TensorFlow44,45. The experimentation was performed in an Intel i5 processor with 16 GB RAM and a 64-bit processor in the Windows 10 OS. The dataset used for detecting the insiders in network infrastructure is CMU CERT r4.1 & r4.2.
Dataset description
The CMU CERT9 insider threat dataset has six releases, including six folders of institutional network infrastructures: logon, file, device, email, http, and psychometric. The common attributes in log records that gather user behavioural activities are id, user, timestamps, PC number, and activity. All six releases have covered the LDAP for 17 months from 01-11-2009 to 01-05-2011, which has different attributes, such as user designation, projects, business, functional_unit, department, team, and supervisor. The proposed HOGPNN approach is implemented in r4.1 and r4.2 of three scenarios, where r4.1 has 997 users and three insiders, and r4.2 has 930 users and 70 insiders. The features of log records and their descriptions are shown in Fig. 4. The log records of r4.1 & r4.2 are constructed as each flat file, which are high dimensional data. The HOGPNN-ITD approach can be carried out by splitting the dataset into training, testing, and validation.
Fig. 4.

CMU CERT log records and its descriptions.
Importance of r4
The CMU CERT release r4 has two versions, r4.1 and r4.2, with three different scenarios: data exfiltration, IP theft, and sabotage. Compared to r5 and r6, the r4 is modest in structure and extensively implemented to portray the high density of malicious activities of 732314,19,53. Table 2 shows the extended comparison of CMU CERT r4, r5, and r6 based on factors.
Table 2.
Factors based comparison of CMU CERT r4, r5, r6.
| Factors | CERT r4 | CERT r5 | CERT r6 | |||
|---|---|---|---|---|---|---|
| r4.1 | r4.2 | r5.1 | r5.2 | r6.1 | r6.2 | |
| Users | 1000 | 1000 | 2000 | 2000 | 4000 | 4000 |
| insiders | 3 | 70 | 4 | 99 | 5 | 5 |
| Scenarios | 3 | 3 | 4 | 4 | 5 | 5 |
| Total activities | 32,770,222 | 32,770,222 | 79,846,358 | 79,846,358 | 1,49,643,790 | 1,49,643,790 |
| Malicious activities | 273 | 7323 | 351 | 10,306 | 330 | 470 |
| Malicious rate (%) | 0.0008 | 0.022 | 0.001 | 0.013 | 0.0002 | 0.0003 |
Data pre-processing
The flat file is pre-processed using the “Timestamp-based user activity filtering and aggregation” method. Label encoding is processed to the features are id, user id, pc, designation, and activity that converts the data to a timestamped labelled sample. The data is aligned in the format [Hrs:Days], where user actions are recorded per hour and day. Fixation of time constraint [8.00 a.m.–6.00 p.m.] delivered to collect the log records accessed within normal window (NW) time. The users accessed after office hours are accumulated as the abnormal window (ABW) time. The filtered user activities are aggregated based on five different log records. This approach scrutinizes user behaviour patterns and detects the diversions from normal user activities. The features and descriptions of timestamps filtering and aggregations approach are listed in Table 3.
Table 3.
Pre-processed Timestamp features and its descriptions.
| Timestamp features | Descriptions |
|---|---|
| Hr_day | Total hours per day accessed by users either NW or ABW |
| Hr_week | Total hours per week accessed by users either NW or ABW |
| Hr_month | Total hours per month accessed by users either NW or ABW |
| Hr_year | Total hours per year accessed by users either NW or ABW |
| Day_week | Total no. of days in week accessed by users either NW or ABW |
| Day_month | Total no. of days in month accessed by users either NW or ABW |
| Week_month | Total no. of weeks in month accessed by users either NW or ABW |
| Week_year | Total no. of weeks in year accessed by users either NW or ABW |
| Month_year | Total no. of months in year accessed by users either NW or ABW |
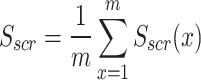
Results and discussion
The following framed research critics ensure the proposed approach to identify the user behavioural patterns to detect insiders within the network infrastructure.
RC1: How does the Chebyshev Graph Laplacian Eigenmaps (CGLE) solver can select the user designated samples with improved computational efficiency for insider detection within the network infrastructure?
Chebyshev Grap Laplacian Eigenmaps (CGLE) is a graph-based dimensionality reduction technique that efficiently diminishes the insider threat data density without modifying the original structure of the dataset. CGLE performs better for huge datasets than GLE; Chebyshev polynomials approximate the Laplacian eigenfunctions with computationally efficient and cost-effective. Construct Epsilon graph (V, E) where V is the activity; E is connected between the user’s activity based on two cases, Case (i) similarity computation between activities using Euclidean distance; Case (ii) Find user’s designation factor (UDF)—calculate the relationship between user activities based on user’s designation. Then, the weighted edge of a graph is determined by multiplying the similarity measures among user activities with UDF. The graph Laplacian matrix (GLM) can be obtained by finding the difference between the weighted adjacency matrix and degree matrix depending on UDF that shows the encrypted relationship among the user activities with the same designations denoted by 1; if the user activities have different designations denoted by 0. However, the graph Laplacian matrix of UDF = 1 shows that the global structure of data has less convergence for extracting the user designation-based activities due to the eigenvalue spectrum range. So, the Chebyshev Polynomial approximation is used to estimate the eigenvalue spectral range between. Then, the GLM was fitted by dependent iteration with the Chebyshev polynomial to extract the user-designated samples. Figure 5 shows the Chebyshev polynomials used to filter the GLM eigenvalues based on rescaled eigenvalues, where the constant is linear and quadratic. Depending on higher degree polynomials, the filter process defines the impact of user activities relationship in a graph. Hence, it ignores the non-linear user activities relationship within the graph to ensure the extraction of user-designated samples of insider threat data. Figure 6 represents the red dots as rescaled eigenvalues [− 1,1], and the blue curve shows the Chebyshev polynomial filter are quadratically convoluted eigenvalues define the user activities-based user designation are selected with reduced dimensionality and computationally effective for insider threat data in institutional network infrastructure.
Fig. 5.

Rescaled Eigenvalue with Chebyshev polynomials.
Fig. 6.

Chebyshev polynomial filter 
 .
.
RC2: Does the incorporation of the density-based spatial clustering of applications with noise (DBSCAN) algorithm enhance the identification of specific, crucial patterns of insider behaviour within clustered samples? “If yes, how?
Yes, the DBSCAN algorithm can effectively group the selected user-designated samples based on three different insider states (IS-DBSCAN). The three insider states are declared as core points randomly; each insider state covers the neighbourhood point of the same state by a specified radius as an epsilon point. So, the core point is known as the insider state, and the Epsilon neighbourhood point is called the data point that belongs to each insider state. Depending on the core point, the cluster is formed with a minimum no. of samples of each insider state. Iteration of this process will be continued for the formation of three insider state clusters with their corresponding data points. However, the DBSCAN will ignore the data points that do not belong to these three insider states by creating noise. The three different insider states to group the user-designated samples using DBSCAN are listed in Table 4. Hence, implementing the DBSCAN for clustering the extracted user-designated samples based on three different insider states can help identify the patterns of insiders. The clustered insider states-based user-designated samples of r4.1 are indicated as IS1 as cluster1(red), IS2 as cluster 2(blue), and IS3 as cluster3 (green) by associated feature one as user access frequency with feature two as data access patterns in Fig. 7. For instance, IS1 as core point and neighbourhood points are the user-designated samples of IS1 are grouped as single indicated as cluster 1 are formed by iteration process of measuring the epsilon points. Similarly, IS 2 and IS3 are core points, and their corresponding neighbour points of user-designated samples are clustered, as shown in Fig. 8. represents the mapping the core points of all three insider states shows the impact of identifying patterns of insiders in r4.1 by showcasing the quality of cluster formation of insider activities within the network infrastructure.
Table 4.
Three different Insider states & its descriptions.
| Insider states | Description |
|---|---|
| IS1 |
In prior unused of removable drives Using removable drives post office hours Syncing data to Wikileaks.org |
| IS2 |
Job Searching in opponent institution Looking for employment openings in opponent institution Formerly departure institution, user use thumb drive to pilfer data |
| IS3 | System admin frustrated, copy key and grant for thumb impression and pass the gathered information to other institution lead |
Fig. 7.

r4.1-3 different insider states cluster.
Fig. 8.

r4.1-mapped core point of 3 different insider states.
In case of r4.2, the corresponding three different insider states based selected user designated samples are represented as cluster1 (yellow) as IS1, cluster 2 (purple) as IS2, cluster 3 (brown) as IS3 based on user access frequency with data access patterns is shown in Fig. 9. Each insider states has one core points and more number of neighbourhood points which are belongs to specific insider state are indicated by mapping the core points of three different insider states in Fig. 10.
Fig. 9.

r4.2-3 different insider states cluster.
Fig. 10.

4.2-mapped core point of 3 different insider states.
RC3: Describe the workflow of integrating Chebyshev Graph Laplacian Eigenmapss (CGLE) with the DBSCAN algorithm, and explain the impact of this model on preserving the structural integrity of data
The integration of CGLE with the DBSCAN technique can efficiently examine the insider threat data by selecting the user-designated samples by reducing the data dimensionality by optimal sample selection technique and clustering the data points that belong to insider states using the DBSCAN algorithm. It can improve the performance of the HOGPNN-ITD approach while identifying the user behavioural patterns to detect insiders in institutional network infrastructure. Figure 11 describes the workflow of integrated CGLE solver with DBSCAN for insider threat data. The graph construction includes nodes as user activity and weighted edges as similarity matrix and UDF. By defending the value of UDF as 1, the samples are forwarded towards the CGLE interval; it selects the optimal user-designated samples with a lower dimensionality structure without underlying the structure of data. The optimal selected user-designated samples are forwarded to group the samples using the DBSCAN algorithm based on three different states of insiders. IS-DBSCAN defines both inter and intra-relationships among the three different insider states-based user-designated samples. Some of the impacts of the integration of CGLE with DBSCAN techniques are a reduction in high dimensional data and increased cluster eminence because DBSCAN ignores the noise and unwanted samples that lead to different insider state clusters. Thus, the integrated model has improvised computational efficiency, and it trains the ITD approach to analyse the user behavioural pattern to detect the insiders. Hence, the proposed approach is robust and computationally effective with an improved detection rate.
Fig. 11.

Work flow of integration of CGLE solver with DBSCAN in Insider threat data.
Ablation study to evaluate CGLE-DBSCAN based on parameters
To ensure the stability and generalizability of the proposed HOGPNN-ITD approach, it’s necessary to evaluate each module with its parameters. Depending on parameters of v and t for the CGLE solver, and min_samples for DBSCAN were taken to prove the integrated CGLE solver with DBSCAN module. To evaluate the clustering algorithms and to analyse the similarity between cluster, the silhouette score in Eq. (18) and normalized mutual information (NMI) in Eq. (19).
 |
18 |
 |
19 |
m is the total no. of points in silhouette score. In NMI, x is the truth labels; y is cluster labels; I(x;y)represents mutual information between x and y and H(x), H(y) denotes the entropies of x and y. The clustering accuracy in Eq. (20) examines the importance of cluster formed by a clustering algorithm. It computes the permutations of clustered labels increases the no. of matches with ground truth labels and divide by total no. of samples to present the values lies between 0 and 1.
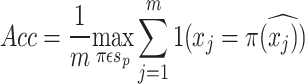 |
20 |
where m is the total no. of samples;  is the j data point’s true label;
  is the j data point’s clustered label;
 clustered labels’s permutation and
  is the permutation set of p clusters. The ablation study is carried out to ensure the flexibility and stability of the integrated CGLE solver with the DBSCAN. In the CGLE solver, three different eigenvectors
  are taken with three different Chebyshev polynomial orders (3,6,9) and the setting of a constant value of 3 for min_sample represents the three insider states as core points and the computation value of the radius of nearby points
  . Table 5 shows the ablation study to validate CGLE-DBSCAN that assures the
  and its
  = 0.25 has achieved improved clustering accuracy (0.894) and the silhouette (0.685) and NMI (0.776). Compared to other values
  and
and  , the impact of the obtained results derives
  eigenvector reducing the data’s dimensionality by collecting the complex users activities with the Chebyshev polynomial order
  to define the user’s designated factor (UDF) that extract the essential samples of user designated activities. Then, the
  that represents insiders states of IS1, IS2, IS3 with the
  describe the distance threshold value to accumulate the nearby sample similar to anyone of the IS. Thus, it assures the stability of the proposed approach by examining the feasibility of the CGLE solver with DBSCAN module.
Table 5.
Ablation study to validate CGLE-DBSCAN.
| CGLE parameter | DBSCAN Parameter | Score | Metric | |||
|---|---|---|---|---|---|---|
| v-Taken no. of eigenvectors | t-Chebyshev polynomial orders | min_sam-selecting a core point |
 -radius value of Nearby points -radius value of Nearby points |
Silhouette | NMI | Accuracy |
| 10 | 3 | 3 | 0.20 | 0.587 | 0.685 | 0.803 |
| 0.25 | 0.609 | 0.693 | 0.832 | |||
| 0.35 | 0.616 | 0.712 | 0.818 | |||
| 20 | 6 | 3 | 0.20 | 0.623 | 0.735 | 0.826 |
| 0.25 | 0.685 | 0.776 | 0.894 | |||
| 0.35 | 0.631 | 0.721 | 0.854 | |||
| 30 | 9 | 3 | 0.20 | 0.604 | 0.732 | 0.843 |
| 0.25 | 0.621 | 0.727 | 0.874 | |||
| 0.35 | 0.612 | 0.738 | 0.812 | |||
RC4: How does the proposed optimized generative model determine the generated adversarial samples exhibit improved quality, stability, and robustness against class imbalance problems?
The selected time-aggregated user-designated samples prove that the insider threat dataset is highly imbalanced due to the presence of a majority of non-insider samples and a minority of insider samples. To resolve the class imbalance problem, the optimized generative model called Adabelief Wasserstein Generative Adversarial Network with Expected Hypervolume Improvement (ABWGAN-EHI) is developed to generate the insider samples that balance the insider threat data, increases the performance of the proposed HOGPNN-ITD approach while identifying the user behavioural patterns of an insider within the network infrastructure. Table 6 shows the list of parameters for constructing ABWGAN-EHI. Once the layers of generator and discriminators are included with its loss functions, then the Adabelief optimizer is integrated with its learning rate and its beta value and the hyperparameter optimization of learning rate in ABWGAN initialize with gaussian kernel and iteration to refined. The ABWGAN-EHI highlights the generated insider samples, improved generalization with stabilized training, and avoids model overfitting by fine-tuning the learning rate using multi-objective optimization. The selected user-designated samples are forwarded to optimized generative ABWGAN-EHI architecture by splitting the r4.1 and r4.2 data into (80%) training, (10%) testing, and (10%) validation. The latent space is converted into a latent vector and mapped to the generator to generate the adversarial samples with Wasserstein loss. The user-designated samples of training data and generated adversarial samples are mapped into a discriminator with hinge loss that can differentiate the generated adversarial samples from user-designated samples. The presence of EHI in the learning rate of ABWGAN improves generalization and model performance, makes it more scalable to large and complex insider threat data, and produces automated optimization. The generated adversarial samples of user-designated samples balance the training data. Then, the balanced training data and testing are forwarded to the HOGPNN-ITD model to identify the user behavioural patterns and detect the insiders.
Table 6.
Optimized generative ABWGAN-EHI parameter & its description.
| ABWGAN-EHI parameters | Description |
|---|---|
| Generator layers |
Input layer ⇾ One layer (Three neurons) & latent space Hidden layers⇾ Two layers (four neurons in each layer) Output layers⇾ One layer (Two neurons) Batch normalization; ReLU (Hidden); Sigmoid (Output); Wasserstein loss; |
| Discriminator layers |
Input layer⇾ One layer (Three neurons) Hidden layers⇾ Two layers (Four neurons in each layer) Output layers⇾One layer(Two neurons) Layer normalization; LeakyReLU (Hidden);linear (Output);Hinge loss; |
| Adabelief Optimizer | lr (α) = ; ;  ; ;  ; ;  ; λ ; λ |
| Epochs | 200 |
| Batch size | 64 |
| Expected Hypervolume Improvement (EHI) | Learning rate optimization lr range:
|
RC5: Does the proposed regularized pretrained model effectively identify the insiders behavioural patterns and classify users as insiders or non-insiders?"
An L2-SP regularized pretrained AGCN is used to identify user behavioural patterns and detect insiders within the network infrastructure. In pretrained AGCN, the L2-starting point (L2-SP) regularization technique is used to fine-tune the pretrained weight of the AGCN. The L2-SP pretrained AGCN architecture comprises an input layer, Graph convolutional layer 1 and graph convolutional layer 2 with multi-head attention mechanism, and an output layer with non-linear activation LeakyReLU, dropout, and layer normalization. The balanced trained, validation, and testing insider threat data in the input layer in the form of users as nodes and their activities as features in the feature matrix and adjacency matrix is constructed based on three factors: the user’s same designation, the user’s same behavioural and access patterns. The graph convolutional layer has a multi-head attention mechanism with attention coefficient and multi-head attention, including a weight matrix with an attention vector. The output layer has two neurons with four multi-head attention mechanisms denoting the binary classification by identifying the behavioural patterns of users to detect the insiders. The L2-SP regularized pretrained AGCN has the hyperparameters learning rate lr = 0.002, Adam optimizer, batch size = 64, epoch = 200. The L2-SP fine-tunes the weights of the training and testing of pretrained AGCN to avoid model overfitting and catastrophic forgetting. The regularized pretrained AGCN was trained in selected time aggregated user-designated samples to identify the user behavioural patterns to detect the insiders with improved accuracy and detection rate and decreased false alarm rate. For r4.1, it reaches 0.97 accuracy for 200 epochs during training and validation, as shown in Fig. 12. The loss of L2-SP regularized pretrained AGCN reaches 0.04 in training and 0.02 in validation for 200 epochs, as depicted in Fig. 13. In r4.2, the training and validation reaches 0.98 accuracy represent in Fig. 14. It demonstrated the stabilized training and validation when a slighter depreciation in loss occurred with closer time. Figure 15 defines the loss of L2-SP regularized pretrained AGCN reaches 0.03 in training and 0.02 in validation for 200 epochs. It indicates the better generalization with minimal overfitting and ensures the L2-SP regularized pretrained AGCN model has increased accuracy with reduced loss. The proposed HOGPNN-ITD model reveals supremacy performance on r4.2 compared to r4.1 due to substantial user activities with 70 insiders in 1000 users. Furthermore, r4.1 has fewer user activities, with three insiders in 1000 uses. Therefore, it is evident by indicating the loss curves of r4.1 and r4.2, where the convergence of training and validation is earlier. This ensures the proposed model leverages r4.2 to achieve better generalization and faster convergence.
Fig. 12.

r4.1-accuracy vs epoch of proposed approach.
Fig. 13.

r4.1-loss vs epoch of proposed approach.
Fig. 14.

r4.2-accuracy vs epoch of proposed approach.
Fig. 15.

r4.2—Loss Vs Epoch of proposed approach.
RC6: Compute the latency test on existing CMU CERT log data and edge devices to ensure the practicality of real-world deployment
Investigation on the adaptability of proposed HOGPNN for CMU CERT
The proposed HOGPNN approach is implemented in log data of r4.1 and r4.2. To ensure the proposed HOGPNN approach’s stability and feasibility, the average inference time and throughput are computed on both r4.1 and r4.2. The average inference time defines the occurrences of delay for a sample, and the throughput is the number of samples within a second. Table 7 clearly states the r4.2 has a faster inference time with high throughput than the r4.1. The r4.2 has an average inference time (0.29 ms) and throughput (3845 samples per second) that ensures the proposed approach has sustained feasibility, steady speed, and efficiency towards the log data.
Table 7.
Computation on average inference time and throughput for CMU CERT.
| CMU CERT | Average inference time per sample (ms) | Total inference time (s) | Throughput per second |
|---|---|---|---|
| r4.1 | 0.82 | 82 | 1350 |
| r4.2 | 0.29 | 29 | 3845 |
Investigation on the adaptability of proposed HOGPNN approach for Edge devices
Investigation scenario-data generation setup: The generated insider threat data is highly confidential and authenticated. The real-time deployment for collecting the user activity data was conducted for three days and included ten systems: seven systems connected to the local area network (LAN), two systems, and a Raspberry Pi 4 connected to Wi-Fi. The configuration of each of the nine systems includes an i7 processor, 16 GB RAM, Ubuntu OS, and Python 3.8 package. Initially the data are collected from LAN and Wi-Fi. Ten different users were allocated to each system per day, so the overall number of users employed for three days is thirty. Three scenarios were planned to identify insiders among the thirty users. The users who compromised the three scenarios were identified as insiders. In this context, the first-level screening was carried out, with which the user activities are collected on three different records: logon, files, and devices, depending on Lightweight Directory Access Protocol (LDAP), which has the profiles of thirty different users. Osquery is used to capture the data from each system. Figure 16 shows the environmental setup for generating insider threat data. The total number of user activities is 102,457, and 3045 malicious activities are identified from three different records with three scenarios. Table 8 describes the normal and abnormal instances of each record (logon, file, and device) with its attributes. Table 9 shows three different scenarios for insiders.
Fig. 16.

Environmental setup for data generation.
Table 8.
Normal and abnormal instances of log records.
| Folders & attributes | Normal instances | Abnormal instances |
|---|---|---|
| Logon (userid, timestamp, PC number, activity) | 14,450 | 655 |
| File (userid, timestamp, PC number and file tree) | 70,860 | 2030 |
| Device (userid, timestamp, PC number and activity) | 16,157 | 360 |
Table 9.
Three different scenarios.
| Insider scenarios | Description |
|---|---|
| Scenario 1 | Non-working hours + unofficial file access |
| Scenario 2 | Non-working hours + illegal USB access |
| Scenario 3 | Non-working hours + copying sensitive files + USB connect |
Type 1: System connected to LAN
The seven systems connected to the LAN had similar configurations, so the computation of average inference time, total inference time, and throughput is performed on single system of log data. The average inference time per sample is (0.40 ms) specifies that the proposed HOGPNN approach is rapid for a single sample of log data. Therefore, it ensures the throughput of (2286 samples per second) showing the proficiency of implementing huge log data. It also assures that minimal inference time and achieving maximum throughput are the best parts of real-time deployment. Thus, the proposed approach is scalable to huge datasets while surveilling the insider threat.
Type 2: System connected to Wi-Fi
The log data collected from a single system connected to Wi-Fi is taken for the computation of average inference time, total inference time, and throughput. The average inference time per sample (0.20 ms) illustrates that the proposed HOGPNN approach is more effective in processing speed, ensuring the throughput of (5125 samples per second). It shows the proposed HOGPNN approach is able to examine the log data with high rates that are suitable for huge organizations. It achieves less average inference time and more throughput that makes the model much more efficient to detect the insider. While comparing with systems connected to LAN, it has improved performance in identifying the anomalous behavioural patterns of insiders in real-time. Thus, the proposed approach is highly scalable and feasible for large datasets when identifying the insider threat.
Type 3: Raspberry pi4 connected to wi-fi
The raspberry pi4 connected to Wi-Fi has an average inference time (4 ms), total inference time (12 min) on log data, which is slower than the system and compatible with the ITD without temporal features. The throughput of (145 samples per second) is low compared to both the systems connected via LAN and Wi-Fi. This supports small enterprise networks or IoT infrastructure. It consumes low power with less cost. However, it cannot support a large volume of data.
Comparing the three case studies, the case study 2 (system connected to Wi-Fi) has high speed and efficiency over the system connected to LAN and Raspberry Pi4 connected to Wi-Fi for ITD on log data in both average inference time and throughput that performs the latency test. Table 10 describes the computation of average inference time, total inference time, and throughput of the system connected to LAN, system connected to Wi-Fi, Raspberry Pi4 connected to Wi-Fi. Since the seven systems are same, one of the system’s results have been presented.
Table 10.
Computation on average inference time and throughput for Edge devices.
| Deployment device | Average inference time per sample | Total inference time for 1 lakh samples | Throughput per second |
|---|---|---|---|
| System 1 (LAN) | 0.45 ms | 45 s | 2286 samples |
| System 1 (Wi-Fi) | 0.20 ms | 20 s | 5125 samples |
| Raspberry Pi4 (Wi-Fi) | 4 ms | 12 min | 145 samples |
Discussion on performance of HOGPNN approach
From Table 11, the proposed approach is trained for batch size 16 and has achieved (0.854) for r4.1 and (0.875) for r4.2 of low accuracy, leading to model underfitting and unstable convergence. Then, the model is trained with batch size 32 for better performance. However, it has reached the maximum level of accuracy (0.912) for r4.1 and (0.926) for r4.2. Finally, the proposed approach has trained with 64 batch sizes and achieved accuracy (0.985) for r4.1 and (0.991) for r4.2, ensuring stability, feasibility, and generalization. Similarly, the proposed approach is trained with 10 as the drop value had reached an accuracy of (0.921) for r4.1 and (0.904) for r4.2, which avoids overfitting but affects the model’s robustness. The proposed approach is trained with 20 dropouts and achieved an accuracy of (0.985) for r4.1 and (0.991) for r4.2 to improve performance. The proposed approach has trained with epochs ranging from (1 to 200) for both training and validation in r4.1 and r4.2. When the epoch was 50, the proposed approach reached accuracy (0.801) for r4.1 and (0.841) for r4.2 in training and (0.823) validation. Similarly, for epochs 100 and 150, the accuracy has better accuracy (0.865), (0.917) for r4.1 and (0.887), (0.936) for r4.2 during training, and (0.905) (0.928) for r4.1 and (0.906), (0.953) for r4.2 in validation are due to inadequate training time, lack of study for complex data and model underfitting. By increasing the epoch 200 for the proposed approach, the training accuracy for r4.1 (0.972) and r4.2 (0.989) and validation accuracy for r4.1 (0.985) and r4.2 (0.991) have ensured standardization with improved robustness and flexibility.
Table 11.
Training the proposed approach according to A. Batchsize; B. Dropouts: C. Epoch to reach targeted accuracy.
| Proposed HOGPNN approach | |||||||
|---|---|---|---|---|---|---|---|
| A. Batch size (Accuracy) | |||||||
| r4.1 | r4.2 | ||||||
| 16 | 32 | 64 | 16 | 32 | 64 | ||
| 0.854 | 0.912 | 0.985 | 0.875 | 0.926 | 0.991 | ||
| B. Dropouts (Accuracy) | |||||||
|---|---|---|---|---|---|---|---|
| r4.1 | r4.2 | ||||||
| 10 | 20 | 10 | 20 | ||||
| 0.921 | 0.985 | 0.944 | 0.991 | ||||
| C. Epoch (Accuracy) | |||||||
|---|---|---|---|---|---|---|---|
| r4.1 | r4.2 | ||||||
| Training | |||||||
| 50 | 100 | 150 | 200 | 50 | 100 | 150 | 200 |
| 0.801 | 0.865 | 0.917 | 0.972 | 0.841 | 0.887 | 0.936 | 0.989 |
| Validation | |||||||
| 50 | 100 | 150 | 200 | 50 | 100 | 150 | 200 |
| 0.845 | 0.905 | 0.928 | 0.985 | 0.863 | 0.906 | 0.953 | 0.991 |
The performance of the regularized pretrained AGCN was evaluated in terms of accuracy, precision, detection rate, false positive rate, and false negative rate in Eqs. (21–25). The effectiveness of the regularized pretrained AGCN models by fine-tuning the weight of pretrained model without modifying the source of information in pretrained model. It improves the model’s generalization, and adaptation, providing a better normalized performance between the pretrained and fine-tuned pretrained models.
 |
21 |
 |
22 |
 |
23 |
 |
24 |
 |
25 |
The proposed approach was compared with existing graph-based neural network models for insider threat detection are Cyber Human-based Graph Learning Model (CH-GLM)46 has less (0.952) DR, and the accuracy and false alarm rate were not determined. So, it’s difficult to ensure the strength of CH-GLM while detecting the insiders. Spatial–Temporal Graph convolution network (STGCN)47 has (0.958) DR because the model has concentrated only on spatial and temporal features of imbalanced data. Temporal Graph Convolutional Network with Data Augmentation (TGCN-DA)48 has (0.943) better accuracy for balanced insider data. However, the DR determined whether the model’s performance was effective, especially in detecting the insider. Graph convolutional Network based Convolutional Neural Network (GCN-CNN)49 has (0.928) less DR for imbalanced data where the data have not been processed to train the model. Graph Neural Network (GNN) with dual attention mechanism50 has (0.965) accuracy and (0.945) DR; however, the false alarm rate was not computed to prove the model state for ITD. Multi Edge Weight Relational Graph Neural Network (MEWRGNN)25 has (0.07) FNR, which affects the false alarm rate of the ITD. Table 12 shows the proposed approach has a high DR(0.973) with minimal false alarm rate (0.02) FPR and (0.03) FNR compared to all the existing graph-based neural network models while detecting the insiders within the network infrastructure. The proposed approach is experimented with using CMU CERT releases r4.1 and r4.2 based on three different scenarios. The accuracy ensures the approach excellence for identifying the behavioural patterns of users to detect the insiders. Precision depicts the predicted positive values from accuracy, and DR defines the insider occurrences rate compared to all existing graph-based neural network models. The proposed approach has achieved (0.972) accuracy, (0.943) precision, and (0.935) DR for r4.1 and (0.989) accuracy, (0.979) precision, and (0.973) DR for r4.2. It has also reached a minimal false alarm rate by reaching FPR for r4.1 (0.03) and r4.2 (0.02), which incorrectly declare the non-insiders as insiders, and r4.1 (0.04) and r4.2(0.03) for FNR, which incorrectly define the insiders as non-insiders. However, the false alarm rate ensures the effect of the proposed approach while detecting the insiders by identifying the user’s behavioural patterns.
Table 12.
Comparing the proposed approach with existing Graph based neural Network models for ITD.
| Graph based neural network models | Dataset | Performance metric | ||||
|---|---|---|---|---|---|---|
| Accuracy | Precision | DR | FPR | FNR | ||
| CH-GLM46 | Windows host log & behavioural dataset | – | 0.942 | 0.952 | – | – |
| STGCN47 | CMU CERT r4.2 | 0.962 | 0.945 | 0.958 | – | – |
| TGCN-DA48 | CMU CERT r4.2, r6.2 | 0.943 | – | – | – | – |
| GCN-CNN49 | CMU CERT r4.2 | 0.926 | 0.915 | 0.928 | – | – |
| GNN-dual Attention mechanism50 | CMU CERT r4.2 | 0.965 | 0.934 | 0.945 | – | – |
| MEWRGNN25 | CMU CERT r6.2 | 0.903 | 0.912 | 0.903 | 0.06 | 0.07 |
| Proposed approach | CMU CERT r4.1 | 0.972 | 0.943 | 0.935 | 0.03 | 0.04 |
| CMU CERT r4.2 | 0.989 | 0.979 | 0.973 | 0.02 | 0.03 | |
The proposed approach was compared with existing ITD models based on performance metrics such as accuracy, precision and DR for similar CMU CERT dataset is shown in Table 13. Reference49 long short-term memory autoencoder (LSTM-AE) based residual hybrid network (ResHybnet) has graph convolutional network (GCN). Convolutional neural network (CNN) was implemented in r4.2 has less (0.926) accuracy and (0.928) DR that ensures the model is overfitting due to the presence of many layers and parameters which are not appropriately regularised. The data adjusting (DA) strategy and optimized extreme gradient boosting (XGBoost)51 model deployed in r4.2 has decreased performance in terms of (0.965) accuracy, (0.872) precision and (0.957) DR. The XGBoost does not specify complicated user behavioural patterns, which leads to misclassification problems. The machine learning (ML) based anomalous malicious insider threat detection (MITD)52 has experimented in r3.2 where the scenarios of insiders do not exist, which has reduced (0.824) accuracy, (0.648) precision and (0.795) DR is due to the absence of informative sample extraction and ignorance of class imbalance problem. The behaviour rhythm insider threat detection (BRITD)11 was composed of stacked long short-term memory (LSTM) and feedforward neural network (FFNN) was implemented in r6.2 has achieved better (0.973) accuracy and less (0.807) precision. However, the DR was not computed and failed to project the model’s effectiveness. The combined neural network architecture was composed of a stacked convolutional neural network (CNN) and attention-based bidirectional gated recurrent unit (ABiGRU)14 was employed in r4.2 and r6.2 has less (0.926) accuracy and (0.950) DR. Still, the two different releases (r4.2, r6.2) has different scenarios and user activities which are not addressed, and the model has an underfitting issue. The long short-term memory with gray encoding16 executed in r4.2 has deprecation (0.925) accuracy and (0.934) DR due to the presence of class imbalance problem and large dimensional. The random sampling based on various machine learning techniques was trailed in r4.2. However, it reached very low (0.887) accuracy, (0.897) and (0.845) DR due to the generation of random samples where the exact adversarial cannot admit generating leads to have less performance, and the ML techniques face a little difficulty to train the vast data. Compared to all existing ITD models, the proposed approach confirmed its supremacy over each module of HOPGNN arrayed in r4.1 and r4.2. The dimensionality reduction and informative sample selection were done using the Chebyshev graph Laplacian eigenmaps (CGLE) solver-based user-designated sample selection. The r4.1 and r4.2 had similar insider states, so it is formal to deploy density-based spatial clustering of applications with noise (IS-DBSCAN) to cluster the selected user-designated samples depending on insider states. The class imbalance problem is solved using a data augmentation technique called optimized generative adabelief Wasserstein generative adversarial network with expected hypervolume improvement (ABWGAN-EHI). Once the arrival of balanced insider threat data is achieved, the L2-starting point (L2-SP) regularization technique based on pretrained AGCN is used to identify the behavioural patterns of users and detect insiders. Hence, the performance of the proposed model is evaluated in terms of accuracy, precision and DR. For r4.1, the (0.972) accuracy, (0.943) precision and (0.935) DR and r4.2 have reached (0.989) accuracy, (0.979) precision and (0.973) DR. Though, comparing r4.1 and r4.2, the proposed approach works much better for r4.2 in classifying the insiders and non-insiders was due the presence of substantial user activities and insiders.
Table 13.
Comparing the proposed approach with existing ITD models.
| Insider threat detection models | Dataset | Performance metrics | ||
|---|---|---|---|---|
| Accuracy | Precision | DR | ||
| LSTM-AE + ResHybnet (GCN + CNN)49 | CMU CERT r4.2 | 0.926 | 0.915 | 0.928 |
| EPRSO + XGBOOST51 | CMU CERT r4.2 | 0.965 | 0.872 | 0.957 |
| Machine Learning techniques-AMITD52 | CMU CERT r3.2 | 0.824 | 0.648 | 0.795 |
| BRITD (BiLSTM + FFNN)11 | CMU CERT r6.2 | 0.973 | 0.807 | - |
| Combined NN Architecture (stacked CNN + attentionBiGRU)14 | CMU CERT r4.2, r6.2 | 0.926 | 0.956 | 0.950 |
| LSTM with Gray encoding16 | CMU CERT r4.2 | 0.925 | 0.894 | 0.934 |
| Random Sampling + Machine Learning17 | CMU CERT r4.2 | 0.887 | 0.897 | 0.845 |
| Proposed approach | CMU CERT r4.1 | 0.972 | 0.943 | 0.935 |
| Proposed approach | CMU CERT r4.2 | 0.989 | 0.979 | 0.973 |
The proposed optimized generative ABWGAN-EHI model was compared with existing data augmentation techniques such as Generative adversarial Network (GAN) and Wasserstein Generative Adversarial Network (WGAN). Both of these techniques also generate adversarial samples of insider threat data. However, the main disadvantages of these techniques are mode collapse, instability training, less convergence, increased sensitivity hyperparameters, and high computational efficiency. The generated insider samples of GAN and WGAN do not match the real insider threat, affecting the ITD model’s performance. Based on the class imbalanced ratio (CIR), the model is compared to ensure the ITD model’s performance to identify the user behavioural patterns to detect insiders. CIR is defined as the ratio of majority samples of non-insiders to the minority samples of insiders is given in Eq. (26)
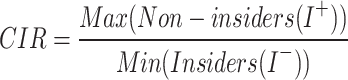 |
26 |
where  is the majority of non-insider samples and
  is the minority of insider samples. When the CIR value is less than or equal to one, it represents a high data imbalance problem. Comparison of GAN and WGAN with proposed approach depending on CIR ratios. The three CIR ratios (90:10, 70:30, 50:50) considered for splitting training (80%), validation (10%), and testing (10%) model of r4.1 and r4.2 dataset, which are evaluated using the performance metrics are Accuracy (ACC), Detection Rate (DR). Table 14 the proposed approach has achieved increased accuracy for r4.1 (0.972) and r4.2 (0.986) and detection rate for r4.1(0.935) and r4.2(0.973) for 50:50 CIR value when compared to GAN and WGAN.
Table 14.
Comparison of GAN and WGAN with proposed approach based on CIR.
| Training (80%), validation (10%), testing (10%) | ||||||||||||
|---|---|---|---|---|---|---|---|---|---|---|---|---|
| CIR | GAN + L2-SP pretrained AGCN | WGAN + L2-SP pretrained AGCN | Proposed approach | |||||||||
| ACC | DR | ACC | DR | ACC | DR | |||||||
| Dataset | r4.1 | r4.2 | r4.1 | r4.2 | r4.1 | r4.2 | r4.1 | r4.2 | r4.1 | r4.2 | r4.1 | r4.2 |
| 90:10 | 0.613 | 0.684 | 0.684 | 0.702 | 0.693 | 0.724 | 0.701 | 0.756 | 0.724 | 0.774 | 0.734 | 0.782 |
| 70:30 | 0.697 | 0.732 | 0.754 | 0.795 | 0.714 | 0.753 | 0.753 | 0.801 | 0.834 | 0.887 | 0.791 | 0.823 |
| 50:50 | 0.794 | 0.836 | 0.801 | 0.852 | 0.793 | 0.842 | 0.793 | 0.856 | 0.972 | 0.989 | 0.935 | 0.973 |
Significant values are in bold.
Various sampling methods and data augmentation techniques have been used to balance the CMU CERT insider threat dataset. Therefore, the most recently used techniques are Copula generative adversarial network (GAN)53,linear manifold learning based auxiliary classifier generative adversarial network (SPCAGAN)54, synthetic minority oversampling technique (SMOTE), Borderline SMOTE, and adaptive synthetic sampling (ADASYN)55, are compared with proposed ABWGAN-EHI to increase the minority insider samples and balance the insider threat samples to detect the insiders by identifying the user’s behavioural patterns. Reference53 developed a deep synthesis-based insider intrusion detection (DS-IID) model for detecting insider and AI-generated threats. Deep feature synthesis (DFS), as a feature extractor and copula theory GAN, was used to solve class imbalance problems with the neural network-based IID model. However, the proposed model failed to provide flexibility while differentiating real and synthetic samples. Reference54 developed a hybrid deep learning model (SPCAGAN) to detect insiders that includes Multilayer perceptron (MLP) and one dimensional convolutional neural network (1DCNN) as feature extraction and probabilistic learning of Bayesian neural network (BNN) as classification method with the data augmentation technique to generate the malicious samples and balance the training samples to improve the performance of the hybrid deep learning model with increased detection rate. However, the performance of SPCAGAN has a linear intrinsic dimension, which is not flexible to high dimensional data, leading to unstable model training and mode collapse problems. Reference55 proposed a sampling technique are SMOTE, Borderline SMOTE, and ADASYN to generate the malicious samples and balance data to train the Convolutional Neural Network (CNN) model to detect the insider. However, the performance of the augmented data to train the CNN model is complex to detect the insider with a low accuracy SMOTE CNN (0.945), Borderline SMOTE CNN (0.897), and ADASYN (0.964) due to the augmentation model having high overfitting issues and adapt to complicated boundaries.
To overcome the challenges of the existing augmentation and sampling method, the proposed optimized generative ABWGAN-EHI model generates the minority insider samples with improved generalization high stability to complex data and robust to proceed with L2-SP regularized pretrained AGCN to detect the insiders by identifying the user’s behavioural patterns. Figure 17 shows the proposed ABWGAN-EHI has achieved a maximum accuracy of 0.989 in simultaneous training with regularized pretrained AGCN compared to existing oversampling techniques, has reached accuracy (0.945) for SMOTE, (0.897) for Borderline SMOTE and (0.964) ADASYN while training with CNN for 100 epochs. The data augmentation technique SPCAGAN have trained with hybrid model for 300 reached 0.897 accuracy due to higher epoch leading to increased computation time.
Fig. 17.

Comparison of proposed optimized generative model with existing data augmentation and sampling methods.
Three quality checks between insider threat detection (ITD) and traditional malicious traffic detection (TMTD)
The three different quality checks are similarity, difference and overlap used to identify whether the threat is internal or external. The common factors of ITD and traditional malicious traffic detection (TMTD) are considered under the similarity check. Considering the list of factors to differentiate the ITD and TMTD is taken for differential check and the final check is overlap where some factors are interfered in both ITD and traditional malicious traffic detection. Some of the common factors of ITD and TMTD are data resources, methodology and indicator of Compromise (IoC) are explained in Table 15. The difference between ITD and TMTD are described based on malicious actor, user behaviour profile, accessibility, data coarseness, stealth, identification and detection complications are listed in Table 16. Table 17 shows the factors of overlapping in ITD and TMTD are APT, SIEM, UEBA and lateral movement.
Table 15.
Similarities in ITD and TMTD.
| Factors | Description |
|---|---|
| Aim | The main aim of ITD and TMTD is to find the illegal and unusual activities which negotiate system security |
| Data resources | System logs, network traffic logs and file access records |
| Methods | Anomaly based detection |
| Indicators of Compromise (IoCs) | Rare login times, frequent admittance to sensitive records, Huge data transfer using mail\USB56 |
Table 16.
Difference between ITD and TMTD.
| Factors | ITD | TMTD |
|---|---|---|
| Malicious actor | Authorized Users (Internal attackers) | Unauthorized Users (External attackers) |
| User behaviour profile | Employee abnormal activities | Unusuality in data flow in network |
| Accessibility | Insiders have legal credentials and provisions | Attackers frequently achieved through vulnerabilities |
| Data coarseness | User behavioural data of an multidomain organisation i.e. (logs, device and file access, email, http) | Data considered from the network are packet captures (PCAP), netflow, firewall logs, DNS logs, proxy logs and sys logs57 |
| Stealth | Long term activity in terms conceptual and temporal features | Abrupt and noisy |
| Identification and detection complications | High complex to detect due to subsidence of normal user activities | Simple to detect58 |
Table 17.
Overlap in ITD and TMTD.
| Factors | ITD | TMTD |
|---|---|---|
| Advanced Persistent Threat (APT) |
APT can be an insider threat but Insider threat cannot be APT In six stages of APT, insider has its foot prints in any two or three stages |
In six stages of APT, the external positions are present in any two or three stages |
| SIEM System and Intrusion detection system | ITD supports for both shared and adaptable infrastructure in | TMTD also supports for both shared and adaptable infrastructures |
| User and Entity Behavioural Analytics (UEBA) | Construct anomaly-based detection and signature-based detection | Construct anomaly-based detection and signature-based detection, |
| Lateral movement Detection | Access within boundaries includes the process of lateral movement detection | Malicious protocols fall within network access boundaries include lateral movement59 |
Similarities in ITD and TMTD
Difference between ITD and TMTD
Overlap in ITD and TMTD
Conclusion
The sudden rise of insider attacks within a network infrastructure significantly affects live corporate and institutional activities. This scenario motivates cybersecurity researchers to develop efficient insider threat detection models to secure network infrastructure from the malicious activities of insiders. Henceforth, the Hybrid optimized generative pretrained neural network approach has been proposed for discourse effective continuous insider threat detection (HOGPNN-ITD)—the Chebyshev graph Laplacian eigenmaps solver (CGLE) for extracting time aggregated user designated samples, thereby achieving dimensionality reduction. The Adabelief optimizer-based Wasserstein generative adversarial network with Expected Hypervolume Improvement (ABWGAN-EHI) generates adversarial samples with an optimal convergence rate and maintains the stability and generalizability of the model. The generated data are validated and combined with minority insider samples, which have the same distribution, and the balanced samples are used for training the L2-SP regularized pretrained AGCN to identify the user behavioural pattern to detect the insiders. Compared with the existing models, the proposed approach is superior in terms of accuracy (0.989), precision (0.979), detection rate (0.973), false positive rate (0.02) and false negative rate (0.03). The HOGPNN-ITD approach efficiently detects insiders and performs well for highly-equipped network infrastructure. It can also be deployed to secure cyber-physical systems and other defense systems from insiders. However, the simple limitations of the proposed approach are that it is complex in terms of diverse locations and non-existent interpretation. In the future, the proposed approach can be employed to select the optimal samples of all high-dimensional data and generate samples to address data imbalance in real-time applications such as object detection, image classification, semantic segmentation, and natural language processing.
Acknowledgements
This work is a part of R&D project funded by Ministry of Electronics and Information Technology (MeitY), India (AAA-22/6/2024-CSRD).
Author contributions
Lavanya P.: Conceptualization, Data curation, Formal analysis, Investigation, Methodology, Validation, Visualization, Writing—review & editing. Anila Glory H.: Formal analysis, Writing, Review & Editing. Dr Manuj Aggarwal.: Supervision, Validation, Writing—review & editing. Shankar Sriram V.S.: Formal analysis, Funding acquisition, Investigation, Project administration, Resources, Software, Supervision, Validation, Writing—review & editing.
Data availability
The dataset used for experimentation is available at https://kilthub.cmu.edu/articles/dataset/Insider_Threat_Test_Dataset/12841247 (accessed on 03-03-2024).
Competing interests
The authors declare no competing interests.
Footnotes
Publisher’s note
Springer Nature remains neutral with regard to jurisdictional claims in published maps and institutional affiliations.
References
- 1.Nyarko-Boateng, O., Nti, I. K., Mensah, A. A. & Gyamfi, E. K. Controlling user access with scripting to mitigate cyber-attacks. Sci. African26, e02355 (2024). [Google Scholar]
- 2.https://www.cisa.gov/topics/physical-security/insider-threat-mitigation/defining-insider-threats. (Accessed on 20 Nov 2024)
- 3.https://www.kroll.com/en/insights/publications/cyber/threat-intelligence-reports/q1-2024-threat-landscape-report-insider-threat-phishing-evolve-under-ai Accessed on Nov 2024
- 4.https://www.securonix.com/resources/2024-insider-threat-report/ Accessed on 20 Nov 2024
- 5.https://pages.securonix.com/rs/179-DJP-142/images/2019-Insider-Threat-Report-Securonix.pdf Accessed on 20 Nov 2024
- 6.Alzaabi, F. R. & Mehmood, A. A review of recent advances, challenges, and opportunities in malicious insider threat detection using machine learning methods. IEEE Access12, 30907–30927 (2024). [Google Scholar]
- 7.Jaiswal, A., Dwivedi, P. and Dewang, R.K., (2024). Machine learning approaches to detect, prevent and mitigate malicious insider threats: State-of-the-art review. Multimedia Tools Appl. 1–41.
- 8.Mladenovic, D. et al. Sentiment classification for insider threat identification using metaheuristic optimized machine learning classifiers. Sci. Rep.14(1), 25731 (2024). [DOI] [PMC free article] [PubMed] [Google Scholar]
- 9.Yuan, S. & Wu, X. Deep learning for insider threat detection: Review, challenges and opportunities. Comput. Secur.104, 102221 (2021). [Google Scholar]
- 10.https://kilthub.cmu.edu/articles/dataset/Insider_Threat_Test_Dataset/12841247 (Accessed on 3 March 2024)
- 11.Song, S., Gao, N., Zhang, Y. & Ma, C. BRITD: Behavior rhythm insider threat detection with time awareness and user adaptation. Cybersecurity7(1), 2 (2024). [Google Scholar]
- 12.Tao, X., Lu, S., Zhao, F., Lan, R., Chen, L., Fu, L. & Jia, R., (2024). User behavior threat detection based on adaptive sliding window GAN. in IEEE Transactions on Network and Service Management.
- 13.Wei, Z., Rauf, U. & Mohsen, F. (2024). E-Watcher: Insider threat monitoring and detection for enhanced security. Ann. Telecommun. 1–13.
- 14.Anju, A. & Krishnamurthy, M. (2024). M-EOS: Modified-equilibrium optimization-based stacked CNN for insider threat detection. Wireless Netw. 1–20.
- 15.Pal, P., Chattopadhyay, P. & Swarnkar, M. Temporal feature aggregation with attention for insider threat detection from activity logs. Expert Syst. Appl.10.1016/j.eswa.2023.119925 (2023). [Google Scholar]
- 16.AlSlaiman, M., Salman, M. I., Saleh, M. M. & Wang, B. Enhancing false negative and positive rates for efficient insider threat detection. Comput. Security.10.1016/j.cose.2022.103066 (2023). [Google Scholar]
- 17.Al-Shehari, T. & Alsowail, R. A. Random resampling algorithms for addressing the imbalanced dataset classes in insider threat detection. Int. J. Inf. Secur.22(3), 611–629. 10.1007/s10207-022-00651-1 (2023). [Google Scholar]
- 18.Randive, K. D. & Ramasundaram, M. MWCapsNet: A novel Multi-level Wavelet Capsule Network for insider threat detection using image representations. Neurocomputing553, 126588. 10.1016/j.neucom.2023.126588 (2023). [Google Scholar]
- 19.Chattopadhyay, P., Wang, L. & Tan, Y. P. Scenario-based insider threat detection from cyber activities. IEEE Trans. Comput. Social Syst.5(3), 660–675. 10.1109/TCSS.2018.2857473 (2018). [Google Scholar]
- 20.Zou, S., Sun, H., Xu, G., & Quan, R. (2020). Ensemble strategy for insider threat detection from user activity logs. Comput. Mater. Continua. 65(2), 1321–1334. 10.32604/cmc.2020.09649
- 21.Yuan, F., Shang, Y., Liu, Y., Cao, Y., & Tan, J. (2020). Data augmentation for insider threat detection with GAN. in Proceedings—International Conference on Tools with Artificial Intelligence, ICTAI, 2020-November, 632–638. 10.1109/ICTAI50040.2020.00102
- 22.Le, D. C., Zincir-Heywood, N. & Heywood, M. I. Analyzing data granularity levels for insider threat detection using machine learning. IEEE Trans. Netw. Serv. Manage.17(1), 30–44. 10.1109/TNSM.2020.2967721 (2020). [Google Scholar]
- 23.Hu, T. et al. An insider threat detection approach based on mouse dynamics and deep learning. Security Commun. Netw.10.1155/2019/3898951 (2019). [Google Scholar]
- 24.Nasir, R., Afzal, M., Latif, R. & Iqbal, W. Behavioural based insider threat detection using deep learning. IEEE Access9, 143266–143274. 10.1109/ACCESS.2021.3118297 (2021). [Google Scholar]
- 25.Xiao, J. et al. Robust anomaly-based insider threat detection using graph neural network. IEEE Trans. Netw. Serv. Manage.10.1109/TNSM.2022.3222635 (2022). [Google Scholar]
- 26.Akwei, B., Atkins, B., Bailey, R., Dalal, A., Dinin, N., Kerby-White, J., McGuinness, T., Patricks, T., Rogers, L., Romanelli, G. & Su, Y. (2024). Convergence, optimization and stability of singular eigenmapss. arXiv preprint arXiv:2406.19510.
- 27.Sahbi, H., 2021. Learning laplacians in chebyshev graph convolutional networks. in Proceedings of the IEEE/CVF International Conference on Computer Vision (pp. 2064–2075).
- 28.Sahbi, H., 2021. Learning Chebyshev basis in graph convolutional networks for skeleton-based action recognition. arXiv preprint arXiv:2104.05482.
- 29.Arena, P., Patanè, L. & Spinosa, A. G. Robust modelling of binary decisions in Laplacian Eigenmapss-based Echo State Networks. Eng. Appl. Artif. Intell.10.1016/j.engappai.2020.103828 (2020). [Google Scholar]
- 30.Levin, K. & Lyzinski, V. Laplacian eigenmaps from sparse, noisy similarity measurements. IEEE Trans. Signal Process.65(8), 1988–2003 (2016). [Google Scholar]
- 31.Xie, W., Wang, H., Feng, Z. & Ma, C. (2024). A novel PHY-layer spoofing attack detection scheme based on WGAN-encoder model. IEEE Trans. Inform. Forensics Security.
- 32.Abou-Abbas, L., Henni, K., Jemal, I. & Mezghani, N. Generative AI with WGAN-GP for boosting seizure detection accuracy. Front. Artif. Intell.7, 1437315 (2024). [DOI] [PMC free article] [PubMed] [Google Scholar]
- 33.Natarajan, S., Kurian, S., Bidare Divakarachari, P. & Falkowski‐Gilski, P. (2024). An automated learning model for twitter sentiment analysis using Ranger AdaBelief optimizer based Bidirectional Long Short Term Memory. Expert Syst. e13610.
- 34.Mei, L. & Dawei, Z. (2024). Pointwise expected hypervolume improvement for expensive multi-objective optimization. J. Glob. Optimization. 1–27.
- 35.Chen, X., Chen, Z., Chen, S., Wang, L. & Zhai, W. (2024). Unsupervised GAN with fine-tuning: A novel framework for induction motor fault diagnosis in scarcely labeled sample scenarios. IEEE Trans. Instrument. Meas.
- 36.Wang, Y., Liu, J., Chang, X., Wang, J. & Rodríguez, R. J. AB-FGSM: AdaBelief optimizer and FGSM-based approach to generate adversarial examples. J. Inform. Security Appl.10.1016/j.jisa.2022.103227 (2022). [Google Scholar]
- 37.Zhang, J., Sugisawa, N., Felton, K. C., Fuse, S. & Lapkin, A. A. Multi-objective Bayesian optimisation using q-noisy expected hypervolume improvement (q NEHVI) for the Schotten-Baumann reaction. Reaction Chem. Eng.9(3), 706–712 (2024). [Google Scholar]
- 38.Xiao, B., Ni, H. and Yang, W., 2024. MCGAN: Enhancing GAN Training with Regression-Based Generator Loss. arXiv preprint arXiv:2405.17191.
- 39.Jamali, A., Roy, S.K., Hong, D., Atkinson, P.M. & Ghamisi, P. (2024). Attention graph convolutional network for disjoint hyperspectral image classification. IEEE Geosci. Remote Sens. Lett.
- 40.Xu, C. et al. A joint hierarchical cross-attention graph convolutional network for multi-modal facial expression recognition. Comput. Intell.40(1), e12607 (2024). [Google Scholar]
- 41.Harvey, E., Petrov, M. and Hughes, M.C. (2024). Learning the regularization strength for deep fine-tuning via a data-emphasized variational objective. arXiv preprint arXiv:2410.19675.
- 42.Jeon, M., Park, G. M. & Hwang, H. Fisheye object detection with visual prompting-aided fine-tuning. Remote Sensing16(12), 2054 (2024). [Google Scholar]
- 43.Soh, C., Yu, S., Narayanan, A., Duraisamy, S. & Chen, L. Employee profiling via aspect-based sentiment and network for insider threats detection. Expert Syst. Appl.135, 351–361. 10.1016/j.eswa.2019.05.043 (2019). [Google Scholar]
- 44.Wasko, S. et al. Using alternate reality games to find a needle in a haystack: An approach for testing insider threat detection methods. Comput. Security.10.1016/j.cose.2021.102314 (2021). [Google Scholar]
- 45.Brownlee, J. Develop deep learning models on theano and TensorFlow using keras. J. Chem. Inf. Model53(9), 1689–1699 (2019). [Google Scholar]
- 46.Roy, K.C. & Chen, G. (2024). GraphCH: A deep framework for assessing cyber-human aspects in insider threat detection. IEEE Trans. Dependable Secure Comput.
- 47.Mohanraj, S.K., Sivakrishna, A.M. & Mohan, R. Spatio-temporal graph neural networks for enhanced insider threat detection in organizational security.
- 48.Li, X., Li, L., Li, X., Cai, B. & Li, B. (2023). TGCN-DA: A temporal graph convolutional network with data augmentation for high accuracy insider threat detection. in 2023 IEEE 22nd International Conference on Trust, Security and Privacy in Computing and Communications (TrustCom) (pp. 1249–1257). IEEE.
- 49.Hong, W. et al. A graph empowered insider threat detection framework based on daily activities. ISA Trans.141, 84–92 (2023). [DOI] [PubMed] [Google Scholar]
- 50.Tian, T., Gong, Y., Jiang, B., Liu, J., Feng, H. & Lu, Z. (2023). Insider threat detection based on heterogeneous graph neural network. in 2023 IEEE 22nd International Conference on Trust, Security and Privacy in Computing and Communications (TrustCom) (pp. 628–635). IEEE.
- 51.Kan, X. et al. Data adjusting strategy and optimized XGBoost algorithm for novel insider threat detection model. J. Franklin Inst.360(16), 11414–11443. 10.1016/j.jfranklin.2023.09.004 (2023). [Google Scholar]
- 52.Asha, S., Shanmugapriya, D. & Padmavathi, G. Malicious insider threat detection using variation of sampling methods for anomaly detection in cloud environment. Comput. Electr. Eng.105, 108519 (2023). [Google Scholar]
- 53.Kotb, H. M., Gaber, T., AlJanah, S., Zawbaa, H. M. & Alkhathami, M. A novel deep synthesis-based insider intrusion detection (DS-IID) model for malicious insiders and AI-generated threats. Sci. Rep.15(1), 207 (2025). [DOI] [PMC free article] [PubMed] [Google Scholar]
- 54.Gayathri, R. G., Sajjanhar, A. & Xiang, Y. Hybrid deep learning model using SPCAGAN augmentation for insider threat analysis. Expert Syst. Appl.249, 123533 (2024). [Google Scholar]
- 55.Al-Shehari, T. et al. Comparative evaluation of data imbalance addressing techniques for CNN-based insider threat detection. Sci. Rep.14(1), 24715 (2024). [DOI] [PMC free article] [PubMed] [Google Scholar]
- 56.Yuan, Q. et al. Mcre: A unified framework for handling malicious traffic with noise labels based on multidimensional constraint representation. IEEE Trans. Inf. Forensics Secur.19, 133–147 (2023). [Google Scholar]
- 57.Meng, Q., Yuan, Q., Niu, W., Wang, Y., Lu, S., Li, G., Wang, X. & He, W. (2024). IIT: Accurate decentralized application identification through mining intra-and inter-flow relationships. IEEE Trans. Netw. Service Manag.
- 58.Cai, S., Tang, H., Chen, J., Lv, T., Zhao, W. & Huang, C. (2025). GSA-DT: A malicious traffic detection model based on graph self-attention network and decision tree. IEEE Trans. Netw. Service Manag.
- 59.Chen, Z., Xia, W., Li, Z., Xiong, G., Gou, G., Zhang, H., Li, H. & Xiao, J. (2025). HoleMal: A lightweight IoT malware detection framework based on efficient host-level traffic processing. Comput. Security. 104360.
Associated Data
This section collects any data citations, data availability statements, or supplementary materials included in this article.
Data Availability Statement
The dataset used for experimentation is available at https://kilthub.cmu.edu/articles/dataset/Insider_Threat_Test_Dataset/12841247 (accessed on 03-03-2024).