

Abstract
Metabolic incorporation of chemically tagged monosaccharides is a facile means of labeling cellular glycoproteins and glycolipids. However, since the monosaccharide precursors are often shared by several pathways, selectivity has been difficult to attain. For example, N-linked glycosylation is a chemically complex and ubiquitous post translational modification, with three distinct classes of GlcNAc-containing N-glycan structures: oligomannose, hybrid, and complex. Here we describe the synthesis of 1,3-Pr2-6-OTs GlcNAlk as a next generation metabolic chemical reporter (MCR) for the specific labeling of hybrid N-glycan structures. We first developed a general strategy for defining the selectivity of labeling with chemically tagged monosaccharides. We then applied this approach to establish that 1,3-Pr2-6-OTs GlcNAlk is specifically incorporated into hybrid N-glycans. Using this MCR as a detection tool, we carried out imaging experiments to define the intracellular localization and trafficking of target proteins bearing hybrid N-glycan structures.
Keywords: Bioorthogonal chemistry; 1,3-Pr2-6-OTs GlcNAlk; Enzymatic labeling; Hybrid N-Glycan; Fibrillarin nuclear protein
Introduction
Glycans are present in cells as covalent attachments to biomolecules like proteins (glycoproteins), peptides (peptidoglycans) and lipids (glycolipids). Glycosylation is a ubiquitous post translational modification (PTM). There are more than 200 glycosyltransferases and glycan-processing enzymes, which are largely compartmentalized in the endoplasmic reticulum (ER) and the Golgi apparatus.1 It is estimated that 50–70% of all proteins and more than 85% of secretory proteins undergo glycosylation in a sequential and concerted order within the ER and Golgi apparatus1. These glycosylation events have functional implications for protein folding, trafficking, and the degradation of misfolded proteins.2 The two major glycosidic linkages to proteins involve either oxygen in the side chain of serine or threonine (O-linked glycans), or nitrogen in the side chain of asparagine (N-linked glycans). Additionally, proteins can be attached to the cellular membrane by a linkage between the carboxyl-terminal group and a glycophosphatidylinositol (GPI) anchor. Gangliosides containing sialic acid and other glycolipids are a type of lipid glycosylation. Intracellular proteins can also be modified by O-GlcNAc,3 wherein O-GlcNAc transferase (OGT) uses the uridine diphosphate sugar donor, UDP-GlcNAc, to add a single monosaccharide GlcNAc to Ser/Thr of intracellular proteins.4 O-GlcNAc can be subsequently removed by O-GlcNAcase (OGA), rendering O-GlcNAcylation dynamic.4 On the other hand, N-linked glycosylation is a process in which the ER membrane resident enzyme oligosaccharyltransferase (OST) complex mediates an en bloc transfer of the oligosaccharide portion of the lipid-linked oligosaccharide (Dol-PP-GlcNAc2Man9Glc3) onto the acceptor asparagine of nascent proteins, defined by the consensus sequence Asn-X-Thr/Ser (X ≠ Pro). The protein-linked glycan structure is then further processed and chemically derivatized.5 Protein modifications by N- or O-glycans can modulate the protein’s biophysical properties and consequently regulate function.6
N-glycans that are covalently linked to proteins are involved in a myriad of biological processes including amendment of protein folding,7 ER quality control and trafficking to the cell surface,7 regulation of protein orientation and stability, oligomerization and aggregation,7 modulation of enzyme activity,8 host cell-surface interactions,9 viral infection with viruses like HIV,9 influenza,9 and SARS-CoV-2,9 and modifying small RNAs.10 There are three types of N-glycan structures: oligomannose, hybrid, and complex structures. Oligomannose N-glycan structure (Glc3Man9GlcNAc2-Asn) is cleaved to the Man5GlcNAc2-Asn processing hybrid and further subjected to a complex series of branching, trimming and extension reactions to generate the complex type of N-glycans.8 The biological roles of complex and oligomannose glycans have been the subject of numerous investigations. However, specific or differential roles of hybrid N-glycans are currently unclear.11 Until specific roles are identified, these hybrid N-glycan structures are considered ‘intermediates’ on the pathway between the oligomannose glycans formed in the ER and the complex glycan structures produced in the Golgi apparatus.12 Currently, there are no available tools to specifically detect and study hybrid type N-glycans. The biological importance of dissecting the physiological role of the various glycan structures is underscored by the fact that hybrid/complex N-glycans are essential to embryonic development, as N-acetylglucosaminyltransferase (GlcNAcT-I, MGAT1, GnTI) deficient mice are embryonic lethal.13
Recent efforts towards the development of methods to study biomolecules in their native environment have employed the tools of bioorthogonal chemistry.14 Bioorthogonal chemistry typically involves a two-step strategy: first the enzymatic incorporation of the metabolic chemical reporter (MCR), followed by bioorthogonal labeling of the MCR with fluorophores or affinity tags.15 To date, the most commonly used bioorthogonal reaction is the “click” reaction between metabolically incorporated azide or alkyne derivatives and their counter fluorophore.16–18 The use of bioorthogonal sugars has helped to increase our understanding of glycosylations.18–21 Functional group modifications around the sugar hydroxyl groups are tolerated by the biosynthetic pathways that transform them into their corresponding sugar-nucleotide donor. Glycosyltransferases can utilize these unnatural monosaccharide donors for glycosylation of proteins. For example, OGT can use a sugar donor containing the reactive azide group (UDP-GlcNAz) to deposit an O-GlcNAz modification onto intracellular proteins.19 Recently, bioorthogonal sugars have also been employed in order to exploit salvage pathways to determine if their permissive nature extends to smaller chemically modified groups along the 2-acetamido group of GlcNAc on MCRs. These MCRs have proven widely useful for assessing O-GlcNAcylated proteins,22 mapping O-GlcNAc to the genome,21 imaging O-GlcNAcylated proteins in situ,21 and uncovering fundamental biology.23,24 However, no MCR has been developed for selective incorporation into N-linked glycans. Design and synthesis of selective MCRs for N-linked glycans have proven difficult due to the overlap of common monosaccharide building blocks in the glycan assembly, as well as inefficient turn-over by salvage pathway enzymes.21 Only one successful example comes from the incorporation of GlcNAlk and GlcNAz onto N-glycans in yeast.25 The use of bioorthogonal chemistry to study glycosylation has proven to be an integral tool for the field, even allowing for the discovery of new classes of glycans, like glycosylated small RNAs.10
Continuing previous efforts using bioorthogonal sugars14,15,26–30, here we report the synthesis of a next generation MCR for the specific labeling of hybrid N-glycan structures. We carried out a series of N-glycan trimming pathway inhibitory experiments along with MGAT1 alteration experiments to demonstrate that this MCR is both specifically and enzymatically incorporated into hybrid N-linked structures. Surprisingly, we find a significant amount of hybrid N-glycans in the nucleus. We also identify that the nucleolar protein fibrillarin is being modified with hybrid N-glycan structures. To our knowledge, this is the first MCR specifically labeling N-glycan hybrid structures. This MCR should allow for a more detailed analysis of the biogenesis and intracellular fate of hybrid N-linked glycans.
Results
Synthesis of 1,3-Pr2-6-OTs GlcNAlk (MM-JH-1, 6) and enzymatic incorporation in numerous cell lines
Bioorthogonal sugars, including those labeled by azides and alkynes, have shown utility for identifying glycosylated proteins in both tissue culture cells and whole organisms.15 While MCRs have great potential as tools for studying glycans, it has been reported that all commonly used MCRs are shared by multiple different glycosidic modifications, and undergo non-enzymatic S-glyco modification. Because of these off-target incorporations, these unnatural monosaccharides are not ideal for specific metabolic glycan labeling.31 Recently,1,3-di-O-acylated GalNAz (1,3-Ac2GalNAz and 1,3-Pr2GalNAz) compounds were reported to be more specific towards glycan labeling, with higher membrane permeability. Notably, the 1- and 3-hydroxyl group protected with a longer alkyl chain, i.e. a propionyl group, showed better membrane permeability and a lower acyl migration tendency compared to its acetate protected analogue.31 The corresponding GlcNAlk derivative 1,3-Pr2 GlcNAlk was reported to be resistant to the action of the HBP enzyme UDP-GlcNAc phosphorylase (AGX1 or AGX2).32 Bulkiness of the alkyne functionality generates a ‘bump’ and only a customized ‘hole’ in the mutagenized AGX1F383G accommodates this modification for cellular incorporation. However, there are reports of alkyne modified MCRs getting metabolically converted by AGX, and generating their corresponding UDP-sugar donors.33,34 Advanced intermediates of MCRs that can bypass N-acetylglucosamine-phosphate mutase (AGM1), which isomerizes GlcNAc-6-P to GlcNAc-1-P, can accommodate even larger functional group modifications on the N-acetyl position.35 A notable cell line dependent buildup of UDP-GlcNAlk was detected by Batt et al.36 We hypothesized that protecting the 6-hydroxyl group with a p-toluene sulfonyl (Tosyl) group would increase the substrate hydrophobicity, and hence membrane permeability. Moreover, the protected 6-hydroxyl group on the MCR can circumvent GlcNAc-6-P formation, or its transformation to GlcNAc-1-P through conventional interactions with AGM1. Additionally, in the presence of endogenous cofactor GlcNAc-6-P, MCRs without 6-hydroxyl groups can be directly phosphorylated by AGM1 to generate their corresponding GlcNAc-1-P derivatives,37 and bypass the GNK biosynthetic-roadblock. p-Toluene sulfonyl (Tosyl) groups had previously been used for ligand directed metabolic labeling of proteins,38 and the 6-OTs derivative of D-galactose specifically was described as chemically analogous to the enzyme bound intermediate that leads to the formation of the corresponding 6-phosphate.39 Thus, we chemically synthesized 2-deoxy-2-N-pentynoylamide-1,3-di-O-propionyl-6-O-tosyl-D-glucopyranoside (1,3-Pr2-6-OTs GlcNAlk, 6). GlcNAlk (2) was converted to 1,3-Pr2-6-OTs GlcNAlk (MM-JH-1, 6) through one-pot sequential functional group modifications (Figure 1a, for detailed experimental procedures, see materials and methods section) resulting in the final product with a 56.8% overall yield. HRMS analysis ([M+Na]+ calculated for C24H31O10NSNa 548.1566 and found 548.1567; Mass of oxocarbenium ion calculated for C21H26O8NS+ 452.1 and found 452.2). Detailed NMR spectral analysis showed peaks for two (2) doublet protons (4 protons total) in the aromatic region (7–8 ppm) and a -CH3 peak at 21.6 ppm in the 13C NMR, indicating a p-Me substituted aromatic ring. Additionally, a hydroxyl proton signal at 3.04 ppm with H-4 signal was found, unambiguously confirming the formation of the 4-hydroxyl group free 6-OTs protected GlcNAlk derivative 6 (Supplemental fig. 1 and 2).
Figure 1.
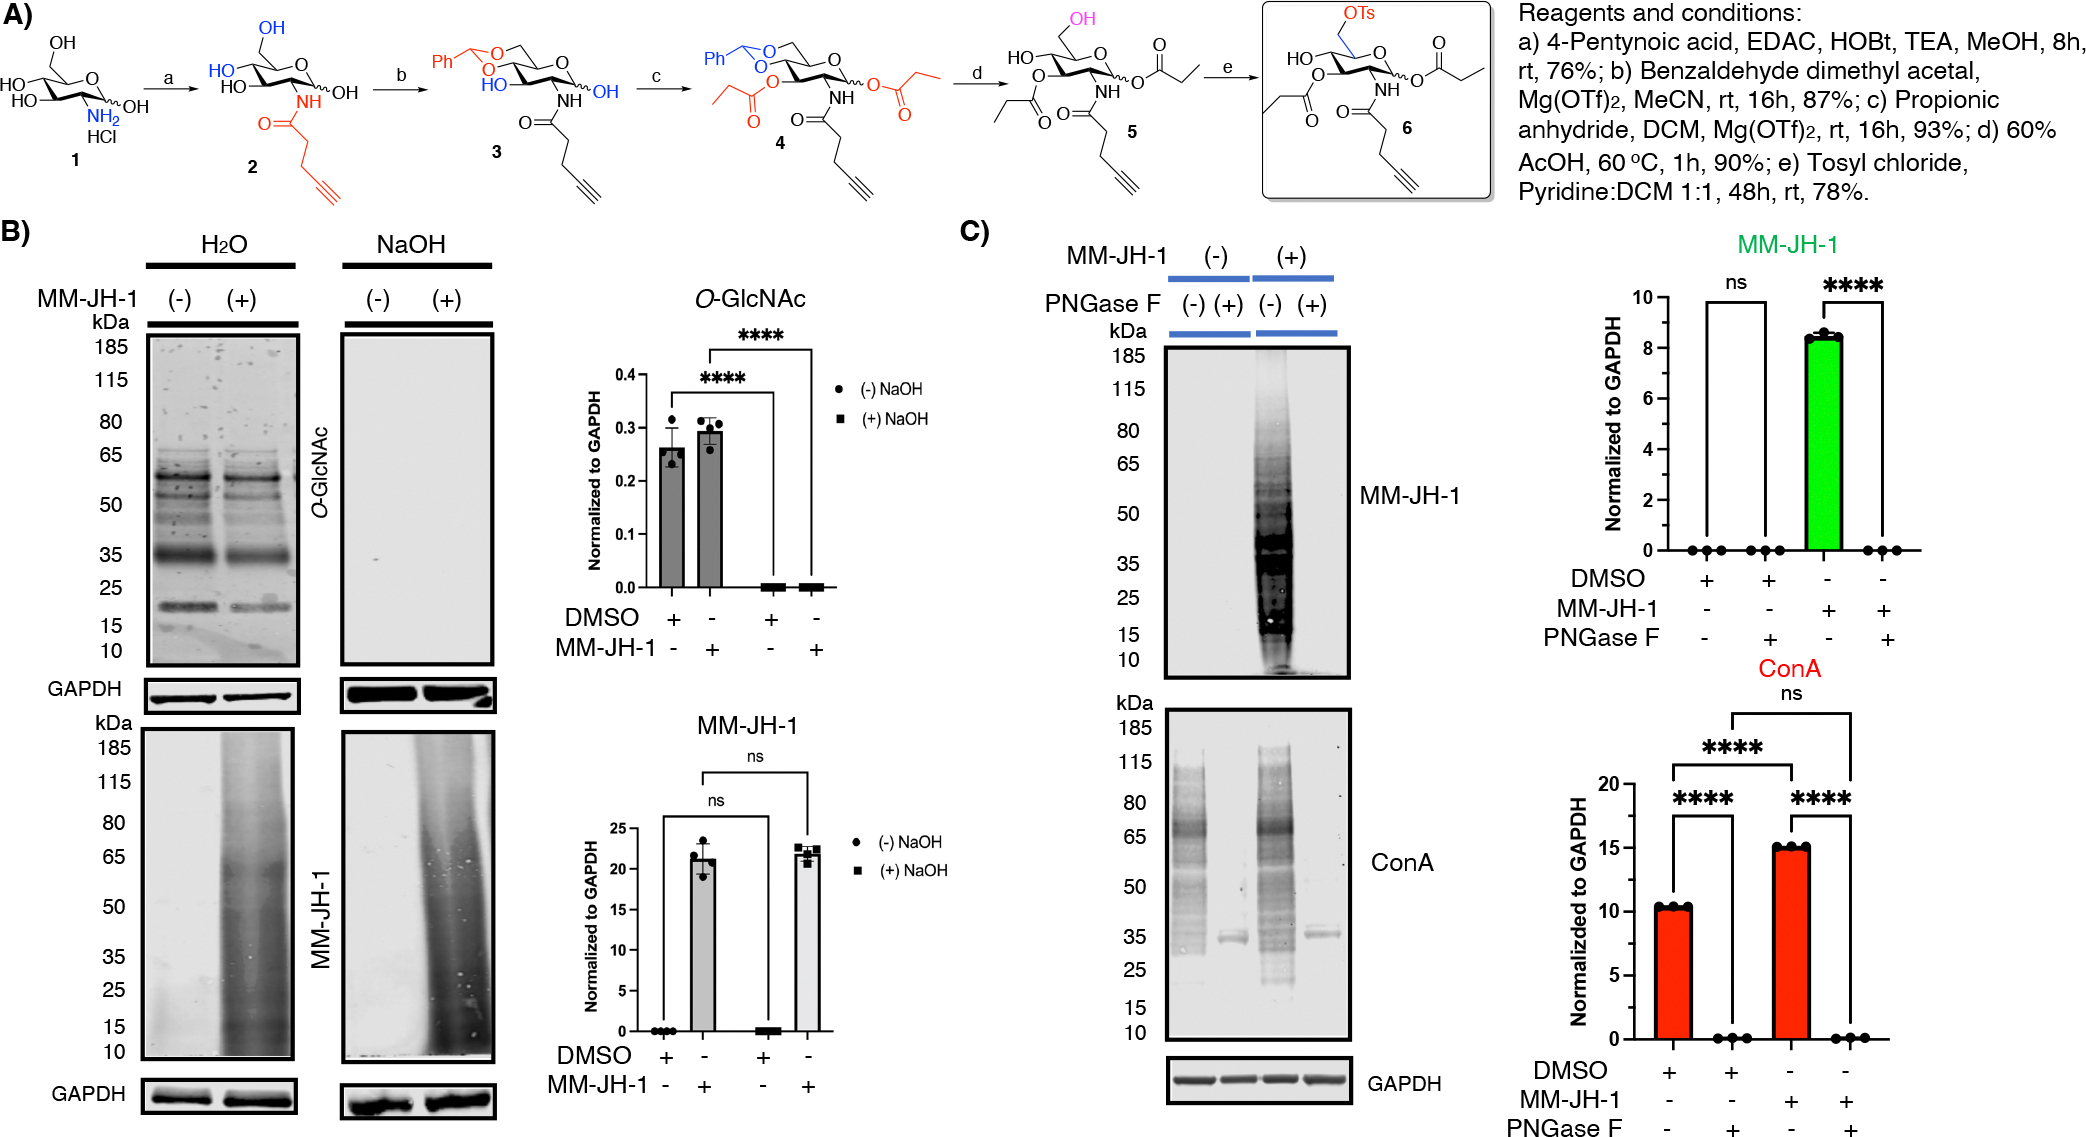
Compound MM-JH-1 was specific to N-linked glycosylation (A) Chemical synthesis of the title compound MM-JH-1. (B) β-elimination study shows that the labeling is not O-linked, as MM-JH-1 (detected with FTIC or TAMRA antibody) signal remains unchanged after incubation with NaOH. Assessment of O-GlcNAc (detected with RL2 antibody, MA-1072) was used as a control to ensure successful β-elimination. Graphs showing quantification of signal are to the right of the respective blots (N = 4; An ordinary one-way ANOVA test shows ****p < 0.0001, ns = not significant, error bar represents standard deviation). (C) PNGase F treatment removed the MM-JH-1 labeled signals (detected with FTIC or TAMRA antibody). Loss of total lectin binding proteins (detected with ConA signal) implied that the PNGase F treatment properly removed the N-glycans. Graphs showing quantification of signal are to the right of the respective blots (N = 3; An ordinary one-way ANOVA test shows ****p < 0.0001, ns = not significant, error bar represents standard deviation).
With this compound in hand, we next evaluated cytotoxicity as well as the extent of incorporation inside cells. Cytotoxicity as well as the extent of metabolic incorporation of the GlcNAlk compound (MM-JH-1) were evaluated by treating various cell lines like HeLa, mouse embryonic fibroblast (MEF), MCF7, COS7, NIH 3T3 and HEK 293T with varying concentrations of compound for 48 hours (Supplemental fig. 3 and 4). To assess incorporation, we performed a click reaction on lysates from DMSO or MM-JH-1 treated cells with Tetramethylrhodamine (TRITC or TAMRA)-azide, and the labeled proteins were detected using an anti-TRITC (TAMRA) antibody. In all cell lines, increasing concentrations of MM-JH-1 resulted in significantly higher incorporation in a concentration-dependent manner (detected with anti-TRITC or TAMRA antibody) in the range of 25–500 μM (Supplemental fig. 3 and 4), with no considerable cytotoxicity (Supplemental fig. 4H). Detection of MM-JH-1 depended on the method of cell pellet collection (trypsin digestion versus physical scraping), and the extent of labeling largely varied by cell line, corroborating the established literature indicating that MCRs exhibit cell-type specific metabolism and glycan labeling.36 Due to the significant amount of metabolic incorporation with no significant cytotoxicity, 100 μM concentrations of MM-JH-1 were chosen for further studies in HeLa cells.
In a recent report, the 1,3-Pr2-GlcNAlk analogue was reported as being too bulky to be metabolized by the endogenous hexosamine biosynthetic pathway (HBP), and the mutation of the enzyme UDP-GlcNAc phosphorylase (AGX2) was essential for its metabolic incorporation.32 However, when we treated WT HeLa cells (without any mutation in the HBP pathway) with the same MCR (1,3-Pr2-GlcNAlk) for 48 hours (much longer period of incubation compared to the reported work of 16h), we found a significant amount of alkyne tagged signal on the immunoblot (detected with anti-TRITC or TAMRA antibody), especially in cells collected by physical scraping (Supplemental fig. 5A and B). 1,3-Pr2-GlcNAlk labeling was also detectable by confocal imaging, which allowed us to look at both signal levels and localization (Supplemental fig. 5C). Here, a click reaction was performed to add an AlexaFluor 488-azide onto alkyne compound 1,3-Pr2-GlcNAlk, which could then be detected with a 488 nm laser. Results indicate that prolonged incubation (48 hours compared to reported incubation time of 16 hours) and higher concentration (500 μM compared to the reported MCR concentration of 100 μM) treatments of 1,3 Pr2 GlcNAlk can label HeLa cells without disrupting the HBP. Further, investigation with the 6-OTs GlcNAlk derivative showed concentration dependent incorporation in HeLa cells, and the alkyne modified signal was detectable starting from 25 μM concentration treatment (Supplemental fig. 5D and E).
In order to determine whether the labeling of the MCRs was in part due to nonenzymatic artificial S-glyco-modification, we incubated HeLa cell lysates separately with either MM-JH-1, 1,3-Pr2-GlcNAlk, or one of several controls: DMSO, GlcNAlk, Ac4GlcNAlk, or 6-OTs GlcNAlk, for 2 hours at 37 °C (Supplemental fig. 6A, upper panel). We followed treatment of the cells with a click reaction with TRITC or TAMRA-azide, and these TAMRA tagged cell lysates were then subjected to immunoblotting. TAMRA signals were detected for GlcNAlk, MM-JH-1, Ac4GlcNAlk and high concentrations of 6-OTs GlcNAlk treatment (Supplemental fig. 6B). This observation is not surprising, as these cell lysates contain active enzymes capable of post translational modifications. 1,3-Pr2-GlcNAlk is metabolized very slowly and not incorporated within 2 hours. Next, we decided to denature the active enzymes by boiling the cell lysates at 100 °C for 15 min, deactivating the enzymes prior to the addition of the MCRs (Supplemental fig. 6A, lower panel). We only observed detectable signals in Ac4GlcNAlk treated lysates, indicating that only Ac4GlcNAlk undergoes nonenzymatic artificial S-glyco modification (Supplemental fig. 6B), and the actual extent of the S-glyco modification for Ac4GlcNAlk is considerably low, similar to what is described for Ac4GalNAz.15 The absence of MM-JH-1 signal under denaturation conditions indicates enzymatic incorporation of the compound.
To further validate that MM-JH-1 is processed by the biosynthetic pathway, we assessed its corresponding UDP-sugar derivative through mass spectrometry. To determine the metabolic fate of MM-JH-1, HeLa cells were incubated with 100 μM MM-JH-1 or DMSO for 48 hours, and nucleotide sugars were extracted using 75% ice-cold ethanol. Ultra-performance liquid chromatography – high resolution accurate mass – mass spectrometry (UPLC-HRMS), allowed us to detect and identify the exact mass of endogenous UDP-GlcNAc and the UDP-MM-JH-1 derivative (Supplemental fig. 7A and B). Identification of the exact mass corresponding to the UDP-MM-JH-1 nucleotide sugar analogue unambiguously demonstrates that MM-JH-1 is accommodated by the enzymes of the HBP for enzymatic metabolic glycan labeling.
Investigating MM-JH-1 for glycan specific labeling
Following the general strategy for interrogating whether MCR labeling15 is associated with proteins, lipids, or both, we permeabilized PFA fixed MM-JH-1 treated HeLa cells with lipid dissolving detergents Triton-X 100 and acetone, separately (Supplemental fig. 8A). Comparing the confocal images of non-permeabilized and permeabilized (Triton-X 100 or acetone) cells, no change in MM-JH-1 labeling intensity was observed. This suggests that the MCR MM-JH-1 is selectively labeling proteins but not glycolipids. Similarly, RNAse treatment (Supplemental fig. 8B) and phospholipase C (PLC, removes GPI anchor proteins) treatment (Supplemental fig. 8C) had no effect on MM-JH-1 labeling. This indicates that MM-JH-1 is not being installed onto lipids, RNAs or GPI anchor proteins.
Next, we set out to determine the linkage by which this bioorthogonal sugar was incorporating. β-elimination is a technique used to cleave O-linked glycans, including GAGs, while leaving N-linked glycans unharmed.15 O-Linked glycans are sensitive to belimination and it would be expected that O-linked MM-JH-1 labeling would also be β-base-labile. To assess if MM-JH-1 was incorporated through an O-linkage, we used click chemistry on lysates from MM-JH-1 and DMSO control cells to TRITC-label modified proteins. After the click reaction, lysates were run on an SDS gel and transferred to a nitrocellulose membrane. The membrane was then incubated overnight at 40 °C with either 55 mM NaOH or water. After the β-elimination, we used a TRITC antibody to detect incorporation of MM-JH-1. The β-elimination condition did not show any loss in signal for TRITC-labeled proteins coming from the labeling by MM-JH-1 (Figure 1B), but under the same condition the signals for the intracellular O-GlcNAc modified proteins (detected with RL2 antibody) were eliminated on the blot (Figure 1B). These data suggest that the alkyne-derived signal is not due to alkyne-modified O-linked glycans.
To determine whether the signal from the alkynyl sugar MM-JH-1 was due to N-linked glycan incorporation, the cell lysates were treated with PNGase F, a well-characterized glycosidase for enzymatic cleavage of N-linked glycans.15 We observed a complete loss of TRITC-labeled signal upon treatment with PNGase F, suggesting that the signal was due to the labeling of N-linked glycans (Figure 1C). Loss of total lectin binding signals was determined by Concanavalin A (ConA, which binds terminal mannosyl and glucosyl groups) blotting (Figure 1C), further validating the PNGase F treatment for detection of N-linked glycans.
MM-JH-1 selectively and enzymatically incorporates into N-glycans
Non-enzymatic glycosylation is a well-described artifact of using unnatural sugars.40 To further establish that the alkynyl sugar MM-JH-1 is enzymatically incorporated, and to corroborate our β-elimination and PNGase F treatment results, we used a series of glycosyltransferase inhibitors in cells treated with MM-JH-1 or DMSO. First, we used the O-GlcNAc transferase (OGT) inhibitor OSMI-1,15 and assessed incorporation using fluorescence confocal microscopy. This allowed us to determine changes in both level of signal and localization of the MM-JH-1 sugar after inhibition. With increasing OSMI-1 concentration, we observed no change in the Alexa Fluor 488 signal (MM-JH-1), despite significant loss of endogenous O-GlcNAc signal (detected with anti-O-GlcNAc antibody HGAC85) on confocal imaging (Figure 2A and Supplemental fig. 9A). This indicates that labeling by MM-JH-1 is independent of OGT, and hence not incorporated into O-GlcNAc.
Figure 2.

The compound MM-JH-1 was enzymatically incorporated into N-linked glycans. (A) HeLa cells were treated with MM-JH-1 or DMSO and with or without OGT inhibitor OSMI-1 as indicated. Labeling by MM-JH-1 (green, detected with AF 488 staining on confocal images) remained, whereas O-GlcNAc staining (red, detected with RL2 antibody, MA-1076) diminished. Quantification of the images was completed by normalizing mean fluorescent signal to DAPI (blue), and each quantification is shown below the respective image (N = 3; n = 25; An ordinary one-way ANOVA test shows ****p < 0.0001, ns = not significant; N = Number of experiment repeat, n = Number of individual cells chosen for quantification of the confocal images, scale bar = 50 mm and 10 mm for zoomed in images, error bar represents standard deviation). (B) HeLa cells were either treated with tunicamycin, an inhibitor of N-linked glycosylation, or left untreated as indicated, followed by treatment with DMSO or MM-JH-1 for an additional 48 h. Tunicamycin treatment diminished labeling by MM-JH-1 (green, detected with AF 488 staining) shown by confocal imaging. Calnexin (red) was used to assess successful tunicamycin treatment. Quantification of images was done by normalizing mean fluorescent signal to DAPI (blue), and each quantification is shown below the respective image (N = 3; n = 10; An ordinary one-way ANOVA test shows ****p < 0.0001, ***p = 0.0001; N = Number of experiment repeat, n = Number of individual cells chosen for quantification of the confocal images, scale bar = 50 mm and 10 mm for zoomed in images, error bar represents standard deviation). (C) Tunicamycin treatment diminished MM-JH-1 labeling, shown by western blotting. Loss of MM-JH-1 labeled signal (detected with TRITC or TAMRA antibody) and diminished lectin binding proteins (detected with ConA signal) implied successful inhibition of N-glycan formation. Graphs showing quantifications are also provided (N = 3; An ordinary one-way ANOVA test shows ****p < 0.0001, error bar represents standard deviation).
Next, we assessed the impact of tunicamycin, an inhibitor of N-linked glycosylation.41 With tunicamycin treatment, depletion of signal from MM-JH-1 labeling was observed on both confocal imaging (Figure 2B, Supplemental fig. 9B) and western blotting (Figure 2C). To confirm tunicamycin treatment was inhibiting N-glycan biosynthesis, we used calnexin staining during confocal imaging to detect significant ER stress (Figure 2B, Supplemental fig. 9B), as well as binding of total lectins via Con A on western blots (Figure 2C). Together, these data suggest that labeling by our alkynyl sugar MM-JH-1 is enzymatically and selectively incorporating into N-linked glycosylation.
MM-JH-1 labels hybrid structure N-glycans
To determine the class of N-linked glycan structure (Figure 3A) in which MM-JH-1 was being incorporated, we used the enzyme Endo H and a series of inhibitors against N-glycan processing enzymes. Endo H is an enzyme that hydrolyzes the bond between the two GlcNAc units in the chitobiose core of the oligomannose and hybrid type N-glycan structures, but not complex type glycans (Figure 3A).15 Endo H treatment resulted in complete removal of the MM-JH-1 signal detected with anti-TRITC antibody on western blotting (Figure 3B). A similar loss of ConA signal on western blotting validated the effect of Endo H treatment (Figure 3B). The complete loss of MM-JH-1 signal with Endo H treatment, along with a ConA signal which decreased with treatment, suggest that the alkynyl sugar MM-JH-1 is not incorporated into complex type N-glycan structures, but rather incorporates into hybrid or oligomannose N-glycan structure.
Figure 3.

The compound MM-JH-1 incorporates into hybrid structure N-glycans. (A) Schematic representation of different types of N-glycan structures, and where inhibitors act. (B) Endo H treatment of immunoblots removed the labeling by MM-JH-1, as indicated by loss of TRITC signal. Assessment of ConA was used as a control to ensure efficacy of Endo H treatment. Quantification is shown to the right of the blots (N = 3; An ordinary one-way ANOVA test shows ****p < 0.0001, error bar represents standard deviation; ns = not significant). (C) Glucosidase inhibitor Castanospermine (CAST) reduced MM-JH-1 labeling (green, detected with AF 488 staining on confocal images). Augmented ConA labeling (red, detected with ConA-Texas red staining on confocal images) indicated the inhibitory activity of CAST. All quantification of images was done by normalizing mean fluorescent signal to DAPI (blue), and each quantification is shown below the respective image (N = 3; n = 25; An ordinary one-way ANOVA test shows ****p < 0.0001, **p = 0.0035, *p = 0.0491 or 0.0199, N = Number of experiment repeat, n = Number of individual cells chosen for quantification of the confocal images, scale bar = 50 mm and 10 mm for zoomed in images, error bar represents standard deviation). (D) Mannosidase-I inhibitor 1-Deoxymannojirimycine (DMJM) decreased the signals of labeling by MM-JH-1 (green, detected with AF 488 staining on confocal images). Increased ConA signals (red, detected with ConA-Texas red staining on confocal images) signified the inhibitory activity of DMJM. All quantification of images was done by normalizing mean fluorescent signal to DAPI (blue), and each quantification is shown below the respective image (N = 3; n = 25; An ordinary one-way ANOVA test shows ****p < 0.0001, ns = not significant; N = Number of experiment repeat, n = Number of individual cells chosen for quantification of the confocal images, scale bar = 50 mm and 10 mm for zoomed in images, error bar represents standard deviation). (E) Mannosidase-II inhibitor Swainsonine increased the signals of both labeling by MM-JH-1 (green, detected with AF 488 staining on confocal images) and ConA (red, detected with ConA-Texas red staining on confocal images). All quantification of images was done by normalizing mean fluorescent signal to DAPI (blue), and each quantification is shown below of the respective image (N = 3; n = 25; An ordinary one-way ANOVA test shows ****p < 0.0001, ns = not significant, N = Number of experiment repeat, n = Number of individual cells chosen for quantification of the confocal images, scale bar = 50 mm and 10 mm for zoomed in images, error bar represents standard deviation).
Glucosidase-I and II are two enzymes that cleave the three glucose residues consecutively in the oligomannose type of N-glycans, and start the N-glycan trimming process.42 The removal of these glucose residues can be prevented by the use of glucosidase inhibitors like castanospermine (CAST)41 and 1-deoxynojirimycin (DNJM).41 HeLa cells at 50–60% confluency were treated with different concentrations of CAST (100–500 μg/mL)41 or DNJM (50–200 mM)41 for 12 hours. Followed by an additional 48-hour incubation with 100 μM of MM-JH-1, cells were fixed, permeabilized and subjected to a click reaction with AF488. Cells were incubated with ConA and DAPI prior to immunofluorescence imaging. Using these inhibitors, we observed that MM-JH-1 signals were waning (detected with AF488), and an increased lectin binding signal was detected (detected with ConA) (Figure 3C, Supplemental fig. 10A for CAST treatment and 10B for DNJM treatment respectively), suggesting that the alkynyl sugar MM-JH-1 is not incorporated into the chitobiose core or oligomannose structure. Inhibition of N-glycan trimming processes by glucosidase inhibitors should result in oligomannose containing mature proteins, but this effect is not always observable. In these cases, the N-glycans can retain the three glucose residues and lose one or two mannose residues proceeding to the further trimming of the oligosaccharide.42,43
Mannosidase-I is an ER resident enzyme that cleaves the terminal Man-a(1–2) linkages in partially trimmed N-glycans, or nonterminal Man-α(1–2) linkages in unprocessed N-glycans, producing a Man5GlcNAc2Asn unit, the base structure of hybrid type N-glycans.42 With increasing concentration of mannosidase-I inhibitors such as 1-deoxymannojirimycin (DMJM, 10–50 mM)41 or kifunensine (1–5 mM)41 the fluorescence intensity of MM-JH-1 labeled signal detected with both AF488 (Figure 3D, Supplemental fig. 11A for DMJM treatment and 11B for kifunensine treatment respectively) and Oregon Green 488 (Supplemental fig. 12A) plummeted, while there was an increase in the ConA signal. These data indicate that the signal for alkynyl sugar MM-JH-1 is independent of the fluorophore used for detection, and that the label is present on the side chain of hybrid structures.
Mannosidase-II is a Golgi resident enzyme that breaks all the terminal Manα(1–3) and Mana(1–6) linkages of hybrid type glycans, processing them further to complex N-glycan structures.41 Swainsonine, a very well-known mannosidase-II inhibitor,41 blocks the complex type glycan formation. With this inhibitor, N-glycan processing does not proceed to the final complex N-glycan stage, but rather leads to more hybrid and oligomannose structure accumulation.44 When this inhibitor was used on MM-JH-1 treated cells, we observed an increase in MM-JH-1 labeled signal, and in ConA signal, with increasing concentrations of swainsonine (10–50 μg/mL, Figure 3E, Supplemental fig. 12B).
To validate the incorporation of MM-JH-1 into hybrid N-linked structures, we employed mass spectrometry analysis of oligosaccharides released by Endo H digestion of MM-JH-1-treated cells. LC-MS data revealed peaks with a 452 Da mass increase compared to standard Endo H-released N-glycans. Considering the known mass of the MM-JH-1 GlcNAlk derivative (452 Da) (Figure 4A, inset), these additional peaks were attributed to the addition of MM-JH-1 (Figure 4A and B). Further confirmation was obtained through MS/MS analysis of the N-glycan (m/z 1538.757, Supplemental fig. 13A) and its corresponding MM-JH-1 derivative (m/z 1990.946, Figure 4B). Well-matched fragment ion spectra of the unmodified N-glycan confirmed its identity as a Man6 Endo H-released structure (Figure 4A and B, Supplemental fig. 13 A–C). Notably, the MS/MS spectra of the MM-JH-1 derivative (m/z 1990.946) exhibited excellent agreement with the theoretical fragmentation pattern (Figure 4B, Supplemental fig. 13 B and C). Collectively, these data strongly support the specific incorporation of the alkynyl sugar MM-JH-1 into the hybrid class of N-glycan structures.
Figure 4.

ESI-MS Analysis of MM-JH-1 GlcNAlk-Derivatized Man5 N-Glycan. This figure presents electrospray ionization mass spectrometry (ESI-MS) data for the analysis of N-glycans derived from HeLa cells treated with MM-JH-1 or DMSO. The glycans were released using Endo-H treatment. (A) ESI-MS spectrum profile of the N-glycans. The spectrum is deconvoluted, showing masses of permethylated N-glycans with sodium adducts (M+Na). Proposed structures for the N-glycans and their corresponding MM-JH-1-derivatized forms are depicted next to their respective ions. Masses of the MM-JH-1-derivatized glycans are highlighted in red. The inset shows the Man6 N-glycan (mass 1538.783) and its proposed MM-JH-1-derivatized structure (mass 1990.975). (B) Full MS/MS spectrum of the MM-JH-1-derivatized Man5 N-glycan. The inset shows the structure of the MM-JH-1-derivatized Man5 N-glycan (mass 1990.943) with fragmentation sites observed in the MS/MS spectrum indicated. Green circles represent mannose residues, blue squares represent N-acetylglucosamine residues, and red hexagons represent MM-JH-1 modifications.
MM-JH-1 enzymatically incorporates into hybrid structures by MGAT1
Our inhibitor and mass spectrometry studies were consistent with the alkynyl sugar MM-JH-1 being specifically incorporated into hybrid structures. Thus, we decided to focus on MGAT1. MGAT1 is the N-acetylglucosaminyltransferase (GlcNAcT-I) that initiates the formation of hybrid and complex N-glycans by the addition of a GlcNAc-β(1–2) unit to the core Man-α(1–3) residue of the Man5GlcNAc2Asn assembly. In the absence of MGAT1, N-glycans of mature glycoproteins are solely composed of oligomannose structures.45 To determine if the incorporation of MM-JH-1 necessitated MGAT1, we knocked down MGAT1 by siRNA treatment. Using this technique, we were able to reduce MGAT1 levels by about 50% (Figure 5A), and significantly diminished MM-JH-1 incorporation measured by both immunoblot using TRITC-antibody (Figure 5A), and by confocal imaging using AlexaFluor 488 (Figure 5B).
Figure 5.

The compound MM-JH-1 was enzymatically added to glycans by MGAT1. (A) siRNA against MGAT1 reduced MGAT1 levels by about 50%. MGAT1 knockdown in HeLa cells reduced the signal of labeling by MM-JH-1 on western blot as detected by TRITC. Quantification is shown beside blots (N = 3; For MGAT1 an ordinary one-way ANOVA test shows ***p = 0.0001; ***p = 0.0003, ns = not significant and for TRITC an unpaired t test shows ****p < 0.0001). (B) MGAT1 siRNA knockdown in HeLa cells reduced the signal of MM-JH-1 (green, detected with AF 488 staining on confocal images) as seen through confocal imaging. All quantification of images was done by normalizing mean fluorescent signal to DAPI (blue), and the quantification is shown beside the respective images (N= 3; n =10; An unpaired t-test shows ****p < 0.0001; N = Number of experiment repeat, n = Number of individual cells chosen for quantification of the confocal images, scale bar = 50 mm and 10 mm for zoomed in images, error bar represents standard deviation). (C) MGAT1 cDNA rescue on HEK 293S GnTI− cells results in a return in signal for both MGAT1 (detected with anti-MGAT1 antibody) and MM-JH-1 labeling (detected with anti TRITC antibody) on immunoblot. Representative image is shown from three experimental replicates. (D) Putative binding pose for UDP-MM-JH-1 within the catalytic pocket of human MGAT1. Receptor residues and water molecules located within 3 Å of the ligand are displayed as pink sticks, while the ligand is displayed in green. Hydrogen bonds are reported as black dashed lines, while π-π stacking interactions are illustrated as blue dashed lines. (E) Putative binding pose for UDP-MM-JH-1 within the catalytic pocket of human MGAT2. Receptor residues and water molecules located within 3 Å of the ligand are displayed as blue sticks, while the ligand is displayed in green. Hydrogen bonds are reported as black dashed lines, while π-π stacking interactions are illustrated as blue dashed lines.
To further assess MGAT1 mediated installation of MM-JH-1, we used GlcNAcT-I (MGAT1, GnTI) knockout cells: HEK 293S GnTI−, and looked for MM-JH-1 labeling following treatment with different concentrations (25–500 μM) of MM-JH-1 for 48 hours. Cell pellets were collected separately by physical scraping and trypsinization, lysates were subjected to a click reaction with TAMRA azide, and the clicked lysates were run on immunoblot. No detectable MM-JH-1 signal remained for either of the two collection methods (Supplemental fig.14A and 14B). Comparing MM-JH-1 labeling in HEK 293T cells and HEK 293S GnTI− cells on same blot, the HEK 293T cells were readily labeled with MM-JH-1 in a concentration dependent manner, but HEK 293S GnTI− cells lacking MGAT1 gene expression remained unmodified by MM-JH-1 (Supplemental fig.14C). Additionally, over expressed MGAT1 in HEK 293S GnTI− cells. Overexpression of MGAT1 in the HEK 293S GnTI− cells rescued MM-JH-1 labeling detected with anti-TRITC antibody (Figure 5C). Taken together, these data are consistent with the conclusion that MM-JH-1 is enzymatically incorporated into the side chain of N-glycan hybrid structures via MGAT1.
To assess the influence of the bulky hydrophobic p-tosyl functionality in the enzyme binding site, we obtained a putative binding pose for UDP-MM-JH-1 on MGAT1 through molecular modeling. The ligand can assume a similar conformation to congeneric ligands present in rabbit MGAT1 complexes (e.g., 2APC), while establishing further stabilizing interactions through its additional moieties (Figure 5D). The uracil ring forms two hydrogen bonds, one between the carbonyl group at the 2 position and the imidazole ring of H188, and a second one between the amine at the 3 position and the carboxylate group of D142. The ribose ring also intertwines two hydrogen bonds that occur between the 2’ and 3’ hydroxyl groups and the sidechain of D210, one of the three acidic residues belonging to the 209EDD211 catalytic triad. The α-phosphate group forms a salt bridge with the guanidium group of R155, a hydrogen bond with the backbone amine of V319 in the flexible 318–330 loop, while also coordinating the manganese ion cofactor. The β-phosphate group is coordinated by multiple hydrogen bonds with the backbone amides of both V319 and S320 (flexible loop) and the hydroxyl group of S320. The glucose moiety is coordinated by two hydrogen bonds between the 2’ and 3’ hydroxyl groups and the carboxylate sidechain of E209 in the catalytic triad. The amide substituent on the glucose ring is solvent-exposed and coordinated by several water molecules. The terminal ethynyl group is inserted into a hydrophobic subpocket formed by residues belonging to the flexible 318–330 loop such as G322, F324, F325, and L329. Finally, the tosyl group protrudes towards the acceptor binding site, establishing two hydrogen bonds between the sulfone moiety and the backbone amides of F287 and D289, and an edge-to-face π-π stacking interaction between the p-methylphenyl ring and the p-hydroxybenzyl sidechain of Y182. Furthermore, another edge-to-face π-π stacking interaction with F287 can be observed in a dynamic environment (Video 1; see Supplementary Material).
To investigate the lack of binding to MGAT2, we superposed the putative pose obtained on MGAT1 on the MGAT2 catalytic pocket (Figure 5E). The main differences in the binding pose can be traced to the portion of the binding site that is responsible for coordinating the tosyl group, which differs in both conformation and residue composition. F287MGAT1, which forms the aromatic cage that coordinates the p-methylphenyl group of UDP-MM-JH-1 is substituted by N345MGAT2. Interestingly, the preceding residue A286MGAT1 is mutated to Y344MGAT2, which ends up occupying a similar region of space as Y182MGAT1 in the MGAT1 catalytic pocket. This difference might be related to the MGAT2 binding site lacking the flexible 318–330 loop that coordinates the phosphate groups and Y182MGAT1 as well. In MGAT2, indeed the flexible loop is still present (residues 375–387), but it is disordered and does not establish any contact with UDP in the reference crystal structure (Video 2; see Supplementary Material). To evaluate if the loop can fold upon the binding site in the presence of UDP-MM-JH-1 and contribute further stabilizing interactions to the complex, we carried out 500 ns of molecular dynamics simulation on the MGAT2-UDP-MM-JH-1 putative complex. As can be seen in Video 3 (see Supplementary Material), the loop stays disordered for the whole duration of the trajectory and does not form stable interactions with the ligand. Due to the congruent orientation of the ligand within the binding site in both cases, we attribute the different loop behavior to the different amino acid compositions. Within the loop, only two residues (G318MGAT1-G379MGAT2 and H321MGAT1-H382MGAT2) are fully conserved, with MGAT2 presenting an exclusive disulfide bridge between C378 and C386. The different loop arrangement results in a more solvent-exposed catalytic pocket, which provides less shielding to the bound ligand. In the MGAT2 complex, both the alkynyl and p-methylphenyl end of the ligand are solvent-exposed and not forming any interaction with the surrounding residues, except for transient π-π stacking between the p-methylphenyl ring and the sidechain of Y344. To qualitatively assess the energetic favorability of the two bound complexes, we scored them with both the GlideSP and GlideXP scoring functions provided within the Schrödinger 2023–02 suite. We also performed a single-point pose rescoring with the MM/GBSA protocol. The results of the scoring process are reported in Table S1 (Supplementary Material).
For reference, we performed the same scoring protocol on UDP experimental complexes available in the PDB, since it is the only ligand that has been co-crystallized with both enzymes (MGAT1: 2AM5)46 and (MGAT2: 5VCM)47 respectively. The rescoring protocol supports our claim based on visual inspection of the poses. Regardless of the scoring metric used, the UDP-MM-JH-1-MGAT1 complex is considered more favorable than the UDP-MM-JH-1-MGAT2 one. This difference is particularly evident for the GlideXP scoring function, which has been specifically tailored towards a better description of desolvation energy and hydrophobic interactions. Interestingly, GlideXP attributes the UDP-MM-JH-1-MGAT2 complex a lower score compared to the UDP-MGAT2 one. The analysis of individual contributions to the MM/GBSA predicted binding affinity (Table S2, Supplementary Material) also points towards a better electrostatic complementarity between the ligand and the receptor in the case of MGAT1, which can compensate for the higher solvation energy.
In conclusion, the lack of UDP-MM-JH-1 binding to MGAT2 is likely because of suboptimal complementarity of shape and electrostatic features with the binding site, especially concerning residues 344–347, and a lack of interactions with the flexible 375–387 loop. This results in a more solvent-exposed binding pose that diminishes the relevance of electrostatic interactions and renders the ligand desolvation upon binding less favorable.
MM-JH-1 signal colocalizes with the nucleolus
Throughout our experiments, we consistently observed MM-JH-1 labeling within the nucleus. Based on the inhibitor and MGAT1 studies, this labeling is both specific and enzymatic. This observation was quite surprising, as nuclear N-linked glycosylation has not been widely observed. To confirm this observation, we fractionated nuclear, cytosolic and plasma membrane lysates from MM-JH-1 and DMSO treated cells, performed PNGase F and Endo H assays, ran the lysates on a gel, and blotted as described previously. As we had observed in whole cell lysates (Figures 1C and 3B), the TRITC signal was evident within the cytoplasmic, plasma membrane, and nuclear lysates, and disappeared when PNGase F and Endo H treatments were used (Supplemental fig.15A–F). Based on confocal imaging, MM-JH-1 incorporation was present in the nucleolus. Therefore, we focused our efforts on investigating nucleolar proteins as candidates for attachment by these hybrid N-glycans.
First, we assessed co-localization with two nucleolar proteins: nucleolin and fibrillarin. Extracellular N-glycan modification of nucleolin had previously been reported,48 and boronic acid functionalized core-satellite composite nanoparticle enrichment showed fibrillarin had active sites for N-linked glycosylations.49 We found significant colocalization of MM-JH-1 labeled signals with both nuclear markers (detected with anti-fibrillarin nucleolar marker antibody, and anti-nucleolin antibody), suggesting MM-JH-1 was labeling proteins within the nucleolus (Figure 6A, Supplemental fig.16). To further confirm co-localization, actinomycin D was used to disrupt the organization of the nucleolus.50 We again assessed co-localization of the MM-JH-1 signal with fibrillarin and nucleolin. We found that after actinomycin D treatment, fibrillarin maintained localization with a Pearson’s R value of about 0.6 (Figure 6A and Supplemental fig. 16A), whereas for nucleolin the Pearson’s R value decreased to about 0.2 (Figure 6A and Supplemental fig. 16B). Thus, the nucleolar signal of the MM-JH-1 closely mimicked that of the fibrillarin signal. To further assess fibrillarin, we treated cells with MM-JH-1, collected cellular extracts and used click chemistry to add an acid cleavable biotin onto the labeled proteins. A streptavidin-conjugated bead was used to enrich for biotin containing proteins. After washing, the samples were incubated in neutral pH IgG buffer as a control for non-specific binding to the beads. Enriched proteins were then boiled off the bead, run on a gel, and immunoblotted using an antibody against fibrillarin. We detected fibrillarin in the biotin-enriched samples (Figure 6B). When the lysate was treated with Endo H, fibrillarin could no longer be detected, confirming modification of fibrillarin. Thus, using MM-JH-1, we were able to uncover hybrid N-linked glycosylation on the nucleolar protein fibrillarin.
Figure 6.
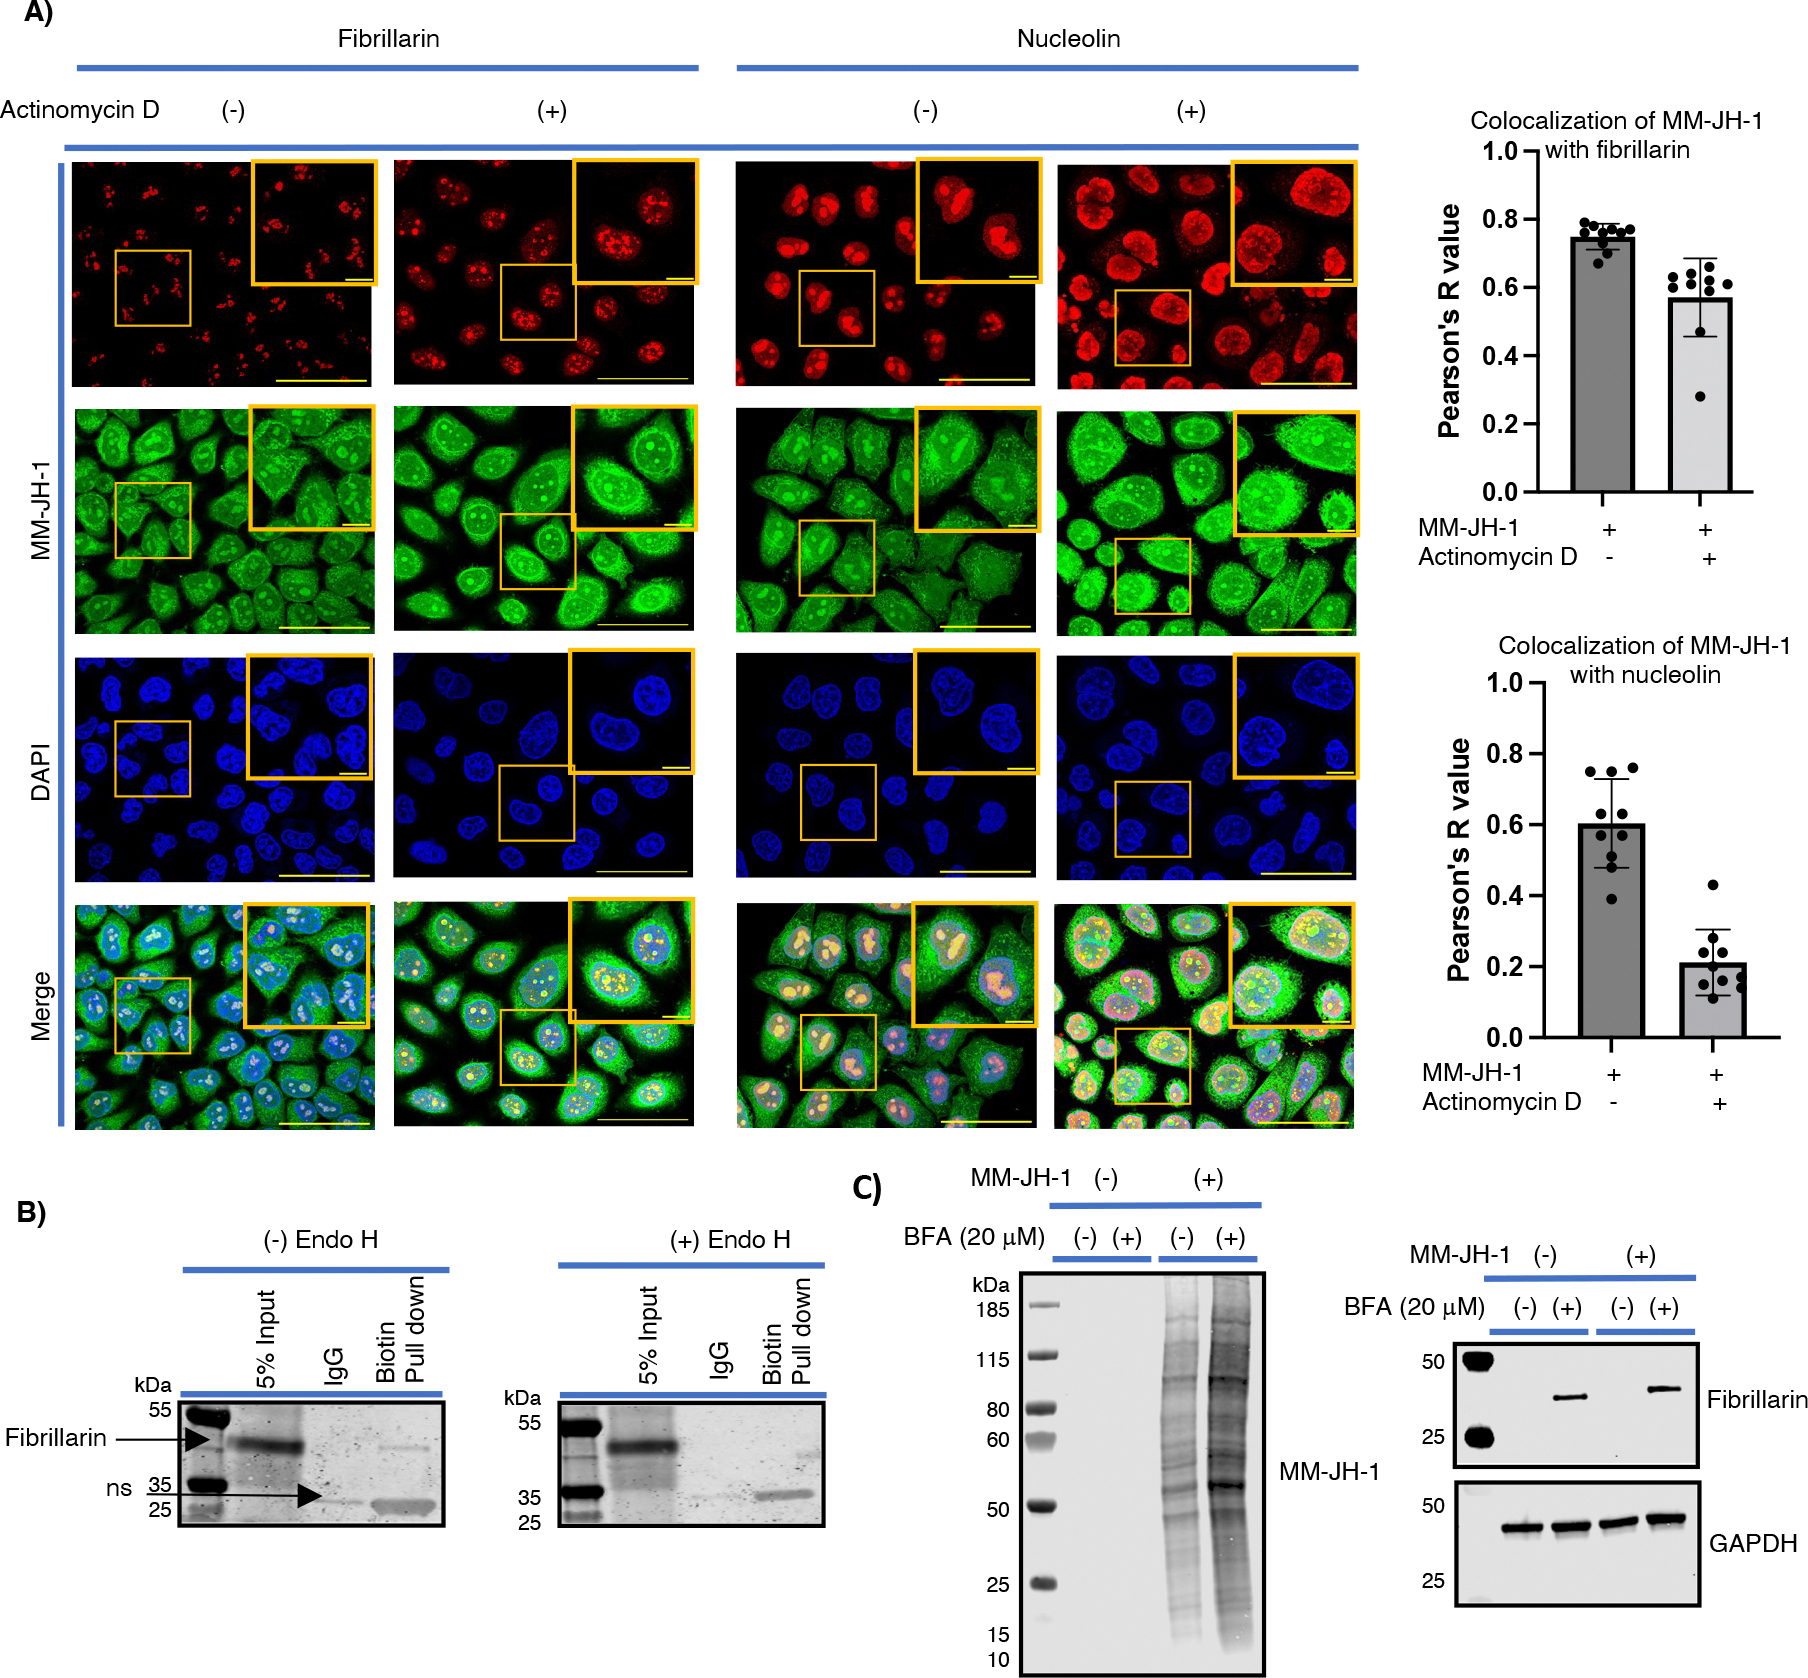
The nucleolar protein Fibrillarin is modified by MM-JH-1. (A) Change in the colocalization between fibrillarin or nucleolin signal and MM-JH-1 signal with Actinomycin D treatment. Actinomycin D treatment was used to disrupt the nucleolus. Colocalization of fibrillarin (red, detected with anti-nucleolar marker fibrillarin antibody) and nucleolin signal (red, detected with anti-nucleolin antibody) with MM-JH-1 (green, detected with AF 488 signal on confocal images) was examined. Colocalization was determined by Pearson’s R value as indicated to the right of images. One representative image is shown from three experimental replicates. Scale bar = 50 mm and 10 mm for zoomed in images. (B) After performing a click reaction with a biotin-alkyne, streptavidin was used on lysates to pulldown MM-JH-1 labeled proteins. 5% of input, flowthrough from an IgG elution buffer (to assess non-specific interactions), and the Biotin/Streptavidin pulldown were all run on a gel, transferred to a membrane, and immunoblotted using a fibrillarin antibody (left panel). A band indicating fibrillarin is visible in the 5% input and biotin-pull down lanes. These lysates were treated with Endo H, run on a gel and immunoblotted for fibrillarin. In this case fibrillarin signal is lost in the biotin pull down lane, indicating that Endo H cleaved the sugar from fibrillarin (N= 3). (C) Cytoplasmic fibrillarin and increased MM-JH-1 expression were detected with Brefeldin A (BFA) treatment (N= 3).
Because MGAT1 is localized in the Golgi apparatus, we reasoned that in order for fibrillarin to be modified, it must first be trafficked through the Golgi before entering the nucleus. Therefore, we treated cells with brefeldin A (BFA, an inhibitor for protein transport from ER to Golgi apparatus) and assessed fibrillarin accumulation in the cytoplasmic extract (Figure 6C). With BFA, which collapses the Golgi apparatus, we find both an increase in extra-nuclear MM-JH-1 labeling, and an accumulation of the fibrillarin in the immunoblot from the cytoplasmic extract. Similar observation of an increase in extra-nuclear fibrillarin and increased size of fibrillarin-containing nucleoli was detected under confocal imaging (Supplemental fig. 17). This is consistent with a model in which a portion of the fibrillarin is trafficked to the Golgi, and is released to enter the nucleolus.51
Discussion.
In this study we have modified the 6-hydroxyl group of 1,3-Pr2 GlcNAlk with 6-O-Tosyl and interrogated its specificity as a novel next generation MCR. Treatment of various cells with this compound resulted in a cell line dependent incorporation with no considerable cytotoxicity up to 500 μM. NaOH treatment (β-elimination condition) and O-GlcNAc inhibition (OSMI-1) had no effect on labeling by this compound. However, N-glycanase (PNGase F and Endo H) treatment and N-glycan biosynthesis inhibitor (tunicamycin) treatment blocked labeling by this alkyne sugar, suggesting that this MCR was enzymatically incorporated into N-glycan structures. Using a series of specific inhibitors against the enzymes involved in N-glycan biosynthesis and MALDI-MS/MS glycan analysis, we determined MM-JH-1 was likely incorporated into hybrid structures. Further, siRNA knock down of MGAT1 in HeLa cells resulted in a concomitant decrease in MM-JH-1 incorporation. Moreover, cDNA rescue of MGAT1 expression in HEK 293S GnTI− cells recouped MM-JH-1 labeling. Thus, these findings indicate that MM-JH-1 specifically and enzymatically labels hybrid structure N-linked glycans.
Clickable unnatural monosaccharides have proven to be powerful tools in metabolic glycan engineering (MGE), both for the introduction of unnatural functional groups into cellular glycans, and for profiling of cellular glycosylations.52 While the use of MCRs has been important in progressing the field of glycobiology, recent studies have uncovered non-enzymatic artificial S-glyco modifications with commonly used MCRs meant to incorporate into intracellular O-GlcNAcylation. The reaction between MCRs with free thiols of cysteine residues calls into question the conclusions garnered from using these MCRs for the detection of O-GlcNAc.31,53 This is particularly significant for MCRs targeting intracellular O-GlcNAcylation due to the high occurrence of free cysteine sulfhydryl groups compared to the cell surface, where many cysteine residues are found as oxidized disulfides.54 Artificial S-glyco modification is not a substantial contributor to overall glycan labeling,15,54 but the sharing of common UDP-GlcNAc derivatives by multiple pathways that may lead to a multitude of enzymatic glycan modifications presents a problem with the utilization of MCRs.15 Upon examining the active site of AGX1, a previous study showed that the N-acetyl group of UDP-GlcNAc, positioned adjacent to three water molecules and in proximity to the solvent accessible channel and the methyl group, extends from the outside of the protein to the active site.35 In lieu of AGX1 being the bottleneck for accommodating MCRs in the HBP, the real critical step is the conventional action of AGM1 (transforming GlcNAc-6-P to GlcNAc-1-P). Properly protected advanced intermediates that can circumvent this AGM1 step can even accommodate bulky substituents like β-alanine-4-nitro-2,1,3-benzoxadiazole (NBD) on the 2-acetamido position of GlcNAc.35
The enzymatic steps necessary for the formation of complex N-glycan structures follow a discrete hierarchy depending on substrate specificities of the transferases. The first step in the glycan branching process is the addition of a GlcNAc-β(1–2) residue transferred from UDP-GlcNAc by MGAT1, forming the GlcNAcMan5GlcNAc2-Asn core hybrid structure. This addition by MGAT1 is a prerequisite for several subsequent modifications. The GlcNAc-Man2 residue in the core hybrid structure acts as a ‘recognition arm’ for other enzymes like Golgi α-Mannosidase-II, MGAT2, MGAT3, MGAT4, MGAT5 and FUT8, but not B4GALT1 (for addition of a β(1–4)Gal residue).47 Those MGAT1 dependent enzymes bind the recognition arm using a broad exosite surface that extends away from the active site and forms a specific pocket for the terminal GlcNAc residue. In consideration of how MM-JH-1 might be utilized, the N-acetyl group of UDP-GlcNAc is deeply buried inside the binding pocket of the MGAT1 structure,55 leaving enough space to accommodate the bulky 6-O-Tosyl functionality of our compound, and allow transfer by MGAT1. On the other hand, the terminal GlcNAc structure is essential for its binding in the exosite pocket of downstream enzymes and our modified GlcNAlk derivative MM-JH-1 might not be able to fit in the site, inhibiting further N-glycan processing, and rendering incorporation of MM-JH-1 specific to hybrid structures.
Surprisingly, we found significant colocalization of MM-JH-1 with the nucleolus. Colocalization and immunoprecipitation of fibrillarin with MM-JH-1 suggests that this nucleolar protein is N-linked glycosylated (Figure 6A and 6B). Fibrillarin has a relatively small molecular weight (37 kDa) and can move in and out of the nuclear membrane.56 Notably, it has a potential N-glycosylation site at Asparagine 80 (NetNGlyc-1.0). While our study uncovered that fibrillarin is N-linked glycosylated, it is likely not the only nuclear protein modified. Further research is necessary to determine the extent of nuclear N-linked glycosylation, the function of this modification in the nucleus, and how these proteins encounter MGAT1.
Specific N-linked incorporated bioorthogonal sugars have great potential as tools in biomedical research. Changes in N-glycan structures are considered to be essential for the epithelial–mesenchymal transition (EMT) and the resultant change of adhesive properties of cancer cells.57 Aberrant glycosylation has been pinpointed as a hallmark of cancer due to its contributions in carcinogenesis, cancer progression, and metastasis, conferring a new perspective for cancer research involving underlying mechanisms, investigation, and clinical translation and application.58 Most of the cancer biomarkers that are in use today are glycoproteins or glycolipids, and they are measured immunochemically using monoclonal antibodies. The epitope for these monoclonal antibodies against glycoproteins are mostly toward the protein moiety and not toward the glycan structures.57 Currently, however, it is difficult to detect the early stage of cancer by using these antibodies. Thus, bioorthogonal sugars have the potential to detect early-stage changes in N-glycan structures that can lead to earlier detection of cancer. Additionally, the ability to specifically label hybrid N-glycans has great potential for furthering our understanding of this N-glycan type. Hybrid N-glycans play an imperative role as ligands for HIV-1 neutralizing antibodies including PG9, PG16, VRG26.25, and VRC26.09, suggesting that such glycans can serve as epitopes for HIV vaccines.59 In addition, hybrid N-glycans modify protein properties such as binding of IgG1 to Fcγ receptor IIIa and cell-cell interaction mediated by E-cadherin.12,60 To our best knowledge, MM-JH-1 is the first MCR that specifically labels only N-glycan hybrid structures. Now, using this MCR, hybrid N-glycans can be distinguished clearly from the complex type, and one can use this tool to undertake more specific in-depth studies of this ‘intermediate’ type of N-glycan.
Materials and methods.
Reagents
All chemicals, reagents, and general lab supplies were purchased from Thermo Fisher Scientific or Sigma-Aldrich unless noted. GlcNAlk was prepared as previously reported.61,62 Cell culture reagents including DMEM with 2 mM glutamax were purchased from Gibco. Alexa Fluor 488 azide (Thermo Fisher Scientific A10266), Oregon Green 488 azide (Thermo Fisher Scientific A10180), TRITC azide (Thermo Fisher Scientific T10182), and Biotin DADPS picolyl azide (Sussex Research, BL000010) were dissolved to 1 mM in DMSO.
Primary antibodies used include those for the following epitopes (catalog number): Mouse anti O-GlcNAc (RL2) (Thermo Fisher Scientific MA1-072, for immunoblotting), Mouse anti O-GlcNAc (HGAC85) (Thermo Fisher Scientific MA1-076, for immunocytochemistry), Mouse anti GAPDH (Abcam ab8245), Mouse anti MGAT1 (Abcam, ab 180578), Rabbit anti TRITC (Thermo Fisher Scientific, A6397), Rabbit anti GAPDH (Abcam, ab18078), Rabbit anti nucleolin (Sigma, N2662), Rabbit anti Fibrillarin (Abcam, ab5821), Rabbit anti Calnexin (Abcam, ab 22595), Mouse anti Histone H3 (Cell Signaling Technology, 3638), Rabbit anti Histone H3 (Cell Signaling Technology, 3717), Concanavalin A Texas Red (ConA, Thermo Fisher Scientific C825), Biotin conjugated ConA (Vector Lab, B-1005-5), Rabbit anti-DAF/CD55 (Cell Signaling Technology, 67686).
Inhibitors were purchased from Sigma Aldrich with the following specifications: OSMI-1 (Sigma-Aldrich, SML1621), Tunicamycin (Sigma-Aldrich, T7765), Castanospermine (Sigma-Aldrich, 218775), 1-Deoxynojirimycin (DNJM, Sigma-Aldrich, 08012), 1-Deoxymannojirimycin (DMJM, Sigma-Aldrich, D9160), Swainsonine (Sigma-Aldrich, S9263), Kifunensine (Sigma-Aldrich, 422500), Actinomycin D (Sigma-Aldrich, A9415), Brefeldin A (Sigma-Aldrich, B7651).
General methods for chemical synthesis:
Unless otherwise specified, all reagents and solvents were purchased from Thermo Fisher Scientific or Sigma-Aldrich Chemical Company and used as supplied. Reactions were monitored by thin-layer chromatography (TLC) on silica gel 60 glass slides. Spots were visualized by charring with H2SO4 in EtOH (5% v/v) and/or UV light. Solutions in organic solvents were dried with anhydrous MgSO4 and concentrated at reduced pressure at < 40 °C.
Chemical analysis instruments:
NMR spectra were measured at 25 °C for solutions in CDCl3, at 500 MHz or 600 MHz for 1H, and at 125 MHz or 150 MHz for 13C with Bruker Avance Spectrometers. Assignment of the NMR signals was aided by 1D and 2D experiments (1H–1H homonuclear decoupling, APT, COSY, HSQC, TOCSY and HMBC) run with the software supplied with the spectrometer. Chemical shifts were referenced to that of tetramethylsilane (0 ppm) or signals of residual non deuterated solvent (7.16 for 1H), and for 13C signal of the solvent (CHCl3, 77.00 ppm). Topshim (v12.0.3) was used for all chemical NMR analysis. Data are reported as chemical shift, multiplicity (brs, broad signal; s, singlet; d, doublet; t, triplet; q, quartet; quin, quintet; sept, septet; m, multiplet), coupling constants in Hertz (Hz) and integration. High-resolution mass spectrometric (HRMS) measurements were performed on a proteomics optimized Q-TOF-2 (Micromass-Waters) using external calibration with polyalanine, unless otherwise noted. Observed mass accuracies are those expected based on known instrument performance as well as trends in masses of standard compounds observed at intervals during the series of measurements. Reported masses are observed masses uncorrected for this time-dependent drift in mass accuracy.
Synthesis:
2-deoxy-2-N-pentynoylamide-1,3-di-O-propionyl-6-O-tosyl-D-glucopyranoside (1,3-Pr2-6-OTs-GlcNAlk, 6):
4-Pentynoic acid (600 mg, 6.1 mmol) was added to a stirring solution of D-glucosamine hydrochloride (875 mg, 4.06 mmol) and TEA (2 mL) in methanol (20 mL) at room temperature. The mixture was stirred under room temperature for 30 min, then moved into an ice bath. HOBt (550 mg, 4.06 mmol) and EDC hydrochloride (780 mg, 4.06 mmol) were added. Then the reaction was stirred at room temperature for 8 h, after which TLC (DCM:MeOH 4:1, Rf = 0.48) showed complete consumption of starting material with a couple of newly formed much faster moving spots. The mixture was concentrated and briefly purified by column chromatography (silica gel; DCM:MeOH = 8:1) to give 2-deoxy-2-N-pentynoylamide-D-glucopyranose (2) as a white solid (801 mg, 76%). Purified product was characterized with HRMS (HRMS (ESI-TOF): m/z [M+Na+] calcd for C11H17NO6Na 282.0954; found 282.0958) and we proceed to next steps of the reaction. 0.6 mL of benzaldehyde dimethyl acetal were added to the stirring solution of 2 (700 mg, 2.7 mmol) in dry acetonitrile (MeCN, 50 mL) followed by the addition of magnesium trifluoromethanesulfonate (Mg(OTf)2,63 87 mg, 0.27 mmol), and this mixture was left stirring at room temperature over the weekend. After 2 days, TLC (DCM:MeOH 9:1, Rf = 0.54) showed faster moving spots were formed. The reaction was neutralized with NEt3, solvent was evaporated under vacuum and the formation of the desired product 3 (815 mg, 87%) was confirmed by HRMS analysis (HRMS (ESI-TOF): m/z [M+H+] calcd for C18H22NO6 348.1447; found 348.1446). This crude mixture was dried under vacuum and subjected to further acetylation reactions.
Propionic anhydride (0.9 mL, 6.9 mmol) and Mg(OTf)2 (37 mg, 0.12 mmol) were added to the stirring solution of 3 (800 mg, 2.3 mmol) in dry DCM (10 mL) and left stirring overnight. After 16 h, TLC (9:1 DCM:MeOH, Rf = 0.62) showed consumption of the starting material and formation of the product which appeared faster moving, and two poorly separated spots represented a mixture of anomers. The reaction mixture was quenched with MeOH and evaporated under vacuum. The crude mixture was dissolved in DCM and subsequently washed with 1(N) HCl, saturated NaHCO3 and brine solution. The combined washings were collected and dried over Na2SO4. The crude product (4, 984 mg, 93%, HRMS (ESI-TOF): m/z [M+Na+] calcd for C24H29NO8Na 482.1791; found 482.1789) was collected as colorless syrup and we proceeded to the next step of the reaction.
10 mL of 60% Acetic acid64 were added to the 4 (950 mg, 2.1 mmol) and left stirring for 1 h at 60 °C. TLC (3:1 EA:Hexane, Rf = 0.27) then showed consumption of the starting material and formation of a much slower moving spot. Acetic acid was removed under vacuum and the crude mixture was purified by column chromatography (3:1 EA:Hexane) to give pure product (5, 690 mg, 90%) as colorless syrup. 1H NMR for the major β anomer (600 MHz, CDCl3): δ 6.17 (d, 1H, J = 3.7 Hz, H-1), 6.09 (d, 1H, J = 8.9 Hz, -NH), 5.18 (dd, 1H, J = 9.5 Hz, 10.8 Hz, H-3), 4.38 (m, 1H, H-2), 3.94 (m, 1H, H-4), 3.91–3.80 (m, 2H, H-6,6’), 3.72 (m, 1H, H-5), 3.11 (brs, 1H, -OH), 2.49–2.31 (m, 8H, 4 ×CH2), 2.00 (1H, brs, -OH), 1.98 (1H, t, J = 1.98 Hz, -CH), 1.81 (3H, t, J = 7.6 Hz, CH3), 1.14 (3H, t, J = 7.5 Hz, CH3); 13C NMR (150 MHz, CDCl3): δ 175.9 (C=O), 172.9 (C=O), 171.3 (C=O), 90.7 (C-1, JC-1, H-1 = 177.8 Hz), 73.5 (C-5), 72.8 (C-3), 69.5 (-CH), 67.4 (C-4), 61.0 (C-6), 51.1 (C-2), 34.9 (CH2), 27.5 (CH2), 27.4 (CH2), 14.6 (CH2), 9.1(CH3), 8.8 (CH3); HRMS (ESI-TOF): m/z [M+Na] calcd. for C17H25NO8Na 394.1478; found 394.1474.
Tosyl chloride (280 mg, 1.48 mmol) was added to the stirring solution of 5 (500 mg, 1.35 mmol) in a 1:1 mixture of dry pyridine and dry DCM (10 mL) at 0 °C, and this mixture was left stirring at room temperature. After 48 h, when TLC (1:1 EA:Hexane, Rf = 0.30) showed consumption of the starting material and formation of a faster moving spot, the reaction mixture was quenched with MeOH and evaporated under vacuum. The crude mixture was dissolved in DCM and subsequently washed with brine solution. The combined washings were collected, dried over Na2SO4 and evaporated under vacuum to give a crude reaction mixture appearing as a light-yellow syrup. Column chromatographic purification of this crude mixture (1.2:1 Hexane:EA) resulted in pure product (6, 552 mg, 78%) as white foam. 1H NMR for the major β anomer (500 MHz, CDCl3):δ 7.82–7.75 (d, 2H, J = 8.5 Hz, ArH), 7.38–7.33 (d, 2H, J = 8.2 Hz, ArH), 6.07 (d, 1H, J = 3.7 Hz, H-1), 5.84 (m, 1H, -NH), 5.13 (dd, 1H, J = 10.9 Hz, 8.8 Hz, H-3), 4.43 (dd, 1H, J = 9.1 Hz, 2.5 Hz, H-6), 4.31 (m, 1H, H-2), 4.18 (dd, 1H, J = 1.4 Hz, 10.9 Hz, H-6’), 3.89–3.81 (m, 2H, H-4, H-5), 3.04 (m, 1H, -OH), 2.48–2.27 (m, 11H, 4 ×CH2, p-CH3 at 2.46 ppm), 1.95 (t, 1H, J = 2.6 Hz, -CH), 1.79–1.12 (2t, 6H, J = 7.3 Hz and 7.0 Hz, 2×CH3); 13C NMR (125 MHz, CDCl3): δ 175.8 (C=O), 172.3 (C=O), 170.9 (C=O), 145.3, 132.4, 129.9 (2C), 127.9 (2C), 90.4 (C-1), 72.5 (C-3), 71.7 (C-5), 69.5 (-CH), 67.7 (C-6), 67.4 (C-4), 51.0 (C-2), 35.1 (CH2), 27.6 (CH2), 27.4 (CH2), 21.6 (CH3), 14.6 (CH2), 9.0 (CH3), 8.8 (CH3); HRMS (ESI-TOF): m/z [M+Na] calcd. for C24H31O10NSNa 548.1566; found 548.1567.
Cell culture:
HeLa, COS7, and mouse embryonic fibroblast (MEF) cells were cultured in DMEM (Gibco, 10567022) supplemented with 10% fetal bovine serum (FBS), penicillin (100 U/mL), and streptomycin (1 mg/mL) at 37 °C in a humidified incubator with 5% CO2. NIH 3T3 cells were cultured in DMEM (Gibco, 10567022) supplemented with 10% donor bovine serum (DBS), penicillin (100 U/mL), and streptomycin (1 mg/mL) at 37 °C in a humidified incubator with 5% CO2. HEK 293T cells were cultured in EMEM medium (ATCC, 30-2003) supplemented with 10% fetal bovine serum (FBS), penicillin (100 U/mL), and streptomycin (1 mg/mL) at 37 °C in a humidified incubator with 5% CO2. Malignant MCF7 (tissue: mammary gland/breast; derived from a metastatic site: pleural effusion, cell type: epithelial, HTB-22) breast cancer cells were purchased from ATCC (American Type Culture Collection, LGC Standards) and propagated in monolayer culture using standard mammalian cell culture techniques as described in the ATCC protocols. MCF7 cells were cultured in EMEM medium (ATCC, 30–2003) supplemented with 2 mM L-glutamine, 0.01 mg/ml human recombinant insulin (Sartorious, BE02-033E20), 10% FBS, penicillin (100 U/mL), and streptomycin (1 mg/mL) at 37 °C under an atmosphere composed of air, 95% humidity, and 5% CO2. HEK 293S GnTI− (tissue: kidney; Embryo; established by methanesulfonate mutagenesis followed by ricin selection, cell type: epithelial, CRL-3022) cells lacking N-acetyl-glucosaminyltransferase I (GnTI) activity and therefore hybrid and complex N-glycans, were purchased from ATCC (American Type Culture Collection, LGC Standards) and propagated in monolayer culture using standard mammalian cell culture techniques as described in the ATCC protocols. HEK 293S GnTI− cells were cultured in the DMEM:F12 medium (ATCC, 30–2006) supplemented with 10% FBS, penicillin (100 U/mL), and streptomycin (1 mg/mL) at 37 °C under an atmosphere composed of air, 95% humidity, and 5% CO2.
For experiments, cells were seeded at a density of 10k cells per well in a 4-well cover-slipped bottom slide, 100k cells/well in a 6 well cell culture plate, 5k cells/well in a 96 well cell culture plate and 500k cells in a 10 cm plate. Cells were allowed to settle overnight and then an appropriate amount of sugar sample was added for the desired final concentration from a 100 mM stock. Alternatively, the equivalent volume of DMSO was added as a negative control.
Cell Lysate collection:
After the appropriate time, cells were collected by physical scraping or trypsinization, counted, and centrifuged at 1000 rpm for 5 min in 1.5 mL Eppendorf tubes. The supernatants were removed carefully, and the cell pellets were stored at −80 °C for future use. Cell pellets were lysed with RIPA lysis buffer on an ice bath for 10 min with occasional vortexing and centrifuged at 4 °C with maximum speed for 10 min in 1.5 mL Eppendorf tubes. Cell lysates were stored at −20 °C for temporary storage or −80 °C for longer storage until use.
Nucleotide sugar extraction and Mass analysis:
Cells were treated with 100 μM MM-JH-1 or an equivalent amount of DMSO as a negative control and incubated for 48 h. Cells were collected through physical scraping and centrifuged at 1000 rpm for 5 min in 1.5 mL Eppendorf tubes. The supernatants were removed carefully, and cell pellets were washed once with cold 1XPBS and centrifuged at 4 °C with maximum speed for 10 min in 1.5 mL Eppendorf tubes. The supernatants were removed carefully, and ice-cold ethanol (1 ml) was added to the cell pellets, and cells were lysed through sonication on an ice-bath for 10 min.65 The extract was centrifuged at 16,000 × g for 10 min at 4°C in order to remove insoluble material, and the collected supernatant was dried in a SpeedVac (ThermoScientific). This collected nucleotide sugar pool was redissolved in 1:1 MeOH:H2O for further UPLC-HRMS analysis.
LC-MS detection was achieved by ultra-performance liquid chromatography – high resolution accurate mass – mass spectrometry (UPLC-HRMS) utilizing a Thermo Scientific Vanquish UPLC with a Thermo Scientific Altis ID-X mass spectrometer running at 120,000 resolution, heated electrospray ionization (HESI-II) in negative or positive ion modes (2500V or 3500V respectively). A porous graphite carbon Thermo Hypercarb column, 2.1 × 100 mm, 3 μm column was maintained at 40 °C. Solvent A: H2O with 0.1% formic acid (FA) adjust to pH 9 with ammonium hydroxide and Solvent B: ACN. The flow rate was 125 μL/min, the gradient was 5% B at 0 min, 1.5 min 10% B, 8.0 min 20% B, 8.1 min 95% B, 11.0 95% B, returning to 5% B at 11.1 and re-equilibrating until 15 min. Samples were analyzed in positive ionization modes. Analytes were identified by exact mass.
CuAAC (Click) reaction:
With Cell Lysate (Using Click-iT kit C10276):
Up to 20 μL of lysate (up to 60 μg protein) were added to 100 μL Click-iT reaction buffer Component A (containing 40 μM of TRITC-azide), 40 μL deionized water (to make final volume of 160 μL), 10 μL CuSO4, 10 μL Additive 1 solution, and after 2 min, 20 μL Additive 2 solution. Samples were mixed for 25 min in the dark, after which time they were centrifuged to bring down the liquid. After labeling, the proteins were precipitated with methanol/chloroform. For MeOH/CHCl3, 600 μL MeOH, 150 μL CHCl3, and 400 μL water were added, and the samples mixed. Samples were centrifuged for 5 min at maximum speed and the top, aqueous layer was removed and discarded. Next, 450 μL of MeOH were added in two separate washes, after which the samples were centrifuged at maximum speed and the protein resided at the bottom of the tube. The resulting protein-pellet was air-dried (0.5–1 h).
With Fixed Cell (Using Click-iT kit C10269):
To the fixed and permeabilized cells a cocktail of 440 μL Click-iT reaction buffer (from stock of 1:10 diluted solution of component A), 10 μL CuSO4, 50 μL Click-iT cell buffer Additive (from stock of component C diluted in 4 mL of deionized water), and 2.5 μL fluorophore azide (from 1 mM stock solution of Alexa Fluor 488 azide or Oregon Green 488 azide in DMSO) were added. Samples were incubated in the dark for 30 min at room temperature and washed three times with 1×PBS.
Confocal microscopy:
Cells were grown until sub confluent, washed thrice with PBS, and fixed in 2% PFA in phosphate buffered saline (1×PBS) for 15 min at 37 °C in an incubator. Cells were washed thrice with PBS, and then permeabilized utilizing 0.1% Triton-X 100 in 1×PBS overnight at 4 °C. Cells were washed with 1×PBS and CuAAC labeling was performed with Alexa Fluor 488 azide or Oregon green 488 azide. Cells were washed thrice with PBS and blocked with 0.1% BSA in 1×PBSTw for 1 h. The cells were incubated with the primary antibody overnight and washed thrice with 1×PBSTw. They were then incubated with Alexa Fluor-conjugated secondary antibodies in 1×PBSTw for 1 h at room temperature. Cells were again washed thrice with 1×PBSTw. Samples were then treated with DAPI and/or ConA Texas red. Fluorescence was detected with LSM 700 Confocal (Zeiss) using a laser to detect the stains. A 63x water objective was used and samples were obtained using the same microscope settings for all samples within the same figure. Fluorescence intensity of images was analyzed with FIJI image processing software. Representative experiments are shown in the figures.
Immunoblot:
Cell pellets were lysed with RIPA lysis buffer on ice for 10 min with occasional vortexing, and then centrifuged at 4 °C at maximum speed for 10 min in 1.5 mL Eppendorf tubes. To separate nuclear from cytoplasmic fractions, we used the NE-PER kit (Thermo Fisher Scientific, 78835), and to separate plasma membrane proteins we used the Mem-PER plus kit (Thermo Fisher Scientific, 89842). Cell lysates were stored at −20 °C for temporary storage or −80 °C for longer storage. Protein concentration was determined by BCA assay (Mem-Pierce, Thermo Fisher Scientific) and normalized to the lowest concentration using RIPA buffer. For CuAAC labeling using Click-iT kit C10276: to 25 μL of lysate (up to 50 μg protein), 100 μL buffer A (containing 40 μM of TAMRA-azide), 10 μL CuSO4, 10 μL additive 1, and after 2 minutes, 20 μL additive 2 were added. Samples were mixed for 25 minutes after which time the protein was precipitated with methanol/chloroform. For MeOH/CHCl3: 600 μL MeOH, 150 μL CHCl3, and 400 μL water were added, and the samples mixed. Samples were centrifuged for 5 minutes at maximum speed and the top, aqueous layer (upper colorless) was removed and discarded. Next, 450 μL MeOH were added in two separate washes after which, the samples were centrifuged at maximum speed and the protein resided at the bottom of the tube. The resulting protein-pellet was air-dried (0.5–1 h). Lastly, protein was resuspended in an appropriate volume of LDS dye with BME. Protein was resolved by SDS PAGE: 4–12% Bis-tris gels (Invitrogen) were used with 1X MOPS to resolve proteins after which they were transferred to a 0.2 μm nitrocellulose membrane using Invitrogen™ iBlot™ 2 Gel Transfer Device (IB21001). The blots were then blocked with Odyssey PBS blocking buffer at room temperature for 1 h and then incubated with the appropriate primary antibody (1:1000 dilution) in Odyssey PBS blocking buffer with 0.1% tween 20 overnight at 4 °C. The next day, blots were washed three times in 1XPBSTw for 10 min each and incubated with the appropriate secondary Odyssey antibodies (1:10000 dilution) in Odyssey PBS blocking buffer with 0.1% tween 20 at room temperature for 1 h. The blots were then washed thrice with 1XPBSTw and developed under the Odyssey instrument. Blots were quantified using Image Studio software (Li-Cor). A fixed rectangular box was drawn around each lane measuring median intensities with local background subtraction.
β-Elimination:
Cells were treated with 100 μM MM-JH-1 or an equivalent amount of DMSO as a negative control and incubated for 48 h. Then cells were collected by trypsinization and pelleted by centrifugation for 5 min at 1000 rpm. Following washing twice with ice cold 1XPBS (1 mL), cell extracts were collected using RIPA buffer. Protein concentration was determined by BCA assay (Pierce, Thermo Fisher Scientific) and normalized to the lowest protein concentration using RIPA buffer. Both DMSO and MM-JH-1 treated cell lysates were subjected to CuAAC reaction with TRITC-azide, and the labeled lysates were run on 10 well gels and transferred onto nitrocellulose membranes as described earlier. After a 1XPBS wash for 10 min, the membrane was cut in half and one half incubated with 55 mM NaOH, and the other with water for 24 h at 40 °C. The blots were then washed thrice with 1XPBSTw, and then blocked with Odyssey PBS blocking buffer at room temperature for 1 h. The blots were then incubated with the appropriate primary antibody in Odyssey PBS blocking buffer with 0.1% tween 20 overnight at 4 °C. Both the anti-RL2 antibody (Thermo Fisher Scientific, MA1-072), anti-TRITC antibody (Thermo Fisher Scientific, A6397), and anti GAPDH (Abcam, ab8245 or Abcam, ab18078) as loading control, were used at a 1:1000 dilution. The blots were then washed three times in 1XPBSTw for 10 min each, incubated with the appropriate secondary Odyssey antibodies (1:10000 dilution) in Odyssey PBS blocking buffer with 0.1% tween 20 at room temperature for 1 h, washed thrice with 1XPBSTw, and developed under the odyssey instrument. Blots were quantified simultaneously using Image Studio software (Li-Cor). A fixed rectangular box was drawn around each lane, or band measuring median intensities with local background subtraction.
PNGase F and Endo H treatment:
PNGase F (P0704S) and Endo H (P0702S) were obtained from New England BioLabs and treatments were performed according to the manufacturer’s protocol with some changes as described below. Cells were treated with 100 μM MM-JH-1 or an equivalent amount of DMSO as a negative control, and incubated for 48 h. Then cells were collected by physical scraping and pelleted by centrifugation for 5 min at 1000 rpm. After washing twice with ice cold 1XPBS (1 mL), cell extracts were collected using RIPA buffer. Protein concentration was determined by BCA assay (Pierce, Thermo Fisher Scientific) and diluted to lowest protein concentration using RIPA buffer. Both the DMSO treated, and sample treated cell lysates were subjected to enzyme treatment, or water treatment as a negative control. For PNGase F assay: to 10 μg of protein, 1 μL of 10×Glycoprotein Denaturing Buffer was added and incubated for 10 min at 100 °C. Then 2 μL of GlycoBuffer 2, 2 μL of 10% NP-40, 1 μL of PNGase F and 4 μL of deionized water (to make final volume of 20 μL), were added and incubated for 1 h at 37 °C. For Endo H assay: to 10 μg of protein, 1 μL of 10×Glycoprotein Denaturing Buffer was added and incubated for 10 min at 100 °C. Then 2 μL of 10×GlycoBuffer 3, 1 μL of Endo H and 6 μL of deionized water (to make final volume of 20 μL) were added and incubated for 1 h at 37 °C. Enzyme (PNGase F and Endo H) treated, and water treated cell lysates were separately subjected to CuAAC reaction with TRITC azide. The clicked cell lysates were subjected to immunoblotting on nitrocellulose membrane and the blots were blocked with Odyssey PBS blocking buffer at room temperature for 1 h. The blots were then incubated with the appropriate primary antibody in 1X PBS blocking buffer with 0.1% tween overnight at 4 °C. Both the loading control antibody and anti-TRITC (Thermo Fisher Scientific, A6397) antibody were used at a 1:1000 dilution. The blots were then washed three times in 1×PBSTw for 10 min, incubated with appropriate secondary Odyssey antibodies (1:10000 dilution) at room temperature for 1 h, washed thrice with 1XPBSTw, and developed under the odyssey instrument. Blots were then stripped using stripping buffer at 4 °C overnight, and then washed and blocked with Odyssey PBS blocking buffer at room temperature for 1 h. The blots were then incubated with biotin conjugated Concanavalin A (Vector Lab, B-1005-5), diluted 1:1000 in PBS blocking buffer, for 1 h. The blots were then washed thrice with 1×PBSTw for 10 min each. Then the blots were incubated with IRDye® 800 CW streptavidin Odyssey secondary antibody at 1:10000 in PBS blocking buffer with 0.1% tween for 1 h. After being washed thrice with 1×PBSTw for 10 min each, the blot was developed using the Odyssey instrument. Blots were quantified using Image Studio software (Li-Cor).
Inhibitor Studies:
HeLa cells were cultured as described earlier. For inhibitor studies, different concentrations of the inhibitors were added after 8 h of initial cell seeding and incubated for another 12 h. Cells were treated with 100 μM MM-JH-1 and incubated for 48 h. Next, either the cell lysate was collected for immunoblotting, or cells were fixed for confocal microscopic imaging.
MGAT1 siRNA knockdown:
HeLa cells were cultured as described earlier. For the siRNA experiment, DMEM (Gibco, A14430 without phenol red) was supplemented as described with or without antibiotics. The following siRNA reagents were purchased from Santa Cruz: transfection reagent (sc-29528), MGAT1 siRNA construct (human) (sc-40780), and Control siRNA-A (sc-37007). The lyophilized siRNA duplex was resuspended in 330 μL (MGAT1) or 66 μL (control) of RNase-free water which was provided yielding a 10 μM stock solution. Samples were aliquoted to 15 μL each and stored at −20 °C. HeLa cells were grown in DMEM media until the experiments were performed. HeLa cells were seeded either in 6 well plates or in 4 well chamber slides in normal growth medium without P/S, and grown to ~50% confluency in the incubator at 37 °C, 5% CO2.
On Day 1, for transfections, 4 μL of the siRNA duplex (i.e., 0.5 μg or 50 pmols siRNA) was diluted into 100 μL of the siRNA transfection medium. Likewise, 6 μL siRNA transfection reagent was diluted in 100 μL of the siRNA transfection medium. Equal volumes of the siRNA duplex and diluted transfection reagent was added and mixed gently. This mixture was then incubated at room temperature for 30 min. 800 μL of siRNA transfection medium was added to each tube containing the transfection mixture. After washing cells 1x with siRNA transfection medium and aspirating the liquid, the duplex/transfection reagent mixture was added to the wells and cells were incubated for 8 h at 37 °C in the 5% CO2 incubator. After the incubation period, 1 mL of normal growth medium was added, and cells were incubated overnight at 37 °C.
On Day 2, the Day 1 procedure was repeated with one exception: when adding in the normal growth medium, DMSO or 100 μM 1,3-Pr2-6-OTs-GlcNAlk (MM-JH-1) was added to half of the cells. After 48 h of incubation, cells were either isolated by trypsinization and processed as described for immunoblotting or fixed with PFA for confocal imaging.
MGAT1 cDNA rescue:
HEK 293S GnTI− cells were cultured as described earlier. For the cDNA rescue experiment DMEM:F12 medium (ATCC, 30-2006) was supplemented as described without antibiotics. Transient transfection of plasmid DNA was conducted using Lipofectamine 2000 (Thermo Fisher Scientific, 11668019), according to the manufacturer’s protocol. Briefly, 8 μg of plasmid DNA (Vector source: pmoxGFP-N1; Cloning sites: XhoI/BamHI; Primers: 5’-AGT GAC CTC GAG GCC ACC ATG CTG AAG AAG CAG TCT GC-3’ and 5’-AG TGA CGG ATC CCG ATT CCA GCT AGG ATC ATA GCC-’)66 and 24 μL of transfection reagent were separately diluted in 500 μL of Opti-MEM (Thermo Fisher Scientific, 31985070) in a 1:3 mass ratio. After 5 min incubation, the diluted DNA and transfection reagent were thoroughly mixed and incubated for 20 min at room temperature before being added to the cells. The cell culture medium was changed 24 h post-transfection and replaced with a media containing 100 μM MM-JH-1. After 48 h of incubation, cells were isolated by trypsinization and processed as described for immunoblotting.
Glycomics analysis:
Cell pellets were washed with PBS buffer and lysed with lysis buffer containing 8M urea. To reduce viscosity, samples were briefly sonicated using a microtip probe sonicator (Fisher Scientific). The lysate was centrifuged at 16,000 × g for 10 minutes at 4°C and the supernatant was buffer exchanged with 5 mM ammonium bicarbonate buffer to make a 5 mM urea final concentration using a 3 KD Amicon® MWCO centrifugal filter (Millipore, Burlington, MA). Protein concentration was estimated with a Reducing Agent Compatible BCA Protein Assay Kit (Thermo Scientific™).
The N-linked glycans were released from 1000 μg of reduced and alkylated protein sample by treatment with Endo-H (NEB, P0702L, 50 U/μL) for 18 h at 37°C. The released N-glycans were collected by passing the digest through 10 KD Amicon® MWCO centrifugal filters (Millipore, Burlington, MA), and dried by lyophilization.
The released N-linked glycans were permethylated using methods described elsewhere.67 Permethylated N-glycans were dissolved in a 1:1 (v/v) solution of methanol and water containing 1 mM sodium acetate for LC-MS analysis. The analysis was performed on a Thermo Fisher Orbitrap Fusion mass spectrometer equipped with a nano-electrospray ionization (ESI) source and coupled to a Dionex Ultimate RSLCnano liquid chromatography system. Pre-packed C18 reverse-phase nano-LC columns (15 cm length, 75 μm inner diameter) packed with 3 μm particles were used for separation.
The oligosaccharides were eluted using a binary gradient: mobile phase A (98% water, 2% acetonitrile, 0.1% formic acid, and 1 mM sodium acetate) and mobile phase B (80% acetonitrile, 0.1% formic acid, and 1 mM sodium acetate). The gradient started at 40% B, increasing to 60% B over 30 minutes, followed by a steeper increase to 85% B over 20 minutes. The mass spectrometer operated in a high-resolution mode, acquiring precursor ion scans at a resolution of 120,000 in the Orbitrap analyzer. Selected precursors were isolated and fragmented using collision-induced dissociation (CID) within the same Orbitrap analyzer, with MS/MS spectra acquired at a resolution of 30,000. The final ESI spectra were generated by averaging the LC-MS chromatogram and deconvolution using Thermo Fisher Freestyle 1.8 software.
Biotin enrichment:
In T175 flasks, HeLa cells were treated with 100 μM MM-JH-1 and incubated for 48 h. Cells were collected by trypsinization and pelleted by centrifugation (5 min, 1200 rpm), followed by washing with 1×PBS, and cell extracts were then collected using RIPA buffer. Protein concentration was determined by BCA assay (Pierce, Thermo Fisher Scientific). Cell lysates were subjected to CuAAC reaction with acid-cleavable Biotin DADPS picolyl azide (Sussex Research, BL000010). Pierce streptavidin magnetic beads (Thermo Fisher Scientific, 88817) were used to pull down biotin attached proteins. Initially, streptavidin magnetic beads were pre-washed with binding/wash buffer (1×TBSTw) in a 1.5 mL microcentrifuge tube. Biotinylated proteins were added to the 1.5 mL microcentrifuge tube containing pre-washed magnetic beads and incubated at room temperature for 1 h with mixing. The magnetic beads were collected with a magnetic stand, washed twice with 1×TBSTw and IgG Elution buffer, pH 2.0 (Thermo Fisher Scientific, 21028). The resulting protein was collected and subjected to immunoblotting, and fibrillarin protein was detected with anti-fibrillarin nucleolar marker antibody (Abcam, ab5821).
Molecular docking of UDP-MM-JH-1:
No experimental structure of human MGAT1 is available to date. Through a BLAST68 search using the human MGAT1 primary sequence as input (UniProt ID: P26572),69 we identified rabbit MGAT1 (UniProt ID: P27115) as the most suitable structural template (92.6% sequence identity). Seven rabbit MGAT1 structures are available on the Protein Data Bank70 (PDB, Table 1). Among these, we chose rabbit MGAT1 in complex with UDP-GlcNAc phosphonate (PDB ID: 2APC)46 as representative, due to its good resolution and similarity between the co-crystallized ligand (UDM) and UDP-MM-JH-1.
Table 1:
Experimental rabbit MGAT1 structures available on the Protein Data Bank (PDB).
We then obtained a homology model of human MGAT1 using the Prime72,73 package from the Schrödinger 2023–02 suite. Specifically, we used the knowledge-based method, applied default parameters, and included both the ligand (UDM) and the manganese ion in the model.
To model a UDP-MM-JH-1 putative binding pose, we aligned UDP-MM-JH-1 onto the reference ligand (UDM from complex 2APC) using the appropriate module of the Schrödinger 2023–02 suite. Then, we minimized the complex to remove minor clashes according to the OPLS474 force field. Using the solvate 1.0.1 (Grubmüller and Groll 1996, https://www.mpinat.mpg.de/grubmueller/solvate) program, we added the first solvation layer (thickness = 3 Å) to the complex. Finally, we performed a short molecular dynamics refinement using the following passages.
The system was set up for MD simulation using different tools from Visual Molecular Dynamics (VMD 1.9.3)75 and the AmberTools2376 suite. Partial charges were attributed to the ligand through the “antechamber” module using the AM1-BCC77 method. Ligand parameters were assigned through the GAFF78 force field, while other parameters were attributed according to the ff14SB79 force field. Initially, each complex was solvated in a rectangular base prism box with the appropriate number of water molecules to ensure a 15 Å padding value. Then, a proper number of sodium and chlorine ions were added to neutralize the system and reach the physiological salt concentration of 0.154M. Finally, the system underwent 500 steps of energy minimization through the conjugate-gradient method to remove clashes that would make the simulation unstable.
MD simulations were performed using the ACEMD80 3.7.1 engine. The integration timestep was set to 4 fs, the length of bonds involving hydrogen atoms was constrained through the M-SHAKE algorithm, electrostatic interactions were computed through the particle-mesh Ewald method81 (cubic spline interpolation, 1 Å grid spacing) and a 9.0 Å cutoff was applied to Lennard-Jones interactions. A two-stage equilibration process preceded the productive stage. The first step consisted of 0.1 ns in the NVT simulation with harmonic positional restraints (k = kcal mol−1 Å−2) imposed on each protein and ligand atom. In the second step, 0.5 ns in the NPT ensemble were performed, with restraints applied only on the ligand and on the protein backbone. The productive stage of 10 ns in the NVT ensemble. In all simulations, a Langevin thermostat82 was used to maintain the temperature at a constant value of 310 K. During the second equilibration stage, the pressure was kept at a constant value of 1 atm through a Monte Carlo barostat.83 The last frame of the productive simulation was extracted and minimized according to the OPLS4 force field and used as the representative pose for UDP-MM-JH-1 within the catalytic pocket of human MGAT1.
To date, three experimental structures for human MGAT2 (UniProt ID: Q10469) are deposited in the PDB (Table 2): among these, we chose human MGAT2 in complex with UDP (PDB ID: 5VCS)47 as the representative one since it is the only holoprotein structure and it also has the best resolution. The complex was prepared using the Protein Preparation Tool embedded in the Schrödinger 2023–02 suite using default parameters. Missing loops were reconstructed through the Prime package.
Table 2:
Experimental human MGAT2 structures available on the Protein Data Bank (PDB)
To rationalize UDP-MM-JH-1 selective binding to human MGAT1, we aligned the proposed pose onto the catalytic site of MGAT2 using the dedicated tool of the Schrödinger 2023–02 suite and performed the same refinement process described for MGAT1.
Both poses were scored using the SP and XP scoring functions of the Glide84,85 docking program and the MM/GBSA86 protocol of the Prime package.
Finally, 500 ns of a molecular dynamics simulation in the NVT ensemble was performed starting from the putative UDP-MM-JH-1-MGAT2 complex to characterize the conformational landscape of the flexible loop 375–387.
Statistics:
Graphpad (version 10) prism was used for all statistics. A one-way ANOVA was used to determine significance as indicated in figure legends. P values less than 0.05 were considered statistically significant. For quantification of co-localization in confocal images, Fiji (ImageJ v.1.52) was used with the co-localization plugin. The Pearson’s correlation coefficients between MM-JH-1 and fibrillarin or nucleolin were measured using three regions of interest (ROI) per image.
Supplementary Material
Supplemental Figure 1. NMR spectra of 1,3-Pr2 GlcNAlk (5) and 1,3-Pr2-6-OTs GlcNAlk (MM-JH-1, 6); (A) 1H NMR spectrum (600 MHz) of 5. (B) 13C NMR spectrum (150 MHz) of 5. (C) 1H-1H COSY spectrum of 5. (D) 1H-13C HSQC spectrum of 5. (E) 1H NMR spectrum (600 MHz) of 6. (F) 13C NMR spectrum (150 MHz) of 6. (G) 1H-1H COSY spectrum of 6. (H) 1H-13C HSQC spectrum of 6.
Supplemental Figure 2. (A) HRMS spectrum of MM-JH-1. (B) MALDI-mass spectrum of MM-JH-1.
Supplemental Figure 3. Assessment of concentration dependent labeling of MM-JH-1 on HeLa and Female MEF cells. Cells incubated with different concentrations of MM-JH-1 were collected to check the extent of cellular uptake and the effect on O-GlcNAcylation. (A) Concentration dependent incorporation of MM-JH-1 in HeLa cells collected by physical scraping (N = 4; An ordinary one-way ANOVA test shows ****p < 0.0001, **p = 0.0017, ns = not significant, error bar represents standard deviation). (B) Concentration dependent incorporation of MM-JH-1 in HeLa cells collected by trypsinization (N = 4; An ordinary one-way ANOVA test shows ****p < 0.0001, ***p = 0.0008, **p = 0.0097, *p = 0.0456, ns = not significant, error bar represents standard deviation). (C) Concentration dependent incorporation of MM-JH-1 in Female MEF cells collected by physical scraping (N = 3; An ordinary one-way ANOVA test shows ****p < 0.0001, ns = not significant, error bar represents standard deviation). (D) Concentration dependent incorporation of MM-JH-1 in Female MEF cells collected by trypsinization (N = 3; An ordinary one-way ANOVA test shows ****p < 0.0001, **p = 0.0094, ns = not significant, error bar represents standard deviation).
Supplemental Figure 4. Assessment of concentration dependent labeling of MM-JH-1 on multiple different cell lines and corresponding cytotoxicity. Cells incubated with different concentrations of MM-JH-1 were collected to check the extent of cellular uptake. (A) Concentration dependent incorporation of MM-JH-1 in MCF7 cells collected by physical scraping (N = 4; An ordinary one-way ANOVA test shows ****p < 0.0001, **p = 0.0022, ns = not significant, error bar represents standard deviation). (B) Concentration dependent incorporation of MM-JH-1 in MCF7 cells collected by trypsinization (N = 3; An ordinary one-way ANOVA test shows ****p < 0.0001, **p = 0.0090, *p = 0.0499, ns = not significant, error bar represents standard deviation). (C) Concentration dependent incorporation of MM-JH-1 in COS7 cells collected by physical scraping (N = 4; An ordinary one-way ANOVA test shows ****p < 0.0001, ***p = 0.0001, ns = not significant, error bar represents standard deviation). (D) Concentration dependent incorporation of MM-JH-1 in COS7 cells collected by trypsinization (N = 4; An ordinary one-way ANOVA test shows ****p < 0.0001, ***p = 0.0001, ns = not significant, error bar represents standard deviation). (E) Concentration dependent incorporation of MM-JH-1 in NIH 3T3 cells collected by physical scraping (N = 3; An ordinary one-way ANOVA test shows ****p < 0.0001, ns = not significant, error bar represents standard deviation). (F) Concentration dependent incorporation of MM-JH-1 in NIH 3T3 cells collected by trypsinization (N = 3; An ordinary one-way ANOVA test shows ****p < 0.0001, ns = not significant, error bar represents standard deviation). (G) Concentration dependent incorporation of MM-JH-1 in HEK 293T cells collected by physical scraping (N = 3; An ordinary one-way ANOVA test shows ****p < 0.0001, **p = 0.0017, ns = not significant, error bar represents standard deviation). (H) Cell viability of different cell lines treated with differing concentrations (25 μM-500 μM) of MM-JH-1 (N = 4).
Supplemental Figure 5. Assessment of concentration dependent labeling of 1,3-Pr2 GlcNAlk (5) and 6-OTs GlcNAlk in HeLa cells. HeLa cells separately incubated with different concentrations of 1,3-Pr2 GlcNAlk (5) or 6-OTs GlcNAlk were collected to check the extent of cellular uptake. (A) Concentration dependent incorporation of 1,3-Pr2 GlcNAlk (5) in HeLa cells collected by physical scraping (N = 3; An ordinary one-way ANOVA test shows ****p < 0.0001, ***p = 0.0007, **p = 0.0065, *p = 0.0153, ns = not significant, error bar represents standard deviation). (B) Concentration dependent incorporation of 1,3-Pr2 GlcNAlk (5) in HeLa cells collected by trypsinization (N = 4; An ordinary one-way ANOVA test shows *p = 0.0304, ns = not significant, error bar represents standard deviation). (C) Labeling of HeLa cells with 500 μM 1,3-Pr2 GlcNAlk (5) was detected (AlexaFluor-488) under confocal microscopy. Intracellular O-GlcNAc signals were detected using anti RL2 antibody (N = 3, scale bar = 50 mm and 10 mm for zoomed in images). (D) Concentration dependent incorporation of 6-OTs GlcNAlk in HeLa cells collected by physical scraping (N = 4; An ordinary one-way ANOVA test shows ****p < 0.0001, *p = 0.0300, ns = not significant, error bar represents standard deviation). (E) Concentration dependent incorporation of 6-OTs GlcNAlk in HeLa cells collected by trypsinization (N = 4; An ordinary one-way ANOVA test shows ****p < 0.0001, *p = 0.0423, error bar represents standard deviation).
Supplemental Figure 6. MM-JH-1 is enzymatically labeling HeLa cell lysates (A) Workflow to assess the enzymatic incorporation of MCRs in HeLa cells. HeLa cell lysates before and after heat deactivation were incubated with different MCRs for 2 hours at 37 °C followed by a click reaction with TAMRA-azide, after which the lysates were subjected to western blotting. (B) HeLa cell lysates before and after heat deactivation were incubated with DMSO, GlcNAlk, Ac4GlcNAlk, 1,3-Pr2 GlcNAlk, MM-JH-1, or 6-OTs GlcNAlk for 2 hours at 37 °C.
Supplemental Figure 7. Ultra-performance liquid chromatography – high resolution accurate mass – mass spectrometry (UPLC-HRMS) analysis of nucleotide sugar extract shows formation of the corresponding UDP-MM-JH-1 nucleotide sugar. (A) UPLC-HRMS analysis of nucleotide sugar extract from DMSO treated HeLa cells. (B) UPLC-HRMS analysis of nucleotide sugar extract from MM-JH-1 treated HeLa cells.
Supplemental Figure 8. MM-JH-1 is not labeling lipids, RNAs or GPI-anchors in HeLa cells. (A) Neither nonionic detergent-X100 nor organic solvent acetone has any effect on the MM-JH-1 labeling, demonstrating MM-JH-1 labeling is not related to lipids. All quantification of images was done by normalizing mean fluorescent signal to DAPI (blue), and each quantification is shown next to the respective image (N = 3; n = 25; N = Number of experiment repeat, n = Number of individual cells chosen for quantification of the confocal images. An ordinary one-way ANOVA test shows ns = not significant. scale bar = 50 mm and 10 mm for zoomed in images, error bar represents standard deviation). (B) RNAse treatment has no effect on MM-JH-1, signifying that MM-JH-1 is not related to RNAs. All quantification of images was done by normalizing mean fluorescent signal to DAPI (blue), and each quantification is shown below the respective image (N = 3; n = 25; N = Number of experiment repeat, n = Number of individual cells chosen for quantification of the confocal images, An unpaired t-test shows ns = not significant, scale bar = 50 mm and 10 mm for zoomed in images, error bar represents standard deviation). (C) MM-JH-1 labeling in HeLa cells remained unchanged after phospholipase C (PLC) treatment implying that the signals are not associated with GPI-anchors (N = 4, An unpaired t-test shows ns = not significant, error bar represents standard deviation).
Supplemental Figure 9. Effect of the O-GlcNAc transferase (OGT) inhibitor OSMI-1 and N-glycan biosynthesis inhibitor tunicamycin on MM-JH-1 labeling. (A) Increasing amounts of OSMI-1 diminished O-GlcNAc (detected with HGAC85 antibody in red) staining but did not impact MM-JH-1 incorporation (green). Quantification is shown to the right of the images (N= 3; n = 25; An ordinary one-way ANOVA test shows ****p < 0.0001, ns = not significant, N = Number of experiment repeat, n = Number of individual cells chosen for quantification of the confocal images, scale bar = 50 mm and 10 mm for zoomed in images, error bar represents standard deviation). (B) Tunicamycin treatment decreased the signal of MM-JH-1. Increasing concentration of Tunicamycin diminished signal from Calnexin (red) and MM-JH-1 incorporation (green). Quantification is shown to the right of the images (N= 3; n = 10; An ordinary one-way ANOVA test shows ****p < 0.0001; ***p = 0.0003, N = Number of experiment repeat, n = Number of individual cells chosen for quantification of the confocal images, scale bar = 50 mm and 10 mm for zoomed in images, error bar represents standard deviation).
Supplemental Figure 10. Glucosidase inhibitors castanospermine (CAST) and 1-deoxynojirimycin (DNJM) reduced the signal of MM-JH-1 (green, detected with AF 488 staining on confocal images), but increased the ConA (red, detected with ConA-Texas red staining on confocal images) signal. (A) Increasing concentration of CAST reduced MM-JH-1 labeling (green, detected with AF 488 staining on confocal images). Augmented signals of ConA (red, detected with ConA-Texas red staining on confocal images) indicated the inhibitory activity of CAST. All quantification of images was done by normalizing mean fluorescent signal to DAPI (blue), and each quantification is shown to the right of the respective images (N = 3; n = 25; An ordinary one-way ANOVA test shows ****p < 0.0001, **p = 0.0035, *p = 0.0491 or 0.0199, N = Number of experiment repeat, n = Number of individual cells chosen for quantification of the confocal images, scale bar = 50 mm and 10 mm for zoomed in images, error bar represents standard deviation). (B) Increasing concentration of DNJM reduced MM-JH-1 labeling (green, detected with AF 488 staining on confocal images). Augmented signals of ConA (red, detected with ConA-Texas red staining on confocal images) indicated the inhibitory activity of DNJM. All quantification of images was done by normalizing mean fluorescent signal to DAPI (blue), and each quantification is shown to the right of the respective images (N = 3; n = 25; An ordinary one-way ANOVA test shows ****p < 0.0001, **p = 0.0042, *p = 0.0134, ns = not significant, N = Number of experiment repeat, n = Number of individual cells chosen for quantification of the confocal images, scale bar = 50 mm and 10 mm for zoomed in images, error bar represents standard deviation).
Supplemental Figure 11. Mannosidase-I inhibitor 1-deoxymannojirimycin (DMJM) and kifunensine both reduced the signal of MM-JH-1. (A) Increasing concentration of DMJM decreased the signals of MM-JH-1 (green, detected with AF 488 staining on confocal images). Increased signals for ConA (red, detected with ConA-Texas red staining on confocal images) signified the inhibitory activity of DMJM. All quantification of images was done by normalizing mean fluorescent signal to DAPI (blue), and each quantification is shown to the right of the respective images (N = 3; n = 25; An ordinary one-way ANOVA test shows ****p < 0.0001, ns = not significant; N = Number of experiment repeat, n = Number of individual cells chosen for quantification of the confocal images, scale bar = 50 mm and 10 mm for zoomed in images, error bar represents standard deviation). (B) Increasing concentration of kifunensine decreased the signals of MM-JH-1 (green, detected with AF 488 staining on confocal images). Amplified signals for ConA (red, detected with ConA-Texas red staining on confocal images) signified the inhibitory activity of kifunensine. All quantification of images was done by normalizing mean fluorescent signal to DAPI (blue), and each quantification is shown to the right of the respective images (N = 3; n = 25; An ordinary one-way ANOVA test shows ****p < 0.0001, ns = not significant; N = Number of experiment repeat, n = Number of individual cells chosen for quantification of the confocal images, scale bar = 50 mm and 10 mm for zoomed in images, error bar represents standard deviation).
Supplemental Figure 12. Mannosidase-I inhibitor DMJM reduced the signal of MM-JH-1 detected with Oregon green-488, while Mannosidase-II inhibitor Swainsonine increased the signal coming from MM-JH-1 detected with AlexaFluor-488. (A) Increasing concentration of DMJM increased the ConA (red, detected with ConA-Texas red staining on confocal images) labeling and decreased MM-JH-1 incorporation detected by Oregon green 488. Oregon green 488 is a different probe than the AF488 used in other figures (green). All quantification of images was done by normalizing mean fluorescent signal to DAPI (blue), and each quantification is shown to the right of the respective images (N = 3; n = 25; An ordinary one-way ANOVA test shows ****p < 0.0001, **P = 0.0017, ns = not significant, N = Number of experiment repeat, n = Number of individual cells chosen for quantification of the confocal images, scale bar = 50 mm and 10 mm for zoomed in images, error bar represents standard deviation). (B) Increasing concentration of swainsonine increased the signals of both MM-JH-1 (green, detected with AF 488 staining on confocal images) and ConA (red, detected with ConA-Texas red staining on confocal images). All quantification of images was done by normalizing mean fluorescent signal to DAPI (blue), and each quantification is shown to the right of the respective images (N = 3; n = 25; An ordinary one-way ANOVA test shows ****p < 0.0001, ns = not significant, N = Number of experiment repeat, n = Number of individual cells chosen for quantification of the confocal images, scale bar = 50 mm and 10 mm for zoomed in images, error bar represents standard deviation).
Supplemental Figure 13. (A) Full MS/MS spectrum of the Man6 N-glycan. The inset shows the structure of the Man6 N-glycan (mass 1538.754). Green circles represent mannose residues, blue squares represent N-acetylglucosamine residues. (B) Molecular structure of Man6 N-glycan, and (C) MM-JH-1-Derivatized hybrid N-Glycan.
Supplemental Figure 14. MM-JH-1 incorporation in HEK 293S GnTI− cells. Cell lysates collected from HEK 293S GnTI− cells incubated with different concentrations of MM-JH-1 were subjected to click reactions with TRIC-azide to check the extent of cellular uptake. (A) No incorporation of MM-JH-1 was observed in HEK 293S GnTI− cells collected by physical scraping (N =3). (B) No incorporation of MM-JH-1 was observed in HEK 293S GnTI− cells collected by trypsinization (N =3). (C) MM-JH-1 incorporated into HEK 293T cells in a concentration dependent manner, but labeling was not detected in HEK 293S GnTI− cells (N = 3).
Supplemental Figure 15. Nuclear labeling by MM-JH-1 was N-linked. (A-C) Extracts were fractionated, blotted, and subjected to PNGase F treatment. PNGase F removed TRITC signal from (A) nuclear, (B) cytoplasmic, and (C) plasma membrane extracts (N = 3). (D-F) Extracts were fractionated, blotted and subject to Endo H treatment. Endo H removed TRITC signal from (D) nuclear, (E) cytoplasmic, and (F) plasma membrane extracts (N = 3).
Supplemental Figure 16. The nucleolar protein Fibrillarin is modified by MM-JH-1. (A) Change in colocalization between fibrillarin signal and MM-JH-1 with Actinomycin D treatment. Actinomycin D treatment was used to disrupt the nucleolus. Colocalization of fibrillarin (red, detected with anti-nucleolar marker fibrillarin antibody) with MM-JH-1 (green, detected with AF 488 signal on confocal images) was examined. Colocalization was determined by Pearson’s R value as indicated to the right of the images. One representative image is shown from three experimental replicates. Scale bar = 50 mm and 10 mm for zoomed in images. (B) Change in colocalization between nucleolin signal and MM-JH-1 with Actinomycin D treatment. Actinomycin D treatment was used to disrupt the nucleolus. Colocalization of nucleolin signal (red, detected with anti-nucleolin antibody) with MM-JH-1 (green, detected with AF 488 signal on confocal images) is examined. Colocalization was determined by Pearson’s R value as indicated to the right of the images. One representative image is shown from three experimental replicates. Scale bar = 50 mm and 10 mm for zoomed in images.
Supplemental Figure 17. Brefeldin A (BFA) treatment resulted in disrupted fibrillarin labeling with a detectable cytoplasmic accumulation of MM-JH-1 and fibrillarin. Representative image is shown from three experimental replicates.
Supplemental Table S1. Scoring of poses obtained for UDP-MM-JH-1 on MGAT1 and MGAT2. For reference, the scores for the UDP-MGAT1 (PDB ID: 2AM5) and UDP-MGAT2 (PDB ID: 5VCM) experimentally determined complexes are reported.
Supplemental Table S2. Results of MM/GBSA scoring for the two putative poses for UDP-MM-JH-1 on MGAT1 and MGAT2.
Acknowledgements.
We thank the members of the Hanover lab for discussion and advice, as well as former lab member Ilhan Akan for general assistance and valuable suggestions. This work was conducted in the Laboratory of Cell and Molecular Biology (LCMB) section in NIDDK, National Institutes of Health, and supported by the NIDDK, National Institutes of Health, intramural research program grant. The content is solely the responsibility of the authors and does not necessarily represent the official views of the National Institutes of Health. Glycomics analysis was performed at the Complex Carbohydrate Research Center and was supported in part by the National Institutes of Health (NIH)-funded R24 grant (R24GM137782) awarded to Parastoo Azadi. Molecular modeling analysis was performed at the Laboratory of Cell Biology (LCB) section in NIDDK, National Institutes of Health, and supported by the NIDDK, National Institutes of Health, intramural research program grant (ZIADK031116) awarded to Dr. Kenneth A. Jacobson.
References:
- 1.Zhang J & Wang Y Emerging roles of O-GlcNAcylation in protein trafficking and secretion. J Biol Chem 300, 105677 (2024). [DOI] [PMC free article] [PubMed] [Google Scholar]
- 2.Kiessling LL & Splain RA Chemical Approaches to Glycobiology. Annual Review of Biochemistry 79, 619–653 (2010). [DOI] [PubMed] [Google Scholar]
- 3.Olivier-Van Stichelen S, Malard F, Berendt R, Wulff-Fuentes E & Danner L Find out if your protein is O-GlcNAc modified: The O-GlcNAc database. The FASEB Journal 36(2022). [Google Scholar]
- 4.Bond MR & Hanover JA A little sugar goes a long way: the cell biology of O-GlcNAc. J Cell Biol 208, 869–80 (2015). [DOI] [PMC free article] [PubMed] [Google Scholar]
- 5.Weerapana E & Imperiali B Asparagine-linked protein glycosylation: from eukaryotic to prokaryotic systems. Glycobiology 16, 91R–101R (2006). [DOI] [PubMed] [Google Scholar]
- 6.Walsh CT, Garneau-Tsodikova S & Gatto GJ Jr. Protein posttranslational modifications: the chemistry of proteome diversifications. Angew Chem Int Ed Engl 44, 7342–72 (2005). [DOI] [PubMed] [Google Scholar]
- 7.Esmail S & Manolson MF Advances in understanding N-glycosylation structure, function, and regulation in health and disease. Eur J Cell Biol 100, 151186 (2021). [DOI] [PubMed] [Google Scholar]
- 8.Stanley P, Moremen KW, Lewis NE, Taniguchi N & Aebi M N-Glycans, (Cold Spring Harbor press, Cold Spring Harbor (NY), 2022). [PubMed] [Google Scholar]
- 9.Feng T et al. Glycosylation of viral proteins: Implication in virus-host interaction and virulence. Virulence 13, 670–683 (2022). [DOI] [PMC free article] [PubMed] [Google Scholar]
- 10.Flynn RA et al. Small RNAs are modified with N-glycans and displayed on the surface of living cells. Cell 184, 3109–3124 e22 (2021). [DOI] [PMC free article] [PubMed] [Google Scholar]
- 11.Kanda Y et al. Comparison of biological activity among nonfucosylated therapeutic IgG1 antibodies with three different N-linked Fc oligosaccharides: the high-mannose, hybrid, and complex types. Glycobiology 17, 104–18 (2007). [DOI] [PubMed] [Google Scholar]
- 12.Hall MK et al. Predominant Expression of Hybrid N-Glycans Has Distinct Cellular Roles Relative to Complex and Oligomannose N-Glycans. Int J Mol Sci 17(2016). [DOI] [PMC free article] [PubMed] [Google Scholar]
- 13.Hanzawa K, Suzuki N & Natsuka S Structures and developmental alterations of N-glycans of zebrafish embryos. Glycobiology 27, 228–245 (2017). [DOI] [PubMed] [Google Scholar]
- 14.Vocadlo DJ, Hang HC, Kim E-J, Hanover JA & Bertozzi CR A chemical approach for identifying O-GlcNAc-modified proteins in cells. Proceedings of the National Academy of Sciences 100, 9116 (2003). [DOI] [PMC free article] [PubMed] [Google Scholar]
- 15.Mukherjee MM et al. Tools and tactics to define specificity of metabolic chemical reporters. Front Mol Biosci 10, 1286690 (2023). [DOI] [PMC free article] [PubMed] [Google Scholar]
- 16.McKay CS & Finn MG Click chemistry in complex mixtures: bioorthogonal bioconjugation. Chem Biol 21, 1075–101 (2014). [DOI] [PMC free article] [PubMed] [Google Scholar]
- 17.Sletten EM & Bertozzi CR From Mechanism to Mouse: A Tale of Two Bioorthogonal Reactions. Accounts of Chemical Research 44, 666–676 (2011). [DOI] [PMC free article] [PubMed] [Google Scholar]
- 18.Kim EJ Advances in Strategies and Tools Available for Interrogation of Protein O-GlcNAcylation. Chembiochem 22, 3010–3026 (2021). [DOI] [PubMed] [Google Scholar]
- 19.Sletten EM & Bertozzi CR Bioorthogonal Chemistry: Fishing for Selectivity in a Sea of Functionality. Angew. Chem. Int. Ed. 48, 6974–6998 (2009). [DOI] [PMC free article] [PubMed] [Google Scholar]
- 20.Kim EJ Chemical Reporters and Their Bioorthogonal Reactions for Labeling Protein O-GlcNAcylation. Molecules 23(2018). [DOI] [PMC free article] [PubMed] [Google Scholar]
- 21.Pedowitz NJ & Pratt MR Design and synthesis of metabolic chemical reporters for the visualization and identification of glycoproteins. RSC Chemical Biology 2, 306–321 (2021). [DOI] [PMC free article] [PubMed] [Google Scholar]
- 22.Palaniappan KK & Bertozzi CR Chemical Glycoproteomics. Chem Rev 116, 14277–14306 (2016). [DOI] [PMC free article] [PubMed] [Google Scholar]
- 23.Konzman D et al. O-GlcNAc: Regulator of Signaling and Epigenetics Linked to X-linked Intellectual Disability. Front Genet 11, 605263 (2020). [DOI] [PMC free article] [PubMed] [Google Scholar]
- 24.Devaraj NK The Future of Bioorthogonal Chemistry. ACS Cent Sci 4, 952–959 (2018). [DOI] [PMC free article] [PubMed] [Google Scholar]
- 25.Breidenbach MA et al. Targeted metabolic labeling of yeast N-glycans with unnatural sugars. Proc Natl Acad Sci U S A 107, 3988–93 (2010). [DOI] [PMC free article] [PubMed] [Google Scholar]
- 26.Kim EJ, Perreira M, Thomas CJ & Hanover JA An O-GlcNAcase-Specific Inhibitor and Substrate Engineered by the Extension of the N-Acetyl Moiety. Journal of the American Chemical Society 128, 4234–4235 (2006). [DOI] [PubMed] [Google Scholar]
- 27.Kim EJ et al. Distinctive Inhibition of O-GlcNAcase Isoforms by an α-GlcNAc Thiolsulfonate. Journal of the American Chemical Society 129, 14854–14855 (2007). [DOI] [PubMed] [Google Scholar]
- 28.Kim EJ et al. Optimizing the selectivity of DIFO-based reagents for intracellular bioorthogonal applications. Carbohydr. Res. 377, 18–27 (2013). [DOI] [PMC free article] [PubMed] [Google Scholar]
- 29.Kim EJ et al. Versatile O-GlcNAc transferase assay for high-throughput identification of enzyme variants, substrates, and inhibitors. Bioconjugate Chem. 25, 1025–30 (2014). [DOI] [PMC free article] [PubMed] [Google Scholar]
- 30.Mukherjee MM et al. Development of 9-Pr4ManNAlk phenanthrene Derivative as Fluorescent-Raman Bioorthogonal Probe to Specifically interrogate the Biosynthesis of Gangliosides. GLYCOBIOLOGY 33, 980–980 (2023). [Google Scholar]
- 31.Hao Y et al. Next-generation unnatural monosaccharides reveal that ESRRB O-GlcNAcylation regulates pluripotency of mouse embryonic stem cells. Nat Commun 10, 4065 (2019). [DOI] [PMC free article] [PubMed] [Google Scholar]
- 32.Fan X et al. Cell-type-specific labeling and profiling of glycans in living mice. Nat Chem Biol 18, 625–633 (2022). [DOI] [PubMed] [Google Scholar]
- 33.Choi J et al. Engineering Orthogonal Polypeptide GalNAc-Transferase and UDP-Sugar Pairs. J Am Chem Soc 141, 13442–13453 (2019). [DOI] [PMC free article] [PubMed] [Google Scholar]
- 34.Schumann B et al. Bump-and-Hole Engineering Identifies Specific Substrates of Glycosyltransferases in Living Cells. Mol Cell 78, 824–834 e15 (2020). [DOI] [PMC free article] [PubMed] [Google Scholar]
- 35.Tan HY et al. Direct One-Step Fluorescent Labeling of O-GlcNAc-Modified Proteins in Live Cells Using Metabolic Intermediates. J Am Chem Soc 140, 15300–15308 (2018). [DOI] [PubMed] [Google Scholar]
- 36.Batt AR, Zaro BW, Navarro MX & Pratt MR Metabolic Chemical Reporters of Glycans Exhibit Cell-Type-Selective Metabolism and Glycoprotein Labeling. Chembiochem 18, 1177–1182 (2017). [DOI] [PMC free article] [PubMed] [Google Scholar]
- 37.Chuh KN, Zaro BW, Piller F, Piller V & Pratt MR Changes in metabolic chemical reporter structure yield a selective probe of O-GlcNAc modification. J Am Chem Soc 136, 12283–95 (2014). [DOI] [PMC free article] [PubMed] [Google Scholar]
- 38.Tsukiji S & Hamachi I Ligand-directed tosyl chemistry for in situ native protein labeling and engineering in living systems: from basic properties to applications. Curr Opin Chem Biol 21, 136–43 (2014). [DOI] [PubMed] [Google Scholar]
- 39.Hays JB, Sussman ML & Glass TW Inhibition by 6-O-tosyl galactosides of beta-galactoside phosphorylation and transport by the lactose phosphotransferase system of Staphylococcus aureus. Journal of Biological Chemistry 250, 8834–8839 (1975). [PubMed] [Google Scholar]
- 40.Qin K, Zhang H, Zhao Z & Chen X Protein S-Glyco-Modification through an Elimination-Addition Mechanism. J Am Chem Soc 142, 9382–9388 (2020). [DOI] [PubMed] [Google Scholar]
- 41.Elbein AD INHIBITORS OF THE BIOSYNTHESIS AND PROCESSING OF N-LINKED OLIGOSACCHARIDE CHAINS. Annual Review of Biochemistry 56, 497–534 (1987). [DOI] [PubMed] [Google Scholar]
- 42.Stanley P, Taniguchi N & M. A N-Glycans. in Essentials of Glycobiology (ed. Varki A, C.R., Esko JD) 2015–2017 (Cold Spring Harbor Laboratory Press, Cold Spring Harbor (NY), 2017). [Google Scholar]
- 43.Moore SE & Spiro RG Demonstration that Golgi endo-alpha-D-mannosidase provides a glucosidase-independent pathway for the formation of complex N-linked oligosaccharides of glycoproteins. Journal of Biological Chemistry 265, 13104–13112 (1990). [PubMed] [Google Scholar]
- 44.Choi HY et al. N-glycan Remodeling Using Mannosidase Inhibitors to Increase High-mannose Glycans on Acid alpha-Glucosidase in Transgenic Rice Cell Cultures. Sci Rep 8, 16130 (2018). [DOI] [PMC free article] [PubMed] [Google Scholar]
- 45.Tarentino AL, Trimble RB & Plummer TH Enzymatic Approaches for Studying the Structure, Synthesis, and Processing of Glycoproteins. in Methods in Cell Biology, Vol. 32 (ed. Tartakoff AM) 111–139 (Academic Press, 1989). [DOI] [PubMed] [Google Scholar]
- 46.Gordon RD et al. X-ray Crystal Structures of Rabbit N-acetylglucosaminyltransferase I (GnT I) in Complex with Donor Substrate Analogues. Journal of Molecular Biology 360, 67–79 (2006). [DOI] [PubMed] [Google Scholar]
- 47.Kadirvelraj R et al. Human N-acetylglucosaminyltransferase II substrate recognition uses a modular architecture that includes a convergent exosite. Proc Natl Acad Sci U S A 115, 4637–4642 (2018). [DOI] [PMC free article] [PubMed] [Google Scholar]
- 48.Carpentier M et al. Nucleolin Undergoes Partial N- and O-Glycosylations in the Extranuclear Cell Compartment. Biochemistry 44, 5804–5815 (2005). [DOI] [PubMed] [Google Scholar]
- 49.Zhang L et al. Boronic acid functionalized core-satellite composite nanoparticles for advanced enrichment of glycopeptides and glycoproteins. Chemistry 15, 10158–66 (2009). [DOI] [PubMed] [Google Scholar]
- 50.Sawicki SG & Godman GC ON THE DIFFERENTIAL CYTOTOXICITY OF ACTINOMYCIN D. Journal of Cell Biology 50, 746–761 (1971). [DOI] [PMC free article] [PubMed] [Google Scholar]
- 51.Snaar S, Wiesmeijer K, Jochemsen AG, Tanke HJ & Dirks RW Mutational Analysis of Fibrillarin and Its Mobility in Living Human Cells. Journal of Cell Biology 151, 653–662 (2000). [DOI] [PMC free article] [PubMed] [Google Scholar]
- 52.Du J et al. Metabolic glycoengineering: Sialic acid and beyond. Glycobiology 19, 1382–1401 (2009). [DOI] [PMC free article] [PubMed] [Google Scholar]
- 53.Qin W et al. Artificial Cysteine S-Glycosylation Induced by Per-O-Acetylated Unnatural Monosaccharides during Metabolic Glycan Labeling. Angew Chem Int Ed Engl 57, 1817–1820 (2018). [DOI] [PubMed] [Google Scholar]
- 54.Darabedian N et al. O-Acetylated Chemical Reporters of Glycosylation Can Display Metabolism-Dependent Background Labeling of Proteins but Are Generally Reliable Tools for the Identification of Glycoproteins. Front Chem 8, 318 (2020). [DOI] [PMC free article] [PubMed] [Google Scholar]
- 55.Wu H et al. A photo-cross-linking GlcNAc analog enables covalent capture of N-linked glycoprotein-binding partners on the cell surface. Cell Chem Biol (2021). [DOI] [PMC free article] [PubMed] [Google Scholar]
- 56.Pederson T Protein Mobility within the Nucleus—What Are the Right Moves? Cell 104, 635–638 (2001). [DOI] [PubMed] [Google Scholar]
- 57.Taniguchi N & Kizuka Y Glycans and cancer: role of N-glycans in cancer biomarker, progression and metastasis, and therapeutics. Adv Cancer Res 126, 11–51 (2015). [DOI] [PubMed] [Google Scholar]
- 58.Munkley J & Elliott DJ Hallmarks of glycosylation in cancer. Oncotarget; Vol 7, No 23 (2016). [DOI] [PMC free article] [PubMed] [Google Scholar]
- 59.Shivatare VS et al. Unprecedented Role of Hybrid N-Glycans as Ligands for HIV-1 Broadly Neutralizing Antibodies. J Am Chem Soc 140, 5202–5210 (2018). [DOI] [PubMed] [Google Scholar]
- 60.Zhou J, Gao H, Xie W & Li Y FcgammaR-binding affinity of monoclonal murine IgG1s carrying different N-linked Fc oligosaccharides. Biochem Biophys Res Commun 520, 8–13 (2019). [DOI] [PubMed] [Google Scholar]
- 61.Gurcel C et al. Identification of new O-GlcNAc modified proteins using a click-chemistry-based tagging. Analytical and Bioanalytical Chemistry 390, 2089–2097 (2008). [DOI] [PubMed] [Google Scholar]
- 62.Zaro BW, Yang YY, Hang HC & Pratt MR Chemical reporters for fluorescent detection and identification of O-GlcNAc-modified proteins reveal glycosylation of the ubiquitin ligase NEDD4-1. Proc Natl Acad Sci U S A 108, 8146–51 (2011). [DOI] [PMC free article] [PubMed] [Google Scholar]
- 63.Mukherjee MM, Basu N, Chaudhury A & Ghosh R Efficient one-pot per-O-acetylation–thioglycosidation of native sugars, 4,6-O-arylidenation and one-pot 4,6-O-benzylidenation–acetylation of S-/O-glycosides catalyzed by Mg(OTf)2. RSC Advances 6, 109301–109314 (2016). [Google Scholar]
- 64.Mukherjee MM, Basu N, Nandi S & Ghosh R A metal free mild and green approach for tandem opening of 4,6-O-benzylidene acetals to their corresponding 6-O-acetyl derivatives: Application in the synthesis of a trisaccharide using one-pot glycosylation reactions. Carbohydrate Research 476, 36–43 (2019). [DOI] [PubMed] [Google Scholar]
- 65.Nakajima K et al. Simultaneous determination of nucleotide sugars with ion-pair reversed-phase HPLC. Glycobiology 20, 865–871 (2010). [DOI] [PubMed] [Google Scholar]
- 66.Sun X, Mahajan D, Chen B, Song Z & Lu L A quantitative study of the Golgi retention of glycosyltransferases. J Cell Sci 134(2021). [DOI] [PubMed] [Google Scholar]
- 67.Shajahan A, Heiss C, Ishihara M & Azadi P Glycomic and glycoproteomic analysis of glycoproteins-a tutorial. Anal Bioanal Chem 409, 4483–4505 (2017). [DOI] [PMC free article] [PubMed] [Google Scholar]
- 68.Altschul SF, Gish W, Miller W, Myers EW & Lipman DJ Basic local alignment search tool. Journal of Molecular Biology 215, 403–410 (1990). [DOI] [PubMed] [Google Scholar]
- 69.The UniProt C UniProt: the Universal Protein Knowledgebase in 2023. Nucleic Acids Research 51, D523–D531 (2023). [DOI] [PMC free article] [PubMed] [Google Scholar]
- 70.Berman HM et al. The Protein Data Bank. Nucleic Acids Research 28, 235–242 (2000). [DOI] [PMC free article] [PubMed] [Google Scholar]
- 71.Ünligil UM et al. X-ray crystal structure of rabbit N-acetylglucosaminyltransferase I: catalytic mechanism and a new protein superfamily. The EMBO Journal 19, 5269–5280–5280 (2000). [DOI] [PMC free article] [PubMed] [Google Scholar]
- 72.Jacobson MP, Friesner RA, Xiang Z & Honig B On the Role of the Crystal Environment in Determining Protein Side-chain Conformations. Journal of Molecular Biology 320, 597–608 (2002). [DOI] [PubMed] [Google Scholar]
- 73.Jacobson MP et al. A hierarchical approach to all-atom protein loop prediction. Proteins: Structure, Function, and Bioinformatics 55, 351–367 (2004). [DOI] [PubMed] [Google Scholar]
- 74.Lu C et al. OPLS4: Improving Force Field Accuracy on Challenging Regimes of Chemical Space. J Chem Theory Comput 17, 4291–4300 (2021). [DOI] [PubMed] [Google Scholar]
- 75.Humphrey W, Dalke A & Schulten K VMD: Visual molecular dynamics. Journal of Molecular Graphics 14, 33–38 (1996). [DOI] [PubMed] [Google Scholar]
- 76.Case DA et al. AmberTools. Journal of Chemical Information and Modeling 63, 6183–6191 (2023). [DOI] [PMC free article] [PubMed] [Google Scholar]
- 77.Jakalian A, Jack DB & Bayly CI Fast, efficient generation of high-quality atomic charges. AM1-BCC model: II. Parameterization and validation. Journal of Computational Chemistry 23, 1623–1641 (2002). [DOI] [PubMed] [Google Scholar]
- 78.Wang J, Wolf RM, Caldwell JW, Kollman PA & Case DA Development and testing of a general amber force field. Journal of Computational Chemistry 25, 1157–1174 (2004). [DOI] [PubMed] [Google Scholar]
- 79.Maier JA et al. ff14SB: Improving the Accuracy of Protein Side Chain and Backbone Parameters from ff99SB. Journal of Chemical Theory and Computation 11, 3696–3713 (2015). [DOI] [PMC free article] [PubMed] [Google Scholar]
- 80.Harvey MJ, Giupponi G & Fabritiis GD ACEMD: Accelerating Biomolecular Dynamics in the Microsecond Time Scale. Journal of Chemical Theory and Computation 5, 1632–1639 (2009). [DOI] [PubMed] [Google Scholar]
- 81.Essmann U et al. A smooth particle mesh Ewald method. The Journal of Chemical Physics 103, 8577–8593 (1995). [Google Scholar]
- 82.Davidchack RL, Handel R & Tretyakov MV Langevin thermostat for rigid body dynamics. The Journal of Chemical Physics 130, 234101 (2009). [DOI] [PubMed] [Google Scholar]
- 83.Faller R & de Pablo JJ Constant pressure hybrid Molecular Dynamics–Monte Carlo simulations. The Journal of Chemical Physics 116, 55–59 (2002). [Google Scholar]
- 84.Friesner RA et al. Glide: A New Approach for Rapid, Accurate Docking and Scoring. 1. Method and Assessment of Docking Accuracy. Journal of Medicinal Chemistry 47, 1739–1749 (2004). [DOI] [PubMed] [Google Scholar]
- 85.Friesner RA et al. Extra Precision Glide: Docking and Scoring Incorporating a Model of Hydrophobic Enclosure for Protein−Ligand Complexes. Journal of Medicinal Chemistry 49, 6177–6196 (2006). [DOI] [PubMed] [Google Scholar]
- 86.Genheden S & Ryde U The MM/PBSA and MM/GBSA methods to estimate ligand-binding affinities. Expert Opinion on Drug Discovery 10, 449–461 (2015). [DOI] [PMC free article] [PubMed] [Google Scholar]
Associated Data
This section collects any data citations, data availability statements, or supplementary materials included in this article.
Supplementary Materials
Supplemental Figure 1. NMR spectra of 1,3-Pr2 GlcNAlk (5) and 1,3-Pr2-6-OTs GlcNAlk (MM-JH-1, 6); (A) 1H NMR spectrum (600 MHz) of 5. (B) 13C NMR spectrum (150 MHz) of 5. (C) 1H-1H COSY spectrum of 5. (D) 1H-13C HSQC spectrum of 5. (E) 1H NMR spectrum (600 MHz) of 6. (F) 13C NMR spectrum (150 MHz) of 6. (G) 1H-1H COSY spectrum of 6. (H) 1H-13C HSQC spectrum of 6.
Supplemental Figure 2. (A) HRMS spectrum of MM-JH-1. (B) MALDI-mass spectrum of MM-JH-1.
Supplemental Figure 3. Assessment of concentration dependent labeling of MM-JH-1 on HeLa and Female MEF cells. Cells incubated with different concentrations of MM-JH-1 were collected to check the extent of cellular uptake and the effect on O-GlcNAcylation. (A) Concentration dependent incorporation of MM-JH-1 in HeLa cells collected by physical scraping (N = 4; An ordinary one-way ANOVA test shows ****p < 0.0001, **p = 0.0017, ns = not significant, error bar represents standard deviation). (B) Concentration dependent incorporation of MM-JH-1 in HeLa cells collected by trypsinization (N = 4; An ordinary one-way ANOVA test shows ****p < 0.0001, ***p = 0.0008, **p = 0.0097, *p = 0.0456, ns = not significant, error bar represents standard deviation). (C) Concentration dependent incorporation of MM-JH-1 in Female MEF cells collected by physical scraping (N = 3; An ordinary one-way ANOVA test shows ****p < 0.0001, ns = not significant, error bar represents standard deviation). (D) Concentration dependent incorporation of MM-JH-1 in Female MEF cells collected by trypsinization (N = 3; An ordinary one-way ANOVA test shows ****p < 0.0001, **p = 0.0094, ns = not significant, error bar represents standard deviation).
Supplemental Figure 4. Assessment of concentration dependent labeling of MM-JH-1 on multiple different cell lines and corresponding cytotoxicity. Cells incubated with different concentrations of MM-JH-1 were collected to check the extent of cellular uptake. (A) Concentration dependent incorporation of MM-JH-1 in MCF7 cells collected by physical scraping (N = 4; An ordinary one-way ANOVA test shows ****p < 0.0001, **p = 0.0022, ns = not significant, error bar represents standard deviation). (B) Concentration dependent incorporation of MM-JH-1 in MCF7 cells collected by trypsinization (N = 3; An ordinary one-way ANOVA test shows ****p < 0.0001, **p = 0.0090, *p = 0.0499, ns = not significant, error bar represents standard deviation). (C) Concentration dependent incorporation of MM-JH-1 in COS7 cells collected by physical scraping (N = 4; An ordinary one-way ANOVA test shows ****p < 0.0001, ***p = 0.0001, ns = not significant, error bar represents standard deviation). (D) Concentration dependent incorporation of MM-JH-1 in COS7 cells collected by trypsinization (N = 4; An ordinary one-way ANOVA test shows ****p < 0.0001, ***p = 0.0001, ns = not significant, error bar represents standard deviation). (E) Concentration dependent incorporation of MM-JH-1 in NIH 3T3 cells collected by physical scraping (N = 3; An ordinary one-way ANOVA test shows ****p < 0.0001, ns = not significant, error bar represents standard deviation). (F) Concentration dependent incorporation of MM-JH-1 in NIH 3T3 cells collected by trypsinization (N = 3; An ordinary one-way ANOVA test shows ****p < 0.0001, ns = not significant, error bar represents standard deviation). (G) Concentration dependent incorporation of MM-JH-1 in HEK 293T cells collected by physical scraping (N = 3; An ordinary one-way ANOVA test shows ****p < 0.0001, **p = 0.0017, ns = not significant, error bar represents standard deviation). (H) Cell viability of different cell lines treated with differing concentrations (25 μM-500 μM) of MM-JH-1 (N = 4).
Supplemental Figure 5. Assessment of concentration dependent labeling of 1,3-Pr2 GlcNAlk (5) and 6-OTs GlcNAlk in HeLa cells. HeLa cells separately incubated with different concentrations of 1,3-Pr2 GlcNAlk (5) or 6-OTs GlcNAlk were collected to check the extent of cellular uptake. (A) Concentration dependent incorporation of 1,3-Pr2 GlcNAlk (5) in HeLa cells collected by physical scraping (N = 3; An ordinary one-way ANOVA test shows ****p < 0.0001, ***p = 0.0007, **p = 0.0065, *p = 0.0153, ns = not significant, error bar represents standard deviation). (B) Concentration dependent incorporation of 1,3-Pr2 GlcNAlk (5) in HeLa cells collected by trypsinization (N = 4; An ordinary one-way ANOVA test shows *p = 0.0304, ns = not significant, error bar represents standard deviation). (C) Labeling of HeLa cells with 500 μM 1,3-Pr2 GlcNAlk (5) was detected (AlexaFluor-488) under confocal microscopy. Intracellular O-GlcNAc signals were detected using anti RL2 antibody (N = 3, scale bar = 50 mm and 10 mm for zoomed in images). (D) Concentration dependent incorporation of 6-OTs GlcNAlk in HeLa cells collected by physical scraping (N = 4; An ordinary one-way ANOVA test shows ****p < 0.0001, *p = 0.0300, ns = not significant, error bar represents standard deviation). (E) Concentration dependent incorporation of 6-OTs GlcNAlk in HeLa cells collected by trypsinization (N = 4; An ordinary one-way ANOVA test shows ****p < 0.0001, *p = 0.0423, error bar represents standard deviation).
Supplemental Figure 6. MM-JH-1 is enzymatically labeling HeLa cell lysates (A) Workflow to assess the enzymatic incorporation of MCRs in HeLa cells. HeLa cell lysates before and after heat deactivation were incubated with different MCRs for 2 hours at 37 °C followed by a click reaction with TAMRA-azide, after which the lysates were subjected to western blotting. (B) HeLa cell lysates before and after heat deactivation were incubated with DMSO, GlcNAlk, Ac4GlcNAlk, 1,3-Pr2 GlcNAlk, MM-JH-1, or 6-OTs GlcNAlk for 2 hours at 37 °C.
Supplemental Figure 7. Ultra-performance liquid chromatography – high resolution accurate mass – mass spectrometry (UPLC-HRMS) analysis of nucleotide sugar extract shows formation of the corresponding UDP-MM-JH-1 nucleotide sugar. (A) UPLC-HRMS analysis of nucleotide sugar extract from DMSO treated HeLa cells. (B) UPLC-HRMS analysis of nucleotide sugar extract from MM-JH-1 treated HeLa cells.
Supplemental Figure 8. MM-JH-1 is not labeling lipids, RNAs or GPI-anchors in HeLa cells. (A) Neither nonionic detergent-X100 nor organic solvent acetone has any effect on the MM-JH-1 labeling, demonstrating MM-JH-1 labeling is not related to lipids. All quantification of images was done by normalizing mean fluorescent signal to DAPI (blue), and each quantification is shown next to the respective image (N = 3; n = 25; N = Number of experiment repeat, n = Number of individual cells chosen for quantification of the confocal images. An ordinary one-way ANOVA test shows ns = not significant. scale bar = 50 mm and 10 mm for zoomed in images, error bar represents standard deviation). (B) RNAse treatment has no effect on MM-JH-1, signifying that MM-JH-1 is not related to RNAs. All quantification of images was done by normalizing mean fluorescent signal to DAPI (blue), and each quantification is shown below the respective image (N = 3; n = 25; N = Number of experiment repeat, n = Number of individual cells chosen for quantification of the confocal images, An unpaired t-test shows ns = not significant, scale bar = 50 mm and 10 mm for zoomed in images, error bar represents standard deviation). (C) MM-JH-1 labeling in HeLa cells remained unchanged after phospholipase C (PLC) treatment implying that the signals are not associated with GPI-anchors (N = 4, An unpaired t-test shows ns = not significant, error bar represents standard deviation).
Supplemental Figure 9. Effect of the O-GlcNAc transferase (OGT) inhibitor OSMI-1 and N-glycan biosynthesis inhibitor tunicamycin on MM-JH-1 labeling. (A) Increasing amounts of OSMI-1 diminished O-GlcNAc (detected with HGAC85 antibody in red) staining but did not impact MM-JH-1 incorporation (green). Quantification is shown to the right of the images (N= 3; n = 25; An ordinary one-way ANOVA test shows ****p < 0.0001, ns = not significant, N = Number of experiment repeat, n = Number of individual cells chosen for quantification of the confocal images, scale bar = 50 mm and 10 mm for zoomed in images, error bar represents standard deviation). (B) Tunicamycin treatment decreased the signal of MM-JH-1. Increasing concentration of Tunicamycin diminished signal from Calnexin (red) and MM-JH-1 incorporation (green). Quantification is shown to the right of the images (N= 3; n = 10; An ordinary one-way ANOVA test shows ****p < 0.0001; ***p = 0.0003, N = Number of experiment repeat, n = Number of individual cells chosen for quantification of the confocal images, scale bar = 50 mm and 10 mm for zoomed in images, error bar represents standard deviation).
Supplemental Figure 10. Glucosidase inhibitors castanospermine (CAST) and 1-deoxynojirimycin (DNJM) reduced the signal of MM-JH-1 (green, detected with AF 488 staining on confocal images), but increased the ConA (red, detected with ConA-Texas red staining on confocal images) signal. (A) Increasing concentration of CAST reduced MM-JH-1 labeling (green, detected with AF 488 staining on confocal images). Augmented signals of ConA (red, detected with ConA-Texas red staining on confocal images) indicated the inhibitory activity of CAST. All quantification of images was done by normalizing mean fluorescent signal to DAPI (blue), and each quantification is shown to the right of the respective images (N = 3; n = 25; An ordinary one-way ANOVA test shows ****p < 0.0001, **p = 0.0035, *p = 0.0491 or 0.0199, N = Number of experiment repeat, n = Number of individual cells chosen for quantification of the confocal images, scale bar = 50 mm and 10 mm for zoomed in images, error bar represents standard deviation). (B) Increasing concentration of DNJM reduced MM-JH-1 labeling (green, detected with AF 488 staining on confocal images). Augmented signals of ConA (red, detected with ConA-Texas red staining on confocal images) indicated the inhibitory activity of DNJM. All quantification of images was done by normalizing mean fluorescent signal to DAPI (blue), and each quantification is shown to the right of the respective images (N = 3; n = 25; An ordinary one-way ANOVA test shows ****p < 0.0001, **p = 0.0042, *p = 0.0134, ns = not significant, N = Number of experiment repeat, n = Number of individual cells chosen for quantification of the confocal images, scale bar = 50 mm and 10 mm for zoomed in images, error bar represents standard deviation).
Supplemental Figure 11. Mannosidase-I inhibitor 1-deoxymannojirimycin (DMJM) and kifunensine both reduced the signal of MM-JH-1. (A) Increasing concentration of DMJM decreased the signals of MM-JH-1 (green, detected with AF 488 staining on confocal images). Increased signals for ConA (red, detected with ConA-Texas red staining on confocal images) signified the inhibitory activity of DMJM. All quantification of images was done by normalizing mean fluorescent signal to DAPI (blue), and each quantification is shown to the right of the respective images (N = 3; n = 25; An ordinary one-way ANOVA test shows ****p < 0.0001, ns = not significant; N = Number of experiment repeat, n = Number of individual cells chosen for quantification of the confocal images, scale bar = 50 mm and 10 mm for zoomed in images, error bar represents standard deviation). (B) Increasing concentration of kifunensine decreased the signals of MM-JH-1 (green, detected with AF 488 staining on confocal images). Amplified signals for ConA (red, detected with ConA-Texas red staining on confocal images) signified the inhibitory activity of kifunensine. All quantification of images was done by normalizing mean fluorescent signal to DAPI (blue), and each quantification is shown to the right of the respective images (N = 3; n = 25; An ordinary one-way ANOVA test shows ****p < 0.0001, ns = not significant; N = Number of experiment repeat, n = Number of individual cells chosen for quantification of the confocal images, scale bar = 50 mm and 10 mm for zoomed in images, error bar represents standard deviation).
Supplemental Figure 12. Mannosidase-I inhibitor DMJM reduced the signal of MM-JH-1 detected with Oregon green-488, while Mannosidase-II inhibitor Swainsonine increased the signal coming from MM-JH-1 detected with AlexaFluor-488. (A) Increasing concentration of DMJM increased the ConA (red, detected with ConA-Texas red staining on confocal images) labeling and decreased MM-JH-1 incorporation detected by Oregon green 488. Oregon green 488 is a different probe than the AF488 used in other figures (green). All quantification of images was done by normalizing mean fluorescent signal to DAPI (blue), and each quantification is shown to the right of the respective images (N = 3; n = 25; An ordinary one-way ANOVA test shows ****p < 0.0001, **P = 0.0017, ns = not significant, N = Number of experiment repeat, n = Number of individual cells chosen for quantification of the confocal images, scale bar = 50 mm and 10 mm for zoomed in images, error bar represents standard deviation). (B) Increasing concentration of swainsonine increased the signals of both MM-JH-1 (green, detected with AF 488 staining on confocal images) and ConA (red, detected with ConA-Texas red staining on confocal images). All quantification of images was done by normalizing mean fluorescent signal to DAPI (blue), and each quantification is shown to the right of the respective images (N = 3; n = 25; An ordinary one-way ANOVA test shows ****p < 0.0001, ns = not significant, N = Number of experiment repeat, n = Number of individual cells chosen for quantification of the confocal images, scale bar = 50 mm and 10 mm for zoomed in images, error bar represents standard deviation).
Supplemental Figure 13. (A) Full MS/MS spectrum of the Man6 N-glycan. The inset shows the structure of the Man6 N-glycan (mass 1538.754). Green circles represent mannose residues, blue squares represent N-acetylglucosamine residues. (B) Molecular structure of Man6 N-glycan, and (C) MM-JH-1-Derivatized hybrid N-Glycan.
Supplemental Figure 14. MM-JH-1 incorporation in HEK 293S GnTI− cells. Cell lysates collected from HEK 293S GnTI− cells incubated with different concentrations of MM-JH-1 were subjected to click reactions with TRIC-azide to check the extent of cellular uptake. (A) No incorporation of MM-JH-1 was observed in HEK 293S GnTI− cells collected by physical scraping (N =3). (B) No incorporation of MM-JH-1 was observed in HEK 293S GnTI− cells collected by trypsinization (N =3). (C) MM-JH-1 incorporated into HEK 293T cells in a concentration dependent manner, but labeling was not detected in HEK 293S GnTI− cells (N = 3).
Supplemental Figure 15. Nuclear labeling by MM-JH-1 was N-linked. (A-C) Extracts were fractionated, blotted, and subjected to PNGase F treatment. PNGase F removed TRITC signal from (A) nuclear, (B) cytoplasmic, and (C) plasma membrane extracts (N = 3). (D-F) Extracts were fractionated, blotted and subject to Endo H treatment. Endo H removed TRITC signal from (D) nuclear, (E) cytoplasmic, and (F) plasma membrane extracts (N = 3).
Supplemental Figure 16. The nucleolar protein Fibrillarin is modified by MM-JH-1. (A) Change in colocalization between fibrillarin signal and MM-JH-1 with Actinomycin D treatment. Actinomycin D treatment was used to disrupt the nucleolus. Colocalization of fibrillarin (red, detected with anti-nucleolar marker fibrillarin antibody) with MM-JH-1 (green, detected with AF 488 signal on confocal images) was examined. Colocalization was determined by Pearson’s R value as indicated to the right of the images. One representative image is shown from three experimental replicates. Scale bar = 50 mm and 10 mm for zoomed in images. (B) Change in colocalization between nucleolin signal and MM-JH-1 with Actinomycin D treatment. Actinomycin D treatment was used to disrupt the nucleolus. Colocalization of nucleolin signal (red, detected with anti-nucleolin antibody) with MM-JH-1 (green, detected with AF 488 signal on confocal images) is examined. Colocalization was determined by Pearson’s R value as indicated to the right of the images. One representative image is shown from three experimental replicates. Scale bar = 50 mm and 10 mm for zoomed in images.
Supplemental Figure 17. Brefeldin A (BFA) treatment resulted in disrupted fibrillarin labeling with a detectable cytoplasmic accumulation of MM-JH-1 and fibrillarin. Representative image is shown from three experimental replicates.
Supplemental Table S1. Scoring of poses obtained for UDP-MM-JH-1 on MGAT1 and MGAT2. For reference, the scores for the UDP-MGAT1 (PDB ID: 2AM5) and UDP-MGAT2 (PDB ID: 5VCM) experimentally determined complexes are reported.
Supplemental Table S2. Results of MM/GBSA scoring for the two putative poses for UDP-MM-JH-1 on MGAT1 and MGAT2.