

Abstract
The human amygdala is primarily known for its involvement in processing emotional and fearful responses, but newer evidence has identified a role for this structure in motor processing. Our lab previously utilized an arm-reaching task and observed significant beta-band (13–30 Hz) modulation in the hippocampus. Given these results, we sought to characterize the role of beta-band modulation in the amygdala during movement execution in participants with stereoelectroencephalography (SEEG) depth electrodes in the amygdala for seizure localization. We show that 9 of 13 participants (69.2 %) showed decreased beta-band power in the amygdala during the Response (movement execution) phase of an arm-reaching task when compared to Fixation (baseline). Secondary analyses show that there are no statistically significant differences in beta-band modulation between ipsilateral and contralateral implanted electrodes, but there is a small difference between male and female participants. The decrease in beta-band power in the amygdala during the Response phase of a Direct Reach task is consistent with our previous findings in the hippocampus. Our study is the first to report beta-band modulation in the amygdala during motor processing and sets the stage for further studies into the involvement of the amygdala in motor control.
Keywords: Amygdala, Stereoelectroencephalography (SEEG), Local field potential (LFP), Beta-band power, Center-out arm reach task, Non-emotional motor processing
1. Introduction
The amygdala is a structure in the mesial temporal lobe that is comprised of a group of nuclei (Krettek and Price, 1978) and is classically known for its role in fear and emotional processing (Davis, 1992; Ehrlich et al., 2009). Although there is not a considerable body of literature to suggest that the amygdala is involved in motor processing, the amygdala has been shown to have anatomic connections with multiple motor-related structures, including the premotor cortex (Ghashghaei et al., 2007); the supplementary motor area (SMA) (Jürgens, 1984); the globus pallidus externus (GPe) (Hunt et al., 2018); and the cingulate and primary motor cortices (Grèzes et al., 2014; Morecraft et al., 2007). Similarly, Lambert et al. (2012) showed that there is structural connectivity between the subthalamic nucleus (STN) and amygdala (Lambert et al., 2012). In addition to structural connectivity, the amygdala also has been shown to have functional connectivity with other canonical motor areas. For example, Toschi et al. observed both structural (with diffusion tensor imaging, DTI) and resting-state functional connectivity (with functional magnetic resonance imaging, fMRI) between the amygdala and pre-motor cortex (Toschi et al., 2017). Despite these observed connections, there have been few investigations into the involvement of the amygdala in motor processing.
Most studies of motor processing in humans have made use of noninvasive methods like scalp electroencephalography (EEG), fMRI (Chow et al., 2017), magnetoencephalography (MEG) (Hoshiyama et al., 1997), or nuclear medicine studies such as positron emission tomography (PET) (Watson, 1997) and single-photon emission computed tomography (SPECT) (George et al., 1992). Although these modalities provide excellent information at low risk to participants, they do not provide the same combination of spatial and temporal resolution as surgically-implanted intracranial electrode recordings, such as electrocorticography (ECoG) with cortical grid electrodes or stereoelectroencephalography (SEEG) with parenchymal depth electrodes, in awake participating subjects undergoing invasive seizure localization (Parvizi and Kastner, 2018). SEEG, in particular, can allow for local field potential (LFP) sampling of deeper subcortical structures like the amygdala and hippocampus (Parvizi and Kastner, 2018). LFPs are the sum of electrical activity of a population of neurons surrounding the electrode contact (Lindén et al., 2011). LFP analysis can be used to study neural oscillations using standard time-frequency signal processing techniques, and the components of the signals can be separated into different frequency bands for analyses during a variety of behavioral tasks (Einevoll et al., 2013). One such frequency band is the beta-band (13–30 Hz), which has been associated with a variety of processes (Engel and Fries, 2010), including working memory (Lundqvist et al., 2011), inhibiting motion (Swann et al., 2011), and inhibiting thought (Castiglione et al., 2019).
Dating back to early intracranial recordings made by Jasper and Penfield during an awake craniotomy, beta-band oscillations have been shown to decrease during the initiation of movement (Jasper and Penfield, 1949). Similarly, Crone and colleagues used ECoG electrodes to show that beta-band power decreases during motor execution (Crone et al., 1998). Other studies have also used electrophysiology to examine cortical beta-band power (13–30 Hz) modulation during motor processing (Kühn et al., 2004a; Zhang et al., 2008). From these studies, beta-band has been posited to represent a steady-state variable that promotes the motor “status quo” (Engel and Fries, 2010). For this reason, increases in beta-band power, or an event-related synchronization (ERS), represent the maintenance of an existing motor set (Androulidakis et al., 2006; Donner et al., 2009; Swann et al., 2009). Decreases in beta-band power, or an event-related desynchronization (ERD), represent changes to the existing motor set(Androulidakis et al., 2006; Donner et al., 2009; Swann et al., 2009). Alternatively, beta-band power increases are thought to be related to movement inhibition and beta-band decreases with movement execution (Kühn et al., 2004b; Zhang et al., 2008). Kühn et al. demonstrated this observation while recording LFPs from the subthalamic nucleus of patients with Parkinson’s disease while they performed a Go/No-go task (Kühn et al., 2004a). For the No-go condition, they observed ERS with movement inhibition (Kühn et al., 2004a). For the Go condition, they observed ERS during movement execution, with late rebounds after movement conclusion (Kühn et al., 2004a). Consistent with previous findings, our lab found that beta-band power in the hippocampus decreases during motor execution in a modified version of the classic “center-out” arm-reaching task in human participants implanted with SEEG contacts for seizure localization (Del Campo-Vera et al., 2020). The Direct Reach task is a modified version of the “center-out” arm reaching task, which has been well-established in the literature (Georgopoulos et al., 1982; Schwartz et al., 1988). In this task, participants reach to the target immediately without a delay phase, and they always reach to the target when signaled to do so. Using the same Direct Reach task, our lab also found increases in gamma-band power in the amygdala during the Response phase compared to the Fixation phase of a Direct Reach task (Gogia et al., 2020), which is the first study to show the involvement of the amygdala in non-emotional motor processing.
Given our findings of beta-band modulation in the hippocampus and gamma-band modulation in the amygdala during movement execution, we sought to determine if the amygdala also showed beta-band modulation during movement execution. We recorded LFPs from SEEG gray matter contacts in the amygdala while participants performed the Direct Reach arm-reaching task, and we focused our analysis on the beta frequency range (13–30 Hz). Based on our findings of decreased beta-band power in the hippocampus during movement execution, we hypothesized that there would be a decrease in beta-band spectral power in the amygdala during the Response phase when compared to the Fixation phase of a Direct Reach arm-reaching task. Given that there are differences between amygdala activity between male and female patients in emotional responses (Andreano et al., 2014), we also sought to ascertain if there was statistically significant difference in beta-band modulation between male and female participants in movement execution in a secondary analysis. Likewise, given the difference in ipsilateral and contralateral activity in motor cortex during movement execution (Downey et al., 2020) and the fact that there is structural connectivity between the amygdala and ipsilateral motor areas (Morecraft et al., 2007), we sought to determine if there was a statistically significant difference in beta-band modulation between ipsilateral and contralateral amygdala contacts during movement execution in a separate secondary analysis. This study is the first study to evaluate the of beta-band oscillations in the human amygdala during movement execution in a non-emotional movement task.
2. Methods
2.1. Participants
Thirteen participants (7 female, 6 male) with medically resistant epilepsy who underwent surgical implantation of depth electrodes for seizure localization were recruited for the study. The average age of the participants was 33 years (range 20–45, mean 33.1). Nine participants were right-handed, two participants were left-handed, and two participants were ambidextrous. Participant characteristics are detailed in Table 1. The participants’ magnetic resonance imaging (MRI), positron emission tomography (PET), single photon emission computed tomography (SPECT), video-EEG, seizure semiology, and clinical history were discussed by the University of Southern California (USC) Comprehensive Epilepsy Center epileptologists, neuroradiologists, neuropsychologists, and neurosurgeons, and the decision was made to proceed with invasive seizure localization. After surgery, participants provided informed consent to participate in the research study. The study and the consent form were approved by the Institutional Review Board (IRB) at USC (Study ID: HS-17-00554).
Table 1.
Participant Profiles.
| ID | Sex | Age | Handedness | Seizure Onset Zone |
|---|---|---|---|---|
| 1 | F | 45 | Right | Right insula/frontal operculum, also right amygdala/hippocampus |
| 2 | F | 39 | Right | Right focal cortical dysplasia, bilateral mesial temporal |
| 3 | M | 37 | Ambidextrous | Right hippocampus |
| 4 | F | 45 | Right | Right orbitofrontal |
| 5 | F | 21 | Right | Right mesial temporal |
| 6 | F | 20 | Right | Right hippocampus |
| 7 | M | 21 | Left | Right amygdala |
| 8 | M | 38 | Right | Left mesial temporal |
| 9 | M | 24 | Right | Left hippocampus |
| 10 | M | 32 | Right | Bilateral hippocampus (L>R) |
| 11 | F | 27 | Ambidextrous | Bilateral hippocampus (L>R) |
| 12 | M | 40 | Right | Right superior temporal, remnant resection cavity |
| 13 | F | 41 | Left | Left mesial temporal |
Individual characteristics for 13 participants with medically refractory epilepsy who underwent stereoelectroencephalography (SEEG) for seizure localization.
Electrode placement was determined by standard-of-care clinical criteria without consideration of the research study and varied from participant to participant. All participants had electrodes placed in other brain areas in addition to the amygdala, but locations varied depending on seizure onset zone hypotheses. With respect to amygdala electrodes, seven participants had electrodes placed in the amygdala bilaterally, two participants had electrodes in the right amygdala only, and four participants had electrodes in the left amygdala only. The laterality, type of electrode, and number of gray matter contacts within the amygdala is listed in Table 2. Postoperative CT merged with T1 and T2 axial, coronal, and sagittal MRIs for a representative participant are shown in Fig. 1 (and all merged images are included in Figures S1–S13).
Table 2.
Implanted Electrodes.
| Cerebral Hemisphere | Number of Electrode Leads in the Amygdala | Types of Electrode Leads in the Amygdala | Number of Contacts in the Amygdala | |
|---|---|---|---|---|
| 1 | Left | 1 | MM16 A-SP05X-000 | 4 |
| Right | 1 | MM16 A-SP05X-000 | 4 | |
| 2 | Left | 1 | MM16 A-SP05X-000 | 4 |
| Right | 1 | MM16 A-SP05X-000 | 4 | |
| 3 | Left | 1 | MM16 A-SP05X-000 | 4 |
| Right | 1 | MM16 A-SP05X-000 | 3 | |
| 4 | Left | 1 | MM16 A-SP05X-000 | 3 |
| Right | 1 | MM16 A-SP05X-000 | 3 | |
| 5 | Left | 1 | SD10R-SP05X-000 | 2 |
| Right | 1 | SD10R-SP05X-000 | 3 | |
| 6 | Left | 0 | N/A | 0 |
| Right | 1 | SD10R-SP05X-000 | 4 | |
| 7 | Left | 0 | N/A | 0 |
| Right | 1 | SD10R-SP05X-000 | 2 | |
| 8 | Left | 1 | MM16 A-SP05X-000 | 2 |
| Right | 0 | N/A | 0 | |
| 9 | Left | 1 | MM16 A-SP05X-000 | 3 |
| Right | 0 | N/A | 0 | |
| 10 | Left | 1 | SD10R-SP05X-000 | 4 |
| Right | 1 | SD10R-SP05X-000 | 4 | |
| 11 | Left | 1 | SD10R-SP05X-000 | 4 |
| Right | 0 | N/A | 0 | |
| 12 | Left | 1 | SD10R-SP05X-000 | 4 |
| Right | 0 | N/A | 0 | |
| 13 | Left | 1 | SD10R-SP05X-000 | 4 |
| Right | 1 | SD10R-SP05X-000 | 4 | |
| ALL | Left | 11 | 38 | |
| Right | 9 | 31 | ||
| Total | 20 | 69 |
Summary of the total number of implanted electrode leads, electrode types, and the total number of gray matter contacts, separated into left- and right-sided implants.
Fig. 1.
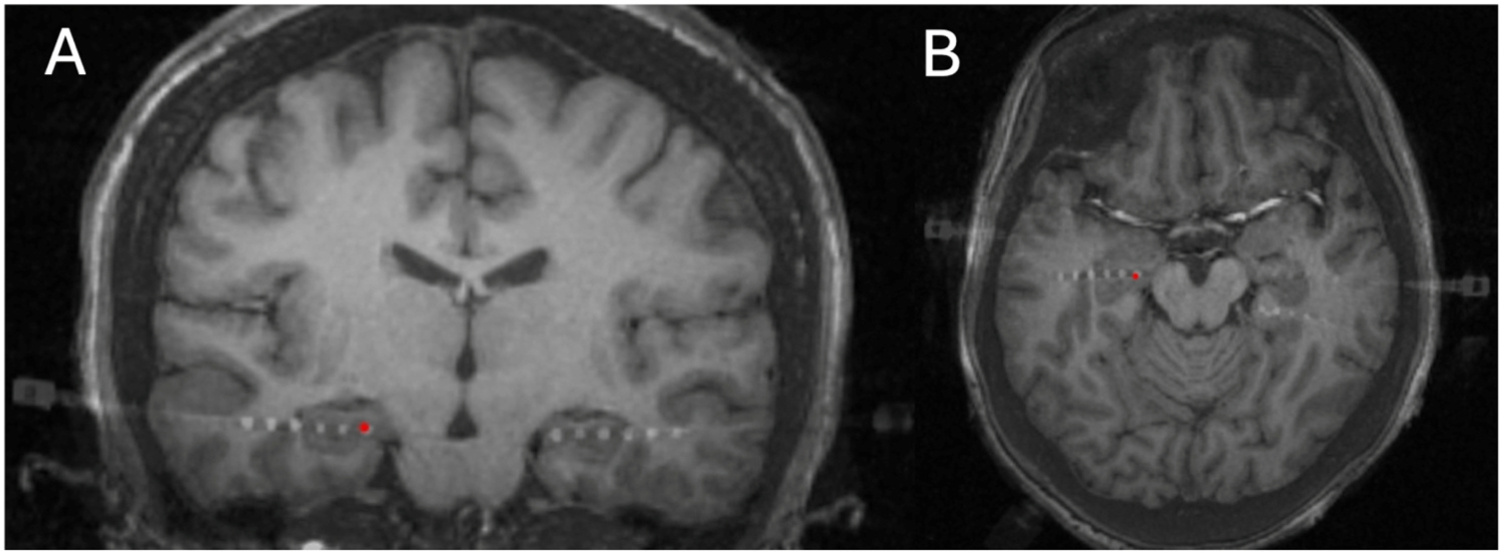
Preoperative T1-weighted MR images fused to postoperative CT scan showing lead placement in the amygdala bilaterally. A) coronal image and B) axial image.
2.2. Neural signal acquisition and processing
Participants were implanted with either Spencer depth electrodes 1 × 10 (SD10R-SP05X-000, Ad-Tech Medical Instrumentation Corporation, Oak Creek, WI, USA) or Macro-Micro depth electrodes (MM16 A-SP05X-000, Ad-Tech Medical Instrumentation Corporation, Oak Creek, WI, USA). The Spencer depth 1 × 10 electrodes have 10 platinum contacts with 5 mm spacing (center-to-center) that are 2.41 mm in length and 1.12 mm in diameter. The Macro-Micro contacts have 6 macro and 10 micro contacts. Macro contacts on these electrodes are 1.3 mm in diameter and 1.57 mm in length with 5 mm spacing (center-to-center). Only signals from the macro contacts were analyzed in the present study.
LFPs were recorded from the contacts of the Spencer depth electrodes and macro contacts of the Macro-Micro depth electrodes during various phases of the task (described below). To avoid interruptions in clinical EEG recordings, the cables from the electrodes were connected to a splitter box that allowed for parallel signal acquisition through the research Neural Signal Processor (NSP, Neuroport System, Blackrock Microsystems, Salt Lake City, UT, USA) and the clinical Natus XL Tek (Natus Medical Incorporated, Pleasanton, CA, USA) video EEG monitoring station. Neural signals were amplified with unity gain, filtered with an analog 1st order Butterworth high-pass (0.3 Hz) and analog 3rd order low-pass (7500 Hz) filters, digitized with 16-bit, 250nV resolution, and sampled at 30,000 samples per second with the NSP. Built-in adaptive line noise cancellation (60 Hz) filtering (4th order high/low pass digital filtering) was used on all channels. All signals were referenced to a white matter contact that was identified by the epileptologist. For analysis, the original signal was downsampled to 2000 samples per second after applying a 4th-order Butterworth lowpass filter (500 Hz).
2.3. ‘Center-out’ direct reach task
Participants performed a modified “Center-Out’ Direct Reach experimental task that was used in our previous study (Del Campo-Vera et al., 2020). The task paradigm is depicted in Fig. 2. The task consists of three phases: the inter-trial-interval (ITI), the Fixation phase, and the Response phase. MATLAB© (2022, The MathWorks, Inc., Natick, MA, USA) with the Psychophysics Toolbox Version 3 (PTB-3) was used to program and control the task (Brainard, 1997; Kleiner et al., 2007; Pelli, 1997). A 21.5-inch LED-backlit touch-screen monitor with 1920 × 1080 pixels and 250 cd m−2 luminance (S2240Tb, Dell Inc., Round Rock, TX, USA) was used to display the task.
Fig. 2.

Task design for the ‘center-out’ Direct Reach task. A) In the ITI, the participant waits for the fixation dot to appear (1–2 s), in the Fixation phase (1–4 s), the participant points to the fixation dot, and in the Response phase, the participant reaches for the target and double taps the screen, B) Targets appear at 1 of 8 random locations around fixation dot, and each number is displayed an equal number of times.
The task proceeded as follows (Fig. 2A): during the ITI phase, the participant held their right hand approximately 5 cm from the center of the blank screen and waited for the next phase. In the Fixation phase, a gray fixation dot (19 mm in diameter) appeared in the center of the screen. Participants were instructed to point to and fix their gaze upon the dot, being careful not to move. The phase length varied between 1 and 4 seconds to prevent conditioned responses. The Fixation phase served as the baseline for spectral analysis, as the participant was instructed not to move. Next, during the Response phase, a white target circle (31.8 mm in diameter) appeared pseudorandomly at 1 of 8 target locations (Fig. 2B). The participants were instructed to reach for the target and double tap the screen to signal the end of the Response phase. The 8 target locations formed a circle on the screen with the fixation dot at the center with a radius of 114.3 mm. In 64 trials, each of the 8 target locations was used 8 times. The different target locations were used to prevent conditioned responses rather than to assess for directional tuning. As such, the different target locations were all analyzed as one data set without consideration of the location around the circle. Trials with a response time less than or greater than 1.5 times the interquartile range were excluded, as short trials were thought to represent accidental movements and long trials were thought to reflect lack of proper attention to the task. Trials in which the participant failed to reach or double tap the screen were also excluded. If > 50 % of trials were excluded, then the session was not considered to be of high enough quality for analysis and was excluded.
2.4. Criteria and considerations for data analysis
To ensure quality recordings, all unnecessary electronic equipment was turned off or stowed (e.g. television, tablets, cell phones, blood pressure cuff, etc.). Unnecessary entrance and exit from the hospital room was restricted. Participants were allowed a short training session with the task before performing the task for analysis. The researchers monitored the participants during the task to ensure proper attention, and every trial was video recorded. Signal quality was assessed in real time on the NSP by checking the cross-talk, 60 Hz noise, and the noise floor on the spike panel. If there were any irregularities in the signal, connections were checked until irregularities were resolved.
Trials were reviewed visually for noise and task performance. Electrophysiological data were inspected for artifacts, and task performance was evaluated using video recordings. Trials with poor task performance were excluded from the analysis. Signal quality was further assessed under the guidance of an epileptologist to exclude any trials containing epileptic activity. The number of successful trials that entered the analysis for each participant is indicated as the numerator in the column ‘Proportion of Successful Trials’ of Table 3. On average, 56.5 trials per participant entered the final analysis (see Table 3 for details). Fig. 3 shows a representative LFP plot (top) and single-trial spectrogram (bottom) for a representative successful trial with no artifacts.
Table 3.
Electrode Contacts with Significant Beta-band Modulation.
| ID | Proportion of Successful Trials | Laterality | Number and Percentage of contacts with Significant Modulation | Contact- Averaged Frequency Range of Significant Modulation (Hz)* | p-values |
|---|---|---|---|---|---|
| 1 | 57/64 (89.1%) | Left | 4 (100%) | 13.0 – 30.0 | P ≤ 0.008 |
| Right | 4 (100%) | 13.0 – 30.0 | P ≤ 0.011 | ||
| 2 | 57/64 (89.1%) | Left | 4 (100%) | 14.6 – 16.6 | P ≤ 0.046 |
| Right | 4 (100%) | 13.0–17.6 | P ≤ 0.003 | ||
| 3 | 58/64 (90.6%) | Left | 4 (100%) | 25.4–30.0 | P ≤ 0.018 |
| Right | 3 (100%) | 20.5 – 28.3 | P ≤ 0.046 | ||
| 4 | 57/64 (89.1%) | Left | 3 (100%) | 17.6–20.5 | P ≤ 0.038 |
| Right | 3 (100%) | 13.0 – 15.6 | P ≤ 0.027 | ||
| 5 | 58/64 (90.6%) | Left | 2 (100%) | 21.5–22.5 | P ≤ 0.030 |
| Right | 2 (66.7%) | 19.5 – 20.5 | P ≤ 0.011 | ||
| 6 | 58/64 (90.6%) | Right | 3 (75%) | 20.5 – 21.5 | P ≤ 0.049 |
| 7 | 58/64 (92.2%) | Right | 0 (0%) | N/A | N/A |
| 8 | 56/64 (87.5%) | Left | 0 (0%) | N/A | N/A |
| 9 | 51/64 (79.7%) | Left | 3 (100%) | 20.5–21.5 | P ≤ 0.011 |
| 10 | 60/64 (93.8%) | Left | 0 (0%) | N/A | N/A |
| Right | 0 (0%) | N/A | N/A | ||
| 11 | 58/64 (92.2%) | Left | 0 (0%) | N/A | N/A |
| 12 | 54/64 (84.4%) | Left | 2 (50%) | 19.5–20.5 | P ≤ 0.047 |
| 13 | 53/64 (82.8%) | Left | 3 (75%) | 21.5–22.5 | P ≤ 0.032 |
| Right | 0 (0%) | N/A | N/A | ||
| AVG | 56.5/64 (88.3%) | Left | 2.2 (63.2%)† | 19.2 – 23.1‡ | |
| Right | 2.1 (61.3%)† | 16.6 – 22.3‡ | |||
| Combined | 2.2 (62.3%)† | 18.1–22.8‡ |
Summary of beta-band power modulation in the amygdala during the Direct Reach arm-reaching task. The number of electrode contacts in the amygdala with significant modulation was determined using a nonparametric cluster-based permutation test for all frequency bins in the beta-band (13 – 30Hz). The percentage of contacts with significant modulation was based on the total number of contacts in the amygdala for each participant. In the last column, the highest p-value in the cluster is given.
The contact-average frequency range of significant modulation was computed by averaging the minima and maxima of ranges of significant modulation for all contacts within a single amygdala implant.
Average number of contacts and percentage of total contacts with significant modulation for all participants
Average frequency range of all participants, calculated by averaging the average minima and average maxima of ranges of significant modulation for all participants
Fig. 3.

Representative single-trial ITI-to-ITI local field potential (LFP) tracing (top) and spectrogram (bottom) for a trial in which beta-band power decreases in the Response phase compared to the Fixation phase. Both plots are aligned with the ITI, Fixation, and Response phases of the trial.
Only signals from contacts within the gray matter of the amygdala were analyzed in the current study. The location of these contacts was confirmed by merging a postoperative CT scan with the preoperative MRI using the Medtronic Stealth Station 7 (Medtronic Inc., Dublin, Ireland).
2.5. Spectral power analysis
The signals were analyzed with a multitaper approach using Chronux© (version 2.12 v03, Woods Hole, MA, USA) in MATLAB. The multitaper approach was chosen for its anti-leakage properties and spectral smoothing (Bokil et al., 2010; Cohen, 2014). In this analysis, we used 9 leading tapers and a time-bandwidth product of 5, and zero-padded to 2048 samples. Signals from 13 to 30 Hz were analyzed in frequency bins of approximately 1 Hz. Epochs were initially defined with durations of 1–2 seconds for the ITI phase, 1–4 seconds for the Fixation phase, and variable durations for the Response phase. To ensure uniformity across conditions, these epochs were trimmed to a fixed 0.5-second window for analysis. This trimming process excluded time points at the beginning and end of the initial epochs. Thus, the final analyzed time window was always 0.5 seconds, capturing oscillatory activity in the beta band from approximately 6.5 cycles of 13 Hz activity to 15 cycles of 30 Hz activity. The ITI and Fixation time windows were aligned to the center of the phase. For the Response phase, the window was aligned to the end of the phase to capture reaching movement, excluding the double tap. Bootstrapped 95 % confidence intervals of spectral power (N = 10,000 samples) were computed for the three phases, strictly for visualization purposes on the power spectral density plot (Fig. 4A). Alternative statistical methods were used to compare spectral power between phases (see section below).
Fig. 4.

Beta-band power decreases in the amygdala during the Response phase (RES) compared to the Fixation phase (FIX). A) Trial-averaged power spectral density (PSD) plot from a gray matter electrode contact in the amygdala in a representative participant, shaded regions represent the boot-strapped (n = 10,000) 95 % confidence intervals. B) Half-histogram/half-violin paired observation plot of trial-averaged power calculated over the frequency of significant modulation as determined by the nonparametric cluster-based permutation test (n = 1000, p < 0.05) for a representative gray matter electrode contact, gray lines represent individual trials in the 3 phases.
2.6. Statistical analysis of spectral power
Statistical comparisons were performed in the frequency domain using the power spectral density (PSD) computed with the multitaper approach. The computed beta-band spectral power for all ~1 Hz frequency bins in the beta frequency range (13–30 Hz) was compared between the Fixation and the Response phases using a non-parametric cluster-based permutation test. The non-parametric cluster-based permutation test does not rely on assumptions about the distribution of the data, addresses issues with multiple comparisons, and has greater sensitivity than other methods such as the Bonferroni correction (Maris and Oostenveld, 2007). Our null hypothesis (H0) was that there was no difference in measures of central tendency of beta-band spectral power in the amygdala between the Fixation and Response phases. Since our previous experiments showed that beta-band power decreased during the Response phase when compared to the Fixation phase in the hippocampus in a Direct Reach task, our alternate hypothesis (H1) was that measures of central tendency for a distribution of beta-band power values would be less for the Response phase than for the Fixation phases for the amygdala.
For the cluster-based permutation approach, we used the summed z-values obtained from the Wilcoxon signed-rank test as the measure for forming the clusters that passed the significant threshold of p ≤ 0.05. Clusters were formed across frequency bins and electrode contacts, and for a cluster to be assigned, there had to be modulation in the same frequency bin across at least two contacts. Although the Wilcoxon signed-rank test is non-parametric, the Matlab “signrank” function computes an approximate z-score for large sample sizes based on the normal distribution. This approximation leverages the Central Limit Theorem and is a computationally efficient adaptation for large datasets. It is important to note that this does not alter the non-parametric nature of the Wilcoxon signed-rank test. This approach is widely accepted for handling large-scale statistical analyses in a computationally efficient manner.
To perform the cluster-based permutation test, we first obtained ‘observed p-values’ with a right-tailed Wilcoxon signed rank test for each frequency bin, comparing the Fixation and Response phases. We then obtained ‘calculated p-values’ by performing a Wilcoxon signed rank test between two random partitions of a combined set containing Fixation and Response phase data. This step was repeated (N = 1000 iterations) to generate a null distribution of ‘calculated p-values.’ The proportion of ‘calculated p-values’ more extreme than the ‘observed p-value’ yielded the right-sided Monte-Carlo p-value. The threshold p-value for statistical significance used in this study was 0.05, corresponding to a z-score of 1.96. The absolute values of z-scores corresponding to the frequency bins with statistically significant differences were summed, and the cluster with the largest summation of absolute valued z-scores was the significant cluster.
For the group level analysis, the spectral power in the beta band from 13 – 30 Hz was computed during the Fixation and the Response phases for all channels. These values were then normalized, and an average power Fixation and Response power was computed for each subject in the two phases. We then used a right-tailed Wilcoxon signed-rank test to test for statistical significance with a critical p-value of 0.05.
2.7. Statistical analysis of effects of ipsilateral vs. contralateral positioning
For contacts that showed statistically significant beta-modulation in the cluster-based permutation test, we evaluated if there were any statistically significant differences in modulation between the ipsilateral (right) and contralateral (left). For this analysis, we used the Yates-corrected z-test of proportions:
| (1) |
Where and are proportions of significantly modulating contacts to the total number of contacts found in the ipsilateral and contralateral regions, respectively; and are the total number of contacts in the ipsilateral and contralateral regions; and is the proportion of significantly modulating contacts of both samples combined. A |z-score| of 1.96 was used as the cutoff for statistical significance.
2.8. Statistical analysis of effects of male vs. female sex
Like the analysis above, we used the Yates-corrected z-test of proportions to evaluate the significance of male vs. female sex on beta-band modulation in the amygdala. For this analysis, we again used Eq. (1), where and are proportions of significantly modulating contacts to the total number of contacts found in the male and female participants, respectively; n1 and n2 are the total number of contacts found in male and female participants, respectively; and is the proportion of significantly modulating contacts of both samples combined. A z-score of 1.96 was used as the cutoff for statistical significance.
3. Results
3.1. Beta-band modulation during the “center-out” direct reach task in the amygdala
Based off our previous observations of beta-band power decreases in the hippocampus (Del Campo-Vera et al., 2020), we first sought to evaluate if there was a statistically significant decrease in beta-band power in the amygdala in the Response phase when compared to the Fixation phase of the Direct Reach task. Results of this analysis are summarized in Table 3. In 9 of 13 participants (69.2 %), there was a statistically significant decrease in beta-band power in the Response phase compared to the Fixation phase (p < 0.05, right-sided nonparametric cluster-based permutation test), in at least two gray matter electrode contacts within the implanted electrode, demonstrating that most participants displayed beta-band power decreases in the amygdala during arm movement. These results support our alternate hypothesis. When analyzing individual gray matter electrode contacts, we observed that 43 of 69 contacts (62.3 %) showed decreases in beta-band power in the Response phase relative to the Fixation (p < 0.05, right-sided nonparametric cluster-based permutation test), indicating that the majority of gray matter contacts showed beta-band power decreases during movement execution. These results support our alternate hypothesis. The frequency range of significant modulation varied across the participants, but the average frequency range of significant modulation for all participant was 18.1 ± 4.1 Hz to 22.8 ± 5.0 Hz, which was obtained by averaging the minimum and maximum frequency values ( ± standard deviation) of significant modulation from all participants. A representative single-trial LFP trace and spectrogram showing decreased beta-band power is shown in Fig. 3. Fig. 4 shows a representative trial-averaged PSD plot in the frequency domain (Fig. 4A) and half-histogram/half-violin plot (Fig. 4B) from a gray matter contact that shows decreased power in the Response phase compared to the Fixation phase. Fig. 4B specifically shows the averaged power magnitude within the beta band (13.7–29.3 Hz) for the Fixation and Response phases. At a group level, there was a statistically significant decrease in the beta-band power in the Response phase compared to the Fixation phase (p < 0.05, Wilcoxon signed-rank test). Taken together, these data indicate that most participants and most gray matter contacts show decreased beta-band power during movement execution in the middle of the beta frequency range. The trend of decreased beta-band power in the Response phase compared to the Fixation phase was also seen when all gray matter contacts were combined into a PSD (Figure S15) and violin plot (Figure S16). Consistent with our prior findings (Gogia et al., 2020), we also show that 12 of 13 participants show increases in gamma power in the Response phase when compared to the Fixation phase (Table S1 and Figure S14).
3.2. Contralateral vs. ipsilateral beta-band modulation in the amygdala in the direct reach task
We also sought to determine if there were any differences in beta-band modulation between ipsilateral (right) and contralateral (left) implants and contacts. Implants are defined as all the gray matter contacts in the amygdala from a single electrode shaft. Results from this analysis are summarized in Table 4. We observed decreases in beta-band power in the Response phase compared to the Fixation phase in 6 of 9 ipsilateral implants (66.7 %) and 8 of 11 contralateral implants (72.7 %), which was not a statistically significant difference (z = −0.20, p > 0.05, Yates-corrected z-test). At the contact level, 19 of 31 ipsilateral contacts (61.3 %) and 25 of 38 contralateral contacts (65.8 %) showed decreases in beta-band power in the Response raise when compared to the Fixation phase, which also was not a statistically significant difference (z = 0.14, p > 0.05, Yates-corrected z-test). These results demonstrate that there is no statistically significant difference in beta-band modulation between the left and right amygdala.
Table 4.
Ipsilateral vs. Contralateral Beta-band Modulation.
| ID | Number of contacts showing significant beta-band modulation |
|
|---|---|---|
| Ipsilateral Modulating/Total (%) | Contralateral Modulating/Total (%) | |
| 1 | 4/4 (100%) | 4/4 (100%) |
| 2 | 4/4 (100%) | 4/4 (100%) |
| 3 | 3/3 (100%) | 4/4 (100%) |
| 4 | 3/3 (100%) | 3/3 (100%) |
| 5 | 2/3 (66.7%) | 2/2 (100%) |
| 6 | 3/4 (75%) | - |
| 7 | 0/2 (0%) | - |
| 8 | - | 0/2 (0%) |
| 9 | - | 3/3 (100%) |
| 10 | 0/4 (0%) | 0/4 (0%) |
| 11 | - | 0/4 (0%) |
| 12 | - | 2/4 (50%) |
| 13 | 0/4 (0%) | 3/4 (75%) |
| Total | 19/31 (61.3%)* | 25/38 (65.8%)* |
| Ipsilateral | Contralateral | |
| Implants with Modulation/Total (%) | 6/9 (66.7%)† | 8/11 (72.7%)† |
| Yates z-score | p-value | |
| Ipsilateral vs. Contralateral (participants) | − 0.20 | > 0.05 |
| Ipsilateral vs. Contralateral (contacts) | 0.13 | > 0.05 |
Summarizes the analysis of the effects of ipsilateral (right) vs. contralateral (left) electrode location on beta-band modulation in the amygdala. The number of electrode contacts in the ipsilateral and contralateral amygdala with significant modulation was determined using a nonparametric cluster-based permutation test for all frequency bins in the beta-band (13 – 30Hz). The percentage of contacts with significant modulation was based on the total number of contacts within the ipsilateral or contralateral contacts for each participant. The Yates-corrected z-score and corresponding p-value were computed for the proportions of ipsilateral vs. contralateral implants and contacts in ipsilateral vs. contralateral implants according to Eq. 1.
Represents the total number of modulating electrode contacts over the total number of electrode contacts in the ipsilateral or contralateral sides.
Represents the total number of ipsilateral or contralateral implants with modulation over the total number of implants.
3.3. Male vs. female beta-band modulation in the amygdala in the direct reach task
Finally, we sought to determine if there were any differences in beta-band modulation between male and female participants. Results from this analysis are displayed in Table 5. There was a decrease in beta-band power in the Response phase compared to the Fixation phase in 3 of 6 male participants (50.0 %) and 6 of 7 female participants (85.6 %), which was not a significantly statistically difference (z = 0.79, p > 0.05, Yates-corrected z-test). At the electrode contact level, 12 of 26 contacts in male participants (46.1 %) and 32 of 43 contacts in female participants (79.1 %) showed decreases in beta-band power in the Response phase compared to the Fixation phase, which was a statistically significant difference (z = 2.11, p 0.03, Yates-corrected z-test). Taken together, these results indicate that there is a statistically significant difference in beta-band modulation in the amygdala between male and female participants at the contact level but not at the participant level.
Table 5.
Male vs. Female Beta-band Modulation.
| ID | Number of contacts showing significant beta-band modulation |
|
|---|---|---|
| Male Modulating/Total (%) | Female Modulating/Total (%) | |
| 1 | - | 8/8 (100%) |
| 2 | - | 8/8 (100%) |
| 3 | 7/7 (100%) | - |
| 4 | - | 6/6 (100%) |
| 5 | - | 4/5 (80%) |
| 6 | - | 3/4 (75%) |
| 7 | 0/2 (0%) | - |
| 8 | 0/2 (0%) | - |
| 9 | 3/3 (100%) | - |
| 10 | 0/8 (0%) | - |
| 11 | - | 0/4 (0%) |
| 12 | 2/4 (50%) | - |
| 13 | - | 3/8 (37.5%) |
| Total | 12/26 (46.2%) | 32/43 (74.4%) |
| Male | Female | |
| Participants with Modulation/Total (%) | 3/6 (50.0%) | 6/7 (85.7%) |
| Yates z-score | p-value | |
| Male vs. Female (participants) | 0.79 | > 0.05 |
| Male vs. Female (contacts) | 2.11 | 0.03 |
Summarizes the analysis of the effects of sex (male vs. female) on beta-band modulation in the amygdala. The number of electrode contacts in male and female participants with significant modulation was determined using a nonparametric cluster-based permutation test for all frequency bins in the beta-band (13 – 30Hz). The percentage of contacts with significant modulation was based on the total number of contacts with modulation over the total number of contacts in male or female participants. The Yates-corrected z-score and corresponding p-value were computed for the proportions of male vs. female participants and contacts in male vs. female participants with modulation according to Eq. 1.
Represents the total number of modulating electrode contacts over the total number of electrode contacts in male and female participants.
Represents the total number of male and female participants with modulation over the total number of participants.
4. Discussion
This study demonstrated statistically significant decreases in beta-band power during movement execution in the amygdala in most (9 of 13) participants during an arm reaching task, which we also observed in the hippocampus in our previous study (Del Campo-Vera et al., 2020). These results are also consistent with our recent observations of beta-band modulation in the amygdala during the “Go” trials in a “Go/No-Go” task (Chung et al., 2024). We did not observe a significant difference between the contralateral and ipsilateral amygdala with respect to beta-band modulation, but we observe a difference between male and female participants only at the contact level. These data suggest a role of the amygdala in movement execution, and this study is the first study to address beta-band modulation in the amygdala during a Direct Reach arm reaching task to our knowledge.
4.1. Beta-band modulation in the amygdala during motor execution
Several studies have demonstrated beta-band modulation in a variety of processes. For example, Samson and colleagues showed that beta-band oscillations in the amygdala increased in aged rats with both learning and decision-making tasks (Samson et al., 2017). In humans, Makowka et al. (2023) conducted a scalp EEG study on patients with fibromyalgia and found that lower beta coherence in the amygdala correlated with higher pain scores (Makowka et al., 2023). Interestingly, Kirkby and colleagues (2018) used SEEG to show that variance in beta-band coherence between hippocampus and amygdala was associated with worse mood and higher anxiety, even identifying an LFP biomarker for mood (Kirkby et al., 2018). In a follow up study, Jackson et al. (2024) recapitulated that variance in beta-coherence between the hippocampus and amygdala was associated with anxiety behaviors in mice and that optogenetic shifting of phase of synchronization could modulate anxiety-related behaviors, indicating a possible target for neuromodulation for mood disorders (Jackson et al., 2024). Although these studies highlight the importance of beta-band activity in learning, decision making, pain, and mood, our study is the first to show beta-band modulation in the amygdala during motor execution.
As mentioned previously, a number of studies have reported both structural and resting-state functional connectivity between the amygdala and motor structures (Ghashghaei et al., 2007; Grèzes et al., 2014; Hunt et al., 2018; Jürgens, 1984; Morecraft et al., 2007; Toschi et al., 2017). However, there have also been several studies that have shown increased functional connectivity between the amygdala and motor areas during emotional tasks. For example, in a study using fMRI, de Gelder and colleagues (2004) had participants view fearful vs. neutral body imagery and found increased functional connectivity between the amygdala and motor areas including the SMA, precentral gyrus, and the basal ganglia (de Gelder et al., 2004). Similarly, Ahs et al. (2009) used PET to assess cerebral blood flow during presentation of phobic images, and they found increased functional connectivity between the right amygdala and motor cortex (Ahs et al., 2009). Using fMRI, Péron and colleagues (2016) conducted an emotional task and found that there was functional connectivity between the subthalamic nucleus (STN) with other structures involved in emotional processing, including the amygdala (Péron et al., 2016). In a study incorporating fMRI and a stop-signal task, Sagaspe and colleagues (2011) demonstrated that presentation of fearful faces was associated with activation of the amygdala and slower motor responses (Sagaspe et al., 2011). In contrast to these studies, which showed amygdala involvement in emotional motor tasks, our study shows that the amygdala modulates in non-emotional motor processing as well.
Our study demonstrates beta-band modulation in the amygdala in motor processing. This finding is consistent with our lab’s previously reported results in which we showed that beta-band power decreases in the hippocampus during the Response phase of a Direct Reach task (Del Campo-Vera et al., 2020). We have also shown previously that gamma-band power increases in the amygdala in the Response phase of a Direct Reach task (Gogia et al., 2020). Combining the results of our current study with the results of our study by Gogia et al. (2020), we observe a relationship in which beta-band power decreases during movement execution while gamma-band power increases. These results are consistent with what has been seen using ECoG in the sensorimotor cortex by Crone et al. (1998) as well as Miller and Fine (2022), who observed beta-band desynchronization and gamma-band synchronization during motor execution.
Although there is evidence of beta-band modulation and emotional-motor processing in the amygdala, our study is the first to identify beta-band modulation in the amygdala in non-emotional motor processing. Furthermore, our observations are consistent with our prior study of beta-band modulation in hippocampus and others’ studies in the sensorimotor cortex.
4.2. Ipsilateral vs. contralateral effects
Our results did not show any statistically significant differences in beta-band modulation during motor execution between ipsilateral (right)- and contralateral (left)-sided implants or contacts. This is consistent with our findings in the hippocampus as well (Del Campo-Vera et al., 2020). If the motor processing in the amygdala were dependent entirely on the connections with ipsilateral motor structures, we would expect stronger activity in the contralateral implants in a way that would be consistent with differences in modulation seen in the motor cortex (Downey et al., 2020); however, even the motor cortex shows bilateral activation during unilateral hand motion (Cramer et al., 1999; Kim et al., 1993). There is some evidence to suggest that there is differential activation of the left and right amygdala during non-motor processing. Combining fMRI and PET data from emotional processing studies, Baas and colleagues (2004) showed that the left amygdala is activated more than the right amygdala in emotional processing (Baas et al., 2004). Similarly, Gläscher and Adolphs (2003) showed that the left amygdala decodes arousal elicited by specific stimuli, while the right amygdala is less specific and activates autonomic activation with any stimulus (Gläscher and Adolphs, 2003). Despite there being differences in the left and right amygdala during emotional processing, we did not observe any statistically significant difference in non-emotional motor processing.
4.3. Male vs. female effects
We observed a statistically significant difference in beta-band modulation between male and female participants at the electrode contact level but not at the participant level. Several studies have shown differences between male and female participants with respect to functional connectivity between the amygdala and other brain areas. For example in a study of adolescent resting state functional connectivity, Alarcón et al. (2015) observed weaker negative functional connectivity in females between the superficial amygdala and the parieto-occipital cortices, while males had weaker functional connectivity between the centromedial amygdala and the parieto-occipital cortices, indicating unique patterns of developmental immaturity in amygdala-frontoparietal functional connectivity during adolescence (Alarcón et al., 2015). Similarly, in an fMRI study, Kogler and colleagues (2015) conducted an emotional task and found greater activation in the left amygdala in female participants compared to male participants (Kogler et al., 2015). Further, Wu and colleagues (2016) showed that there were sex-dependent differences in resting-state functional connectivity between the amygdala, medial superior frontal gyrus, anterior insula, and superior temporal gyrus (Wu et al., 2016). Although our findings were suggestive of a difference between males and females, with this small number of participants, it is difficult to determine the significance of these results.
4.4. Limitations
There are a number of limitations in this study to consider. The first, and perhaps most major limitation, is the fact that all the participants in this study were diagnosed with chronic epilepsy, and there was reason enough to believe that mesial temporal lobe structures could be involved in the seizure network that the risk of placing a depth electrode was deemed worthwhile. The involvement of the amygdala in seizure networks is highly suggestive of abnormalities in electrophysiology and architecture. Furthermore, the amygdala has been shown to have abnormalities in patients with chronic epilepsy, including electrical abnormalities (Köhling et al., 1998), neurotransmitter redistribution (Aroniadou-Anderjaska et al., 2008), and volume loss (Elst et al., 2009). Therefore, it is unknown if the observations we have made about beta-band modulation amygdala in this study can be generalized to human subjects without refractory epilepsy. Another limitation is that electrode placement was performed only with consideration of clinical necessity rather than optimal placement for research purposes, and this could contribute to the observed heterogeneity. Heterogeneity in seizure networks, medication history, disease progression, and comorbidities were not controlled in this study and could be confounding factors. Additionally, there are confounds in our task that we were unable to control for, potentially limiting the functional significance of our observations during voluntary movement. It is possible that the beta-band modulation could be attributed to eye movements, considering that amygdala may play a role in gaze control (Kennedy and Adolphs, 2010; Schönfeld and Wojtecki, 2019). Global changes in beta-band power may also reflect sensory feedback (Townsend et al., 2022) or cognitive aspects, including participant drowsiness (Arif et al., 2023). Finally, although our study suggests a role for beta-band modulation in the amygdala during motor processing, we cannot tell if it is an upstream, downstream, or parallel process to more canonical motor pathways. Studies aimed at evaluating connectivity between the amygdala and motor structures could help to elucidate the direct involvement of the amygdala in motor processing. Furthermore, activating or inactivating stimulation of the amygdala during different phases of the reaching task could help to ascertain this information.
Another limitation of our study is the possibility of residual volume conduction effects, particularly given the anatomical proximity of the hippocampus and amygdala. However, prior studies (e.g., Holsheimer and Feenstra,1977), which tested SEEG coherence in the hippocampus at beta frequencies (12–30 Hz), have shown that coherence in this frequency band decreases substantially with distance, reaching negligible levels (0.1) at interelectrode separations greater than 1.4 mm. Their findings further indicate that neuronal activity from sources located 0.4–0.7 mm from the recording electrode contributes minimally to the recorded signal (–25 dB). In our study, electrode spacing exceeded these thresholds, supporting the inference that volume conduction from neighboring regions such as the hippocampus is likely minimal (Holsheimer and Feenstra,1997).
While bipolar montages are commonly used to reduce shared signal and improve spatial specificity—particularly in clinical localization contexts—we opted for a white matter referential montage based on both methodological and theoretical considerations. This choice aligns with prior SEEG studies targeting functional dynamics in medial temporal lobe structures (e.g., amygdala, hippocampus) and ensures consistency and comparability with our previous work and other published findings (Buzsáki et al., 2012; Chung et al., 2024; Del Campo-Vera et al., 2022; Lachaux et al., 2012; Parvizi and Kastner, 2018). Referential montages preserve absolute signal amplitude and polarity, which is critical for analyses of event-related responses, spectral power, and phase-locking metrics that may be distorted by bipolar subtraction. Although bipolar referencing may offer increased spatial resolution in some scenarios, our referencing strategy was chosen to optimize signal interpretability in the context of local task-related dynamics. We acknowledge volume conduction as a general limitation in intracranial electrophysiology and note that bipolar montages may serve as a useful complementary tool for future comparative analyses.
5. Conclusions
This study reports the novel finding of beta-band power decrease during motor execution compared to baseline during an arm reaching task, which is consistent with previous studies in other brain areas. Our results also show that there is no statistically significant difference in beta-band modulation between ipsilateral and contralateral contacts or between male and female participants. These results combined with our previous results showing gamma-band modulation during motor execution provide more evidence for involvement of the human amygdala in non-emotional motor processing. Future studies could perform a comprehensive characterization of the beta-band modulation in the context of seizure networks, medication history, disease progression or comorbidities that could offer a more complete understanding of neural dynamics.
Supplementary Material
Appendix A. Supporting information
Supplementary data associated with this article can be found in the online version at doi:10.1016/j.neures.2025.05.001.
Acknowledgements
We wish to acknowledge the National Institute of Neurological Disorders and Stroke (NINDS) of the U.S. National Institutes of Health (NIH) for their generous support. We wish to acknowledge the support of the USC Department of Neurological Surgery and the Neurorestoration Center of USC. Most importantly, we wish to thank the participants and their families for their participation in this research. Without them, none of this would have been possible.
Funding
NINDS of the U.S. NIH K23NS114190 and R25NS099008.
Footnotes
Ethics approval
The study and the consent form were approved by the Institutional Review Board (IRB) at USC (Study ID: HS-17-00554).
CRediT authorship contribution statement
Zhang Selena: Writing – review & editing, Investigation. Swarup Adith: Writing – review & editing, Investigation. Lee Brian: Supervision, Project administration, Methodology, Investigation, Funding acquisition, Formal analysis, Data curation, Conceptualization. Chung Ryan S.: Writing – review & editing, Investigation. Kellis Spencer S.: Writing – review & editing, Visualization, Validation, Supervision, Software, Resources, Project administration, Methodology, Investigation, Funding acquisition, Formal analysis, Data curation, Conceptualization. Shao Xiecheng: Writing – review & editing, Methodology, Investigation, Formal analysis, Data curation, Conceptualization. Liu Charles Y.: Writing – review & editing, Supervision, Conceptualization. Del Campo-Vera Roberto Martin: Writing – review & editing, Visualization, Validation, Supervision, Software, Resources, Project administration, Methodology, Investigation, Formal analysis, Data curation, Conceptualization. Heck Christi: Writing – review & editing, Investigation. Sundaram Shivani: Writing – review & editing, Investigation, Data curation, Conceptualization. McGinn Ryan: Writing – review & editing, Investigation. Cavaleri Jonathon M.: Writing – original draft, Visualization, Validation, Software, Resources, Project administration, Methodology, Investigation, Funding acquisition, Formal analysis, Data curation, Conceptualization. Mason Xenos: Writing – review & editing, Investigation. Gogia Angad: Writing – review & editing, Investigation. Kammen Alexandra: Writing – review & editing. Parra Miguel: Writing – review & editing, Methodology, Investigation, Data curation.
Declaration of Competing Interest
The authors declare that they have no known competing financial interests or personal relationships that could have appeared to influence the work reported in this paper.
Consent to participate
Informed consent was obtained from all individual participants before inclusion in the study.
References
- Ahs F, Pissiota A, Michelgård A, Frans O, Furmark T, Appel L, Fredrikson M, 2009. Disentangling the web of fear: amygdala reactivity and functional connectivity in spider and snake phobia. Psychiatry Res 172, 103–108. 10.1016/j.pscychresns.2008.11.004. [DOI] [PubMed] [Google Scholar]
- Alarcón G, Cservenka A, Rudolph MD, Fair DA, Nagel BJ, 2015. Developmental sex differences in resting state functional connectivity of amygdala sub-regions. Neuroimage 115, 235–244. 10.1016/j.neuroimage.2015.04.013. [DOI] [PMC free article] [PubMed] [Google Scholar]
- Andreano JM, Dickerson BC, Barrett LF, 2014. Sex differences in the persistence of the amygdala response to negative material. Soc. Cogn. Affect Neurosci 9, 1388–1394. 10.1093/scan/nst127. [DOI] [PMC free article] [PubMed] [Google Scholar]
- Androulidakis AG, Doyle LMF, Gilbertson TP, Brown P, 2006. Corrective movements in response to displacements in visual feedback are more effective during periods of 13–35 Hz oscillatory synchrony in the human corticospinal system. Eur. J. Neurosci 24, 3299–3304. 10.1111/j.1460-9568.2006.05201.x. [DOI] [PubMed] [Google Scholar]
- Arif S, Munawar S, Ali H, 2023. Driving drowsiness detection using spectral signatures of EEG-based neurophysiology. Front. Physiol 14. 10.3389/fphys.2023.1153268. [DOI] [PMC free article] [PubMed] [Google Scholar]
- Aroniadou-Anderjaska V, Fritsch B, Qashu F, Braga MFM, 2008. Pathology and pathophysiology of the amygdala in epileptogenesis and epilepsy. Epilepsy Res 78, 102–116. 10.1016/j.eplepsyres.2007.11.011. [DOI] [PMC free article] [PubMed] [Google Scholar]
- Baas D, Aleman A, Kahn RS, 2004. Lateralization of amygdala activation: a systematic review of functional neuroimaging studies. Brain Res. Brain Res. Rev 45, 96–103. 10.1016/j.brainresrev.2004.02.004. [DOI] [PubMed] [Google Scholar]
- Bokil H, Andrews P, Kulkarni JE, Mehta S, Mitra PP, 2010. Chronux: a platform for analyzing neural signals. J. Neurosci. Methods 192, 146–151. 10.1016/j.jneumeth.2010.06.020. [DOI] [PMC free article] [PubMed] [Google Scholar]
- Brainard DH, 1997. The psychophysics toolbox. Spat. Vis. 10, 433–436. [PubMed] [Google Scholar]
- Buzsáki G, Anastassiou CA, Koch C, 2012. The origin of extracellular fields and currents–EEG, ECoG, LFP and spikes. Nat. Rev. Neurosci 13, 407–420. 10.1038/nrn3241. [DOI] [PMC free article] [PubMed] [Google Scholar]
- Castiglione A, Wagner J, Anderson M, Aron AR, 2019. Preventing a Thought from Coming to Mind Elicits Increased Right Frontal Beta Just as Stopping Action Does. Cereb. Cortex 29, 2160–2172. 10.1093/cercor/bhz017. [DOI] [PMC free article] [PubMed] [Google Scholar]
- Chow MSM, Wu SL, Webb SE, Gluskin K, Yew DT, 2017. Functional magnetic resonance imaging and the brain: a brief review. World J. Radio. 9, 5–9. 10.4329/wjr.v9.i1.5. [DOI] [PMC free article] [PubMed] [Google Scholar]
- Chung RS, Martin Del Campo Vera R, Sundaram S, Cavaleri J, Gilbert ZD, Leonor A, Shao X, Zhang S, Kammen A, Mason X, Heck C, Liu CY, Kellis SS, Lee B, 2024. Beta-band power modulation in the human amygdala differentiates between go/no-go responses in an arm-reaching task. J. Neural Eng 21, 046019. 10.1088/1741-2552/ad5ebe. [DOI] [PMC free article] [PubMed] [Google Scholar]
- Cohen MX, 2014. Analyzing Neural Time Series Data: Theory and Practice, Issues in Clinical and Cognitive Neuropsychology. The MIT Press, Cambridge, Massachusetts. [Google Scholar]
- Cramer SC, Finklestein SP, Schaechter JD, Bush G, Rosen BR, 1999. Activation of distinct motor cortex regions during ipsilateral and contralateral finger movements. J. Neurophysiol 81, 383–387. 10.1152/jn.1999.81.1.383. [DOI] [PubMed] [Google Scholar]
- Crone NE, Miglioretti DL, Gordon B, Lesser RP, 1998. Functional mapping of human sensorimotor cortex with electrocorticographic spectral analysis. II. Event-related synchronization in the gamma band. Brain 121 (Pt 12), 2301–2315. 10.1093/brain/121.12.2301. [DOI] [PubMed] [Google Scholar]
- Davis M, 1992. The role of the amygdala in fear and anxiety. Annu Rev. Neurosci 15, 353–375. 10.1146/annurev.ne.15.030192.002033. [DOI] [PubMed] [Google Scholar]
- Del Campo-Vera RM, Gogia AS, Chen K-H, Sebastian R, Kramer DR, Lee MB, Peng T, Tafreshi A, Barbaro MF, Liu CY, Kellis S, Lee B, 2020. Beta-band power modulation in the human hippocampus during a reaching task. J. Neural Eng 17, 036022. 10.1088/1741-2552/ab937f. [DOI] [PMC free article] [PubMed] [Google Scholar]
- Del Campo-Vera RM, Tang AM, Gogia AS, Chen K-H, Sebastian R, Gilbert ZD, Nune G, Liu CY, Kellis S, Lee B, 2022. Neuromodulation in beta-band power between movement execution and inhibition in the human hippocampus. Neuromodulation 25, 232–244. 10.1111/ner.13486. [DOI] [PMC free article] [PubMed] [Google Scholar]
- Donner TH, Siegel M, Fries P, Engel AK, 2009. Buildup of choice-predictive activity in human motor cortex during perceptual decision making. Curr. Biol 19, 1581–1585. 10.1016/j.cub.2009.07.066. [DOI] [PubMed] [Google Scholar]
- Downey JE, Quick KM, Schwed N, Weiss JM, Wittenberg GF, Boninger ML, Collinger JL, 2020. The motor cortex has independent representations for ipsilateral and contralateral arm movements but correlated representations for grasping. Cereb. Cortex 30, 5400–5409. 10.1093/cercor/bhaa120. [DOI] [PubMed] [Google Scholar]
- Ehrlich I, Humeau Y, Grenier F, Ciocchi S, Herry C, Lüthi A, 2009. Amygdala inhibitory circuits and the control of fear memory. Neuron 62, 757–771. 10.1016/j.neuron.2009.05.026. [DOI] [PubMed] [Google Scholar]
- Einevoll GT, Kayser C, Logothetis NK, Panzeri S, 2013. Modelling and analysis of local field potentials for studying the function of cortical circuits. Nat. Rev. Neurosci 14, 770–785. 10.1038/nrn3599. [DOI] [PubMed] [Google Scholar]
- Elst L.T. van M., Ebert D, Schulze-Bonhage A, 2009. Amygdala volume loss in patients with dysphoric disorder of epilepsy. Epilepsy Behav 16, 105–112. 10.1016/j.yebeh.2009.06.009. [DOI] [PubMed] [Google Scholar]
- Engel AK, Fries P, 2010. Beta-band oscillations–signalling the status quo? Curr. Opin. Neurobiol 20, 156–165. 10.1016/j.conb.2010.02.015. [DOI] [PubMed] [Google Scholar]
- de Gelder B, Snyder J, Greve D, Gerard G, Hadjikhani N, 2004. Fear fosters flight: a mechanism for fear contagion when perceiving emotion expressed by a whole body. Proc. Natl. Acad. Sci. USA 101, 16701–16706. 10.1073/pnas.0407042101. [DOI] [PMC free article] [PubMed] [Google Scholar]
- George MS, Ring HA, Costa DC, Kouris K, Ell PJ, 1992. Demonstration of human motor cortex activation using SPECT. J. Neural Transm. Gen. Sect 87, 231–236. 10.1007/BF01245369. [DOI] [PubMed] [Google Scholar]
- Georgopoulos AP, Kalaska JF, Caminiti R, Massey JT, 1982. On the relations between the direction of two-dimensional arm movements and cell discharge in primate motor cortex. J. Neurosci 2, 1527–1537. 10.1523/JNEUROSCI.02-11-01527.1982. [DOI] [PMC free article] [PubMed] [Google Scholar]
- Ghashghaei HT, Hilgetag CC, Barbas H, 2007. Sequence of information processing for emotions based on the anatomic dialogue between prefrontal cortex and amygdala. Neuroimage 34, 905–923. 10.1016/j.neuroimage.2006.09.046. [DOI] [PMC free article] [PubMed] [Google Scholar]
- Gläscher J, Adolphs R, 2003. Processing of the arousal of subliminal and supraliminal emotional stimuli by the human amygdala. J. Neurosci 23, 10274–10282. 10.1523/JNEUROSCI.23-32-10274.2003. [DOI] [PMC free article] [PubMed] [Google Scholar]
- Gogia AS, Martin Del Campo-Vera R, Chen K-H, Sebastian R, Nune G, Kramer DR, Lee MB, Tafreshi AR, Barbaro MF, Liu CY, Kellis S, Lee B, 2020. Gamma-band modulation in the human amygdala during reaching movements. Neurosurg. Focus 49, E4. 10.3171/2020.4.FOCUS20179. [DOI] [PMC free article] [PubMed] [Google Scholar]
- Grèzes J, Valabrègue R, Gholipour B, Chevallier C, 2014. A direct amygdala-motor pathway for emotional displays to influence action: a diffusion tensor imaging study. Hum. Brain Mapp 35, 5974–5983. 10.1002/hbm.22598. [DOI] [PMC free article] [PubMed] [Google Scholar]
- Holsheimer J, Feenstra BW, 1997. Volume conduction and EEG measurements within the brain: a quantitative approach to the influence of electrical spread on the linear relationship of activity measured at different locations. Electroencephalogra Clin Neurophysiol 43, 52–58. 10.1016/0013-4694(77)90194-8. [DOI] [PubMed] [Google Scholar]
- Hoshiyama M, Kakigi R, Berg P, Koyama S, Kitamura Y, Shimojo M, Watanabe S, Nakamura A, 1997. Identification of motor and sensory brain activities during unilateral finger movement: spatiotemporal source analysis of movement-associated magnetic fields. Exp. Brain Res 115, 6–14. 10.1007/pl00005685. [DOI] [PubMed] [Google Scholar]
- Hunt AJ, Dasgupta R, Rajamanickam S, Jiang Z, Beierlein M, Chan CS, Justice NJ, 2018. Paraventricular hypothalamic and amygdalar CRF neurons synapse in the external globus pallidus. Brain Struct. Funct 223, 2685–2698. 10.1007/s00429-018-1652-y. [DOI] [PMC free article] [PubMed] [Google Scholar]
- Jackson AD, Cohen JL, Phensy AJ, Chang EF, Dawes HE, Sohal VS, 2024. Amygdala-hippocampus somatostatin interneuron beta-synchrony underlies a cross- species biomarker of emotional state. Neuron S0896-6273(23)00976-5. 10.1016/j.neuron.2023.12.017. [DOI] [PMC free article] [PubMed] [Google Scholar]
- Jasper H, Penfield W, 1949. Electrocorticograms in man: Effect of voluntary movement upon the electrical activity of the precentral gyrus. Arch. F. Psychiatr. U. Z. Neur 183, 163–174. 10.1007/BF01062488. [DOI] [Google Scholar]
- Jürgens U, 1984. The efferent and afferent connections of the supplementary motor area. Brain Res 300, 63–81. 10.1016/0006-8993(84)91341-6. [DOI] [PubMed] [Google Scholar]
- Kennedy DP, Adolphs R, 2010. Impaired fixation to eyes following amygdala damage arises from abnormal bottom-up attention. Neuropsychologia 48, 3392–3398. 10.1016/j.neuropsychologia.2010.06.025. [DOI] [PMC free article] [PubMed] [Google Scholar]
- Kim SG, Ashe J, Hendrich K, Ellermann JM, Merkle H, Uğurbil K, Georgopoulos AP, 1993. Functional magnetic resonance imaging of motor cortex: hemispheric asymmetry and handedness. Science 261, 615–617. 10.1126/science.8342027. [DOI] [PubMed] [Google Scholar]
- Kirkby LA, Luongo FJ, Lee MB, Nahum M, Van Vleet TM, Rao VR, Dawes HE, Chang EF, Sohal VS, 2018. An Amygdala-Hippocampus Subnetwork that Encodes Variation in Human Mood. Cell 175, 1688–1700.e14. 10.1016/j.cell.2018.10.005. [DOI] [PubMed] [Google Scholar]
- Kleiner M, Brainard D, Pelli D, 2007. What’s new in psychtoolbox-3? Perception 36, 1–235. 10.1177/03010066070360S101. [DOI] [Google Scholar]
- Kogler L, Gur RC, Derntl B, 2015. Sex differences in cognitive regulation of psychosocial achievement stress: brain and behavior. Hum. Brain Mapp 36, 1028–1042. 10.1002/hbm.22683. [DOI] [PMC free article] [PubMed] [Google Scholar]
- Köhling R, Lücke A, Straub H, Speckmann EJ, Tuxhorn I, Wolf P, Pannek H, Oppel F, 1998. Spontaneous sharp waves in human neocortical slices excised from epileptic patients. Brain 121 (Pt 6), 1073–1087. 10.1093/brain/121.6.1073. [DOI] [PubMed] [Google Scholar]
- Krettek JE, Price JL, 1978. A description of the amygdaloid complex in the rat and cat with observations on intra-amygdaloid axonal connections. J. Comp. Neurol 178, 255–280. 10.1002/cne.901780205. [DOI] [PubMed] [Google Scholar]
- Kühn AA, Williams D, Kupsch A, Limousin P, Hariz M, Schneider G-H, Yarrow K, Brown P, 2004b. Event-related beta desynchronization in human subthalamic nucleus correlates with motor performance. Brain 127, 735–746. 10.1093/brain/awh106. [DOI] [PubMed] [Google Scholar]
- Kühn AA, Williams D, Kupsch A, Limousin P, Hariz M, Schneider G-H, Yarrow K, Brown P, 2004a. Event-related beta desynchronization in human subthalamic nucleus correlates with motor performance. Brain 127, 735–746. 10.1093/brain/awh106. [DOI] [PubMed] [Google Scholar]
- Lachaux J-P, Axmacher N, Mormann F, Halgren E, Crone NE, 2012. High-frequency neural activity and human cognition: past, present and possible future of intracranial EEG research. Prog. Neurobiol 98, 279–301. 10.1016/j.pneurobio.2012.06.008. [DOI] [PMC free article] [PubMed] [Google Scholar]
- Lambert C, Zrinzo L, Nagy Z, Lutti A, Hariz M, Foltynie T, Draganski B, Ashburner J, Frackowiak R, 2012. Confirmation of functional zones within the human subthalamic nucleus: patterns of connectivity and sub-parcellation using diffusion weighted imaging. Neuroimage 60, 83–94. 10.1016/j.neuroimage.2011.11.082. [DOI] [PMC free article] [PubMed] [Google Scholar]
- Lindén H, Tetzlaff T, Potjans TC, Pettersen KH, Grün S, Diesmann M, Einevoll GT, 2011. Modeling the spatial reach of the LFP. Neuron 72, 859–872. 10.1016/j.neuron.2011.11.006. [DOI] [PubMed] [Google Scholar]
- Lundqvist M, Herman P, Lansner A, 2011. Theta and gamma power increases and alpha/beta power decreases with memory load in an attractor network model. J. Cogn. Neurosci 23, 3008–3020. 10.1162/jocn_a_00029. [DOI] [PubMed] [Google Scholar]
- Makowka S, Mory L-N, Mouthon M, Mancini C, Guggisberg AG, Chabwine JN, 2023. EEG Beta functional connectivity decrease in the left amygdala correlates with the affective pain in fibromyalgia: a pilot study. PLoS One 18, e0281986. 10.1371/journal.pone.0281986. [DOI] [PMC free article] [PubMed] [Google Scholar]
- Maris E, Oostenveld R, 2007. Nonparametric statistical testing of EEG- and MEG-data. J. Neurosci. Methods 164, 177–190. 10.1016/j.jneumeth.2007.03.024. [DOI] [PubMed] [Google Scholar]
- Miller KJ, Fine AL, 2022. Decision-making in stereotactic epilepsy surgery. Epilepsia 63, 2782–2801. 10.1111/epi.17381. [DOI] [PMC free article] [PubMed] [Google Scholar]
- Morecraft RJ, McNeal DW, Stilwell-Morecraft KS, Gedney M, Ge J, Schroeder CM, van Hoesen GW, 2007. Amygdala interconnections with the cingulate motor cortex in the rhesus monkey. J. Comp. Neurol 500, 134–165. 10.1002/cne.21165. [DOI] [PubMed] [Google Scholar]
- Parvizi J, Kastner S, 2018. Promises and limitations of human intracranial electroencephalography. Nat. Neurosci 21, 474–483. 10.1038/s41593-018-0108-2. [DOI] [PMC free article] [PubMed] [Google Scholar]
- Pelli DG, 1997. The VideoToolbox software for visual psychophysics: transforming numbers into movies. Spat. Vis 10, 437–442. [PubMed] [Google Scholar]
- Péron J, Frühholz S, Ceravolo L, Grandjean D, 2016. Structural and functional connectivity of the subthalamic nucleus during vocal emotion decoding. Soc. Cogn. Affect Neurosci 11, 349–356. 10.1093/scan/nsv118. [DOI] [PMC free article] [PubMed] [Google Scholar]
- Sagaspe P, Schwartz S, Vuilleumier P, 2011. Fear and stop: a role for the amygdala in motor inhibition by emotional signals. Neuroimage 55, 1825–1835. 10.1016/j.neuroimage.2011.01.027. [DOI] [PubMed] [Google Scholar]
- Samson RD, Lester AW, Duarte L, Venkatesh A, Barnes CA, 2017. Emergence of β-Band Oscillations in the Aged Rat Amygdala during Discrimination Learning and Decision Making Tasks. eNeuro 4, ENEURO.0245-17.2017. 10.1523/ENEURO.0245-17.2017. [DOI] [PMC free article] [PubMed] [Google Scholar]
- Schönfeld L-M, Wojtecki L, 2019. Beyond emotions: oscillations of the amygdala and their implications for electrical neuromodulation. Front Neurosci 13, 366. 10.3389/fnins.2019.00366. [DOI] [PMC free article] [PubMed] [Google Scholar]
- Schwartz AB, Kettner RE, Georgopoulos AP, 1988. Primate motor cortex and free arm movements to visual targets in three-dimensional space. I. Relations between single cell discharge and direction of movement. J. Neurosci 8, 2913–2927. 10.1523/JNEUROSCI.08-08-02913.1988. [DOI] [PMC free article] [PubMed] [Google Scholar]
- Swann N, Tandon N, Canolty R, Ellmore TM, McEvoy LK, Dreyer S, DiSano M, Aron AR, 2009. Intracranial EEG reveals a time- and frequency-specific role for the right inferior frontal gyrus and primary motor cortex in stopping initiated responses. J. Neurosci 29, 12675–12685. 10.1523/JNEUROSCI.3359-09.2009. [DOI] [PMC free article] [PubMed] [Google Scholar]
- Swann N, Poizner H, Houser M, Gould S, Greenhouse I, Cai W, Strunk J, George J, Aron AR, 2011. Deep brain stimulation of the subthalamic nucleus alters the cortical profile of response inhibition in the beta frequency band: a scalp EEG study in Parkinson’s disease. J. Neurosci 31, 5721–5729. 10.1523/JNEUROSCI.6135-10.2011. [DOI] [PMC free article] [PubMed] [Google Scholar]
- Toschi N, Duggento A, Passamonti L, 2017. Functional connectivity in amygdalar-sensory/(pre)motor networks at rest: new evidence from the Human Connectome Project. Eur. J. Neurosci 45, 1224–1229. 10.1111/ejn.13544. [DOI] [PubMed] [Google Scholar]
- Townsend B, Legere JK, Mohrenschildt M. v, Shedden JM, 2022. Beta-band power is an index of multisensory weighting during self-motion perception. Neuroimage: Rep 2, 100102. 10.1016/j.ynirp.2022.100102. [DOI] [PMC free article] [PubMed] [Google Scholar]
- Watson JD, 1997. Images of the working brain: understanding human brain function with positron emission tomography. J. Neurosci. Methods 74, 245–256. 10.1016/s0165-0270(96)02253-4. [DOI] [PubMed] [Google Scholar]
- Wu Y, Li H, Zhou Y, Yu J, Zhang Y, Song M, Qin W, Yu C, Jiang T, 2016. Sex-specific neural circuits of emotion regulation in the centromedial amygdala. Sci. Rep 6, 23112. 10.1038/srep23112. [DOI] [PMC free article] [PubMed] [Google Scholar]
- Zhang Y, Chen Y, Bressler SL, Ding M, 2008. Response preparation and inhibition: the role of the cortical sensorimotor beta rhythm. Neuroscience 156, 238–246. 10.1016/j.neuroscience.2008.06.061. [DOI] [PMC free article] [PubMed] [Google Scholar]
Associated Data
This section collects any data citations, data availability statements, or supplementary materials included in this article.