Abstract
A wide range of organisms use circadian clocks to keep internal sense of daily time and regulate their behavior accordingly. Most of these clocks use intracellular genetic networks based on positive and negative regulatory elements. The integration of these “circuits” at the cellular level imposes strong constraints on their functioning and design. Here, we study a recently proposed model [Barkai, N. & Leibler, S. (2000) Nature (London), 403, 267–268] that incorporates just the essential elements found experimentally. We show that this type of oscillator is driven mainly by two elements: the concentration of a repressor protein and the dynamics of an activator protein forming an inactive complex with the repressor. Thus, the clock does not need to rely on mRNA dynamics to oscillate, which makes it especially resistant to fluctuations. Oscillations can be present even when the time average of the number of mRNA molecules goes below one. Under some conditions, this oscillator is not only resistant to but, paradoxically, also enhanced by the intrinsic biochemical noise.
The environment changes in a highly periodic manner. There are, among other changes, daily cycles of light and dark as well as annual cycles of changing climates and physical conditions. Such environmental periodicity may create the necessity for organisms to develop internal time-keeping mechanisms to accurately anticipate these external changes and modify their state accordingly (1). In particular, a wide range of organisms, as diverse as cyanobacteria and mammals, have evolved circadian rhythms—biological clocks with a period of about 24 h that evoke and regulate physiological and biochemical changes to best suit different times of the day.
Recent findings show that the molecular mechanisms upon which these clocks rely share many common features among species (2). The main characteristic is the presence of intracellular transcription regulation networks with a set of clock elements that give rise to stable oscillations in gene expression. A positive element activates genes coupled to the circadian clock. It simultaneously promotes the expression of a negative element, which in turn represses the positive element. The cycle completes itself upon degradation of the negative element and re-expression of the positive element.
A crucial feature of circadian clocks is the ability to maintain a constant period over a wide range of internal and external fluctuations (1). Such robustness ensures that the clock runs accurately and triggers the expression of clock-dependent genes at the appropriate time of the day. For instance, fluctuations in temperature affect chemical reaction rates and may perturb oscillatory behavior. Another source of fluctuations may be the presence of internal noise caused by the stochastic nature of chemical reactions (3). Low numbers of molecules may be responsible for random fluctuations that can destabilize the oscillatory behavior of the biochemical network (4). Yet, circadian clocks maintain a fairly constant period amidst such fluctuations.
Description of the Model.
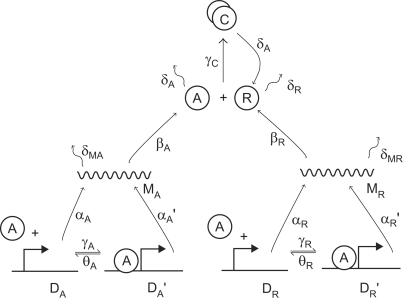
To study possible strategies, or principles, that biological systems may use to minimize the effect of stochastic noise on circadian clocks, we examined a minimal model based on the common positive and negative control elements found experimentally (3). This model is described in Fig. 1. It involves two genes, an activator A and a repressor R, which are transcribed into mRNA and subsequently translated into protein. The activator A binds to the A and R promoters, which increases their transcription rate. Thus, A acts as the positive element in transcription, whereas R acts as the negative element by sequestering the activator.
Figure 1.
Biochemical network of the circadian oscillator model. DA' and DA denote the number of activator genes with and without A bound to its promoter respectively; similarly, DR' and DR refer to the repressor promoter; MA and MR denote mRNA of A and R; A and R correspond to the activator and repressor proteins; and C corresponds to the inactivated complex formed by A and R. The constants α and α' denote the basal and activated rates of transcription, β the rates of translation, δ the rates of spontaneous degradation, γ the rates of binding of A to other components, and θ denotes the rates of unbinding of A from those components. Except if otherwise stated, in this paper we have assumed the following values for the reaction rates: αA = 50 h−1, αA' = 500 h−1, αR = 0.01 h−1, αR' = 50 h−1, βA = 50 h−1, βR = 5 h−1, δMA = 10 h−1, δMR = 0.5 h−1, δA = 1 h−1, δR = 0.2 h−1, γA = 1 mol−1 hr−1, γR = 1 mol−1 hr−1, γC = 2 mol−1 hr−1, θA = 50 h−1, θR = 100 h−1, where mol means number of molecules. The initial conditions are DA = DR = 1 mol, DA' = DR' = MA = MR = A = R = C = 0, which require that the cell has a single copy of the activator and repressor genes: DA + DA' = 1 mol and DR + DR' = 1 mol. The cellular volume is assumed to be the unity so that concentrations and number of molecules are equivalent. Notice that we assume that the complex breaks into R because of the degradation of A and, therefore, the parameter δA appears twice in the model.
The deterministic dynamics of the model is given by the set of reaction rate equations
 |
1 |
where the variables and constants are as described in the caption for Fig. 1. This simple model is not intended to reproduce the particular details of each organism but to grasp the properties that the core design confers. As in any general model, the parameters of the values we use are typical ones. For instance, the rates for bimolecular reactions are all in the range of diffusion limited reactions.
The preceding equations would be strictly valid in a well stirred macroscopic reactor. At the cellular level, a more realistic approach has to consider the intrinsic stochasticity of chemical reactions (5), which can be done by transforming the reaction rates into probability transition rates and concentrations into numbers of molecules. One then obtains the so-called master equation, which gives the time evolution of the probability of having a given number of molecules. There is no general procedure to solve this type of equation analytically, but it is the starting point to simulate the stochastic behavior of the system. The basic idea behind such simulations is to perform a random walk through the possible states of the system, which are defined by the numbers of molecules of the different reacting species. Starting from a state with given numbers of molecules, the probability of jumping to other states with different numbers of molecules (i.e., the probability for an elementary reaction to happen) can be computed from the master equation. One can pick up a state and the jumping time according to that probability distribution, consider the resulting state as a new initial state, and repeat this procedure until some final state or time is reached. In this way, the numbers of molecules change in time with the statistical properties given by the master equation. There are several algorithms to implement this. The main difference among them is the specific way in which they compute the probabilities and select the states. For chemical reactions with few components, it is customary to use the so-called Gillespie algorithm (6).
This intrinsic probabilistic behavior in the evolution of the number of molecules gives rise to fluctuations that are usually referred to as noise. In general, the term noise is used for any disturbance interfering with a signal or with the operation of system. In the case of chemical reactions, the signal would be the average production of the reacting species, whereas the disturbance would arise as a consequence of the fluctuations around that average value. We use the term noise rather than fluctuations to emphasize the disturbing effect that these fluctuations can have. Thus, although related, both terms do not mean the same. For instance, there can be large fluctuations in some molecular species but, if their characteristic time is very short compared with those of other processes that take place, they would introduce little noise.
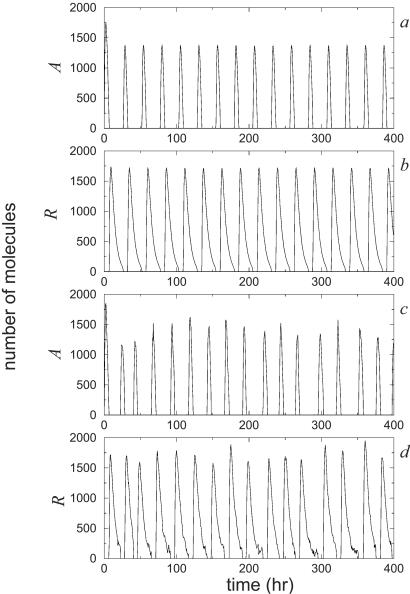
In Fig. 2, we compare the results of the stochastic and deterministic approaches. We show the levels of A protein and R protein over time for the set of parameter values and initial conditions given in the caption of Fig. 1. The deterministic results were obtained from numerical integration of Eq. [1], whereas the stochastic results were obtained by computer simulation using the Gillespie algorithm. The main difference between the deterministic and stochastic time courses is the presence of random fluctuations in the latter. In the deterministic model, every circadian cycle is identical to the previous one. The stochastic model shows some variability in the numbers of molecules and the period length, which correspond to the intrinsic fluctuations of the biochemical network. For these values of the parameters, both stochastic and deterministic approaches give similar results. We also have used different initial conditions, and in all of the cases we have observed, the behavior of the long-term solution is the same.
Figure 2.
Oscillations in repressor and activator protein numbers obtained from numerical simulations of the deterministic (a and b) and stochastic (c and d) descriptions of the model.
Model Simplification.
To gain further insight into the essential elements that are responsible for the oscillations, we will simplify as much as possible the deterministic rate equations. By making various quasi-steady-state assumptions (7), it is possible to simplify the set of Eq. [1] into a two-variable system with the repressor R and the complex C as the two slow variables:
 |
2 |
where
 |
with ρ(R) = βA/δMA(γCR + δA) and Kd = θA/γA. Notice that the nonlinearity in the equations enters trough the quasi-equilibrium value of A, A̋(R), which is a function of R. The main idea behind these approximations is that there are fast and slow variables. Fast variables are assumed to be at an effective equilibrium, whereas slow variables are responsible for the dynamics of the system. Thus, given the set of Eq. [1], we assume that all of the derivatives except dR/dt and dC/dt are zero.
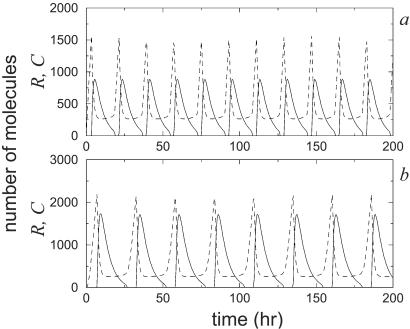
In Fig. 3, we show that for the values of the parameters we use the numerical solutions for the trajectories of the two-variable system Eq. [2] agree closely with the solutions of the full system Eq. [1], except for quantitative differences in the peak levels and times at the beginning of each cycle. These differences arise because the time-scale separation between fast and slow variables is not sufficiently large for quasi-steady-state assumptions to be exact. These results indicate, nevertheless, that the dynamics of the system is mainly determined by two component concentrations: those of the complex and the repressor. The other components are driven mainly by these two elements and their effects enter the system through effective parameters. It is worth emphasizing that the reduced two-variable model is intended just to offer insights into the qualitative behavior of the system and to show how the properties that one observes in the full system are already present in a simple two-variable model. Thus, whenever we present simulation results for the deterministic system, except if otherwise stated, we are referring to the full system. Regarding the validity of the two-variable model, it is a good approximation when the dynamics of mRNA and the activator is faster than that of the complex and repressor. For instance, it will remain valid if δR is decreased or some of δA, δMA, δMR, θA, and θR are increased with respect to the parameters of the caption for Fig. 1.
Figure 3.
Time evolution of the quantities R (solid line) and C (dashed line) for the system reduced to two variables (a) by various quasi−steady-state assumptions and for the complete system (b).
Limit Cycle Oscillations and Stability Analysis.
The existence of oscillations in the two-variable system can be inferred from application of the Poincaré-Bendixson theorem (8). This theorem states that a two-dimensional system of the type we are considering exhibits limit cycles if it is confined in a closed bounded region that does not contain any stable fixed points. The trajectory of the system is confined because the number of molecules cannot reach infinite values. The fixed points and their stability can be determined by following a standard linear stability analysis. There is a single fixed point for positive concentrations. In our case, the signs of the real parts of the eigenvalues of the matrix describing the linearized dynamics around this point are given by
 |
3 |
 |
where τ is the trace of the matrix. All of the quantities are evaluated at the fixed point (R0,C0). When τ is positive, the real part of the eigenvalues is positive, the fixed point is unstable, and there is a limit cycle in the system, which gives sufficient conditions for the existence of oscillations. Evaluation of Eq. [3] shows that τ is indeed positive for the set of parameters we are using. The domain in which τ is positive is rather broad. For instance, the function τ remains positive when θA and θR are multiplied by a factor K with 0.024 < K < 10.7, when all transcription rates (α and α') are multiplied by K with K > 0.08, or when protein and mRNA degradation rates are multiplied by K with 0.0009 < K < 3.5. When τ is negative, the fixed point is stable and, in principle, no conclusion about the existence of limit cycles can be drawn. In this case, the presence of oscillations also could depend on the initial conditions. For the full model, the ranges of parameters that give rise to oscillations are not exactly the same but remain very close to the previous ones.
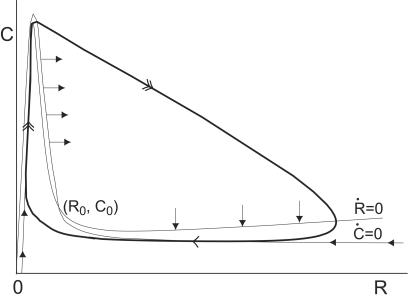
The mechanism responsible for oscillations is illustrated in Fig. 4 through the phase portrait of the two−variable model. Starting with low numbers of initial molecules near the origin of the phase plane, the trajectory rapidly shoots upwards along the Ṙ = 0 nullcline (the dot over a variable means its time derivative). Here, the high levels of A, present because of auto−activated transcription, rapidly induce the formation of the complex C. Reaching the maximum of the nullcline, the trajectory “falls off” the edge and moves rapidly diagonally right and downwards, corresponding to a drop in C and a rise in R. The trajectory curves around the Ṙ = 0 nullcline and hits the Ċ = 0 nullcline, where it slowly returns to the left and approaches the fixed point (R0,C0). When approaching the fixed point, Ṙ decreases sharply, taking the trajectory past the fixed point and sending it back upwards to initiate a new cycle.
Figure 4.
Phase portrait of the two variable oscillator Eq. [2] for the parameter values given in the caption for Fig. 1 (the drawing is not to scale). The thick line illustrates the trajectory of system. (R0,C0) is the fixed point of the system, and Ṙ dR/dt = 0 and Ċ dC/dt = 0 are the R and C nullclines, respectively. The solid arrows give the orientation of the direction field on the nullclines.
The trajectory in Fig. 4 comprises a fast phase corresponding to the rapid production of C and R, and a slow phase corresponding to the slow degradation of R. These two distinct phases are characteristic of excitable systems, the classic example of which is the Fitz Hugh−Nagumo model for action-potential transmission in neurons (9, 10). The fast and slow legs correspond to the excitable and refractory phases of the system, respectively. Thus, the system oscillates as it avoids the fixed point (R0,C0) and hits the Ṙ = 0 nullcline on the left to begin the excitable phase of a new cycle.
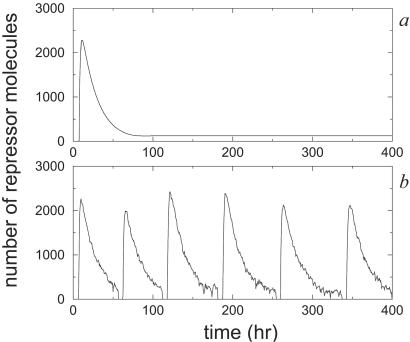
As we have already pointed out, the deterministic analysis can be useful to grasp the main properties of the system under certain conditions. Unfortunately such conditions are not known a priori without a stochastic analysis. Surprisingly enough, we have found that parameter values that give rise to a stable steady state in the deterministic limit continue to produce reliable oscillations in the stochastic case, as shown in Fig. 5. Therefore, the presence of noise not only changes the behavior of the system by adding more disorder but can also lead to marked qualitative differences.
Figure 5.
Time evolution of R for the deterministic Eq. [1] (a) and stochastic (b) versions of the model. The values of the parameters are as in the caption of Fig. 1, except that now we set δR = 0.05 h−1. For these parameter values, τ < 0, so that the fixed point is stable.
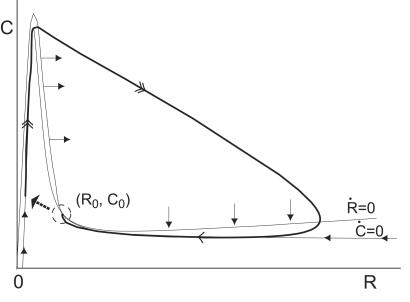
How can the system continue to produce oscillations even when deterministic rate equations predict a stable steady state? The system always evolves toward a stable fixed point, as sketched in Fig. 6. However, a perturbation of sufficient magnitude near the fixed point, e.g., as illustrated by the dotted arrow in Fig. 6 (notice that the figure has not been drawn to scale, and that the size of the arrow is not representative of the actual size of the perturbation), may initiate a new cycle. For low numbers of molecules, the intrinsic fluctuations of chemical reactions can be large enough to continually send the system into the fast phase after each cycle and thus produce sustained oscillations. In the deterministic limit (or close to it), there are no perturbations (or the perturbations are too small) to initiate a new cycle, and the trajectory stays close to the fixed point. In this case, the system performs better if enough noise is present in the system. This situation is analogous to that observed in the Fitz Hugh–Nagumo model, where an optimal amount of noise maximizes the reliability of the oscillations (11). It is important to realize that the effects that noise may have on nonlinear systems can be difficult to predict and rather paradoxical (12). Therefore, the smaller number of molecules does not necessarily imply more irregular behavior of the system, as one might intuitively assume (4, 13).
Figure 6.
Phase portrait as in Fig. 4 but for a situation in which the system falls into the stable fixed point (R0,C0). The dotted arrow to the left of the fixed point illustrates a perturbation that would initiate a single sweep of the (former) oscillatory trajectory.
Significant Parameters and Noise Resistance.
The mechanism responsible for oscillations involves only two variables. This fact has some important consequences for the functioning of the clock. If we consider the deterministic limit, a two-dimensional dynamical system of this type either oscillates regularly or does not oscillate at all. In two dimensions, because trajectories cannot cross, fixed points and periodic orbits are the only possible attractors. Other more complicated behaviors such as chaos or quasi periodicity are not allowed (8). On the other hand, the intrinsic stochastic fluctuations of the remaining variables are effectively averaged and do not significantly affect the performance of the system.
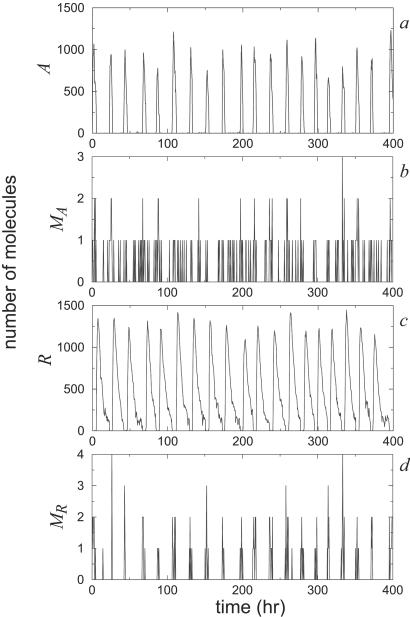
For instance, one variable that usually plays a prominent role in many circadian rhythm models is the number of mRNA molecules (14). In our case, however, mRNA does not enter directly into the dynamics. It is just an intermediate step in the production of the proteins. Thus, if protein production remains unaltered, the system will oscillate regardless of the number of mRNA molecules involved. For instance, increasing simultaneously the degradation rates of mRNA and the translation rate of the proteins has no effect on protein dynamics at all in the deterministic limit of the two-variable model. In the stochastic case, the effects are negligible. Fig. 7 shows the time evolution of repressor mRNA and protein levels in the system for βA, βR, δMA and δMR multiplied by a factor of one hundred. The system essentially alternates between having zero and one mRNA molecule in the cycle, and the proteins continue to exhibit remarkably good oscillations.
Figure 7.
Stochastic time evolution of the number of activator (a) and repressor (c) molecules, and the number of activator (b) and repressor (d) mRNA molecules. The values of the parameters are as in the caption for Fig. 1 but now with βA = 5000 h−1, βR = 500 h−1, δMA = 1000 h−1, and δMR = 50 h−1.
There are also parameters that do affect the properties of the oscillations. In the deterministic limit, oscillations are always regular (provided that the two-variable model is a good approximation). When fluctuations are taken into account, the reliability of the oscillations may depend on those parameters. One such parameter, as we have seen in the previous section, is the repressor degradation rate δR. This parameter affects the period of the oscillations (compare, e.g., Figs. 2 and 5) and also the stability of the fixed point. One can infer from Eq. [3] that, for high or low values of δR, the fixed point becomes stable. In such cases, the deterministic system stops oscillating, but this does not need to be so for the stochastic one, which may continue producing reliable oscillations.
Notice that the positive feedback is a key element in the clock dynamics. Its most obvious use is the generation of the instability that gives rise to oscillations. But it has another not so obvious role that is closely related to the resistance to noise. In general, gene regulation is a slow process (with typical characteristic times of about 1 h) and, as a such, is prone to be affected by fluctuations. This problem gets even worse if the dynamics relies in several coupled-transcriptional feedbacks, because the effects of the fluctuations are then amplified. The positive feedback gives a fast transcriptional switch, allowing it to move fast from low- to high-transcription rates. In this way, the time in which the system is prone to fluctuations is greatly reduced.
Conclusions
The presence of noise in transcriptional and enzymatic networks is a fundamental consequence of the stochastic nature of biochemical reactions. The ability to function effectively and consistently amidst such random fluctuations is a major issue in gene expression and network behavior. In this paper, we have studied how different factors affect a simple model for circadian rhythms that exhibits noise resistance. We found that the oscillations in this model are driven mainly by two components, a repressor protein and an activator-repressor complex. This fact is responsible for the reliability of the oscillations. First, a two-dimensional dynamical system of this kind has a very simple behavior: in the deterministic limit, it either oscillates or goes to a steady state. Second, noise and perturbations in the other variables affect the system only slightly, because they do not enter directly the dynamics. Finally, resistance to noise is achieved as the number of molecules of any of the two key components reaches small values only for short periods of time, or when they are not driving the dynamics of the system. In this way, even though some molecular species may be present in very low numbers, the intrinsic stochasticity of biochemical reactions can be bypassed.
It is important to emphasize that organisms have evolved networks to function in the extremely noisy cellular environment. Suitable network designs, as those that are now emerging from the experimental data (3, 15), can confer resistance against such noise. In addition, some of these networks may not only be resistant to but could also be taking advantage of the cellular noise to perform their functions under conditions in which it would not be possible by deterministic means.
Acknowledgments
This work was supported by the U.S. National Institutes of Health.
References
- 1.Edmunds L N. Cellular and Molecular Bases of Biological Clocks. New York: Springer; 1988. [Google Scholar]
- 2.Dunlap J C. Cell. 1999;96:271–290. doi: 10.1016/s0092-8674(00)80566-8. [DOI] [PubMed] [Google Scholar]
- 3.Barkai N, Leibler S. Nature (London) 2000;403:267–268. doi: 10.1038/35002258. [DOI] [PubMed] [Google Scholar]
- 4.McAdams H H, Arkin A. Trends Genet. 1999;15:65–69. doi: 10.1016/s0168-9525(98)01659-x. [DOI] [PubMed] [Google Scholar]
- 5.van Kampen N G. Stochastic Processes in Physics and Chemistry. Amsterdam: North−Holland; 1981. [Google Scholar]
- 6.Gillespie D T. J Phys Chem. 1977;81:2340–2361. [Google Scholar]
- 7.Murray J D. Mathematical Biology. New York: Springer; 1993. [Google Scholar]
- 8.Strogatz S H. Nonlinear Dynamics and Chaos: With Applications in Physics, Biology, Chemistry, and Engineering. Reading, MA: Addison—Wesley; 1994. [Google Scholar]
- 9.Kaplan D, Glass L. Understanding Nonlinear Dynamics. New York: Springer; 1995. [Google Scholar]
- 10.Keener J, Sneyd J. Mathematical Physiology. New York: Springer; 1990. [Google Scholar]
- 11.Pikovsky K, Kurths J. Phys Rev Lett. 1997;78:775–778. [Google Scholar]
- 12.Vilar J M G, Rubí J M. Phys Rev Lett. 2001;86:950–953. doi: 10.1103/PhysRevLett.86.950. [DOI] [PubMed] [Google Scholar]
- 13.Paulsson J, Ehrenberg M. Phys Rev Lett. 2000;84:5447–5450. doi: 10.1103/PhysRevLett.84.5447. [DOI] [PubMed] [Google Scholar]
- 14.Leloup J C, Goldbeter A. J Biol Rhythms. 1998;13:70–87. doi: 10.1177/074873098128999934. [DOI] [PubMed] [Google Scholar]
- 15.Smolen P, Baxter D A, Byrne J H. J Neurosci. 2001;21:6644–6656. doi: 10.1523/JNEUROSCI.21-17-06644.2001. [DOI] [PMC free article] [PubMed] [Google Scholar]


