

Abstract
Background
Circulating tumor DNA (ctDNA) monitoring shows promise for detecting minimal residual disease (MRD) and predicting prognosis in various cancers, but its role in esophageal cancer (EC) post-esophagectomy is unclear. This study evaluated ctDNA for detecting MRD and predicting outcomes in EC patients.
Methods
A two-step observational study included 40 EC patients (36 squamous cell carcinoma and 4 adenocarcinoma) undergoing upfront surgery or neoadjuvant chemotherapy (NAC) followed by esophagectomy. Plasma samples (n = 124) were collected at six time points, and ctDNA was assessed by next-generation sequencing using an in-house cancer panel. Associations with clinical outcomes were analyzed.
Results
Pre-therapy ctDNA levels correlated with tumor stage (P = 0.01). Changes in ctDNA levels predicted tumor progression with an area under the curve of 0.77. Postsurgical ctDNA positivity predicted recurrence earlier than radiographic evidence (median: 90 days) and was associated with shorter recurrence-free survival (RFS) and progression-free survival (PFS) across all patients (RFS hazard ratio [HR]: 11.1, P = 0.006; PFS HR: 12.6, P = 0.002).
Conclusions
ctDNA assessment is a reliable tool for detecting MRD and predicting outcomes in EC patients after esophagectomy. This approach provides earlier indications of recurrence and can guide personalized postoperative management.
Introduction
Esophageal cancer (EC) is the eighth most common cancer worldwide and the sixth leading cause of cancer-related mortality [1]. Despite advancements in surgical techniques, chemotherapy, and radiotherapy, the prognosis for EC remains poor, with a 5-year survival rate of less than 20% in many regions [2, 3]. One of the major challenges in improving patient outcomes is the high recurrence rate following esophagectomy, which occurs in up to 50% of patients [4]. Early detection of recurrence and adjuvant treatment to prevent recurrence are crucial for improving survival rates [5]. However, conventional imaging and clinical assessments often lack the sensitivity required for early detection.
Circulating tumor DNA (ctDNA) has emerged as a promising biomarker for the detection of minimal residual disease (MRD) and prediction of recurrence in various cancers [6, 7]. Specifically, ctDNA refers to fragments of DNA shed by tumor cells into the bloodstream that can be detected using highly sensitive molecular techniques such as digital polymerase chain reaction and next-generation sequencing (NGS) [8, 9]. Moreover, studies have shown that ctDNA can provide real-time insights into tumor dynamics, including information on tumor burden, genetic alterations, and treatment response [8, 10, 11].
Our previous research demonstrated that ctDNA levels correlate with tumor burden and can predict recurrence in other gastrointestinal cancers, such as colorectal cancer [12, 13]. In EC, the utility of ctDNA as a biomarker for MRD detection after chemoradiotherapy has been reported in a retrospective study [14]. However, limited data are available on the prognostic value of ctDNA levels in patients with EC after esophagectomy.
This study aimed to evaluate the efficacy of ctDNA monitoring for detecting MRD and predicting outcomes in patients with EC who have undergone esophagectomy. We hypothesized that a postsurgical ctDNA-positive status is associated with a higher risk of recurrence and shorter recurrence-free survival (RFS) or progression-free survival (PFS). Additionally, we evaluated the duration from ctDNA positivity to recurrence, as diagnosed by radiographic examinations, and the association between ctDNA status and perioperative chemotherapy. By integrating ctDNA analysis with postsurgical surveillance, we aimed to identify high-risk patients who may benefit from additional therapeutic interventions.
Material and methods
Study design and inclusion criteria
This was a two-step (retrospective pilot study cohort 1 and prospective validation study cohort 2) observational study of longitudinal ctDNA monitoring in patients with EC who underwent esophagectomy at Kyushu University Hospital between October 2020 and January 2023. Patients with EC scheduled for upfront surgery or neoadjuvant chemotherapy (NAC) followed by esophagectomy were enrolled. Plasma samples were collected at six time points: pre-therapy, post-NAC, and 1,3, 6, and 12 months after surgery. The study design and details of blood collection time points are shown in Fig. 1a.
Fig. 1. Study workflow and ctDNA status analysis.

a Schematic representation of the study design and timeline of blood sample collection. Plasma samples were collected at six time points: pre-therapy (pre-NAC), post-NAC (pre-op), and 1, 3, 6, and 12 months post-surgery. NAC neoadjuvant chemotherapy, op surgery. b Overview of patient enrollment. Six patients were retrospectively enrolled in cohort 1, and 34 patients were prospectively enrolled in cohort 2. The combined analysis included a total of 40 patients. c Changes in the number of tumor-informed ctDNAs with VAF ≥ 1% in cohort 1 patients with and without recurrence. Patients without recurrence (n = 3) exhibited a decrease in ctDNA, whereas those with recurrence (n = 3) showed an increase after surgery. VAF variant allele frequency, RF recurrence-free, R recurrence; Student’s t test P = 0.05. d Changes in the number of tumor-informed ctDNAs with VAF ≥ 1% in cohort 2 patients with and without tumor progression. Patients without tumor progression (n = 25) exhibited a decrease in ctDNA, whereas those with tumor progression (n = 9) showed an increase after surgery. VAF variant allele frequency, PF progression-free, P progression; Student’s t test P = 0.007. e Longitudinal ctDNA status after therapy and clinical landmarks for cohort 1 patients. NAC neoadjuvant chemotherapy, adj adjuvant chemotherapy. f Longitudinal ctDNA status after therapy and clinical landmarks for cohort 2 patients. NAC neoadjuvant chemotherapy, adj adjuvant chemotherapy. g Kaplan–Meier curve for RFS in cohort 1, stratified by ctDNA status at the initial postsurgical assessment. RFS recurrence-free survival; log-rank P = 0.034. h Kaplan–Meier curve for PFS in cohort 2, stratified by ctDNA status at the initial postsurgical assessment. PFS progression-free survival; log-rank P = 0.025.
The inclusion criteria were as follows: age >18 years with previously untreated stage I to stage IVA esophageal adenocarcinoma (EAC) or esophageal squamous cell carcinoma; patients who had an Eastern Cooperative Oncology Group performance status of 0–1 before participation in this study; esophagectomy with two or three field lymph nodes dissection; and written informed consent obtained before participation in this study. The exclusion criteria were as follows: no pre-therapy blood samples collected; no postsurgical surveillance at our center; and withdrawal from surgery.
Patient cohort
Six eligible patients were retrospectively included in cohort 1 as a pilot study, with one upfront surgery patient and five NAC patients. The protocol for cohort 1 was approved by the ethics committee of Kyushu University (21116-00), and clinical and pathological information was obtained from the pathology reports and electronic medical records of each patient. The follow-up schedule included an initial follow-up visit 4–6 weeks after esophagectomy with tumor marker examinations. Patients were monitored every 3 months using computed tomography (CT) for the 1st year and every 4 months for the 2nd year.
A total of 34 eligible patients were prospectively included in the validation study in cohort 2, including 14 patients who underwent upfront surgery and 20 patients who underwent NAC. The protocol for cohort 2 was approved by the Ethics Committee of Kyushu University (2021-61). The enrolled patients received standard therapy according to the Esophageal Cancer Practice Guidelines (2017), edited by the Japan Esophageal Society [15]. The clinical and pathological information of each patient was prospectively recorded in a secured database at our center. The follow-up schedule included an initial follow-up visit 4–6 weeks after esophagectomy with tumor marker examinations. Patients were monitored every 3 months using CT for the 1st year and every 4 months for the 2nd year.
Tumor regression grade (TRG) after NAC was evaluated using the Mandard score based on pathological reports: TRG 1, complete response with no residual cancer; TRG 2, rare residual cancer; TRG 3, fibrosis outgrowing residual cancer; TRG 4, residual cancer outgrowing fibrosis; TRG 5, absence of regression changes.
The sample size was estimated based on the primary endpoint of PFS, aiming to detect a significant difference between patients with postoperative ctDNA positivity and negativity. Based on a previous study [16], the 2-year PFS was assumed to be 25% in ctDNA-positive patients and 90% in ctDNA-negative patients. Assuming a ctDNA-positive rate of 28%, a two-sided α of 0.05, and 80% power, a total of 26 patients (7 ctDNA-positive and 18 ctDNA-negative) were required to detect this difference using a log-rank test.
DNA extraction
A total of 40 tumor tissue samples, 124 plasma samples, and 40 buffy coats were collected from 40 patients. Genomic DNA was extracted from formalin-fixed paraffin-embedded (FFPE) tumor sections using a previously described method [17]. DNA was extracted from 10 µm thick FFPE tissue sections using the Maxwell® RSC DNA FFPE Kit (Promega, Madison, WI, USA). Briefly, paraffin was removed with xylene, followed by ethanol washes. The tissue was then digested with Proteinase K at 56 °C overnight. DNA was purified using the automated Maxwell® RSC instrument according to the manufacturer’s protocol. Genomic DNA was also extracted from frozen buffy coats using the Allprep DNA Mini Kit (Qiagen, Hilden, Germany) according to the manufacturer’s protocol. Cell-free DNA (cfDNA) was extracted from plasma samples using a QIAamp Circulating Nucleic Acid Kit (Qiagen, Hilden, Germany) according to the manufacturer’s protocol. For quality control purposes, the extracted genomic DNA was evaluated using the TapeStation system (Agilent Technologies, Santa Clara, CA, RRID:SCR_018435), either via Genomic DNA ScreenTape (tumors and buffy coats) or High-Sensitivity D5000 ScreenTape (cfDNA).
In-house cancer panel
To investigate the genetic alterations commonly found in EC, we developed a 250-gene sequencing panel covering the whole exome of each gene using the SureDesign design tool (Agilent Technologies, CA, USA). The target genes included alterations that have been previously reported in EAC [14, 18] and squamous cell carcinoma [14, 19, 20]. The current panel also included genes identified in >15% of EAC and squamous cell carcinoma patients from TCGA (cBioportal: http://www.cbioportal.org/study/summary?id=esca_tcga) (RRID:SCR_014555). These references served as the basis for selecting genes that are not only frequently altered but also potentially useful for monitoring MRD and predicting treatment outcomes. The total number of probes was 92312 and the size was 2.691 megabase pairs (Mbp). The total sequence region size was 2.609 Mbp. A summary of the panel is provided in Supplementary Tables 1 and 2.
Criteria for tumor-informed ctDNA detection and monitoring
The genomic DNA and cfDNA extracted from all samples were analyzed for the presence of mutations using an in-house cancer gene panel that examined 250 genes and detected single nucleotide variants, indels, and fusions. Library preparation was performed according to the manufacturer’s protocol for SureSelect PostPool Custom Tier2 (Agilent Technologies). NGS was performed using a NovaSeq 6000 S4 (Illumina, San Diego, CA, RRID:SCR_016387), obtaining a 10Gbase/sample. Raw sequence files were aligned to hg19 using the Burrows-Wheeler Aligner with default analysis parameters. The generated BAM files were further analyzed using SAMtools v1.14 (RRID:SCR_002105), VarScan v2.4.4 (RRID:SCR_006849), and SnpEff v4.3t (RRID:SCR_005191) to generate the VCF files. Tumor mutational burden (TMB) was calculated using VCF files and the R packages “VariantAnnotation (RRID:SCR_000074),” “GenomicRanges (RRID:SCR_000025),” and “dplyr (RRID:SCR_016708).” The TMB was defined as the number of somatic mutations per megabase pair in a panel. Only somatic mutations identified in the coding regions, specifically missense variants, were included in TMB calculations.
Mutations were defined as somatic if they met the following criteria: (i) nonsynonymous with allele frequency ≥1%; (ii) no variant reads in paired germline; (iii) ≥200 × deduped depth in plasma and tumor; and (iv) never described in the ToMMo38K dataset as a germline mutation. The ToMMo38K dataset is a part of the Tohoku Medical Megabank Organization project and contains genomic data from ~38,000 Japanese individuals (https://jmorp.megabank.tohoku.ac.jp/). Somatic mutations identified both in the tumor and plasma were defined as tumor-informed ctDNAs. Moreover, the number of tumor-informed ctDNAs in each plasma sample was calculated. A decrease in the number of tumor-informed ctDNAs after NAC or surgery was defined as “ctDNA-negative”. Conversely, an increase in the number of tumor-informed ctDNAs after therapy was defined as “ctDNA-positive.”
Statistical analysis
The primary endpoint was PFS, defined as the time between the date of surgery and that of the diagnosis of recurrence in patients with R0 resection or tumor progression in patients without R0 resection. Recurrence was determined based on diagnostic imaging (such as CT). Fisher’s exact test or the chi-square test was used to compare categorical variables. Student’s t test or the Mann–Whitney U test was used to compare continuous variables. Survival analyses were carried out using the R packages “survival (RRID:SCR_021137)” and “survminer (RRID:SCR_021094).” The Kaplan–Meier method was used to estimate the survival distribution. Differences between groups were tested using the log-rank test. A multivariable Cox proportional hazards model was used to assess prognostic factors associated with PFS (coxph). The receiver operating characteristic (ROC) curve for the number of tumor-informed ctDNA changes in PFS was carried out using the R package “pROC (RRID:SCR_024286).” A swimmer plot for clinical landmark and longitudinal ctDNA status was drawn using the R packages “ggplot2 (RRID:SCR_014601)” and “swimplot.” The representative genomic alterations detected from tumor tissues and pre-therapy plasma ctDNA were described in waterfall plots using the R packages “GenVisR” and “reshape2 (RRID:SCR_022679).” Statistical significance was set at P < 0.05. All statistical analyses were performed using R version 4.2.3 (R Foundation, RRID:SCR_001905).
Results
Patient characteristics
An overview of the workflow is presented in Fig. 1a, b. Six patients were retrospectively enrolled in cohort 1, whereas 34 patients were prospectively enrolled in cohort 2, resulting in a combined total of 40 patients. Overall, 124 blood samples from 40 patients with EC were collected serially at the following time points: pre-therapy (n = 40), post-NAC (n = 23), and post-surgery (n = 61). Somatic mutations were detected in all tumor tissues and pre-therapy blood samples. Analysis of cohort 1 revealed that the number of tumor-informed ctDNAs with variant allele frequency (VAF) ≥1% decreased after surgery in patients without recurrence but increased in those with recurrence (Fig. 1c). Consequently, compared to the pre-therapy plasma, patients with a decrease in the number of tumor-informed ctDNAs after NAC or surgery was defined as ctDNA-negative, whereas an increase was defined as ctDNA-positive. Based on these criteria, all patients were categorized into ctDNA-negative (n = 20) or ctDNA-positive (n = 20) groups at the initial postsurgical assessment. Patient characteristics, including ctDNA status at the initial postsurgical assessment, are summarized in Table 1 and Supplementary Table 3. Significant differences were observed in sex and pathological N stage between the ctDNA-positive and ctDNA-negative groups, whereas other variables showed no significant differences (Table 1).
Table 1.
Background data and ctDNA status at the initial assessment after surgery (n = 40).
| Factors | Category | ctDNA negative (n = 20) | ctDNA positive (n = 20) | P value |
|---|---|---|---|---|
| Age, median | 69.5 [50–79] | 64.5 [49–83] | 0.28 | |
| Sex (male) | Female | 1 (5%) | 7 (35%) | 0.04 |
| Male | 19 (95%) | 13 (65%) | ||
| Location | Ut | 4 (20%) | 7 (35%) | 0.39 |
| Mt | 11 (55%) | 9 (45%) | ||
| Lt | 3 (15%) | 4 (20%) | ||
| EGJ | 2 (10%) | 0 | ||
| Histology | Adeno | 4 (20%) | 0 | 0.11 |
| SCC | 16 (80%) | 20 (100%) | ||
| Pathological T Stage | T1 | 9 (45%) | 10 (50%) | 0.88 |
| T2 | 3 (15%) | 2 (10%) | ||
| T3 | 8 (40%) | 8 (40%) | ||
| Pathological N Stage | N0 | 9 (45%) | 10 (50%) | 0.01 |
| N1 | 9 (45%) | 2 (10%) | ||
| N2 | 1 (5%) | 8 (40%) | ||
| N3 | 1 (5%) | 0 | ||
| Pathological Stage | 0, IA, IB | 5 (25%) | 6 (30%) | 0.61 |
| IIA, IIB | 8 (40%) | 5 (25%) | ||
| IIIA, IIIB | 5 (25%) | 8 (40%) | ||
| IVA, IVB | 2 (10%) | 1 (5%) | ||
| NAC | No | 7 (35%) | 8 (40%) | 1.00 |
| Yes | 13 (65%) | 12 (60%) | ||
| Adj | No | 15 (75%) | 18 (90%) | 0.41 |
| Yes | 5 (25%) | 2 (10%) | ||
| R0 resection | No | 0 | 3 (15%) | 0.23 |
| Yes | 20 (100%) | 17 (85%) | ||
| LN dissection | Two-field | 13 (65%) | 13 (65%) | 1.00 |
| Three-field | 7 (35%) | 7 (35%) | ||
| TMB (tumor tissue) | 33.2 [15.7–97.4] | 43.3 [14.6–69.0] | 0.22 | |
| TMB (pre-therapy plasma) | 9.2 [0.4–12.3] | 8.6 [1.5–12.3] | 0.93 | |
Values in brackets are range; Pathological stage according to the UICC staging system for esophageal cancer (the 8th version).
Ut upper thoracic esophagus, Mt middle thoracic esophagus Lt lower thoracic esophagus, EGJ esophagogastric junction, Adeno adenocarcinoma, SCC squamous cell carcinoma, NAC neoadjuvant chemotherapy, Adj adjuvant chemotherapy, LN lymph nodes, TMB tumor mutation burden.
Genomic alteration distribution by NGS in tumor tissues and pre-therapy ctDNA
Tumor DNA from macrodissected FFPE tumor sections (n = 40) and plasma samples (n = 124) was sequenced using our current panel, achieving a minimum coverage of 200. Germline DNA from matching buffy coat samples was sequenced using the same panel. We explored the genomic landscape of EC in tumor tissues and pre-therapy plasma samples from 40 patients with EC (Supplementary Figs. 1 and 2). The most frequently mutated genes were GNAS (100%) in tumor tissues and MUC4 (100%) in pre-therapy plasma. Among somatic mutations with a frequency of ≥75% in tumor tissues, 443 mutations were identified, 313 of which occurred in non-coding regions. Similarly, among tumor-informed ctDNA mutations with a frequency of ≥75%, 793 mutations were identified, with 607 occurring in non-coding regions. These findings suggest that non-coding region mutations may be more frequently identified in tumor tissues and pre-therapy plasma samples using the current panel.
Association of tumor-informed ctDNA mutation with tumor progression
According to the somatic mutation criteria described in the Material and Methods section, the median number of somatic mutations identified in the tumor tissues was 393 [range: 136–854]. In contrast, the median number of tumor-informed ctDNA mutations identified in the pre-therapy plasma was 163 [range: 24–225] (Supplementary Table 4). The number of somatic mutations in tumor tissues did not correlate with the Union for International Cancer Control pathological stage (UICC pStage). Nevertheless, the number of tumor-informed ctDNA mutations from pre-therapy plasma was significantly higher in patients with EC pStage ≥IIB compared to those with EC pStage ≤IIA (Supplementary Fig. 3). However, the number of tumor-informed ctDNA mutations in pre-therapy plasma was not associated with PFS across all 40 patients (Supplementary Fig. 4a). Next, we focused on the changes in the number of tumor-informed ctDNAs during therapeutic intervention. Consistent with the analysis of cohort 1, the number of tumor-informed ctDNAs decreased after surgery in cohort 2 patients who did not experience tumor progression but increased in those who did (Fig. 1d). Thus, defining a decrease in the number of tumor-informed ctDNAs as ctDNA-negative status and an increase as ctDNA-positive status across all patients is a rational classification. Additionally, the area under the curve (AUC) of the initial postsurgical ctDNA status for predicting tumor progression was 0.77, with a sensitivity of 90.9% and specificity of 65.5% in all patients (Supplementary Fig. 4b). These results suggest that the ctDNA status is associated with tumor progression in patients with EC.
Association of ctDNA status at the initial assessment after surgery with RFS and PFS
As of 11 July 2023, the median follow-up period was 22.6 months [16.2–29.8] in cohort 1 and 13.9 months [5.1–29.7] in cohort 2. Based on ctDNA status after therapy, each plasma sample was classified as either ctDNA-negative or ctDNA-positive. An overview of longitudinal ctDNA testing after therapy and clinical landmarks is shown in Fig. 1e for cohort 1, Fig. 1f for cohort 2, and in Supplementary Fig. 5 for all patients. The median period between surgery and initial postsurgical assessment of ctDNA status was 1.2 months [0.6–6.4] across all patients. Furthermore, patients with an initial postsurgical ctDNA-positive status had a shorter RFS in cohort 1 (Fig. 1g, P = 0.034) and a shorter PFS in cohort 2 compared to those without (Fig. 1h, hazard ratio (HR) 7.6, 95% confidence interval (CI) 0.9–62.4, P = 0.025). Among the 20 patients with initial postsurgical ctDNA-positive status, 50% (10 out of 20) experienced recurrence or tumor progression, whereas only 5% (one out of 20) of patients with initial postsurgical ctDNA-negative status experienced recurrence (HR 12.6, 95% CI 1.6–99.0, P = 0.002), demonstrating an 18-month PFS of 53.3% (95% CI 34.9–81.4%) versus 95.0% (95% CI 85.9–100%), respectively (Fig. 2a). This trend was observed across R0 patients and R0 patients with NAC: R0 patients (HR 11.1, 95% CI 1.4–89.0, P = 0.002) (Fig. 2b); R0 patients with NAC (HR 9.3, 95% CI 1.1–80.0, P = 0.019) (Fig. 2c). Although not statistically significant, none of the patients with an initial postsurgical ctDNA-negative status experienced recurrence among those who underwent R0 upfront surgery (Fig. 2d). Moreover, risk factor analysis for PFS in all patients revealed that a ctDNA-positive status was independently associated with poor survival (Table 2).
Fig. 2. Association of initial postsurgical ctDNA status with survival.

a Kaplan–Meier curve for PFS comparing postsurgical ctDNA-positive and ctDNA-negative patients across all patients. PFS progression-free survival; log-rank P = 0.002. b RFS comparison in R0 resected patients stratified by postsurgical ctDNA status. RFS recurrence-free survival, log-rank P = 0.006. c RFS comparison in R0 resected patients who received neoadjuvant chemotherapy, stratified by postsurgical ctDNA status. RFS recurrence-free survival, log-rank P = 0.019. d RFS comparison in R0 resected patients who underwent upfront surgery, stratified by postsurgical ctDNA status. RFS recurrence-free survival; log-rank P = 0.15.
Table 2.
Risk factor analyses for PFS in this study (n = 40).
| Factors | Univariate | Multivariate | |||
|---|---|---|---|---|---|
| Hazard ratio (95%CI) | P value | Hazard ratio (95%CI) | P value | ||
| ctDNA | Negative (n = 20) | Reference | 0.016 | Reference | 0.007 |
| Positive (n = 20) | 12.6 (1.6–99.0) | 19.1 (2.21–164.85) | |||
| Age | ≤65 (n = 18) | Reference | 0.300 | ||
| >65 (n = 22) | 0.5 (0.15–1.79) | ||||
| Sex | Female (n = 8) | Reference | 0.157 | ||
| Male (n = 32) | 0.4 (0.12–1.41) | ||||
| Location | L (n = 9) | Reference | 0.250 | ||
| UM (n = 31) | 3.3 (0.43–26.23) | ||||
|
Pathological T Stage |
T1 (n = 19) | Reference | 0.084 | ||
| T2-T3 (n = 21) | 3.3 (0.85–12.38) | ||||
|
Pathological N Stage |
0 (n = 19) | Reference | 0.086 | ||
| N1-N3 (n = 21) | 3.2 (0.85–12.19) | ||||
|
Pathological Stage |
≤IIA (n = 15) | Reference | 0.095 | Reference | 0.033 |
| >IIA (n = 25) | 3.7 (0.80–17.63) | 6.9 (1.17–40.32) | |||
| NAC | No (n = 15) | Reference | 0.312 | ||
| Yes (n = 25) | 2.0 (0.52–7.58) | ||||
| Adj | No (n = 33) | Reference | 0.430 | ||
| Yes (n = 7) | 0.4 (0.06–3.41) | ||||
Cox regression analysis was performed to control for confounding bias; ctDNA status was defined by the initial assessment after surgery; Pathological stage according to the UICC staging system for esophageal cancer (the 8th version).
PFS progression-free survival, NAC neoadjuvant chemotherapy, Adj adjuvant chemotherapy, 95%CI confidence interval.
The monitoring of tumor-informed ctDNA status
Of the initial postsurgical ctDNA-positive patients who underwent R0 resection, eight experienced recurrence, with ctDNA positivity detected at a median of 90 days before radiographic evidence of recurrence (Fig. 3). Among the initial postsurgical ctDNA-negative patients who underwent R0 resection, only one experienced recurrence; this patient had early postoperative recurrence in the cervical lymph nodes and was treated with radiotherapy. Despite subsequent chemotherapy, the disease progressed, making ctDNA status positive (Supplementary Fig. 5, patient ID: EP1). In addition, NAC was administered to 25 patients, and the association between NAC efficacy and ctDNA status was evaluated in 23 patients. Two patients who received NAC did not undergo ctDNA status assessments after chemotherapy. Among the ctDNA-negative cases after chemotherapy (n = 17), 53% were classified as TRG 1–3 (based on Mandard TRG), whereas 33% of ctDNA-positive cases (n = 6) were TRG 1–3. Although not statistically significant, ctDNA-negative status after NAC may be associated with a higher response rate to NAC (Supplementary Fig. 6).
Fig. 3. The duration from the detection of ctDNA positivity to the identification of recurrence by conventional examination methods (radiographic test).
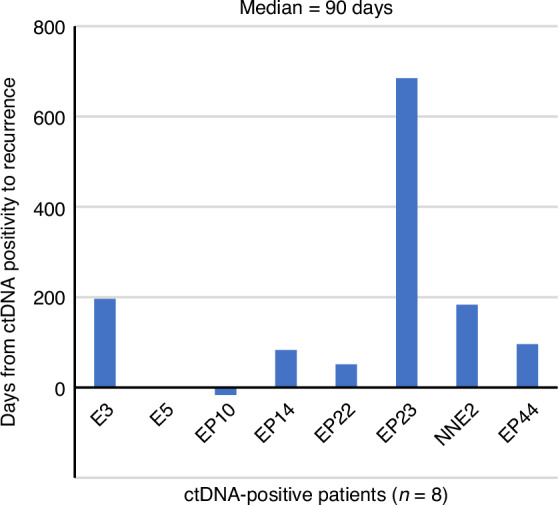
Eight esophageal cancer patients who underwent R0 resection developed recurrence; the median duration was 90 days.
In the serial plasma samples, most ctDNA mutations remained stable over time. However, some mutations emerged or disappeared during follow-up, possibly reflecting dynamic changes in the tumor clone or treatment-induced selection pressure. No consistent trends were observed indicating that specific mutations were strongly associated with recurrence or poor outcomes.
Discussion
Our study demonstrates the clinical utility of postsurgical ctDNA monitoring using a novel 250-gene sequencing panel to detect MRD and predict the prognosis of patients with EC after esophagectomy. The results indicate a strong association between ctDNA status and clinical outcomes, with ctDNA-positive patients exhibiting significantly shorter RFS and PFS than did ctDNA-negative patients. This finding is consistent with previous research results on other cancers, in which ctDNA was shown to correlate with disease recurrence and patient outcomes [12, 21–23].
ctDNA can be detected in the plasma of cancer patients, serving as a potential noninvasive tool for characterizing the somatic genetic features of their tumors [6, 24]. In addition, ctDNA levels can be used to monitor tumor dynamics in various cancers [9]. In this study, the number of tumor-informed ctDNA mutations detected in pre-therapy plasma was significantly associated with the pathological stage, indicating that ctDNA may reflect tumor progression. Moreover, ctDNA-positive status, defined by an increase in the number of tumor-informed ctDNA mutations after surgery, was associated with shorter RFS or PFS in cohort 1, cohort 2, and the combined patient group. In contrast, patients who achieved ctDNA-negative status after NAC tended to respond well to chemotherapy. These findings strongly support our hypothesis that the ctDNA status reflects MRD and is an optimal predictor of recurrence or tumor progression.
The JCOG1109 study revealed that ~30% of patients with EC developed recurrence within 2 years, even after receiving effective NAC, such as the docetaxel, cisplatin, and 5-fluorouracil regimen [25]. Thus, adjuvant chemotherapy may improve the prognosis of EC patients [5]. However, there is a lack of evidence to identify patients who would benefit from adjuvant chemotherapy after esophagectomy. Our findings suggest that postsurgical ctDNA status can predict tumor recurrence earlier than routine radiographic examinations, with a median lead time of 90 days. This is consistent with the growing body of evidence supporting the use of ctDNA as a biomarker for the early identification of patients at high risk of recurrence [12, 21, 22], i.e., those who are most likely to benefit from intensive surveillance and additional therapeutic interventions.
In this present study, four patients were ctDNA-negative after surgery but converted to ctDNA-positive during follow-up. One of these patients became ctDNA-positive after clinical recurrence was confirmed. The increase in MRD, a known cause of recurrence, is considered a potential reason for the conversion to ctDNA positivity.
According to the retrospective cohort analysis, all patients in both cohorts were classified as ctDNA-positive or ctDNA-negative based on changes in the number of tumor-informed ctDNAs after surgery. A decrease in the ctDNA level was defined as “ctDNA-negative”, whereas an increase was defined as “ctDNA-positive”. The AUC for changes in the tumor-informed ctDNA levels after surgery for predicting tumor progression across all patients was 0.77, with an optimal cutoff value of 1. Importantly, this cutoff value was consistent with the classification method established in the retrospective cohort, further validating the ctDNA status classification used in this study.
Mutations are abundant in non-coding regions and are more than 50 times larger than those in the coding exome [26, 27]. Specifically, mutations in non-coding regions may drive cancer development by dysregulating proto-oncogenes and tumor suppressor genes [28, 29]. Moreover, somatic mutations can be identified in the non-coding and coding regions using ctDNA analysis [30]. To improve the sensitivity of ctDNA detection derived from MRD, we developed a sequencing panel that covers the coding and non-coding regions of 250 EC-specific genes. This broader coverage allowed us to detect a higher frequency of somatic mutations in non-coding regions, which may have contributed significantly to the sensitivity of MRD detection even with relatively shallow sequencing coverage. This capability enhances the feasibility of ctDNA monitoring in routine clinical practice and offers a cost-effective solution that can be widely adopted.
However, this study had several limitations. The relatively small sample size and single-center design may limit the generalizability of our findings. Additionally, although the follow-up period was sufficient for early outcome assessment, a longer follow-up period is required to fully understand the long-term impact of ctDNA monitoring on survival. This study, which includes both retrospective and prospective data, demonstrates that ctDNA monitoring enables earlier detection of recurrence after esophagectomy in patients with EAC or squamous cell carcinoma. However, its histology-specific prognostic utility remains unclear. Future histology-specific studies with larger multicenter cohorts and extended follow-up periods are warranted to validate our findings and explore the prognostic value of specific mutations in ctDNA.
Conclusion
In conclusion, our study provides compelling evidence that ctDNA monitoring using an in-house-developed gene panel is a valuable tool for detecting MRD and predicting outcomes in patients with EC after esophagectomy. The ability to use lower-coverage sequencing without compromising the predictive power represents a significant scientific and economic advancement. Integrating ctDNA analysis into postsurgical surveillance protocols could enhance the identification of high-risk patients and improve personalized treatment approaches, ultimately leading to better patient outcomes.
Supplementary information
Acknowledgements
We sincerely thank the patients who participated in this study and their families. We are also grateful thank all the staff in our department for their valuable contributions.
Author contributions
Q. Hu: conceptualization, formal analysis, validation, investigation, visualization, methodology, writing—original draft, Y. Kimura: conceptualization, data curation, formal analysis, investigation, visualization, methodology, writing—review and editing, S. Ikeda: investigation, validation, Y. Tanaka: investigation, validation, T. Nakanoko: data curation, investigation, writing—review and editing, M. Ota: validation, writing—review and editing, T. Yoshizumi: resources, supervision, M. Eto: resources, supervision, funding acquisition, E. Oki: conceptualization, resources, supervision, writing—review and editing.
Funding
This study was conducted within a joint research department between Denka Co., Ltd. and Kyushu University, with funding provided by Denka Co., Ltd.
Data availability
All relevant data used to conduct the analyses are available within the article. To protect the privacy and confidentiality of patients in this study, clinical data are not made publicly available in a repository or the supplementary material of the article but can be requested at any time from the corresponding author. Any requests will be reviewed within a time frame of 2–3 weeks by the authors to verify whether the request is subject to any intellectual property or confidentiality obligations. All data shared will be de-identified.
Code availability
The R scripts used for data analysis and figure generation in this study are available from the corresponding author upon reasonable request.
Competing interests
The authors declare no competing interests.
Ethics approval and consent to participate
Written informed consent was obtained from all study participants. The study protocols were approved by the Ethics Committee of Kyushu University (reference numbers: 2021-61 and 21116-00). The study was conducted in accordance with the ethical principles outlined in the Declaration of Helsinki.
Consent for publication
This manuscript does not contain any individual person’s data, including personal details, images, or videos. No data from children are included. Therefore, consent for publication is not applicable in this case.
Footnotes
Publisher’s note Springer Nature remains neutral with regard to jurisdictional claims in published maps and institutional affiliations.
These authors contributed equally: Qingjiang Hu, Yasue Kimura.
Supplementary information
The online version contains supplementary material available at 10.1038/s44276-025-00158-x.
References
- 1.Bray F, Ferlay J, Soerjomataram I, Siegel RL, Torre LA, Jemal A. Global cancer statistics 2018: GLOBOCAN estimates of incidence and mortality worldwide for 36 cancers in 185 countries. CA Cancer J Clin. 2018;68:394–424. [DOI] [PubMed] [Google Scholar]
- 2.Pennathur A, Gibson MK, Jobe BA, Luketich JD. Oesophageal carcinoma. Lancet. 2013;381:400–12. [DOI] [PubMed] [Google Scholar]
- 3.Lagergren J, Smyth E, Cunningham D, Lagergren P. Oesophageal cancer. Lancet. 2017;390:2383–96. [DOI] [PubMed] [Google Scholar]
- 4.Kimura Y, Oki E, Nakanoko T, Hu Q, Natsugoe K, Nanbara S, et al. Evolution of treatment outcomes and prognostic factors in esophageal cancer surgery: a retrospective analysis of 1500 consecutive esophagostomies. Ann Surg Open. 2023;4:e347. [DOI] [PMC free article] [PubMed] [Google Scholar]
- 5.Kelly RJ, Ajani JA, Kuzdzal J, Zander T, Van Cutsem E, Piessen G, et al. Adjuvant nivolumab in resected esophageal or gastroesophageal junction cancer. N Engl J Med. 2021;384:1191–203. [DOI] [PubMed] [Google Scholar]
- 6.Bettegowda C, Sausen M, Leary RJ, Kinde I, Wang Y, Agrawal N, et al. Detection of circulating tumor DNA in early- and late-stage human malignancies. Sci Transl Med. 2014;6:224ra24. [DOI] [PMC free article] [PubMed] [Google Scholar]
- 7.Diehl F, Schmidt K, Choti MA, Romans K, Goodman S, Li M, et al. Circulating mutant DNA to assess tumor dynamics. Nat Med. 2008;14:985–90. [DOI] [PMC free article] [PubMed] [Google Scholar]
- 8.Schwarzenbach H, Hoon DS, Pantel K. Cell-free nucleic acids as biomarkers in cancer patients. Nat Rev Cancer. 2011;11:426–37. [DOI] [PubMed] [Google Scholar]
- 9.Diaz LA Jr., Bardelli A. Liquid biopsies: genotyping circulating tumor DNA. J Clin Oncol. 2014;32:579–86. [DOI] [PMC free article] [PubMed] [Google Scholar]
- 10.Chi Y, Su M, Zhou D, Zheng F, Zhang B, Qiang L, et al. Dynamic analysis of circulating tumor DNA to predict the prognosis and monitor the treatment response of patients with metastatic triple-negative breast cancer: a prospective study. eLife. 2023;12:e90198. [DOI] [PMC free article] [PubMed] [Google Scholar]
- 11.Tie J, Kinde I, Wang Y, Wong HL, Roebert J, Christie M, et al. Circulating tumor DNA as an early marker of therapeutic response in patients with metastatic colorectal cancer. Ann Oncol. 2015;26:1715–22. [DOI] [PMC free article] [PubMed] [Google Scholar]
- 12.Kotani D, Oki E, Nakamura Y, Yukami H, Mishima S, Bando H, et al. Molecular residual disease and efficacy of adjuvant chemotherapy in patients with colorectal cancer. Nat Med. 2023;29:127–34. [DOI] [PMC free article] [PubMed] [Google Scholar]
- 13.Nakamura Y, Taniguchi H, Ikeda M, Bando H, Kato K, Morizane C, et al. Clinical utility of circulating tumor DNA sequencing in advanced gastrointestinal cancer: SCRUM-Japan GI-SCREEN and GOZILA studies. Nat Med. 2020;26:1859–64. [DOI] [PubMed] [Google Scholar]
- 14.Azad TD, Chaudhuri AA, Fang P, Qiao Y, Esfahani MS, Chabon JJ, et al. Circulating tumor DNA analysis for detection of minimal residual disease after chemoradiotherapy for localized esophageal cancer. Gastroenterology. 2020;158:494–505.e6.e496. [DOI] [PMC free article] [PubMed] [Google Scholar]
- 15.Kitagawa Y, Uno T, Oyama T, Kato K, Kato H, Kawakubo H, et al. Esophageal cancer practice guidelines 2017 edited by the Japan esophageal society: part 2. Esophagus. 2019;16:25–43. [DOI] [PMC free article] [PubMed] [Google Scholar]
- 16.Huffman BM, Aushev VN, Budde GL, Chao J, Dayyani F, Hanna D, et al. Analysis of circulating tumor DNA to predict risk of recurrence in patients with esophageal and gastric cancers. JCO Precis Oncol. 2022;6:e2200420. [DOI] [PMC free article] [PubMed] [Google Scholar]
- 17.Hu Q, Oki E, Yamada T, Kashiwada T, Sonoda H, Kataoka M, et al. Genomic characterization between HER2-positive and negative gastric cancer patients in a prospective trial. Cancer Med. 2023;12:16649–60. [DOI] [PMC free article] [PubMed] [Google Scholar]
- 18.Kato S, Okamura R, Baumgartner JM, Patel H, Leichman L, Kelly K, et al. Analysis of circulating tumor DNA and clinical correlates in patients with esophageal, gastroesophageal junction, and gastric adenocarcinoma. Clin Cancer Res. 2018;24:6248–56. [DOI] [PMC free article] [PubMed] [Google Scholar]
- 19.Dutta M, Nakagawa H, Kato H, Maejima K, Sasagawa S, Nakano K, et al. Whole genome sequencing analysis identifies recurrent structural alterations in esophageal squamous cell carcinoma. PeerJ. 2020;8:e9294. [DOI] [PMC free article] [PubMed] [Google Scholar]
- 20.Sawada G, Niida A, Uchi R, Hirata H, Shimamura T, Suzuki Y, et al. Genomic landscape of esophageal squamous cell carcinoma in a Japanese population. Gastroenterology. 2016;150:1171–82. [DOI] [PubMed] [Google Scholar]
- 21.Honoré N, van Marcke C, Galot R, Helaers R, Ambroise J, van Maanen A, et al. Tumor-agnostic plasma assay for circulating tumor DNA detects minimal residual disease and predicts outcome in locally advanced squamous cell carcinoma of the head and neck. Ann Oncol. 2023;34:1175–86. [DOI] [PubMed] [Google Scholar]
- 22.Abbosh C, Birkbak NJ, Wilson GA, Jamal-Hanjani M, Constantin T, Salari R, et al. Phylogenetic ctDNA analysis depicts early-stage lung cancer evolution. Nature. 2017;545:446–51. [DOI] [PMC free article] [PubMed] [Google Scholar]
- 23.Tie J, Cohen JD, Lahouel K, Lo SN, Wang Y, Kosmider S, et al. Circulating tumor DNA analysis guiding adjuvant therapy in Stage II colon cancer. N Engl J Med. 2022;386:2261–72. [DOI] [PMC free article] [PubMed] [Google Scholar]
- 24.Murtaza M, Dawson SJ, Tsui DWY, Gale D, Forshew T, Piskorz AM, et al. Noninvasive analysis of acquired resistance to cancer therapy by sequencing of plasma DNA. Nature. 2013;497:108–12. [DOI] [PubMed] [Google Scholar]
- 25.Kato K, Machida R, Ito Y, Daiko H, Ozawa S, Ogata T, et al. Doublet chemotherapy, triplet chemotherapy, or doublet chemotherapy combined with radiotherapy as neoadjuvant treatment for locally advanced oesophageal cancer (JCOG1109 NExT): A randomised, controlled, open-label, phase 3 trial. Lancet. 2024;404:55–66. [DOI] [PubMed] [Google Scholar]
- 26.ENCODE Project Consortium. An integrated encyclopedia of DNA elements in the human genome. Nature. 2012;489:57–74. [DOI] [PMC free article] [PubMed] [Google Scholar]
- 27.Elliott K, Larsson E. Non-coding driver mutations in human cancer. Nat Rev Cancer. 2021;21:500–9. [DOI] [PubMed] [Google Scholar]
- 28.Huang FW, Hodis E, Xu MJ, Kryukov GV, Chin L, Garraway LA. Highly recurrent TERT promoter mutations in human melanoma. Science. 2013;339:957–9. [DOI] [PMC free article] [PubMed] [Google Scholar]
- 29.Vinagre J, Almeida A, Pópulo H, Batista R, Lyra J, Pinto V, et al. Frequency of TERT promoter mutations in human cancers. Nat Commun. 2013;4:2185. [DOI] [PubMed] [Google Scholar]
- 30.Sobesky S, Mammadova L, Cirillo M, Drees EEE, Mattlener J, Dörr H, et al. In-depth cell-free DNA sequencing reveals genomic landscape of Hodgkin’s lymphoma and facilitates ultrasensitive residual disease detection. Med. 2021;2:1171–1193.e11. [DOI] [PubMed] [Google Scholar]
Associated Data
This section collects any data citations, data availability statements, or supplementary materials included in this article.
Supplementary Materials
Data Availability Statement
All relevant data used to conduct the analyses are available within the article. To protect the privacy and confidentiality of patients in this study, clinical data are not made publicly available in a repository or the supplementary material of the article but can be requested at any time from the corresponding author. Any requests will be reviewed within a time frame of 2–3 weeks by the authors to verify whether the request is subject to any intellectual property or confidentiality obligations. All data shared will be de-identified.
The R scripts used for data analysis and figure generation in this study are available from the corresponding author upon reasonable request.