Abstract
Climate change is expected to alter the distribution and abundance of many species. Predictions of climate-induced population extinctions are supported by geographic range shifts that correspond to climatic warming, but few extinctions have been linked mechanistically to climate change. Here we show that extinctions of two populations of a checkerspot butterfly were hastened by increasing variability in precipitation, a phenomenon predicted by global climate models. We model checkerspot populations to show that changes in precipitation amplified population fluctuations, leading to rapid extinctions. As populations of checkerspots and other species become further isolated by habitat loss, climate change is likely to cause more extinctions, threatening both species diversity and critical ecosystem services.
Climate change at global and regional scales is predicted to alter species distributions, life histories, community composition, and ecosystem function (1–5). In particular, population losses caused by climate change threaten both species diversity and the delivery of critical ecosystem services (6). Predictions of climate-induced population extinctions are supported by correlational evidence that numerous species are shifting their ranges in response to climatic warming (7–11). Nevertheless, few mechanistic studies have linked extinctions to recent climate change (12, 13). Furthermore, most climate change research and forecasts focus on shifts in climatic means. Global climate models also predict changes in climatic variability (14, 15), but biotic impacts of those increases have received less study. Here, we report that extinctions of two populations of the checkerspot butterfly, Euphydryas editha bayensis, were caused by a combination of habitat loss and regional climate change in the form of increasing variability in precipitation.
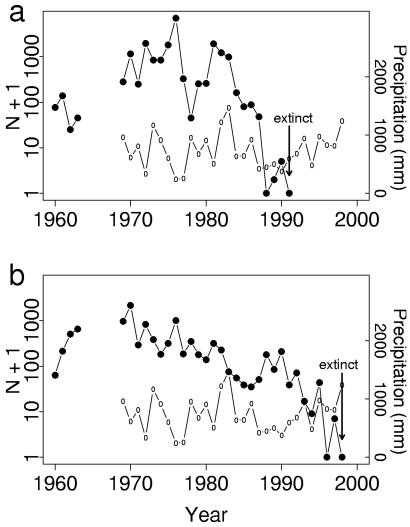
The Bay checkerspot butterfly, Euphydryas editha bayensis, is a univoltine butterfly inhabiting patches of native grassland in the San Francisco Bay Area in California. The subspecies was listed as threatened under the United States Federal Endangered Species Act in 1987. Populations at the Jasper Ridge Biological Preserve, Stanford University (San Mateo County, CA) have been studied since 1960 (16, 17) and fluctuated over 4 orders of magnitude before going extinct (refs. 18 and 19; J.J.H., S. B. Weiss, J.F.M., C.L.B., P.R.E., A. E. Launer, and D. D. Murphy, unpublished work) (Fig. 1). The two habitat patches with longest occupancy at Jasper Ridge share common management histories, plant species, and climates (20). They differ primarily in size and topography. The larger patch (9.80 hectares; area C, JRC) is nearly flat, and the smaller patch (2.55 hectares; area H, JRH) is topographically heterogeneous. Although areas C and H are only 500 m apart, dispersal between them was low, averaging less than 2% of recaptured adults (16). These populations also were isolated: the only other suitable habitat at Jasper Ridge has been unoccupied since 1973 (ref. 18; J.J.H., S. B. Weiss, J.F.M., C.L.B., P.R.E., A. E. Launer, and D. D. Murphy, unpublished work), and the distance to the nearest habitat outside Jasper Ridge exceeds the documented dispersal ability of the butterfly (21).
Figure 1.
Population estimates for Jasper Ridge Euphydryas editha bayensis adult males, derived from daily mark-recapture data (J.J.H., S. B. Weiss, J.F.M., C.L.B., P.R.E., A. E. Launer, and D. D. Murphy, unpublished work) from 1960 to 1998. Mark-recapture data are incomplete or unavailable for 1964–1968. To show extinctions on a logarithmic scale, values plotted are Nt + 1. Arrows point to population extinctions. Also shown are data on growing season precipitation (October–April), recorded at Woodside Fire Station, California, from 1969 to 1998. ●, Population estimates; ○, precipitation data. (a) JRC; extinction occurred in 1991. (b) JRH; extinction occurred in 1998.
Mechanisms of weather-induced changes in E. e. bayensis populations are well-understood. Fluctuations in population abundance are determined by the survival of prediapause larvae, which depends on the temporal overlap of larvae and their host plants, Plantago erecta, Castilleja densiflora, and Castilleja exserta (18, 22, 23). Prediapause larvae starve unless they reach the fourth instar before host plants senesce. Weather conditions affect the phenology of both larvae and plants, with larvae tending to lose the developmental race in very wet or dry years (24, 25). Habitat topography mediates weather effects by advancing development of both plants and larvae on warm slopes and delaying development on cool slopes (26). Topographic diversity thus buffers climatic variability by supporting larval survival on some slope aspects in most weather conditions.
Weather data can be used to forecast changes in checkerspot populations. Previously, we predicted dynamical properties of the two Jasper Ridge populations from knowledge of larval responses to weather (27). We tested those predictions with nonlinear models of population responses to precipitation that were fitted to adult abundance data. Results showed that effects of weather account for the contrasting dynamics in the two populations. The population in JRC varied more widely, went extinct first, and fluctuated strongly with annual growing season precipitation. Dynamics of the population in JRH were more complex, containing damped oscillations and weaker influences of precipitation.
Sensitivity to weather makes E. e. bayensis populations vulnerable to climate change. In principle, two kinds of climate change could cause extinctions in E. e. bayensis populations by disrupting phenological overlap of larvae and host plants. First, long-term trends in climatic means could reduce overlap by hastening plant senescence or by shifting plant and larval phenologies relative to each other (18, 22). Second, increased climatic variability could increase variability in overlap, inducing greater population fluctuations and eventual extinction. Changes in both temperature and precipitation are expected to affect E. e. bayensis populations, but here we focus on precipitation because its effect on population processes is better understood.
Methods
Precipitation Variability.
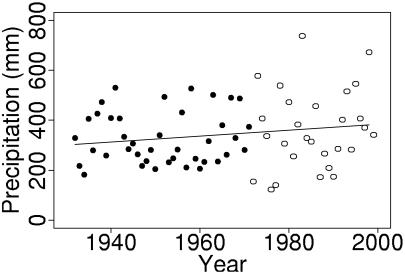
Precipitation data from San Jose, California (28 km from Jasper Ridge), are the longest climate data set available in the region. They contain an apparent increase in variability after 1971 (Fig. 2). We evaluated changes in the variability of annual growing season precipitation by examining variance within a moving 20-year window and by comparing the variance before and after 1971. Because they are a time series, San Jose precipitation data do not satisfy assumptions of independence required by tests for homogeneity of variances. We avoided this problem by calculating bootstrapped estimates of precipitation variance, using 200 bootstrapped samples for each estimate (28).
Figure 2.
Precipitation at San Jose. The points are growing season (October–April) precipitation, recorded during 1932–1998 and archived at the National Climatic Data Center, http://www.ncdc.noaa.gov/ol/climate/stationlocator.html. Data before and after 1971 are plotted with different symbols: ●, 1932–1971; ○, 1972–1998. The solid line is the least squares linear trend; slope = 1.18 mm/year, P = 0.15.
Population Simulations.
Simulations applied a mixed endogenous/exogenous model (27), Nt = f(Nt−1, Wt−1), where Nt is adult abundance in year t, and Wt−1 is precipitation in year t−1 (Fig. 1). Model selection and fitting used response surface methodology (29, 30), which predicts population size from generalized polynomial regression of transformed predictor variables. Variable transformations included the Box–Cox family of power transformations. Model selection was conducted by using ordinary cross-validation to minimize one-step prediction error (27). Models were fitted to abundance data for adult males (J.J.H., S. B. Weiss, J.F.M., C.L.B., P.R.E., A. E. Launer, and D. D. Murphy, unpublished work) (Fig. 1) from 1969 until the first zero abundance recorded for each population (1988 for JRC, 1996 for JRH). We used male data because they provide more accurate population estimates than female data (31). Model prediction accuracy was 0.58 and 0.47 for JRC and JRH, respectively (values are the prediction coefficient of determination, which equals 1 for perfect prediction), which is high for population models containing few variables (30).
To simulate population trajectories, the model required precipitation data and a starting population size as inputs. Simulations were run with two kinds of precipitation data: (i) the precipitation time series recorded at San Jose from 1932 to 1998 (Fig. 2), and (ii) bootstrapped samples drawn from San Jose data before and after 1971. Because the models were fitted by using local precipitation data (recorded at Woodside Fire Station, adjacent to Jasper Ridge), we adjusted San Jose precipitation data before simulations by using linear regression between San Jose and Woodside data (n = 30, r2 = 0.884). Simulations using the San Jose precipitation time series were run to extinction (n < 1), starting from a range of plausible values: N1932 = 500, 1,000, 2,000, or 5,000 for JRC; N1932 = 200, 500, 1,000, or 2,000 for JRH. Simulations using bootstrapped precipitation data were started at N0 = 1,000. Simulations were run with each of 1,000 bootstrapped samples drawn from the period 1932–1970 (pre-1971) and the period from 1972 until the year in which each population went extinct (post-1971). Qualitatively similar simulation results (data not shown) were obtained by using bootstrapped precipitation data from other relevant time intervals, e.g., the first 20 years of the San Jose data set (1932–1951) versus the last 20 years before JRH extinction (1979–1998).
Results
Precipitation Variability.
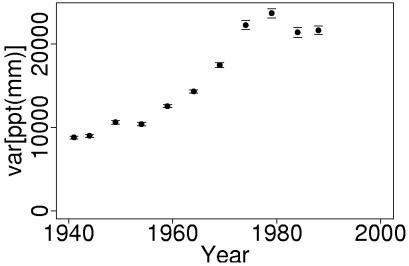
Precipitation data from San Jose show an increasing frequency of extremely wet and dry years (Fig. 2). Interannual variance in growing season precipitation, derived from bootstrapped estimates within a moving 20-year window, increased over the last 70 years (Fig. 3). This increase was significant by the time of JRC extinction (Bartlett's test, Bc = 4.81, P = 0.0251). Significant differences also exist between bootstrapped estimates of variance for all pre-1971 (1932–1970) data vs. all post-1971 (1972–1998) data (Bartlett's test, Bc = 6.075, P = 0.0137).
Figure 3.
Variance in annual growing season precipitation at San Jose. Variance was estimated from bootstrapped samples, as described in Methods. Points are the mean (±1 SE) of the variance in each of 200 bootstrapped samples drawn from a moving 20-year window. Points are plotted at the 10th year of each 20-year window.
Annual precipitation also appears to be increasing, but the data do not contain a significant trend in the mean. Nevertheless, variance in San Jose precipitation data would be expected to rise with an apparent increase in the mean, because means and variances are correlated. The coefficient of variation in precipitation data differed significantly between pre-1971 and post-1971 intervals (Lewontin's test: F26,38 = 2.39, P = 0.0143), implying that the increase in precipitation variability was more than an artifact of an increasing mean.
Population Simulations.
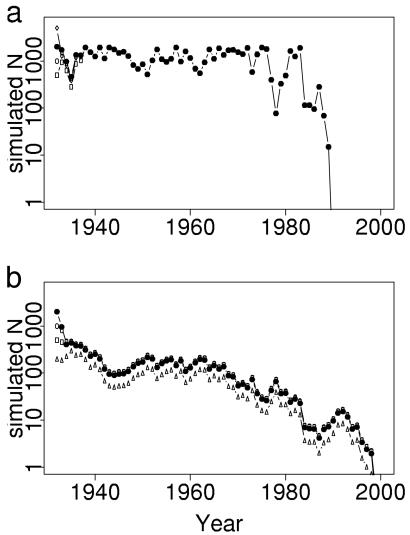
Given the relationship between weather and E. e. bayensis populations, we predicted that the amplitude of population fluctuations at Jasper Ridge would increase with precipitation variability. These fluctuations would hasten extinction. We tested this prediction by simulating butterfly population trajectories by using San Jose precipitation data and the models for Jasper Ridge population dynamics mentioned above (see Methods). Simulated trajectories for JRC fluctuated with small amplitude until recent decades, when fluctuations became large (Fig. 4a). Simulated populations for JRH declined in response to increased precipitation variance (Fig. 4b). For both populations, simulated extinctions occurred within 1 year of observed extirpations (Fig. 1). These simulation results confirm the prediction that greater climatic variability would increase population fluctuations, leading to extinction.
Figure 4.
Simulated trajectories for Jasper Ridge E. e. bayensis populations. Simulations used mixed endogenous/exogenous models for each population and the 1932–1998 adjusted San Jose precipitation time series. Results are shown for several starting population sizes, N1932: ▵, 200; □, 500; ○, 1,000; ●, 2,000; ⋄, 5,000. (a) JRC. (b) JRH.
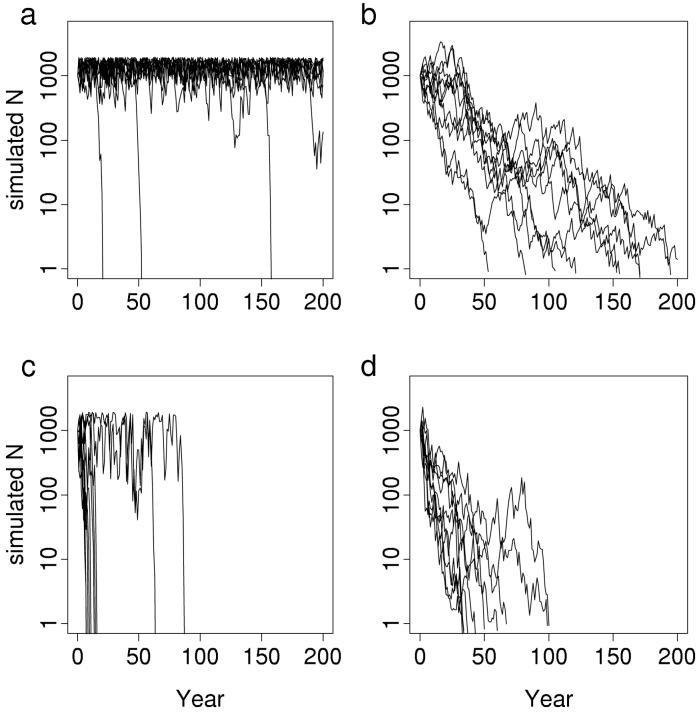
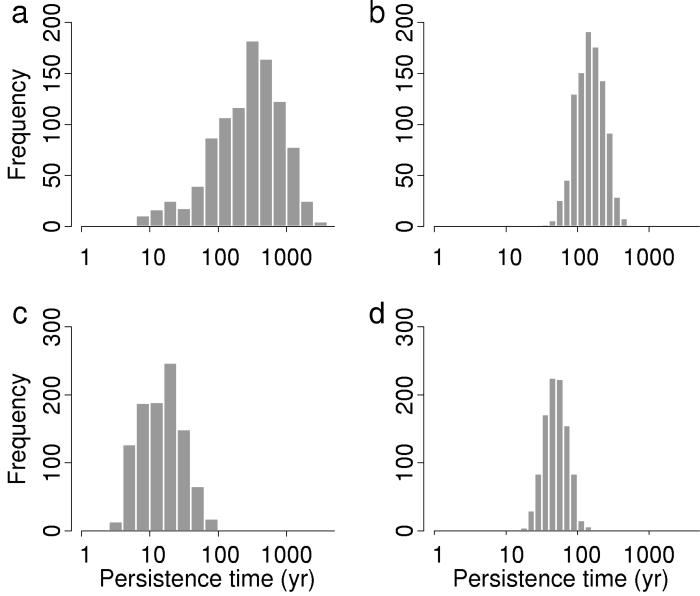
Further simulations using bootstrapped precipitation data showed that the extinctions were caused by climate change, rather than a particular unlucky sequence of weather events. Simulated extinctions using bootstrapped samples of post-1971 data were rapid for both populations (Figs. 5 and 6), with mean persistence times of 19.2 years for JRC and 51.9 years for JRH. Simulations using pre-1971 data persisted much longer, with means of 443.8 years and 162.4 years for JRC and JRH, respectively (Fig. 6). These differences in pre-1971 vs. post-1971 persistence times were significant for both populations (two-sample t test on log-transformed results: P ≈ 0). With pre-1971 data, JRC simulations persisted longer on average than JRH simulations, but this order reversed with post-1971 data. This reversal is consistent with earlier reports that topographic diversity buffers climatic variability (26, 27). JRC was larger under moderate weather, but JRH was less vulnerable to extreme weather because of greater topographic diversity in area H.
Figure 5.
Population simulations before and after climate change. Simulations were run with population-specific models and bootstrapped samples of adjusted San Jose precipitation before and after 1971 (see Methods). One thousand simulations were run for each combination of population and time interval (Fig. 6), but only the first 10 simulations for each combination are shown here. (a) JRC simulations using bootstrapped samples from 1932–1970 precipitation data. (b) JRH simulations using bootstrapped samples from 1932–1970 precipitation data. (c) JRC simulations with 1972–1991 precipitation data. (d) JRH simulations with 1972–1998 precipitation data.
Figure 6.
Distributions of population persistence times, simulated before and after climate change. Simulations for each population were run using 1,000 bootstrapped samples of adjusted San Jose precipitation before and after 1971 (see Methods). (a) JRC simulations using samples from 1932–1970 precipitation data. (b) JRH simulations using samples from 1932–1970 precipitation data. (c) JRC simulations with samples from 1972–1991 precipitation data. (d) JRH simulations with samples from 1972–1998 precipitation data.
Discussion
Climatic data from San Jose show that precipitation variability increased recently in central California. It is not known whether anthropogenic changes in the atmosphere caused the rising variance in San Jose precipitation, but the increase is consistent with global warming scenarios predicted by global climate models (14, 15, 32). Our results demonstrate that increased precipitation variability likely caused extinctions of two well-studied butterfly populations. It is likely that extremes in annual precipitation reduced the temporal overlap of larvae and plants, which increased larval mortality and the magnitude of population fluctuations. Increasing frequency and severity of weather probably drove both populations extinct within three decades.
Available information contradicts alternative hypotheses for the extinctions at Jasper Ridge, including plant declines, natural predators, and research impacts (J.J.H., S. B. Weiss, J.F.M., P.R.E., D. D. Murphy, and A. E. Launer, unpublished data). Butterfly abundance (JRC) was poorly correlated with larval host plant cover (Pearson's r = −0.19, P = 0.76). Mortality from insect parasitoids was low (33). Research impacts, such as destructive sampling and habitat trampling, were small relative to weather-induced mortality (17).
Although impacts of recent climate changes were severe, E. e. bayensis populations must have persisted through historical climate regimes that exceeded the variability in recent San Jose precipitation data (34). We suggest that a formerly extensive habitat distribution before the introduction of Eurasian grasses would have assured persistence under high climatic variability. Historical populations almost certainly occupied native grasslands once found on nonserpentine areas, where growing seasons are longer and soils are deeper. Larval mortality in these populations may have been reduced by later senescence of larval host plants. Historical populations also may have tracked favorable conditions across heterogeneous topography in large habitat areas. If local extinctions did occur, populations may have been reestablished by individuals from adjacent habitats. All of these persistence mechanisms were eliminated by habitat loss from plant invasions and urban development associated with human population growth. These factors reduced the butterfly to a small number of isolated populations (20) that face inevitable stochastic extinction (35–38). Climate change hastened losses of these populations.
Many future extinctions are likely to result from interacting agents of global change. Habitat loss and fragmentation currently affect most species, and they are projected to increase with continued human population growth (39, 40). Climate change forecasts also warn of growing extinction risks caused by shifts in the abiotic environment (2, 3, 11, 40–42). These and other threats often are considered in isolation (but see ref. 40), but our results imply that checkerspot extinctions were caused by interactions among these factors. When distributions become insular because of habitat loss, populations become more vulnerable to climate change and other threats. Extinctions caused by such interaction between habitat loss and climate change are particularly likely in species, like this checkerspot, with limited dispersal ability (11). As the domains of interacting factors increasingly overlap, they are likely to cause extinctions in many other taxa.
Acknowledgments
We thank M. Doebeli, I. Hanski, P. Homann, D. Inouye, J. Liu, G. Luck, T. Root, and S. Schneider for helpful comments. J. Schwan assisted with data entry. J.F.M. was supported in part by a grant from the Bureau for Faculty Research at Western Washington University. J.J.H. was supported by the National Science Foundation and the Center for International Security and Cooperation at Stanford University. Much of the early work on this system was supported by National Science Foundation grants (to P.R.E.).
Abbreviations
- JRC
Jasper Ridge area C
- JRH
Jasper Ridge area H
References
- 1.Gates D M. Climate Change and Its Biological Consequences. Sunderland, MA: Sinauer; 1993. [Google Scholar]
- 2.Graham R W, Grimm E C. Trends Ecol Evol. 1990;5:289–292. doi: 10.1016/0169-5347(90)90083-P. [DOI] [PubMed] [Google Scholar]
- 3.McCarty J P. Cons Biol. 2001;15:320–331. [Google Scholar]
- 4.Hughes L. Trends Ecol Evol. 2000;15:56–61. doi: 10.1016/s0169-5347(99)01764-4. [DOI] [PubMed] [Google Scholar]
- 5.Kappelle M, Vuuren M M I V, Baas P. Biodiv Cons. 1999;8:1383–1397. [Google Scholar]
- 6.Hughes J B, Daily G C, Ehrlich P R. Science. 1997;278:689–692. doi: 10.1126/science.278.5338.689. [DOI] [PubMed] [Google Scholar]
- 7.Hill J K, Thomas C D, Huntley B. Proc R Soc London B. 1999;266:1197–1206. [Google Scholar]
- 8.Parmesan C. Nature (London) 1996;382:765–766. [Google Scholar]
- 9.Parmesan C, Ryrholm N, Stefanescu C, Hill J K, Thomas C D, Descimon H, Huntley B, Kaila L, Kullberg J, Tammaru T, et al. Nature (London) 1999;399:579–583. [Google Scholar]
- 10.Thomas C D, Lennon J J. Nature (London) 1999;399:213. [Google Scholar]
- 11.Warren M S, Hill J K, Thomas J A, Asher J, Fox R, Huntley B, Roy D B, Telfer M G, Jeffcoate S, Harding P, et al. Nature (London) 2001;414:65–69. doi: 10.1038/35102054. [DOI] [PubMed] [Google Scholar]
- 12.Hoegh-Guldberg O. Mar Freshwater Res. 1999;50:839–866. [Google Scholar]
- 13.Pounds J A, Fogden M P L, Campbell J H. Nature (London) 1999;398:611–615. [Google Scholar]
- 14.Karl T R, Knight R W, Plummer N. Nature (London) 1995;377:217–220. [Google Scholar]
- 15.Houghton J J, Ding Y, Griggs D J, Noguer M, van der Linden P J, Xiaosu D, editors. Climate Change 2001: The Scientific Basis. 2002. , Contribution of Working Group I to the Third Assessment Report of the Intergovernmental Panel on Climate Change (Cambridge Univ. Press, Cambridge, U.K.). [Google Scholar]
- 16.Ehrlich P R, White R R, Singer M C, McKechnie S W, Gilbert L E. Science. 1975;188:221–228. doi: 10.1126/science.1118723. [DOI] [PubMed] [Google Scholar]
- 17.Harrison S, Quinn J F, Baughman J F, Murphy D D, Ehrlich P R. Am Nat. 1991;137:227–243. [Google Scholar]
- 18.Hellmann J J. Ph.D. dissertation. Stanford, CA: Stanford Univ.; 2000. [Google Scholar]
- 19.McGarrahan E. Science. 1997;275:479–480. [Google Scholar]
- 20.Ehrlich P R, Murphy D D. Cons Biol. 1987;1:122–133. [Google Scholar]
- 21.Harrision S. Ecology. 1989;70:1236–1243. [Google Scholar]
- 22.Singer M C. Science. 1972;173:75–77. doi: 10.1126/science.176.4030.75. [DOI] [PubMed] [Google Scholar]
- 23.Cushman J H, Boggs C L, Weiss S B, Murphy D D, Harvey A W, Ehrlich P R. Oecologia. 1994;99:194–200. doi: 10.1007/BF00317101. [DOI] [PubMed] [Google Scholar]
- 24.Ehrlich P R, Murphy D D, Singer M C, Sherwood C B, White R R, Brown I L. Oecologia. 1980;46:101–105. doi: 10.1007/BF00346973. [DOI] [PubMed] [Google Scholar]
- 25.Dobkin D S, Oliviera I, Ehrlich P R. Oecologia. 1987;71:161–166. doi: 10.1007/BF00377280. [DOI] [PubMed] [Google Scholar]
- 26.Weiss S B, Murphy D D, White R R. Ecology. 1988;69:1486–1496. [Google Scholar]
- 27. McLaughlin, J. F., Hellmann, J. J., Boggs, C. L. & Ehrlich, P. R. (2002) Oecologia, in press. [DOI] [PubMed]
- 28.Efron B, Tibshirani R J. An Introduction to the Bootstrap. Boca Raton, FL: Chapman & Hall/CRC; 1993. [Google Scholar]
- 29.Box G E P, Draper N R. Empirical Model-Building and Response Surfaces. New York: Wiley; 1987. [Google Scholar]
- 30.Turchin P. Res Popul Ecol. 1996;38:121–132. [Google Scholar]
- 31.Ehrlich P R, Launer A E, Murphy D D. Am Nat. 1984;124:527–539. [Google Scholar]
- 32.Schneider S J, Root T L. Biodiv Cons. 1996;5:1109–1119. [Google Scholar]
- 33.White R R. J Res Lep. 1986;25:52–62. [Google Scholar]
- 34.Stine S. Nature (London) 1994;369:546–549. [Google Scholar]
- 35.Gurney W S C, Nisbet R M. Am Nat. 1978;112:1075–1090. [Google Scholar]
- 36.Thomas C D. Cons Biol. 1994;8:373–378. [Google Scholar]
- 37.Hanski I, Foley P, Hassell M P. J Anim Ecol. 1996;65:274–282. [Google Scholar]
- 38.Hanski I, Ovaskainen O. Nature (London) 2000;404:755–758. doi: 10.1038/35008063. [DOI] [PubMed] [Google Scholar]
- 39.Dobson A P, Bradshaw A D, Baker A J M. Science. 1997;277:515–522. [Google Scholar]
- 40.Sala O E, Chapin F S, III, Armesto J J, Berlow E, Bloomfield J, Dirzo R, Huber-Sanwald E, Huenneke L F, Jackson R B, Kinzig A, et al. Science. 2000;287:1770–1774. doi: 10.1126/science.287.5459.1770. [DOI] [PubMed] [Google Scholar]
- 41.Easterling D R, Meehl G A, Parmesan C, Chagnon S A, Karl T R, Mearns L O. Science. 2000;289:2068–2074. doi: 10.1126/science.289.5487.2068. [DOI] [PubMed] [Google Scholar]
- 42.Parmesan C, Root T L, Willig M R. Bull Am Meterol Soc. 2000;81:443–450. [Google Scholar]


