

Abstract
Aims:
While intentional weight loss achieved through cardiometabolic medications has been associated with robust salutary effects in heart failure (HF) with preserved ejection fraction (HFpEF), the clinical significance of unintentional weight loss in this setting remains unclear.
Methods and results:
This retrospective cohort study included 434 overweight or obese patients with invasively proven HFpEF (67±11 years, 236 female), without weight-reducing therapies or known malignancy. The annualized weight change for tertiles was: −21.1 to −1.8 kg/year (tertile 1); −1.8 to 0 kg/year (tertile 2); and 0 to +17.0 kg/year (tertile 3). Patients in tertile 1 had subtle abnormalities in ventilatory control at baseline, but there were no other statistically significant differences between groups across a vast array of hemodynamic and metabolic parameters at rest or during exercise. Baseline weight was directly correlated with right and left heart filling pressures (r=0.23–0.34, P<0.001), but annualized weight change showed no correlation with any baseline hemodynamic measurements (All P>0.05). Over a median follow-up of 4.7 years (IQR 2.3–6.5), patients in tertile 1 had higher risk of all-cause death (HR 3.36 [95% CI 1.77–6.39], P<0.001), all-cause death or HF hospitalization (HR 2.49 [95% CI 1.53–4.04], P<0.001) and cardiac death or HF hospitalization (HR 2.28 [95% CI 1.28–4.07], P=0.005) compared with those in tertile 2 or 3. These findings were consistent after multivariable adjustment.
Conclusions:
Unintentional weight loss is associated with worse prognosis in patients with HFpEF and overweight or obesity, even as hemodynamics, exercise capacity, and gas exchange are not different from patients with stable or increasing weight. These data underline important and fundamental differences between therapeutic and unintended weight loss in HFpEF.
Keywords: weight loss, heart failure with preserved ejection fraction, prognosis
Graphical Abstract

Clinical significance of unintentional weight loss in heart failure with preserved ejection fraction. HFpEF, heart failure with preserved ejection fraction; BMI, body mass index; PAWP, pulmonary artery wedge pressure; HR, hazard ratio; CI, confidence interval.
Introduction
The majority of patients with heart failure (HF) and preserved ejection fraction (HFpEF) are living with overweight or obesity, and cardiometabolic drugs that cause therapeutic weight loss reduce symptom severity, improve hemodynamics and cardiorenal function, and decrease risk for HF events.1–7 Conversely, unintentional weight loss in the setting of HF has been associated with sarcopenia and/or cachexia,8 and linked to increased morbidity and mortality. However, available evidence comes from patients with HF with reduced EF,9,10 and very little is known regarding the impact of unintentional weight loss in HFpEF, which may differ owing to the greater cardiometabolic perturbations present compared with HFrEF, and the less substantial pump dysfunction and cardiac remodeling observed in HFpEF compared with HFrEF. To fill this gap, we compared cardiac hemodynamics, expired gas data, and clinical outcomes in relation to longitudinal changes in body weight in the absence of weight-reducing therapies or known malignancy among a cohort of overweight or obese patients with HFpEF undergoing invasive hemodynamic testing.
Methods
This is a retrospective cohort study. The study was approved by the Mayo Clinic Institutional Review Board, and all participants provided consent for their data to be used in research. Patients who underwent catheterization at Mayo Clinic for evaluation of unexplained exertional dyspnea were assessed. Of these patients, we identified consecutive adult patients with normal left ventricular (LV) ejection fraction (EF, ≥50%) who underwent simultaneous invasive hemodynamic assessment and expired gas analysis both at rest and during exercise between 2009 and 2022. Patients with pre-capillary pulmonary hypertension (defined as mean pulmonary artery pressure [PAP] >20 mmHg, pulmonary artery wedge pressure [PAWP] <15 mmHg, and pulmonary vascular resistance [PVR] >2 wood units at rest with no evidence of HFpEF on exercise [PAWP at exercise <25 mmHg]), cardiomyopathy, constrictive pericarditis, cardiac amyloidosis, congenital shunt disease, significant valvular heart disease (greater than moderate left-sided regurgitation, greater than mild stenosis), prior mitral valve replacement, high-output HF, unstable coronary artery disease, primary right HF, prior episode of HF with reduced EF or HF with mildly reduced EF, significant lung disease, or end stage renal disease on dialysis were excluded (online supplementary Figure S1). Patients with invasively proven HFpEF (rest or exercise PAWP ≥15 or ≥25 mmHg, respectively) were evaluated. Longitudinal weight change was assessed using measurements at the time of cardiac catheterization and last clinical follow-up. Patients with normal weight or underweight (body mass index [BMI] <25 kg/m2), those who underwent pharmacological or non-pharmacological treatments for weight control, and those with known malignancies at baseline or during the follow-up period were also excluded (online supplementary Figure S1). Annualized weight change was calculated by subtracting the baseline weight from the last follow-up weight and dividing the difference by years between the measurements. To prevent the artificial increase in annualized weight change due to a small denominator, only patients whose last recorded weight measurement was ≥6 months after catheterization were included. Patients were then categorized into tertiles of annualized weight change.
Comparisons among the groups were analyzed using chi-square, ANOVA, or the Kruskal-Wallis test. Pearson’s correlation analysis was used to assess the associations of baseline weight and annualized weight change with key hemodynamic measurements. Discriminative performance for variables to distinguish those with future weight loss was evaluated using logistic regression. Clinical endpoints were defined as follows: i) all-cause death, ii) composite of all-cause death or HF hospitalization, and iii) composite of cardiac death (sudden cardiac death, death resulting from acute myocardial infarction, or death due to HF) or HF hospitalization. Mortality information was collected from medical records, death certificates, obituaries, and death notices in local newspapers. Comprehensive death data were also retrieved annually from the State of Minnesota. Hospitalizations due to HF were identified using the Mayo Clinic electronic medical records and adjudicated by multiple cardiologists (T.I., T.H., S.D., and A.T.), while cardiac deaths were adjudicated by a single cardiologist (T.I.). Survival analyses were performed using Cox regression model and Kaplan-Meier curves with/without baseline adjustment using propensity score matching. The non-linear continuous relationship between annualized weight change and outcome was assessed using a Cox model. A two-sided P-value of <0.05 was considered statistically significant. Statistical analyses were performed using JMP17.0 and SAS9.4 (SAS Institute Inc., Cary, NC, USA).
Results
Of 434 patients with HFpEF, 27.9% were overweight, and 72.1% were obese at the time of index evaluation. The annualized weight change for the 3 tertiles was: −21.1 to −1.8 kg/year (tertile 1); −1.8 to 0 kg/year (tertile 2); and 0 to +17.0 kg/year (tertile 3). Patients in tertile 1 were slightly older (68.1±10.1 vs 67.8±10.2 vs 64.1±12.2 years, P=0.007) and had higher BMI at index evaluation (35.8±7.0 vs 34.2±6.0 vs 33.0±6.2 kg/m2, P<0.001) (Table 1). No significant differences were observed for sex (female 51% vs 55% vs 57%, P=0.52), comorbidities including diabetes, chronic kidney disease, inflammatory disease, and thyroid disease, medication use, NT-proBNP (215 [65–656] vs 226 [66–608] vs 173 [69–493] pg/mL, P=0.95), or echocardiographic findings. Although there were no statistically significant differences in baseline NYHA functional class among the three tertiles (P=0.51), there was a trend toward a higher proportion of patients with more severe symptoms in tertile 1 (Table 1). Similarly, at follow-up, no statistically significant differences in NYHA functional class were observed among the groups (P=0.13), but tertile 1 continued to show a tendency toward a greater number of patients with severe symptoms. Regarding changes in NYHA functional class, patients in tertile 1 showed a trend toward more frequent deterioration and less improvement compared with those in tertiles 2 and 3, although these differences did not reach statistical significance (P=0.29). When comparing NYHA functional class between tertile 1 and the combined group of tertiles 2 and 3, a significant difference was observed at follow-up: patients in tertile 1 had a higher proportion of NYHA class III or IV and a lower proportion of NYHA class I (P=0.04) (online supplementary Figure S2). Tertile 1 showed a higher proportion of deterioration and a lower proportion of improvement in NYHA functional class, while the difference between the groups did not show statistical significance (P=0.21).
Table 1.
Baseline demographic and clinical characteristics.
| Tertile 1 (<−1.8 kg/year) (n = 144) | Tertile 2 (−1.8 to 0 kg/year) (n = 145) | Tertile 3 (>0 kg/year) (n = 145) | P value | |
|---|---|---|---|---|
| Age (years) | 68.1 ± 10.1 | 67.8 ± 10.2 | 64.1 ± 12.2 | 0.007 |
| Women, n (%) | 73 (50.7%) | 80 (55.2%) | 83 (57.2%) | 0.52 |
| Body mass index at baseline (kg/m2) | 35.8 ± 7.0 | 34.2 ± 6.0 | 33.0 ± 6.2 | <0.001 |
| Body mass index category at baseline, n (%) | ||||
| Overweight | 31 (21.5%) | 39 (26.9%) | 51 (35.2%) | 0.02 |
| Obesity class 1 | 42 (29.2%) | 51 (35.2%) | 53 (36.6%) | |
| Obesity class 2 | 38 (26.4%) | 28 (19.3%) | 23 (15.9%) | |
| Obesity class 3 | 33 (22.9%) | 27 (18.6%) | 18 (12.4%) | |
| Body mass index at follow-up (kg/m2) | 31.2 ± 6.6 | 33.0 ± 6.1 | 35.1 ± 6.8 | <0.001 |
| Body mass index category at follow-up, n (%) | ||||
| Underweight | 0 | 0 | 0 | <0.001 |
| Normal weight | 23 (16.0%) | 7 (4.8%) | 0 | |
| Overweight | 50 (34.7%) | 47 (32.4%) | 32 (22.1%) | |
| Obesity class 1 | 32 (22.2%) | 45 (31.0%) | 55 (37.9%) | |
| Obesity class 2 | 24 (16.7%) | 22 (15.2%) | 29 (20.0%) | |
| Obesity class 3 | 15 (10.4%) | 24 (16.6%) | 29 (20.0%) | |
| NYHA functional class at baseline, n (%) | ||||
| II | 54 (37.5%) | 58 (40.0%) | 64 (44.1%) | 0.51 |
| III or IV | 90 (62.5%) | 87 (60.0%) | 81 (55.9%) | |
| NYHA functional class at follow-up, n (%) (n = 408) | ||||
| I | 40 (29.9%) | 51 (36.7%) | 56 (41.5%) | 0.13 |
| II | 55 (41.0%) | 59 (42.5%) | 56 (41.5%) | |
| III or IV | 39 (29.1%) | 29 (20.9%) | 23 (17.0%) | |
| Change in NYHA functional class, n (%) (n = 408) | ||||
| Improvement | 74 (55.2%) | 89 (64.0%) | 84 (62.2%) | 0.29 |
| No change | 48 (35.8%) | 40 (28.8%) | 46 (34.1%) | |
| Deterioration | 12 (9.0%) | 10 (7.2%) | 5 (3.7%) | |
| Comorbidities, n (%) | ||||
| Hypertension, | 114 (79.2%) | 121 (83.5%) | 114 (78.6%) | 0.53 |
| Diabetes mellitus | 43 (29.9%) | 37 (25.5%) | 29 (20.0%) | 0.15 |
| Chronic kidney disease | 57 (39.6%) | 56 (38.6%) | 51 (35.2%) | 0.72 |
| Atrial fibrillation | 46 (31.9%) | 46 (31.7%) | 37 (25.5%) | 0.40 |
| Coronary artery disease | 47 (32.6%) | 54 (37.2%) | 36 (24.8%) | 0.07 |
| Inflammatory disease | 17 (11.8%) | 12 (8.3%) | 11 (7.6%) | 0.41 |
| Thyroid disease | ||||
| Hypothyroidism | 19 (13.2%) | 18 (12.4%) | 20 (13.8%) | 0.94 |
| Hyperthyroidism | 0 | 0 | 0 | |
| Medications | ||||
| Renin-angiotensin system blocker, n (%) | 69 (47.9%) | 74 (51.0%) | 59 (40.7%) | 0.19 |
| Beta blocker, n (%) | 72 (50.0%) | 73 (50.3%) | 59 (40.7%) | 0.17 |
| Diuretics, n (%) | 80 (55.6%) | 81 (55.9%) | 72 (49.7%) | 0.49 |
| SGLT-2 inhibitor, n (%) | 1 (0.7%) | 0 | 2 (1.4%) | 0.37 |
| Laboratories | ||||
| Hemoglobin (g/dL) | 13.2 ± 1.7 | 13.2 ± 1.5 | 13.3 ± 1.8 | 0.60 |
| eGFR (mL/min) | 63.0 ± 18.1 | 65.1 ± 18.0 | 66.1 ± 18.8 | 0.35 |
| NT-proBNP (pg/mL) (n = 409) | 215 (65, 656) | 226 (66, 608) | 173 (69, 493) | 0.95 |
| Echocardiography | ||||
| LA volume index (mL/m2) (n = 429) | 30.0 (24.5, 38.9) | 32.7 (26.0, 40.8) | 32.9 (25.3, 42.2) | 0.41 |
| LV end-diastolic diameter (mm) (n = 430) | 49.9 ± 5.6 | 49.6 ± 4.9 | 49.3 ± 4.9 | 0.42 |
| LV ejection fraction (%) | 63.3 ± 5.1 | 63.0 ± 5.5 | 63.5 ± 6.8 | 0.70 |
| E/e′ ratio (n = 432) | 12.0 (8.6, 15.7) | 12.5 (10.0, 17.5) | 11.4 (8.7, 14.9) | 0.10 |
| RV systolic pressure (mmHg) (n = 379) | 38.7 ± 13.4 | 35.6 ± 12.4 | 37.7 ± 15.3 | 0.11 |
Values are mean ± SD, median (interquartile range), or n (%).
NYHA, New York Heart Association; SGLT-2, sodium-glucose cotransporter 2; eGFR, estimated glomerular filtration rate; NT-proBNP, N-terminal-pro-B-type natriuretic peptide; LA, left atrial; LV, left ventricular; E/e′, the ratio of early mitral diastolic inflow velocity to early diastolic mitral annular velocity; RV, right ventricular.
Patients in tertile 1 had slightly more ventilatory inefficiency during exercise (minute ventilation/carbon dioxide volume slope: 34.6±8.4 vs 34.2±6.0 vs 33.1±7.6, P=0.04), indicating subtle abnormality in ventilatory control at index evaluation (Table 2), but this finding did not discriminate those in tertile 1 vs tertile 2 or 3 (c-statistic 0.53, P=0.21). Notably, there were no other statistically significant differences between groups across a vast array of hemodynamic and metabolic parameters, including pulmonary vascular pressures, right atrial pressure (RAP), cardiac index (CI), arteriovenous O2 difference, and oxygen consumption, both at rest and with exercise (Table 2). There were positive correlations between baseline body weight and cardiac filling pressures at rest and exercise, but there were no correlations between annualized weight change and any of the key hemodynamic measurements, including RAP, PAWP, mean PAP, PVR, and CI, both at rest and during exercise (all P>0.05) (Figure 1 and online supplementary Figure S3).
Table 2.
Invasive hemodynamic assessment and expired gas analysis.
| Tertile 1 (<−1.8 kg/year) (n = 144) | Tertile 2 (−1.8 to 0 kg/year) (n = 145) | Tertile 3 (>0 kg/year) (n = 145) | P value | |
|---|---|---|---|---|
| Rest | ||||
| Heart rate (bpm) | 71.9 ± 13.1 | 68.0 ± 13.0 | 70.7 ± 14.7 | 0.01 |
| Systolic blood pressure (mmHg) (n = 428) | 152.4 ± 24.1 | 151.7 ± 22.7 | 149.2 ± 22.5 | 0.47 |
| Right atrial pressure (mmHg) | 11.7 ± 4.3 | 10.8 ± 3.4 | 11.4 ± 4.8 | 0.27 |
| Mean pulmonary artery pressure (mmHg) | 28.4 ± 8.7 | 26.3 ± 7.9 | 28.0 ± 10.9 | 0.07 |
| Pulmonary artery wedge pressure (mmHg) | 18.1 ± 5.4 | 17.5 ± 4.6 | 17.5 ± 5.9 | 0.54 |
| Arteriovenous oxygen difference (mL/dL) | 4.5 ± 0.9 | 4.6 ± 0.9 | 4.5 ± 0.9 | 0.33 |
| Stroke volume (mL) | 81.4 ± 24.0 | 79.3 ± 25.8 | 77.1 ± 24.0 | 0.16 |
| Stroke volume index (mL/m2) | 37.8 ± 9.9 | 37.2 ± 10.4 | 36.9 ± 10.4 | 0.48 |
| Cardiac output (L/min) | 5.7 ± 1.7 | 5.3 ± 1.6 | 5.3 ± 1.6 | 0.02 |
| Cardiac index (L/min/m2) | 2.7 ± 0.7 | 2.5 ± 0.6 | 2.6 ± 0.7 | 0.10 |
| Pulmonary vascular resistance (WU) | 1.5 (1.0, 2.7) | 1.4 (1.0, 2.2) | 1.5 (0.9, 2.6) | 0.56 |
| Peak exercise | ||||
| Workload (Watts) | 40 (20, 60) | 50 (30, 75) | 40 (25, 80) | 0.56 |
| Heart rate (bpm) | 104.5 ± 20.7 | 101.8 ± 20.7 | 107.3 ± 24.0 | 0.10 |
| Systolic blood pressure (mmHg) (n = 399) | 186.0 ± 35.3 | 188.5 ± 29.7 | 185.9 ± 31.7 | 0.75 |
| Right atrial pressure (mmHg) (n = 393) | 22.8 ± 6.0 | 21.1 ± 6.9 | 22.0 ± 7.7 | 0.06 |
| Mean pulmonary artery pressure (mmHg) | 46.0 ± 10.2 | 43.8 ± 9.7 | 44.3 ± 12.0 | 0.06 |
| Pulmonary artery wedge pressure (mmHg) | 33.8 ± 6.4 | 32.7 ± 6.5 | 32.2 ± 7.3 | 0.05 |
| Arteriovenous oxygen difference (mL/dL) | 10.1 ± 2.0 | 10.4 ± 2.1 | 10.3 ± 2.3 | 0.44 |
| Stroke volume (mL) | 96.1 ± 27.9 | 93.8 ± 28.0 | 90.2 ± 29.9 | 0.10 |
| Stroke volume index (mL/m2) | 44.4 ± 10.9 | 44.2 ± 12.0 | 42.9 ± 12.3 | 0.36 |
| Cardiac output (L/min) | 9.9 ± 3.0 | 9.4 ± 2.9 | 9.6 ± 3.6 | 0.41 |
| Cardiac index (L/min/m2) | 4.6 ± 1.2 | 4.4 ± 1.3 | 4.6 ± 1.6 | 0.61 |
| Pulmonary vascular resistance (WU) | 1.1 (0.5, 1.8) | 1.1 (0.5, 1.7) | 1.1 (0.5, 2.0) | 0.90 |
| VO2 (mL/min) | 984 ± 339 | 969 ± 290 | 983 ± 391 | 0.93 |
| VO2 (mL/min/kg) | 9.58 ± 2.88 | 10.03 ± 3.12 | 10.45 ± 4.01 | 0.24 |
| Respiratory exchange ratio | 1.01 ± 0.11 | 1.01 ± 0.12 | 1.02 ± 0.13 | 0.85 |
| VE (L/min) | 35.0 ± 12.3 | 34.7 ± 11.8 | 33.3 ± 12.9 | 0.34 |
| VT (mL) | 1130 ± 380 | 1125 ± 355 | 1181 ± 438 | 0.78 |
| VD/VT | 0.23 ± 0.09 | 0.22 ± 0.06 | 0.21 ± 0.07 | 0.10 |
| VT/TI (mL/sec) | 1840 ± 614 | 1774 ± 606 | 1693 ± 606 | 0.12 |
| TI/TTOT | 0.32 ± 0.05 | 0.33 ± 0.05 | 0.33 ± 0.05 | 0.12 |
| VE/VCO2 slope | 34.6 ± 8.4 | 34.2 ± 6.0 | 33.1 ± 7.6 | 0.04 |
Values are mean ± SD, median (interquartile range).
WU, Wood unit; VO2, oxygen consumption volume; VE, minute ventilation; VT, tidal volume; VD, pulmonary dead space; TI, inspiratory time; TTOT, total breath duration; VCO2, carbon dioxide volume.
Figure 1.
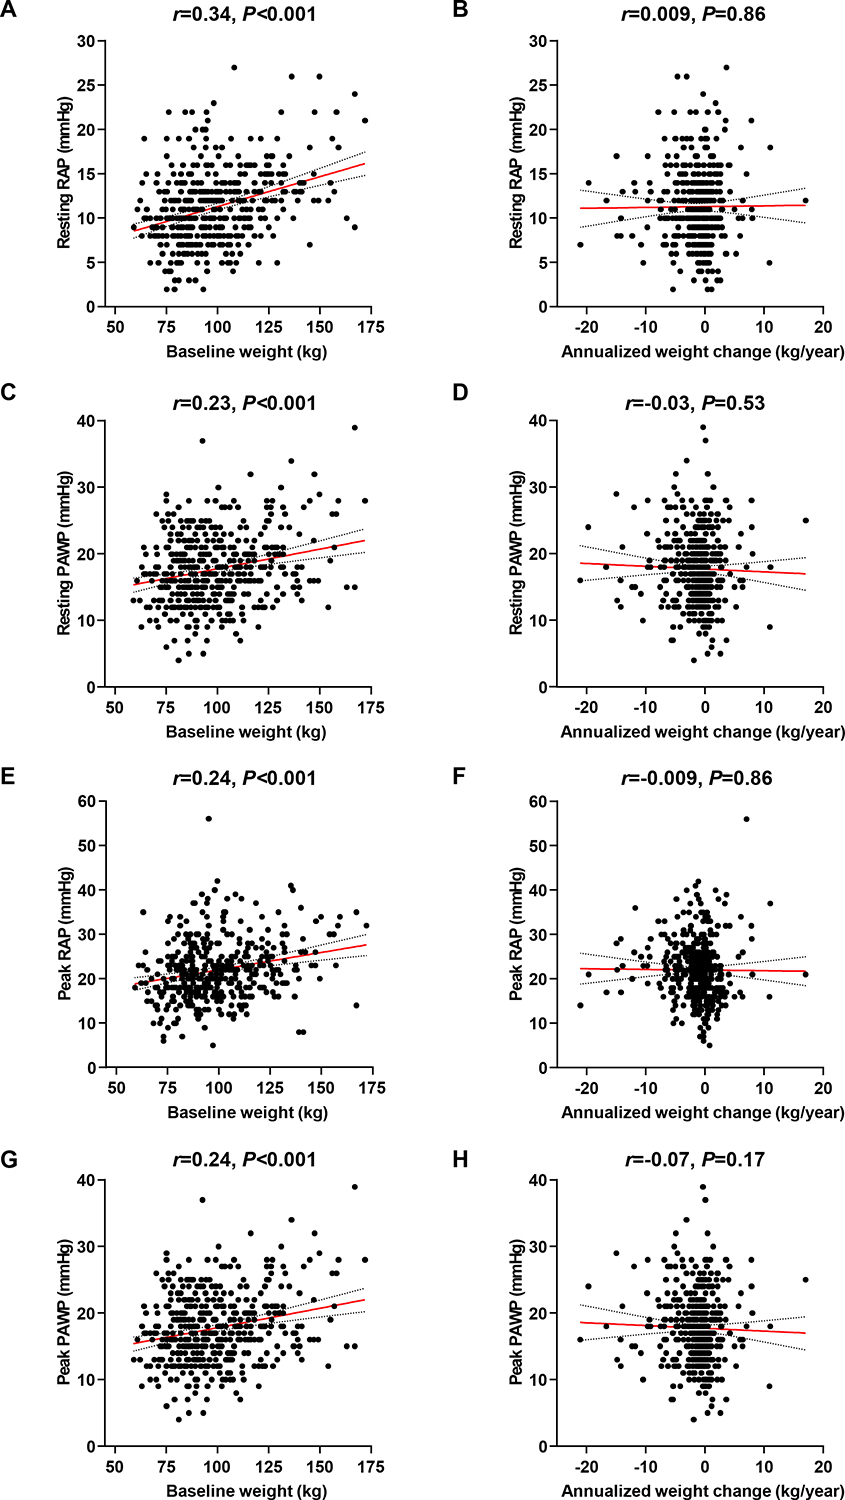
Associations of baseline weight and annualized weight change with cardiac filling pressures. Associations of baseline weight and annualized weight change with resting or peak right atrial pressure (RAP) and pulmonary artery wedge pressure (PAWP) were assessed using Pearson’s correlation analysis.
During a median follow-up period of 4.7 years (IQR 2.3–6.5), there were 38 cases of all-cause death, 7 cases of cardiac death, and 43 cases of HF hospitalization. A total of 67 patients experienced all-cause death or HF hospitalization, and 47 patients experienced cardiac death or HF hospitalization. Statistically significant differences in all-cause death, all-cause death or HF hospitalization, and cardiac death or HF hospitalization were observed among the three tertiles (log-rank P<0.001, P<0.001 and P=0.008, respectively) (Figure 2). Tertile 1 demonstrated significantly higher risk in the univariable Cox regression model compared to tertiles 2 and 3 (all P<0.05). In contrast, tertile 3 did not show significant differences in events compared to tertile 2 or the combined tertile 1 and 2 (all P>0.05). A significant difference in all-cause death was observed between tertile 2 and the combined tertile 1 and 3 (P=0.01), while no significant differences were found for all-cause death or HF hospitalization, or for CV death or HF hospitalization (P>0.05) (Figure 2). Patients in tertile 1 had higher risk of all-cause death (HR 3.36 [95% CI 1.77–6.39], P<0.001), all-cause death or HF hospitalization (HR 2.49 [95% CI 1.53–4.04], P<0.001), and cardiac death or HF hospitalization (HR 2.28 [95% CI 1.28–4.07], P=0.005), as compared to those in tertile 2 or 3 (Figure 3). In a multivariable Cox regression analysis, patients in tertile 1 had higher risk of all-cause death (HR 3.09 [95% CI 1.55–6.16], P=0.001), all-cause death or HF hospitalization (HR 2.26 [95% CI 1.35–3.76], P=0.002), and cardiac death or HF hospitalization (HR 2.05 [95% CI 1.11–3.78], P=0.02) compared to those in tertile 2 or 3, after adjusting for age, sex, baseline BMI, diabetes, and coronary artery disease. These findings were confirmed in a propensity score analysis matched for age, sex, BMI, diabetes, and coronary artery disease (Figure 3, all P<0.05). The continuous relationship between annualized weight change and events displayed a non-linear U-shape across all events, with the lowest risk observed around zero weight change, suggesting that weight stability is associated with the lowest risk of events (Figure 4). Consistent results were observed in sensitivity analyses excluding patients with obesity class 3 (BMI≥40) (online supplementary Tables S1–S2 and Figures S4–6).
Figure 2.
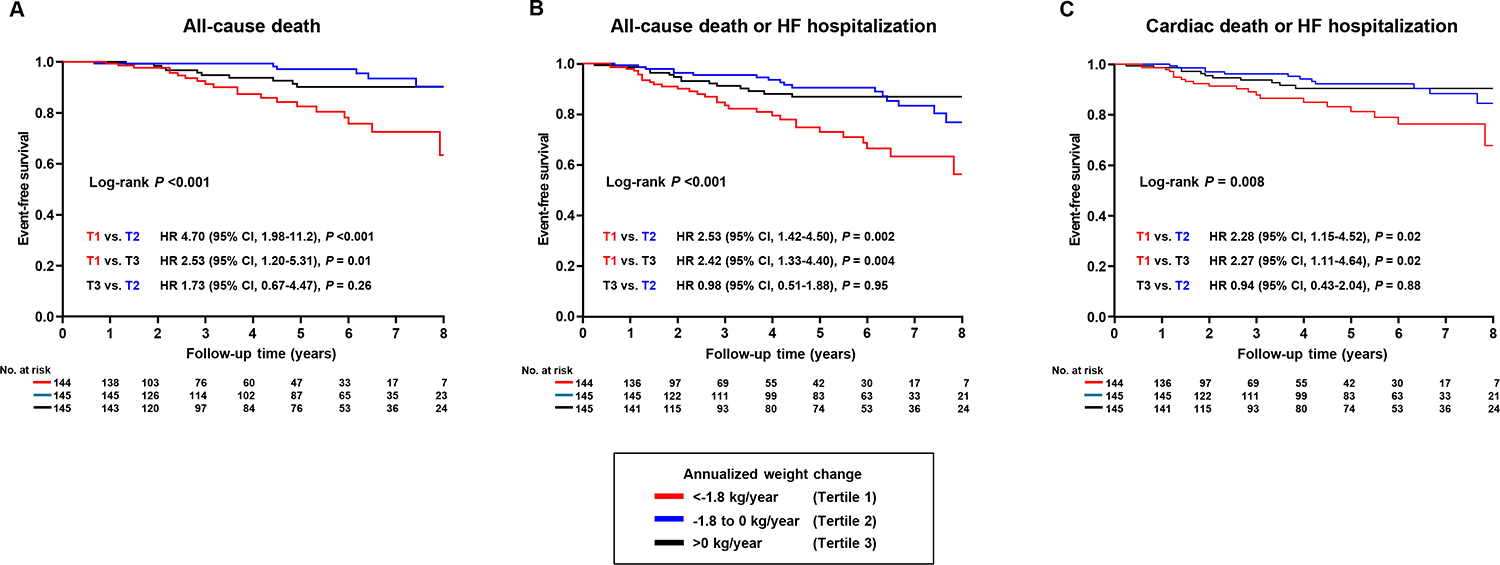
Survival stratified by annualized weight change. (A) represents survival for all-cause death, (B) for all-cause death or heart failure (HF) hospitalization, and (C) for cardiac death or HF hospitalization. HR, hazard ratio; CI, confidence interval.
Figure 3.
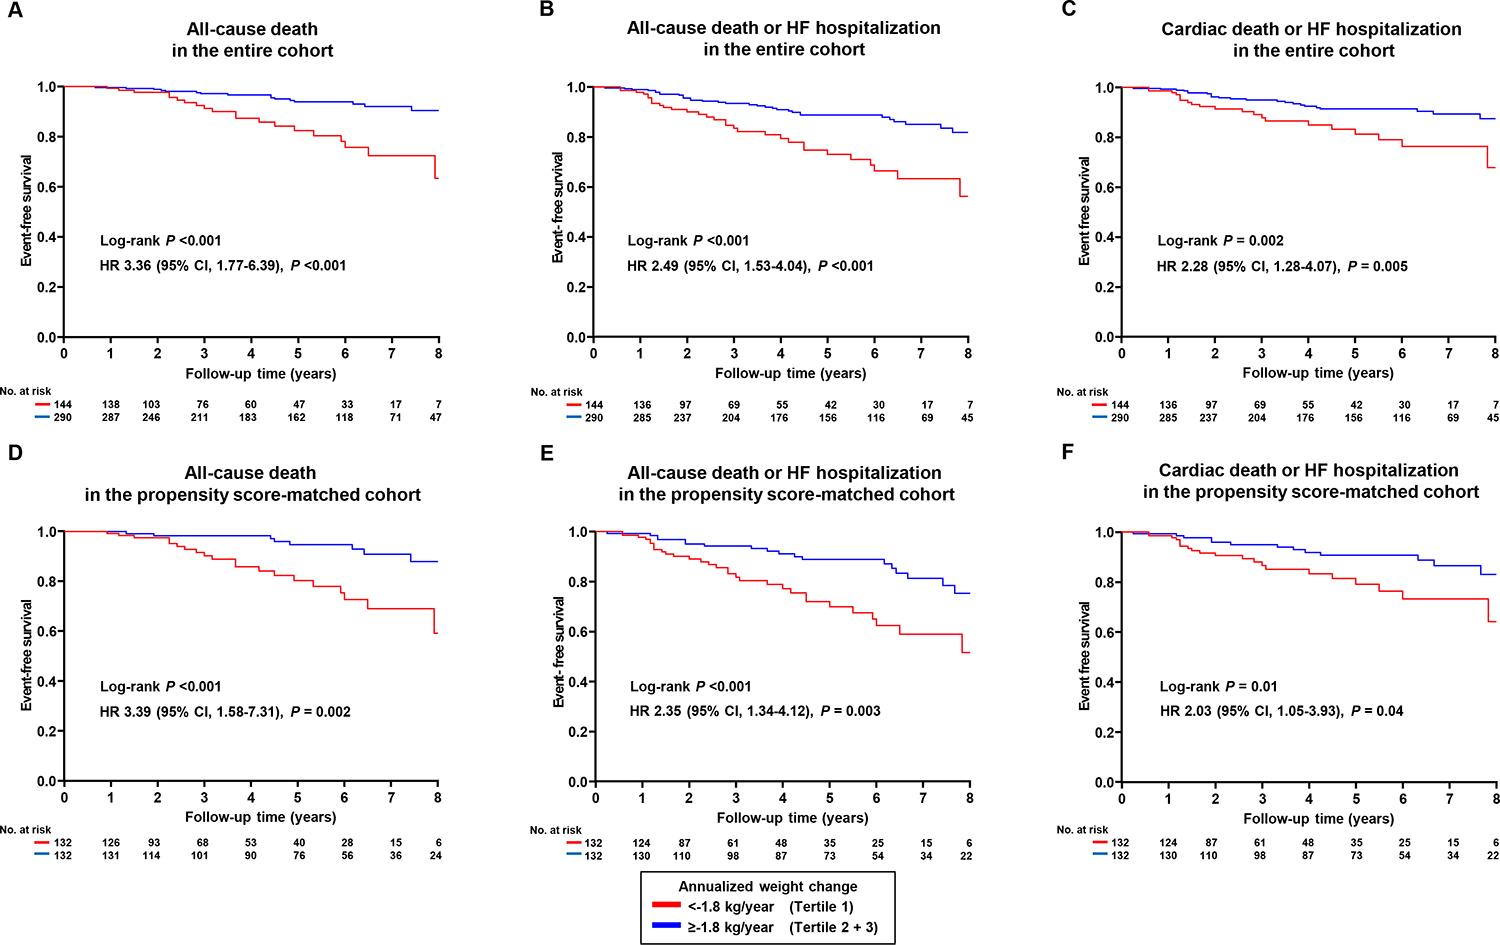
Survival stratified by tertile 1 and tertile 2 + 3 of the annualized weight change is shown for (A) all-cause death, (B) all-cause death or heart failure (HF) hospitalization, and (C) cardiac death or HF hospitalization. The second row presents survival for subjects matched by propensity score analysis based on baseline age, sex, body mass index, diabetes, and coronary artery disease, with (D) all-cause death, (E) all-cause death or HF hospitalization, and (F) cardiac death or HF hospitalization. The median matching distance was 0.001 (IQR 0.0004–0.002). Comparisons of the survival were performed using the log-rank test and univariable Cox regression analysis.
Figure 4.
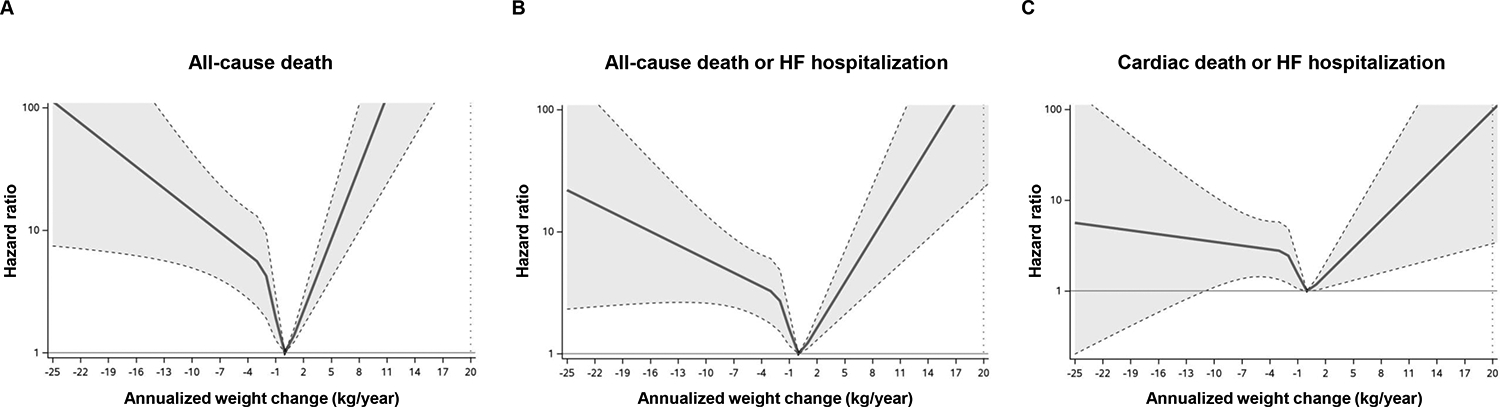
Continuous relationship between annualized weight change and events, represented by a spline curve with four knots based on percentiles. (A) shows the hazard ratio for all-cause death, (B) for all-cause death or heart failure (HF) hospitalization, and (C) for cardiac death or HF hospitalization.
Discussion
Intentional, therapeutic weight loss achieved through treatment with cardiometabolic medications such as incretins and sodium-glucose cotransporter-2 inhibitors in HFpEF is associated with improved hemodynamics and cardiorenal function, reduced symptom severity, and decreased risk for worsening HF,1–7 and the magnitude of weight loss on treatment is correlated with the magnitude of functional improvements,11 providing convincing evidence supporting these medicines as foundational treatments for patients with obesity-related HFpEF. In contrast, this study shows that patients with HFpEF and overweight or obesity who experience spontaneous or unintentional weight loss in the absence of weight-targeted treatment have worse outcomes. Notably, those patients who experience unintentional weight loss were (on average) obese at the time of index evaluation, and largely indistinguishable from those without subsequent weight loss based upon baseline characteristics, hemodynamics, and cardiopulmonary metabolic data. While persistent symptoms of HF may contribute to weight changes and prognosis, these findings indicate that such patients are difficult to identify cross-sectionally using currently available modalities, and future studies are needed to identify such patients proactively. Clinical trials have shown incretin-facilitated weight loss improves clinical status and reduces worsening HF in patients with HFpEF.6,12,13 It is unclear whether patients with HFpEF that will experience unintentional weight loss would also derive such benefits, or whether incretin therapies should be avoided in such patients.
This study has limitations. Only patients referred for invasive testing were included, and clinical outcomes were abstracted from chart review, so events occuring at outside institutions may not have been detected. However, these limitations apply to all comparator groups, minimizing bias. This study lacks evaluations of physical activity, nutritional status, and body composition, both at index evaluation and during follow-up, emphasizing the importance for future studies to investigate the underlying reasons for weight loss. The effects of cardiometabolic drugs such as the incretins among these patients is not ascertainable, but would be of interest to better understand in future studies.
In conclusion, these data underline important, fundamental differences between intentional, therapeutic weight loss as achieved in clinical trials of cardiometabolic drugs and unintended weight loss in HFpEF, and call for further study to better understand the circumstances and factors responsible for unintentional weight loss in this large and growing cohort of patients.
Supplementary Material
Disclosures
Dr. Borlaug receives research support from the National Institutes of Health (NIH) and the United States Department of Defense, as well as research grant funding from AstraZeneca, Axon, GlaxoSmithKline, Medtronic, Mesoblast, Novo Nordisk, Rivus, and Tenax Therapeutics. Dr. Borlaug has served as a consultant for Actelion, Amgen, Aria, Axon Therapies, BD, Boehringer Ingelheim, Cytokinetics, Edwards Lifesciences, Eli Lilly, Imbria, Janssen, Merck, Novo Nordisk, NGM, NXT, and VADovations, and is named inventor (US Patent no. 10,307,179) for the tools and approach for a minimally invasive pericardial modification procedure to treat heart failure.
Funding
Dr. Borlaug is supported by research grants from the National Heart, Lung and Blood Institute (R01 HL128526, R01 HL162828, and U01 HL160226) and the United States Department of Defense (W81XWH2210245).
References
- 1.Borlaug BA, Jensen MD, Kitzman DW, Lam CSP, Obokata M, Rider OJ. Obesity and heart failure with preserved ejection fraction: new insights and pathophysiological targets. Cardiovasc Res 2023;118:3434–3450. 10.1093/cvr/cvac120 [DOI] [PMC free article] [PubMed] [Google Scholar]
- 2.Kosiborod MN, Deanfield J, Pratley R, Borlaug BA, Butler J, Davies MJ, et al. Semaglutide versus placebo in patients with heart failure and mildly reduced or preserved ejection fraction: a pooled analysis of the SELECT, FLOW, STEP-HFpEF, and STEP-HFpEF DM randomised trials. Lancet 2024;404:949–961. 10.1016/S0140-6736(24)01643-X [DOI] [PubMed] [Google Scholar]
- 3.Borlaug BA, Reddy YNV, Braun A, Sorimachi H, Omar M, Popovic D, et al. Cardiac and Metabolic Effects of Dapagliflozin in Heart Failure With Preserved Ejection Fraction: The CAMEO-DAPA Trial. Circulation 2023;148:834–844. 10.1161/CIRCULATIONAHA.123.065134 [DOI] [PMC free article] [PubMed] [Google Scholar]
- 4.Tada A, Burkhoff D, Naser JA, Harada T, Pourmussa B, Reddy YNV, et al. Dapagliflozin Enhances Arterial and Venous Compliance During Exercise in Heart Failure With Preserved Ejection Fraction: Insights From the CAMEO-DAPA Trial. Circulation 2024;150:997–1009. 10.1161/CIRCULATIONAHA.124.068788 [DOI] [PMC free article] [PubMed] [Google Scholar]
- 5.Naser JA, Tada A, Harada T, Reddy YNV, Carter RE, Testani JM, et al. Effects of Dapagliflozin on Body Composition and Its Relation to Hemodynamics in Heart Failure With Preserved Ejection Fraction. Circulation 2024;149:2026–2028. 10.1161/CIRCULATIONAHA.124.069479 [DOI] [PMC free article] [PubMed] [Google Scholar]
- 6.Packer M, Zile MR, Kramer CM, Baum SJ, Litwin SE, Menon V, et al. Tirzepatide for Heart Failure with Preserved Ejection Fraction and Obesity. N Engl J Med 2025;392:427–437. 10.1056/NEJMoa2410027 [DOI] [PubMed] [Google Scholar]
- 7.Borlaug BA, Zile MR, Kramer CM, Baum SJ, Hurt K, Litwin SE, et al. Effects of tirzepatide on circulatory overload and end-organ damage in heart failure with preserved ejection fraction and obesity: a secondary analysis of the SUMMIT trial. Nat Med 2025;31:544–551. 10.1038/s41591-024-03374-z [DOI] [PMC free article] [PubMed] [Google Scholar]
- 8.Anker SD, Chua TP, Ponikowski P, Harrington D, Swan JW, Kox WJ, et al. Hormonal changes and catabolic/anabolic imbalance in chronic heart failure and their importance for cardiac cachexia. Circulation 1997;96:526–534. 10.1161/01.cir.96.2.526 [DOI] [PubMed] [Google Scholar]
- 9.Anker SD, Ponikowski P, Varney S, Chua TP, Clark AL, Webb-Peploe KM, et al. Wasting as independent risk factor for mortality in chronic heart failure. Lancet 1997;349:1050–1053. 10.1016/S0140-6736(96)07015-8 [DOI] [PubMed] [Google Scholar]
- 10.Pocock SJ, McMurray JJ, Dobson J, Yusuf S, Granger CB, Michelson EL, et al. Weight loss and mortality risk in patients with chronic heart failure in the candesartan in heart failure: assessment of reduction in mortality and morbidity (CHARM) programme. Eur Heart J 2008;29:2641–2650. 10.1093/eurheartj/ehn420 [DOI] [PubMed] [Google Scholar]
- 11.Borlaug BA, Kitzman DW, Davies MJ, Rasmussen S, Barros E, Butler J, et al. Semaglutide in HFpEF across obesity class and by body weight reduction: a prespecified analysis of the STEP-HFpEF trial. Nat Med 2023;29:2358–2365. 10.1038/s41591-023-02526-x [DOI] [PMC free article] [PubMed] [Google Scholar]
- 12.Kosiborod MN, Abildstrom SZ, Borlaug BA, Butler J, Rasmussen S, Davies M, et al. Semaglutide in Patients with Heart Failure with Preserved Ejection Fraction and Obesity. N Engl J Med 2023;389:1069–1084. 10.1056/NEJMoa2306963 [DOI] [PubMed] [Google Scholar]
- 13.Kosiborod MN, Petrie MC, Borlaug BA, Butler J, Davies MJ, Hovingh GK, et al. Semaglutide in Patients with Obesity-Related Heart Failure and Type 2 Diabetes. N Engl J Med 2024;390:1394–1407. 10.1056/NEJMoa2313917 [DOI] [PubMed] [Google Scholar]
Associated Data
This section collects any data citations, data availability statements, or supplementary materials included in this article.