

ABSTRACT
Ascidians exhibit remarkable regenerative capacity through epimorphosis regeneration, a process characterized by blastema formation containing highly proliferative progenitor cells. Characterization of blastemal cell types offers potential advantages for further exploration of cell origin, migration, and differentiation during regeneration. Here, we systematically delineated four morphologically distinct regeneration phases, with particular focus on blastemal morphogenesis using the oral siphon (OS) regenerative model in Ciona robusta. Our findings established IA6+ cells as essential components of the regenerative blastema based on their spatiotemporal accumulation patterns and IA6 knockdown phenotypes. RNA‐sequencing analysis of regenerating siphon tissues revealed the activation of Wnt signaling during the blastema formation. Inhibition of the Wnt signaling pathway led to a decrease in the number of IA6+ cells at the blastema site, indicating that the recruitment of IA6+ cells to the blastema site is regulated by the Wnt pathway. Taken together, our findings demonstrate that the accumulated IA6+ cells in the blastema play critical roles in OS regeneration in ascidians, and this process was regulated by canonical Wnt signaling. These results offer new insights into the evolutionary conservation of regenerative mechanisms across deuterostomes.
Keywords: blastema, Ciona, integrin alpha 6, oral siphon regeneration, Wnt signaling
During oral siphon regeneration in Ciona robusta, IA6 positive cells accumulate at the wound site to form a functional blastema that is essential for regeneration. Activation of the Wnt signaling pathway promotes both the recruitment of IA6+ cells and subsequent regenerative outgrowth, while pathway inhibition compromises blastema formation.

Abbreviations
- AP
Alkaline phosphatase
- CM
Circular muscle
- DEGs
Differentially expressed genes
- ECM
Extracellular matrix
- ESC
Embryonic stem cells
- GO
Gene Ontology
- Hpa
Hours post amputation
- HSC
Hematopoietic stem cells
- IA6
Integrin alpha 6
- KEGG
Kyoto Encyclopedia of Genes and Genomes
- LM
Longitudinal muscle
- NSC
Neuronal stem cells
- OPO
Oral siphon pigment organ
- ORF
Open reading frame
- OS
Oral siphon
- RNAi
RNA interference
- RPKM
Reads per kilobase per million mapped reads
- RT‐qPCR
Reverse transcription quantitative polymerase chain reaction
- siRNA
Small interfering RNA
1. Introduction
Regeneration is extensively prevalent across the animal kingdom, spanning from invertebrates to vertebrates, although the regenerative capacities vary among different species. In terms of terminology, regeneration is categorized into two main types: epimorphosis and morphallaxis. Epimorphosis is a phenomenon characterized by cellular proliferation and the formation of blastema, such as limb regeneration in salamanders [1, 2]. In contrast, morphallaxis involves the remodeling of existing cells without significant cellular proliferation, as observed in Hydra regeneration [2, 3]. A blastema typically consists of a heterogeneous mixture of cell subpopulations with diverse origins, and it plays a crucial role in the formation of all regenerated organs [4, 5]. The success of epimorphic regeneration largely hinges on the occurrence of a blastema [6]. Proliferative cells that make up the blastema can be classified into several types: adult pluripotent stem cells, such as the cNeoblast of the planarian [7, 8], tissue‐restricted progenitor cells, as seen in Xenopus [9], and progenitor cells derived from the de‐differentiation of terminally differentiated cells, like those in zebrafish [10, 11, 12]. Blastema cells often exhibit enrichment of stemness‐associated genes, as well as germline‐associated genes such as Piwi, Vasa, and Nanos. This has been well‐documented in planarians and ascidians [13, 14, 15]. The cellular origins and differentiative fates of blastema cells have long been a hotspot in regenerative research.
Integrins are the major family of adhesion molecules. They play a crucial role in mediating cell‐extracellular matrix (ECM) adhesion and are responsible for transmitting both mechanical and chemical signals from the extracellular environment into the cell interior [16]. Each integrin is a heterodimer composed of α and β subunits. The specific combination of these different subunits is determined by the cell type and the corresponding cellular function [17]. The integrin α6 (IA6) subunit typically functions as an integral part of either integrin α6β1 or α6β4. The expression of IA6 has a regulatory effect on the migratory ability of a diverse range of cell types. Reduced IA6 expression via siRNA in human dental pulp stem cells leads to a decrease in cell migration potential [18]. The IA6‐positive hematopoietic cells are critical for the regeneration of Botrylloides diegensis. IA6‐positive hematopoietic cells are essential for the regeneration of Botrylloides diegensis. During the early stages of regeneration, the majority of proliferating cells can be labeled with IA6. Inhibition of cell proliferation using mitomycin C prevents cell division; however, transplantation of IA6‐positive blood cells is sufficient to complete the entire regeneration process [19].
Ascidians, recognized as the closest living relative of vertebrates [20], are extensively employed as a model for regeneration studies owing to their relatively simplistic body plan [21] and remarkable regenerative abilities [22]. In adult Ciona, the body is entirely encased by a tunic rich in cellulose. They are characterized by two distal siphons: the oral siphon (OS), through which water enters the body, and the atrial siphon, which serves as the outlet for waste expulsion. A growing body of evidence indicates that the OS is homologous to the adenohypophyseal and olfactory structures originating from the anterior placodes of vertebrates, as supported by gene expression patterns and the molecular regulation of development [23]. Therefore, investigating OS regeneration offers valuable perspectives on the mechanisms driving the developmental process. Moreover, it provides insights into the challenges associated with the failed regeneration of vertebrate sensory organs and their associated structures.
Ciona OS regeneration was categorized into three phases: (I) the formation of wound epidermis, (II) the oral siphon pigment organ (OPO) replacement, and (III) OS regrowth within about a month after amputation [24]. It was characterized by forming blastema with proliferating cells, and molecular analysis has revealed that Notch signaling regulated OS regeneration through maintaining proliferative activity in regeneration blastema [25]. Stem cells responding to OS regeneration have been located in the siphon wall and transverse vessels of the branchial sac using alkaline phosphatase (AP) marker and Edu labeling [26]. The position of the amputation site influences the rate of regeneration because replacement cells for siphon tip regeneration are derived from within the siphon itself, while those for siphon tube regeneration are from a combination of both within and outside the siphon [24, 26]. Although progress in deciphering Ciona OS regeneration has been achieved, there still remain many aspects to be elucidated, such as the exact cell types that constitute the blastema and the molecular mechanism that directs them to reside in the blastema.
In this study, we meticulously characterized the regeneration stages through morphological observations, with a particular emphasis on the blastema formation phases using Ciona robusta. Subsequently, we identified the key cell type, IA6+ cells, that constitute the blastema. We experimentally validated their essential roles in OS regeneration by RNA interference approach. Finally, we uncovered that Wnt signaling regulates blastema formation through influencing the IA6+ cell accumulation at the injury site.
2. Materials and Methods
2.1. Animals
Adult C. robusta were collected from the Ailun Bay area in Rongcheng, Weihai City, Shandong Province. After collection, the animals were acclimatized in a laboratory seawater recirculation system under controlled conditions: seawater temperature maintained at 18°C, salinity at 30‰ ± 1‰, and a 24‐h light cycle. The animals were fed daily with a mixed algal diet consisting of Tisochrysis lutea and Chlorella vulgaris at a 1:1 ratio, with each feeding at a concentration equivalent to 1% of the total seawater volume.
2.2. Operations
Adult Ciona (5–6 cm in length) were immersed in a 0.25% MS222 solution and anesthetized for 5–10 min. Upon confirmation of no muscle contraction response, the anterior half of the OS was excised using sterile ophthalmic surgical scissors. The animals were subsequently transferred to a seawater recovery tank equipped with continuous aeration and maintained under the standard feeding conditions.
2.3. Immunofluorescence Analysis
Ascidians were anesthetized in 2% MS222 until the OS exhibited full expansion and ceased to contract in response to light tactile stimulation. The tunic was meticulously removed using fine forceps and ophthalmic scissors. After tunic removal, the OS was excised and transferred to a 1.5 mL centrifuge tube, rinsed with seawater for several minutes, and subsequently dried thoroughly. The samples were then fixed by adding 1 mL of 8% paraformaldehyde (PFA) and incubated on a shaker at room temperature for 3 h. After PFA removal, the samples were permeabilized with 1 mL of 0.2% PBST (PBS with 0.2% Triton X‐100) at room temperature, with three washes of 1 h each. Following permeabilization, the samples were blocked with 1 mL of 10% goat serum (1 mL goat serum in 9 mL PBST) at room temperature for 2 h. For immunostaining, 1 mL of primary antibody diluted in 10% goat serum was added to the samples and incubated overnight at 4°C. After primary antibody incubation, the samples were washed three times with 0.2% PBST, each for 1 h at room temperature. Subsequently, the samples were incubated with a secondary antibody diluted in 10% goat serum (typically at a 1:300 dilution) overnight at 4°C in the dark. If Phalloidin staining was required, Phalloidin‐Rhodamine (1:300 dilution) was added concurrently with the secondary antibody. Following secondary antibody incubation, the samples were washed three times with 1 mL of 0.2% PBST each for 1 h at room temperature. Finally, the samples were mounted using DAPI‐containing mounting medium and visualized using a laser confocal microscope. Image acquisition and processing were performed using Imaris, Photoshop, and Adobe Illustrator software.
2.4. BrdU Pulse‐Chasing Labeling
The ascidians with half OS amputated, along with non‐amputated control, were placed in a centrifuge tube and incubated in fresh seawater containing 5 mM BrdU for 1 h in the dark. Then the BrdU‐containing seawater was removed, and the ascidians were rinsed twice with fresh seawater. Tissue fixation and immunofluorescence analysis were subsequently performed as described above.
2.5. Short Interfering RNA Treatment
Based on the IA6 mRNA sequence from the C. robusta genome, the siRNA‐508 targeting the IA6 gene and a negative control siRNA (Control siRNA) were designed using the online RNAi design platform (DSIR, available at DISR Home page) (Table 1). Both IA6‐siRNA and the negative control were synthesized by Jiangsu Genecefe Biotechnology Co. Ltd. Immediately after OS amputation, animals were transferred to seawater containing 2 μmol/L IA6‐siRNA. The siRNA‐containing seawater was refreshed every 48 h to maintain consistent exposure. Regenerative progression was evaluated at 72 and 120 h post amputation (hpa).
TABLE 1.
siRNA sequences for IA6.
| siRNA Name | siRNA sequence |
|---|---|
| siRNA‐508‐sence | GAUGUAGACAACAGAUUUATT |
| siRNA‐508‐anti‐sence | UAAAUCUGUUGUCUACAUCTT |
| Control‐siRNA‐sence | UUCUCCGAACGUGUCACGUTT |
| Control‐siRNA‐anti‐sence | ACGUGACACGUUCGGAGAATT |
2.6. RNA Preparation
OS tissues from C. robusta were collected from the following groups: 0 hpa, 48 hpa, and 120 hpa, and immediately transferred to RNase‐free 1.5 mL centrifuge tubes. The tissues were flash‐frozen in liquid nitrogen, homogenized using a mortar and pestle, and then transferred to new centrifuge tubes containing 1 mL of RNAiso reagent. After vortexing for 1 min, 200 μL of chloroform was added, and the mixture was vigorously shaken. The tubes were incubated on ice for 10 min and then centrifuged at 12 000 rpm, 4°C for 20 min. The upper aqueous phase was carefully aspirated and transferred to a new tube, followed by the addition of an equal volume of isopropanol to precipitate the RNA. The mixture was centrifuged again at 12 000 rpm for 10 min, and the RNA pellet was washed with 75% ethanol. After removing the ethanol, the RNA pellet was air‐dried and resuspended in 30 μL of DEPC‐treated water.
2.7. RNA Sequencing and Data Analysis
The extracted RNA was submitted to Novogene Bioinformatics Technology Co. Ltd. for cDNA library construction and transcriptome sequencing. mRNA was enriched and purified using oligo (dT) magnetic beads, and the cDNA library preparation was performed following the standardized protocol provided by New England Biolabs (NEB). The quality‐controlled libraries were subsequently sequenced on an Illumina platform employing a paired‐end 150‐bp (PE150) sequencing strategy to generate raw sequencing data. Raw data underwent processing, which involved removing low‐quality sequences and adapter contaminants, yielding high‐quality clean reads. Clean reads were then aligned to the C. robusta genome (downloaded from the Ghost database: HT Download) the BLAST algorithm. Differentially expressed genes (DEGs) between two biological conditions were identified using DESeq2 with the following thresholds: Fold Change ≥ 2 and adjusted p‐value (padj) < 0.05. The identified DEGs were subjected to further functional annotation through Gene Ontology (GO) enrichment analysis, investigating their biological processes, molecular functions, and cellular components. Additionally, Kyoto Encyclopedia of Genes and Genomes (KEGG) pathway analysis was conducted to identify key biological pathways associated with these DEGs.
2.8. Real‐Time PCR
OS tissues from C. robusta were collected and immediately transferred to RNase‐free 1.5 mL centrifuge tubes. Total RNA was extracted, and its concentration and quality were assessed to ensure compliance with experimental standards. RNA was reverse transcribed into cDNA using the HiScript II 1st Strand cDNA Synthesis Kit under RNase‐free conditions. The resulting cDNA was subsequently used for reverse transcription quantitative PCR (RT‐qPCR)analysis.
Target gene sequences were retrieved from the C. robusta genome, and primers approximately 100 bp in length were designed near the 3′ end of the open reading frame (ORF). Primer specificity was verified against the Ciona transcriptome to ensure uniqueness. Primers used for RT‐qPCR are listed in Table 2.
TABLE 2.
Primers used in RT‐qPCR.
| Primer name | Primer sequence | Amplicon size (bp) |
|---|---|---|
| WNT5A‐F | GTCACTATGTAATTATACCTTATGTAAATGCCAGTTAGAATCA | 100 |
| WNT5A‐R | TTTAATAAAAACGACTCAAATTTTGTGTGAGACACAA | |
| WNT6‐F | TACTTCTTTTTCAACGTGCGCCTATGT | 103 |
| WNT6‐R | AAATGTTCCGAAGCACGGTTTCA | |
| WNT7B‐F | TCGCTTCGTGTTGTTGCATTTCG | 100 |
| WNT7B‐R | TTTTTTTGTAAAGCCATTTATTTAAACATTTTTACAAA | |
| WNT9A‐F | GCTACTTCTTCATGTATGGGAAAAAGTGGA | 101 |
| WNT9‐R | TTTAATACTTTAGGTATTGTATTACGCGGTATATTTACACAAAG | |
| WNT10‐F | TAAACAATCAATTAAACAGTATGCTACCAATTATTCA | 104 |
| WNT10‐R | CTGTAGAAATACAAAGGCATAAAATTTTGGTAACGATATG | |
| IA6‐F | ATGTTGTGCTGCTACGGTCA | 102 |
| IA6‐R | AACCAAGTGTGCAGTTCGGA | |
| β‐actin‐F | TGTACTTGCTTCGGCAGTACATA | 103 |
| β‐actin‐R | AGGAACGCTTCACGATTTTG |
RT‐qPCR was performed according to the reaction system and cycling conditions specified in the ChamQ SYBR Color qPCR Master Mix manual. Each sample was analyzed in triplicate to ensure technical reproducibility. Melting curve analysis was conducted at the end of each run to confirm amplification specificity. The thermal cycling consisted of an initial denaturation at 95°C for 5 min, followed by 40 cycles of denaturation at 95°C for 30 s and a combined annealing/extension step at 60°C for 1 min. After completion of PCR cycles, raw data were exported and analyzed using the 2(−ΔΔCt) method for relative quantification. β‐actin was used as an internal control for normalization.
2.9. Inhibitor Injection Experiment
Adult ascidians (5–6 cm) were anesthetized in 2% MS222 until complete muscle relaxation. The anterior half of the OS was surgically excised. Wnt pathway inhibitors (Cardamonin; C8249, Sigma‐Aldrich) were administered via injection. A single injection (1 μL) was delivered into the transverse blood vessel of the branchial sac of each animal. Inhibitor concentrations of 2.5 μM, 5 μM, and 10 μM were tested, while the control group received an equivalent volume of DMSO. Ten animals were used for each concentration group. After injection, animals were returned to the culture tank and maintained under continuous aeration.
2.10. Statistical Analysis
All statistical analyses were performed using GraphPad Prism. For the analysis of Wnt pathway inhibition effects, the IA6+ cell ratio was defined as the number of IA6+ cells per cubic millimeter and quantified using the spot detection function in Imaris software. At least three biological replicates were included for each condition to ensure statistical robustness. Group comparisons were conducted using one‐way ANOVA. A p‐value < 0.05 was considered statistically significant. ns indicates no significant difference; * indicates p < 0.05; ** indicates p < 0.01; *** indicates p < 0.001; **** indicates p < 0.0001.
3. Results
3.1. The Cellular Processes Observed During Ascidian OS Regeneration Included the Formation of a Blastema
Ascidians with body lengths of 5–6 cm were selected for detailed regeneration analysis. After anesthesia with MS222, the animals were surgically cut across half the OS and were then transferred to aerated circulating seawater for continuous observation. The animals demonstrated remarkable regeneration capacity, successfully reconstructing the original siphon structure within 7 days. The regeneration was confirmed by the restoration of the defining feature of distal rim pattern and the precise number of OPO. The regeneration process was divided into four distinct stages based on morphological and cellular characteristics. Stage 1 (24–48 h post amputation, hpa) exhibited significant cell aggregation at the regeneration site, as confirmed by both light microscopic observation and DAPI nuclear staining. During Stage 2 (approximately‐72 hpa), cellular differentiation became evident, marked by the de novo formation of multiple transverse actin bundles, which were clearly visualized through phalloidin staining. Stage 3 (around‐120 hpa) was characterized by cellular elongation accompanied by the extension of preexisting longitudinal actin fibers from the amputation site. The final stage, Stage 4 (−144 hpa) demonstrated complete morphological restoration, featuring the formation of 6–8 distinct siphon lobes with characteristic curvature and an equivalent number of OPOs positioned in the niches between adjacent lobes along the rim.
Studies have demonstrated that C. intestinalis forms a regeneration blastema composed of highly proliferative cells at the OS amputation site (Jeffery, 2012). To reveal whether the blastema appeared at stage I, the proliferation capacity of aggregated cells was detected using the BrdU pulse‐chase approach. Ascidians were immersed in aerated seawater with BrdU after siphon amputation for as long as 48 h, during which many cells aggregated at the distal end of the OS (Figure 1). The results showed that cells with BrdU signal distributed extensively in the tube and OPO of the siphon in animals without surgical injury, indicating the constitutive existence of proliferating cells in ascidians. When stimulated by amputation, the numbers of proliferating cells in the siphon stump increased progressively, especially at the far end of the siphon stump—in other words, the regeneration site—which indicated the formation of the blastema (Figure 2).
FIGURE 1.

(A) Schematic diagram of OS tissue removal. The red dotted line indicates the amputation site. (B) Morphological observation of OS regeneration stages. In wild animal, the distal end of OS exhibited multiple lobes separated by longitudinal muscle fibers. OPOs positioned in the niches between adjacent lobes along the rim. Following amputation of half the OS, a considerable number of cells accumulated beneath the epidermal layer at 24 hpa. From 48 to 72 hpa, the distal end of the OS exhibited pronounced growth, accompanied by expansion of the newly formed tissue region. By 96 hpa, transverse fibrous structures began to emerge, which became more continuous and organized by 120 hpa. At 144 hpa, the rim of the OS displayed eight distinct lobes, and pigment cells aggregated to form OPO between two lobes. The dotted line demarcates the boundary between regenerating and pre‐existing tissue. Black arrows indicate regions of cell aggregation. Scale bars: 200 μm. (C) Histological analysis of OS regeneration. At 0 hpa, fragmented muscle fibers were observed. By 24 hpa, cells accumulated beneath the epidermis by DAPI‐staining. At 72 hpa, transverse actin fibers became evident by Phalloidin staining. By 120 hpa, longitudinal actin fibers extended. The white dotted line indicates the boundary between regenerating and original tissue. Red arrows highlight regenerated transverse fibers, while white arrows denote regenerated longitudinal fibers. Scale bars: 100 μm.
FIGURE 2.

Distribution of BrdU positive cells in OS at different regeneration stages. BrdU‐stained OS stump after half OS amputation. In the unamputated control group, BrdU‐positive cells were sparsely distributed. At 24 hpa, the number of BrdU‐positive cells at the distal end of OS increased. By 48 hpa, a significant accumulation of BrdU‐positive cells was observed. The white dotted line marks the boundary between the regenerating and pre‐existing tissue. Scale bar: 70 μm.
3.2. IA6‐Positive Cells Are the Primary Contributors to Blastema Formation
To characterize the cell types composing the blastema, integrin alpha 6 (IA6), the only common gene expressed in stem cells including embryonic stem cells (ESC), embryonic neuronal stem cells (NSC), and hematopoietic stem cells (HSC) and PIWI, the traditional stem cell markers in Ciona [26], were selected for detection. Animals underwent amputation of half the OS tube, and the siphon stump was collected at different regeneration stages for immunohistochemistry analysis (Figure 3). At 0 hpa, a baseline population of IA6+ cells was observed within the OS tube, indicating their constitutive distribution. By 24 hpa, the number of IA6+ cells significantly increased, with most aggregating at the blastema site. Subsequently, the number of IA6+ cells declined, and the blastema became less visible. However, IA6+ cells increased again at later stages, accumulating at several specific spots, namely the OPOs. In contrast, PIWI+ cells, though detected throughout the oral siphon tube, were present in relatively low numbers and did not accumulate at the blastema. Nevertheless, by 120 hpa, PIWI+ cells increased and notably gathered at the OPO site, similar to IA6+ cells. These findings suggest that IA6+ cells, rather than PIWI+ cells, contributed to blastema formation.
FIGURE 3.

Distribution of IA6+ and PIWI+ cells in OS during regeneration. (A) IA6+ cell dynamics during OS regeneration. By 24 hpa, a significant accumulation of IA6+ cells was observed at the wound site. The number of IA6+ cells decreased by 72 hpa. At 120 hpa, IA6+ cells aggregated at specific site of OPO. The white dotted line demarcates the boundary between regenerating and pre‐existing tissue, and the white arrows indicates regions of cell clustering. Scale bars: 200 μm. (B) PIWI+ cell dynamics during OS regeneration. From 0 to 72 hpa, PIWI+ cells were sparsely distributed in OS tube. By 120 hpa, PIWI+ cells increased in number and predominantly aggregated at the OPO sites. Scale bars: 200 μm.
RNA interference (RNAi) has been demonstrated to effectively knock down gene expression in adult ascidians [27, 28]. To investigate whether IA6+ cells indeed play functions during OS regeneration, small interfering RNA (siRNA) targeting IA6 was employed to inhibit its expression. Given that the adult Ciona continuously filter water through their bodies, animals were immersed in seawater containing siRNA immediately after half of the OS was removed as described above. Immunostaining for IA6 revealed a significant reduction in IA6+ cells in siRNA‐treated animals compared to the control siRNA group at 72 and 120 hpa(Figure 4), and RT‐qPCR analysis confirmed successful suppression of IA6 expression (Figure S2). Consequently, these animals exhibited impaired siphon regeneration, as evidenced by disruptions in the rim pattern and OPO fidelity. Collectively, these findings highlight the critical role of IA6+ cells in Ciona OS regeneration.
FIGURE 4.
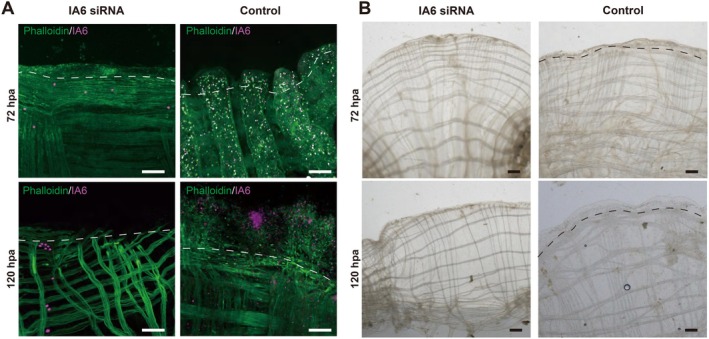
Effect of IA6 knockdown on distribution of IA6+ cells and regenerative phenotypes. (A) IA6+ cell distribution in knockdown and control groups. Following amputation of half OS, the IA6 knockdown group exhibited a significant reduction in IA6+ cells at the siphon stump at 72 hpa and 120 hpa compared with the control group. (B) Regeneration phenotypes in knockdown and control groups. In the IA6 knockdown group, tissue regeneration was significantly impaired, while animals of the control group regenerated successfully. Scale bar: 200 μm.
3.3. Identification of the Molecular Mechanisms Underlying Blastema Formation
To explore the molecular mechanisms regulating Ciona OS regeneration during these critical phases, RNA‐Seq was employed to analyze gene expression profiles in the siphon stump at 0, 48, and 120 hpa (Figure 5). A total of 40 519 606, 53 234 666, and 46 024 366 reads were sequenced with total mapped reads 69.76%, 88.98%, and 82.08% for each library, respectively. This provided sufficient coverage depth and high‐quality alignment, ensuring robust results. Differentially expressed genes (DEGs) were identified as transcripts with at least two‐fold change (|log2FoldChange| ≥ 1.0) and an adjusted p‐value (padj) ≤ 0.05. At 48 hpa, 2284 genes were up‐regulated and 1447 genes were down‐regulated compared to 0 hpa. At 120 hpa, 1744 genes were up‐regulated and 2184 were down‐regulated relative to 48 hpa. The clean reads were quantified and normalized using the RPKM method (Reads Per kilobase per Million mapped reads).
FIGURE 5.
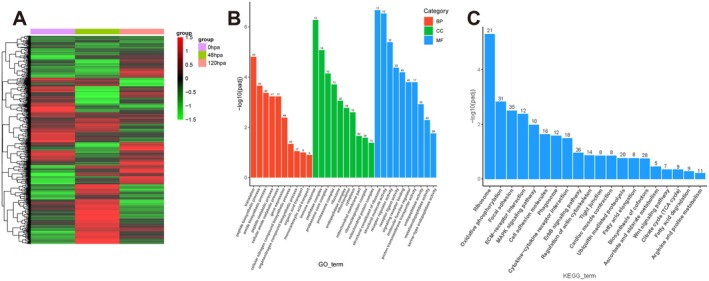
Transcriptomic analysis of OS regeneration. (A) Cluster heatmap of DEGs. The heatmap illustrates the clustering patterns of DEGs among samples collected at 0 hpa, 48 hpa, and 120 hpa. (B) GO enrichment analysis of candidate genes. (C) KEGG enrichment analysis highlights the pathways enriched in candidate genes. The candidate genes in (B) and (C) were identified by integrating up‐regulated genes from the 48 hpa library (compared to 0 hpa and 120 hpa), focusing on those implicated in blastema formation.
To identify key genes associated with blastema formation, a strategy was devised to integrate up‐regulated genes from the 48 hpa library (compared to 0 hpa and 120 hpa). This approach identified 319 candidate genes for further analysis. KEGG analysis revealed significant enrichment in expected pathways, such as the MAPK signaling pathway and cell junction pathways, as well as the Wnt signaling pathway. Wnt signaling has been implicated in the regulation of embryonic stem cells (Wnt5A) [29], hematopoietic stem cells (Wnt5A) [30], ES cells‐derived endoderm precursor cells (Wnt6) [31] and ES cells‐derived neural precursor cells (Wnt5A, Wnt6 and Wnt7B) [32], activating the Wnt/β‐catenin pathway for cell fate determination. Thus, the Wnt family genes (Wnt5A, Wnt6, Wnt7B, Wnt9A, and Wnt10A) were selected for further validation using RT‐qPCR (Figure 6). Melting curve analysis showed a single sharp peak for each reaction, indicating specific amplification without primer‐dimer or non‐specific products (Figure S1). Combined with the observed regeneration pattern, these findings suggest that the Wnt signaling pathway may play a pivotal role in regulating blastema formation.
FIGURE 6.
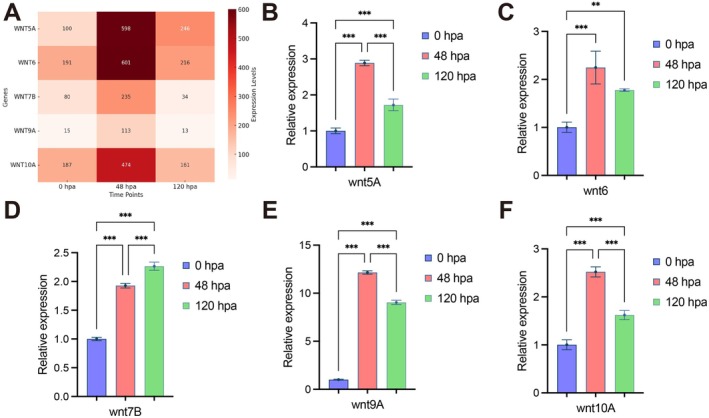
Expression validation of Wnt Pathway Genes During OS Regeneration. (A) Heatmap of Wnt pathway gene expression in transcriptomes of 0 hpa, 48 hpa, and 120 hpa regeneration samples. (B–F) RT‐qPCR analysis of Wnt‐related gene expression (Wnt5A, Wnt6, Wnt7B, Wnt9A, and Wnt10A) at 48 hpa and 120 hpa relative to 0 hpa. ns indicates no significant difference; * indicates p < 0.05; *** indicates p < 0.001.
3.4. The Wnt Signaling Pathway Regulated Blastema Formation
Cardamonin was used to experimentally verify the regulatory role of the Wnt signaling pathway [33]. It was dissolved in DMSO and injected into the transverse vessel of the branchial sac immediately after half OS was amputated. Each animal received a total injection volume of 1 μL. The impact on blastema formation was evaluated based on the IA6+ cell ratio, which was calculated as the number of IA6+ cells relative to the total number of cells within a 1 cubic millimeter volume, using the spot detection tool in iMaris software. In the 2.5 μM treatment group, minimal effects were observed, with little change in the IA6+ cell ratio at the blastema. However, as the inhibitor concentration increased, the number of IA6+ cells in the blastema site significantly decreased (Figure 7). The result suggested that Wnt inhibitor treatment affected blastema formation in a dose‐dependent manner.
FIGURE 7.

Effects of Wnt signaling pathway inhibitors on cell migration during OS regeneration. (A) Schematic diagram of OS tissue removal. The red line indicates the amputation site. (B) Impact of Wnt signaling pathway inhibitors on targeted migration of IA6+ cells. As the concentration of the inhibitor increased, the number of IA6+ cells at blastema site decreased. Scale bars: 200 μm. (C) Quantification of IA6+ cells at the blastema site following Wnt inhibitor injection. ns indicates no significant difference; *** indicates p < 0.001; **** indicates p < 0.0001.
4. Discussion
4.1. Blastema Formation Featured OPO Replacement Phase During OS Regeneration
This present study developed a more detailed four‐stage classification of OPO replacement based on cellular processes including blastema formation, transverse actin fiber differentiation, longitudinal fiber extension, and OPO reconstruction. Blastema formation emerged as a critical event in OS regeneration. Inhibition of this process led to regeneration failure, which is in accordance with the previous report [25]. The observed transverse and longitudinal actin fibers were supposed to be circular muscle (CM) fiber and longitudinal muscle (LM) fiber, respectively. This assumption is supported by the limited cell types in the siphon tube, mainly consisting of epithelial cells, neural cells, and muscle cells. Functionally, CM fibers are believed to generate contraction, creating a squeezing pressure to close the lumen, while LM fibers produce the active tension necessary for shortening [34]. Notably, the differentiation of CM fiber differed from LM fibers in two significant ways: First, CM fibers were generated de novo, whereas LM fibers elongated from the injury site. Secondly, multiple rows of CM fibers formed prior to the regrowth of LM fibers. These differences were likely attributed to distinct stem cell origins and different regulatory mechanisms underlying differentiation [24]. We hypothesize that these differentiation disparities might reflect their distinct functional roles. Similar to esophageal transport, where CM contraction plays a primary role and LM shortening a second one, potentially enhancing CM contraction [35]. At the final stage, OPOs rimmed the siphon tip. The siphon rim transformed from a distorted shape to a regular curvature, resulting in the formation of 8 siphon lobes and an equivalent number of OPOs. This precise pattern construction likely relies on siphon stump memory, since complete OS removal from its base disrupts OPO patterning [26].
4.2. IA6+ Cells Are the Critical Components of Blastema
A pivotal discovery in this study is that IA6+ cells, rather than PIWI+ cells, are indispensable components of the blastema and subsequently contribute to regenerating tissues. These findings imply that IA6‐marked stem cells may play functionally critical roles, especially during early regeneration phases. IA6 has been found expressed in over 30 vertebrate stem cell types, ranging from ESCs to HSCs [36]. In porcine, IA6 classifies muscle progenitor cells into two populations, and the IA6+ population exhibits a stronger myogenic differentiation capacity [37]. Moreover, human mesenchymal stem cells with elevated IA6 expression represent higher migration and proliferation capacity [38]. Notably, a more essential role of IA6 has been identified in colonial ascidians Botrylloides diegensis. Only stem cells with IA6 expression can rescue the blocked whole‐body regeneration, indicating the multipotent capacity of these IA6+ stem cells [19]. However, given that vertebrate blastema typically consists of heterogeneous cell populations [39], we did not comprehensively characterize all cell types within the blastema beyond IA6+ cells, despite observing diverse cellular populations through DAPI and immunofluorescence staining (Figure 1).
The source and plasticity of blastemal cells represent two fundamental inquiries in the realm of epimorphic regeneration. In our study, we found that RNAi‐mediated interference of IA6 inhibited regrowth of multiple tissues, including muscle and epithelium, suggesting the pluripotency of IA6+ blastemal cells. Regarding the origin of IA6+ cells that compose the regeneration blastema, it is reasonable to postulate two possible pathways: proliferation and migration. The proliferative capacity of blastemal cells was confirmed through a BrdU‐chasing experiment (Figure 2). The migration pathway, on the other hand, was inferred from previous reports indicating that the ascidian circulatory system harbors stem cells capable of migrating throughout the body [19, 22, 40, 41, 42, 43]. Our previous work also demonstrated the presence of numerous IA6+ cells in the transverse vessels of the branchial sac (data not shown). These findings are consistent with the phenomenon that long‐distance OS regeneration necessitates the migration of stem cells from outside the OS [24, 44] (see Figures 3, 4, 5, 6).
4.3. Wnt Signaling Regulates IA6+ Cell Gathering at Blastema Site
The present investigation revealed Wnt signaling is required for aggregation of IA6+ cells, subsequently influencing blastema formation. This is consistent with the previous results showing that Wnt signaling plays a crucial role, especially during blastema formation in Xenopus laevis limb regeneration [45]. Given that blastema cells can originate from two potential pathways, migration and proliferation, we hypothesized that Wnt signaling might affect the migration of IA6+ cells, based on the observation that a large number of IA6+ cells are constantly circulating in the Ciona body, and only a disruption in migration could lead to a significant decline in the number of IA6+ cells at the injury site during the early regeneration period (Figure 7).
Among Wnt family members, Wnt5A, Wnt6, Wnt7B, Wnt9A, and Wnt10A elevated their expression significantly at 48 hpa, corresponding to the blastema formation period. Wnt5A has been proven to play a vital role for blastemal formation via the non‐canonical pathway during limb regeneration in Ambystoma mexicanum [46]. In contrast, Wnt10A was found to have early expression after injury to stimulate blastema formation via the canonical β‐catenin pathway in zebrafish [47]. Considering that the inhibition of the Wnt‐β‐catenin pathway blocked blastema formation, it is reasonable to hypothesize that the canonical Wnt signaling functionally regulates the OS regenerative blastema formation. However, the specific functional roles of Wnt ligands require further validation. The question of whether they act independently, synergistically, or redundantly in the regeneration process remains unsolved.
Our results open up several avenues for future research in Ciona regeneration. Future studies will focus on identifying all the cell types that constitute the blastema apart from IA6+ cells, tracking their migration and differentiation, and investigating how and when Wnt signaling acts on stem cells for regulation.
In conclusion, this study identified an IA6‐marked stem cell population that drives OS regeneration. Furthermore, we unveil a novel regulatory mechanism linking canonical Wnt signaling to the accumulation of IA6+ cells within the Ciona OS regenerative blastema. Given the high conservation of gene and molecular regulation across the animal kingdom, it may be possible to engineer these mechanisms in species with limited regeneration capacity, such as mammals, and potentially provide valuable insights in the field of regenerative medicine.
Author Contributions
Conceptualization: Xiuxia Yang; Investigation: Shuo Yan, Wenjing Xu, and Yuping Fan; Data analysis: Penghui Liu, Xiuxia Yang, Bo Dong, and Wei Wang; Writing – original draft: Shuo Yan; Writing – review and editing: Xiuxia Yang and Bo Dong; Supervision: Xiuxia Yang; Project administration: Bo Dong; Funding acquisition: Bo Dong.
Ethics Statement
The study was approved by the Ocean University of China Institutional Animal Care and Use Committee (OUC‐IACUC) prior to its initiation. All experiments and related procedures were conducted in accordance with the approved guidelines and regulations (Approval No. 2021‐0032‐0012).
Conflicts of Interest
The authors declare no conflicts of interest.
Supporting information
Data S1.
Acknowledgments
This work was supported by the Science & Technology Innovation Project of Laoshan Laboratory (Nos. LSKJ202203001 and LSKJ202203204), and the Taishan Scholar Program of Shandong Province, China (B.D.). We thank BioRender.com for providing illustration tools used to create the graphical abstract.
Yan S., Xu W., Fan Y., et al., “Integrin‐Alpha‐6+ Cells Are Responsible for Blastema Formation During Oral Siphon Regeneration in Ciona robusta ,” The FASEB Journal 39, no. 14 (2025): e70870, 10.1096/fj.202501104R.
Funding: This work was supported by Science & technology Innovation Project of Laoshan Laboratory, Nos. LSKJ202203001, LSKJ202203204; the Taishan Scholar Program of Shandong Province, China (B.D.).
Data Availability Statement
The RNA‐sequencing data generated in this study have been deposited in the NCBI Sequence Read Archive (SRA) under the accession number PRJNA1240853 and are publicly available. All other data supporting the findings of this study are available from the corresponding author upon reasonable request.
References
- 1. Alvarado A. S. and Tsonis P. A., “Bridging the Regeneration Gap: Genetic Insights From Diverse Animal Models,” Nature Reviews Genetics 7 (2006): 873–884. [DOI] [PubMed] [Google Scholar]
- 2. Morgan T. H., “Regeneration and Liability to Injury,” Science 14 (1901): 235–248. [DOI] [PubMed] [Google Scholar]
- 3. Onken M. D., Worley L. A., Char D. H., et al., “Collaborative Ocular Oncology Group Report Number 1: Prospective Validation of a Multi‐Gene Prognostic Assay in Uveal Melanoma,” Ophthalmology 119 (2012): 1596–1603. [DOI] [PMC free article] [PubMed] [Google Scholar]
- 4. Flowers G. P., Sanor L. D., and Crews C. M., “Lineage Tracing of Genome‐Edited Alleles Reveals High Fidelity Axolotl Limb Regeneration,” eLife 6 (2017): e25726, 10.7554/eLife.25726. [DOI] [PMC free article] [PubMed] [Google Scholar]
- 5. Gerber T., Murawala P., Knapp D., et al., “Single‐Cell Analysis Uncovers Convergence of Cell Identities During Axolotl Limb Regeneration,” Science 362 (2018): eaaq0681. [DOI] [PMC free article] [PubMed] [Google Scholar]
- 6. Goss R. J., “Prospects for Regeneration in Man,” Clinical Orthopaedics and Related Research (1976–2007) 151 (1980): 270. [PubMed] [Google Scholar]
- 7. Wagner D. E., Wang I. E., and Reddien P. W., “Clonogenic Neoblasts Are Pluripotent Adult Stem Cells That Underlie Planarian Regeneration,” Science 332 (2011): 811–816. [DOI] [PMC free article] [PubMed] [Google Scholar]
- 8. Zeng A., Li H., and Guo L., “Prospectively Isolated Tetraspanin+ Neoblasts Are Adult Pluripotent Stem Cells Underlying Planaria Regeneration,” Cell 173 (2018): 1593–1608. [DOI] [PMC free article] [PubMed] [Google Scholar]
- 9. Gargioli C. and Slack J. M., “Cell Lineage Tracing During Xenopus Tail Regeneration,” Development 131 (2004): 2669–2679. [DOI] [PubMed] [Google Scholar]
- 10. Jopling C., Sleep E., Raya M., Martí M., Raya A., and Belmonte J. C. I., “Zebrafish Heart Regeneration Occurs by Cardiomyocyte Dedifferentiation and Proliferation,” Nature 464 (2010): 606–609. [DOI] [PMC free article] [PubMed] [Google Scholar]
- 11. Kikuchi K., Holdway J. E., Werdich A. A., et al., “Primary Contribution to Zebrafish Heart Regeneration by Gata4+ Cardiomyocytes,” Nature 464 (2010): 601–605. [DOI] [PMC free article] [PubMed] [Google Scholar]
- 12. Knopf F., Hammond C., Chekuru A., et al., “Bone Regenerates via Dedifferentiation of Osteoblasts in the Zebrafish Fin,” Developmental Cell 20 (2011): 713–724. [DOI] [PubMed] [Google Scholar]
- 13. Hulett R. E., Kimura J. O., Bolaños D. M., et al., “Acoel Single‐Cell Atlas Reveals Expression Dynamics and Heterogeneity of Adult Pluripotent Stem Cells,” Nature Communications 14 (2023): 2612. [DOI] [PMC free article] [PubMed] [Google Scholar]
- 14. Leigh N. D., Dunlap G. S., Johnson K., et al., “Transcriptomic Landscape of the Blastema Niche in Regenerating Adult Axolotl Limbs at Single‐Cell Resolution,” Nature Communications 9 (2018): 5153. [DOI] [PMC free article] [PubMed] [Google Scholar]
- 15. Nowoshilow S., Schloissnig S., Fei J.‐F., et al., “The Axolotl Genome and the Evolution of Key Tissue Formation Regulators,” Nature 554 (2018): 50–55. [DOI] [PubMed] [Google Scholar]
- 16. Arnaout M. A., “The Integrin Receptors: From Discovery to Structure to Medicines,” Immunological Reviews 329 (2025): e13433, 10.1111/imr.13433. [DOI] [PMC free article] [PubMed] [Google Scholar]
- 17. Huttenlocher A. and Horwitz A. R., “Integrins in Cell Migration,” Cold Spring Harbor Perspectives in Biology 3 (2011): a005074. [DOI] [PMC free article] [PubMed] [Google Scholar]
- 18. Shi L., Fu S., Fahim S., et al., “TNF‐Alpha Stimulation Increases Dental Pulp Stem Cell Migration In Vitro through Integrin Alpha‐6 Subunit Upregulation,” Archives of Oral Biology 75 (2017): 48–54. [DOI] [PubMed] [Google Scholar]
- 19. Kassmer S. H., Langenbacher A. D., and De Tomaso A. W., “Integrin‐Alpha‐6+ Candidate Stem Cells Are Responsible for Whole Body Regeneration in the Invertebrate Chordate Botrylloides Diegensis,” Nature Communications 11 (2020): 4435. [DOI] [PMC free article] [PubMed] [Google Scholar]
- 20. Bourlat S. J., Juliusdottir T., Lowe C. J., et al., “Deuterostome Phylogeny Reveals Monophyletic Chordates and the New Phylum Xenoturbellida,” Nature 444 (2006): 85–88. [DOI] [PubMed] [Google Scholar]
- 21. Kassmer S. H., Nourizadeh S., and Tomaso A. D. D., “Cellular and Molecular Mechanisms of Regeneration in Colonial and Solitary Ascidians,” Developmental Biology 4482 (2019): 271–278, 10.1016/j.ydbio.2018.11.021. [DOI] [PubMed] [Google Scholar]
- 22. Jeffery W. R., “The Tunicate Ciona: A Model System for Understanding the Relationship Between Regeneration and Aging,” Invertebrate Reproduction & Development 59 (2015): 17–22. [DOI] [PMC free article] [PubMed] [Google Scholar]
- 23. Mazet F. and Shimeld S. M., “Molecular Evidence From Ascidians for the Evolutionary Origin of Vertebrate Cranial Sensory Placodes,” Journal of Experimental Zoology Part B: Molecular and Developmental Evolution 304 (2005): 340–346. [DOI] [PubMed] [Google Scholar]
- 24. Auger H., Sasakura Y., Joly J.‐S., and Jeffery W. R., “Regeneration of Oral Siphon Pigment Organs in the Ascidian Ciona intestinalis ,” Developmental Biology 339 (2010): 374–389. [DOI] [PMC free article] [PubMed] [Google Scholar]
- 25. Hamada M., Goricki S., Byerly M. S., Satoh N., and Jeffery W. R., “Evolution of the Chordate Regeneration Blastema: Differential Gene Expression and Conserved Role of Notch Signaling During Siphon Regeneration in the Ascidian Ciona,” Developmental Biology 405 (2015): 304–315. [DOI] [PMC free article] [PubMed] [Google Scholar]
- 26. Jeffery W. R., “Distal Regeneration Involves the Age Dependent Activity of Branchial Sac Stem Cells in the Ascidian Ciona intestinalis ,” Regeneration 2 (2015): 1–18. [DOI] [PMC free article] [PubMed] [Google Scholar]
- 27. Rinkevich Y., Rosner A., Rabinowitz C., Lapidot Z., Moiseeva E., and Rinkevich B., “Piwi Positive Cells That Line the Vasculature Epithelium, Underlie Whole Body Regeneration in a Basal Chordate,” Developmental Biology 345 (2010): 94–104. [DOI] [PubMed] [Google Scholar]
- 28. Tiozzo S. and De Tomaso A. W., “Functional Analysis of Pitx During Asexual Regeneration in a Basal Chordate,” Evolution & Development 11 (2009): 152–162. [DOI] [PubMed] [Google Scholar]
- 29. Zhou Y., Kipps T. J., and Zhang S., “Wnt5a Signaling in Normal and Cancer Stem Cells,” Stem Cells International 2017 (2017): 5295286. [DOI] [PMC free article] [PubMed] [Google Scholar]
- 30. Schreck C., Istvánffy R., Ziegenhain C., et al., “Niche WNT5A Regulates the Actin Cytoskeleton During Regeneration of Hematopoietic Stem Cells,” Journal of Experimental Medicine 214 (2017): 165–181. [DOI] [PMC free article] [PubMed] [Google Scholar]
- 31. Katoh M., “WNT Signaling in Stem Cell Biology and Regenerative Medicine,” Current Drug Targets 9 (2008): 565–570. [DOI] [PubMed] [Google Scholar]
- 32. Henrique D., Abranches E., Verrier L., and Storey K. G., “Neuromesodermal Progenitors and the Making of the Spinal Cord,” Development 142 (2015): 2864–2875. [DOI] [PMC free article] [PubMed] [Google Scholar]
- 33. Krivega M., Essahib W., and Van de Velde H., “WNT3 and Membrane‐Associated β‐Catenin Regulate Trophectoderm Lineage Differentiation in Human Blastocysts,” Molecular Human Reproduction 21 (2015): 711–722. [DOI] [PubMed] [Google Scholar]
- 34. Li M. and Brasseur J. G., “Non‐Steady Peristaltic Transport in Finite‐Length Tubes,” Journal of Fluid Mechanics 248 (1993): 129–151. [Google Scholar]
- 35. Kou W., Pandolfino J. E., Kahrilas P. J., and Patankar N. A., “Simulation Studies of Circular Muscle Contraction, Longitudinal Muscle Shortening, and Their Coordination in Esophageal Transport,” American Journal of Physiology. Gastrointestinal and Liver Physiology 309 (2015): G238–G247. [DOI] [PMC free article] [PubMed] [Google Scholar]
- 36. Krebsbach P. H. and Villa‐Diaz L. G., “The Role of Integrin Α6 (CD49f) in Stem Cells: More Than a Conserved Biomarker,” Stem Cells and Development 26 (2017): 1090–1099. [DOI] [PMC free article] [PubMed] [Google Scholar]
- 37. Wilschut K. J., van Tol H. T., Arkesteijn G. J., Haagsman H. P., and Roelen B. A., “Alpha 6 Integrin Is Important for Myogenic Stem Cell Differentiation,” Stem Cell Research 7 (2011): 112–123. [DOI] [PubMed] [Google Scholar]
- 38. Al‐Obaide M., Ishmakej A., Brown C., et al., “The Potential Role of Integrin Alpha 6 in Human Mesenchymal Stem Cells,” Frontiers in Genetics 13 (2022): 968228. [DOI] [PMC free article] [PubMed] [Google Scholar]
- 39. Seifert A. W. and Muneoka K., “The Blastema and Epimorphic Regeneration in Mammals,” Developmental Biology 433 (2018): 190–199. [DOI] [PMC free article] [PubMed] [Google Scholar]
- 40. Brown F. D., Keeling E. L., Le A. D., et al., “Whole Body Regeneration in a Colonial Ascidian, Botrylloides Violaceus,” Journal of Experimental Zoology Part B: Molecular and Developmental Evolution 312 (2009): 885–900. [DOI] [PubMed] [Google Scholar]
- 41. Kawamura K., Fujiwara S., and Sugino Y. M., “Budding‐Specific Lectin Induced in Epithelial Cells Is an Extracellular Matrix Component for Stem Cell Aggregation in Tunicates,” Development 113 (1991): 995–1005. [DOI] [PubMed] [Google Scholar]
- 42. Stoner D. S. and Weissman I. L., “Somatic and Germ Cell Parasitism in a Colonial Ascidian: Possible Role for a Highly Polymorphic Allorecognition System,” Proceedings of the National Academy of Sciences 93 (1996): 15254–15259. [DOI] [PMC free article] [PubMed] [Google Scholar]
- 43. Tiozzo S., Brown F. D., and De Tomaso A. W., “Regeneration and Stem Cells in Ascidians,” in Stem Cells: From Hydra to Man (Springer, 2008), 95–112. [Google Scholar]
- 44. Jeffery W. R., “Closing the Wounds: One Hundred and Twenty Five Years of Regenerative Biology in the Ascidian C Iona Intestinalis,” Genesis 53 (2015): 48–65. [DOI] [PMC free article] [PubMed] [Google Scholar]
- 45. Yokoyama H., Ogino H., Stoick‐Cooper C. L., Grainger R. M., and Moon R. T., “Wnt/β‐Catenin Signaling has an Essential Role in the Initiation of Limb Regeneration,” Developmental Biology 306 (2007): 170–178. [DOI] [PMC free article] [PubMed] [Google Scholar]
- 46. Ghosh S., Roy S., Séguin C., Bryant S. V., and Gardiner D. M., “Analysis of the Expression and Function of Wnt‐5a and Wnt‐5b in Developing and Regenerating Axolotl ( Ambystoma mexicanum ) Limbs,” Development, Growth & Differentiation 50 (2008): 289–297. [DOI] [PubMed] [Google Scholar]
- 47. Walczyńska K. S., Zhu L., and Liang Y., “Insights Into the Role of the Wnt Signaling Pathway in the Regeneration of Animal Model Systems,” International Journal of Developmental Biology 67 (2023): 65–78. [DOI] [PubMed] [Google Scholar]
Associated Data
This section collects any data citations, data availability statements, or supplementary materials included in this article.
Supplementary Materials
Data S1.
Data Availability Statement
The RNA‐sequencing data generated in this study have been deposited in the NCBI Sequence Read Archive (SRA) under the accession number PRJNA1240853 and are publicly available. All other data supporting the findings of this study are available from the corresponding author upon reasonable request.