Abstract
The tumor suppressor wild-type p53 can induce apoptosis. M1-t-p53 myeloid leukemic cells have a temperature-sensitive p53 protein that changes its conformation to wild-type p53 after transfer from 37°C to 32°C. We have now found that these cells showed an early lysosomal rupture after transfer to 32°C. Mitochondrial damage, including decreased membrane potential and release of cytochrome c, and the appearance of apoptotic cells occurred later. Lysosomal rupture, mitochondrial damage, and apoptosis were all inhibited by the cytokine IL-6. Some other compounds can also inhibit apoptosis induced by p53. The protease inhibitor N-tosyl-l-phenylalanine chloromethyl ketone inhibited the decrease in mitochondrial membrane potential and cytochrome c release, the Ca2+-ATPase inhibitor thapsigargin inhibited only cytochrome c release, and the antioxidant butylated hydroxyanisole inhibited only the decrease in mitochondrial membrane potential. In contrast to IL-6, these other compounds that inhibited some of the later occurring mitochondrial damage did not inhibit the earlier p53-induced lysosomal damage. The results indicate that apoptosis is induced by p53 through a lysosomal-mitochondrial pathway that is initiated by lysosomal destabilization, and that this pathway can be dissected by using different apoptosis inhibitors. These findings on the induction of p53-induced lysosomal destabilization can also help to formulate new therapies for diseases with apoptotic disorders.
Apoptosis is an active form of cell death that plays an essential role in development and survival by eliminating damaged or otherwise unwanted cells (reviewed in refs. 1–4). Impaired regulation of apoptosis leads to a variety of pathological conditions, such as neurodegeneration, autoimmunity, chronic inflammation, AIDS, and cancer (reviewed in refs. 4–7). The tumor suppressor wild-type p53 guards against proliferation of damaged cells either by inhibiting cell division and facilitating DNA repair (reviewed in refs. 8 and 9) or by inducing apoptosis (2, 10–13). Many genes are transcriptionally activated or repressed by p53 (14–17), including activation of proapoptotic genes (16, 18–24) and repression of antiapoptotic genes (25, 26). Apoptosis-inducing signals cause translocation of proapoptotic proteins of the Bcl-2 family from the cytoplasm to the outer mitochondrial membrane, and facilitate the release of some components including cytochrome c from mitochondria into the cytosol (27–29). Once released, cytochrome c binds to Apaf-1 and pro-caspase 9, resulting in proteolytic activation of caspase-9. This result leads to proteolytic activation of downstream caspases, including caspase 3, that degrade a variety of cellular proteins and bring about destruction of the cell (27–29). The anti-apoptotic Bcl-2 family proteins interfere with this release of cytochrome c and thus with caspase activation (27–29). The balance between expression of apoptosis-inducing vs. apoptosis-suppressing genes can be changed by the tumor suppressor wild-type p53 in favor of apoptosis-inducing genes, and this result can explain the ability of wild-type p53 to induce apoptosis (18, 30).
Recent studies from our laboratory and others have shown that lysosomal rupture is an early event when apoptosis is initiated by lysosomal-damaging agents, oxidative stress, oxidized lipids, serum withdrawal, or Fas ligation (31–42). Overexpression of Bcl-2 can inhibit induction of lysosomal damage by oxidative stress (43). We have now studied whether p53-induced apoptosis involves early lysosomal rupture, the relationship between lysosomal and mitochondrial damage induced by p53, and dissection of these events by using different apoptosis inhibitors. In these studies we have used M1 myeloid leukemic cells transfected with the Val-135 temperature-sensitive p53 gene (M1-t-p53). These were also the cells used for the experiments that first showed induction of apoptosis by wild-type p53 (10). These cells undergo apoptosis at 32°C when the p53 protein behaves like a wild-type p53, but not at 37°C when the p53 protein behaves like a mutant p53 (10). The results of the present experiments indicate that p53 induces apoptosis by a lysosomal-mitochondrial pathway initiated by lysosomal destabilization.
Materials and Methods
Chemicals.
Recombinant human IL-6 was kindly provided by Steve Clark (Genetics Institute, Cambridge, MA) and used at a final concentration of 50 ng/ml. The Ca2+ mobilizing endoplasmic reticulum Ca2+-ATPase inhibitor thapsigargin (TG), the antioxidant butylated hydroxyanisole (BHA), and the protease inhibitor N-tosyl-l-phenylalanine chloromethyl ketone (TPCK) were from Sigma and used at final concentrations of 10 nM, 80 μM, and 1 μM, respectively. The lysosomotropic fluorochromes used were acridine orange (AO; Gurr, London) and LysoTracker Red DND-99 (Molecular Probes, Eugene, OR, USA). The mitochondrial membrane potential marker used was tetramethyl-rhodamine ethyl ester (TMRE; Molecular Probes). Cell culture media and serum were from GIBCO.
Cells and Culture Conditions.
M1 mouse myeloid leukemic cells, which do not express p53, were transfected with a plasmid containing a temperature-sensitive p53 [135 Ala → Val] (M1-t-p53) (10). This p53 protein has a wild-type p53 conformation and activity at 32°C, but not at 37°C. The cells were grown in DMEM with 10% heat-inactivated (56°C, 30 min) horse serum in a humidified atmosphere (10% CO2/90% air) at 37°C. To induce apoptosis, cells were transferred from 37°C to 32°C (10). The apoptosis inhibitors were added at the time of the transfer.
Lysosomal Integrity Assays.
Three assays were used.
AO-relocation.
Cells were exposed to an AO solution (5 μg/ml) in DMEM plus horse serum (complete medium) for 15 min at 37°C, rinsed in complete medium, and then cultured at 37°C or 32°C. Green cytosolic fluorescence of 10,000 cells per sample was determined by flow cytometry using the FL1 channel (FACScan; Becton Dickinson).
AO-uptake.
After culture at 37°C or 32°C, cells were exposed to AO as above. Red lysosomal fluorescence of 10,000 cells per sample was determined by flow cytometry using the FL3 channel.
LysoTracker Red-uptake.
The acidotropic dye LysoTracker Red DND-99 was diluted in DMEM. Cells were cultured at 37°C or 32°C and resuspended in prewarmed (37°C) medium containing 50 nM LysoTracker Red for 30 min. Cells were then resuspended in fresh prewarmed medium, and red lysosomal fluorescence of 10,000 cells per sample was determined by flow cytometry using the FL3 channel.
cellquest software was used to analyze all of the data from flow cytometric experiments.
Mitochondrial Membrane Potential.
TMRE is a lipophilic and weakly acidic dye that acts as a voltage-sensitive probe and partitions to the negatively charged mitochondrial matrix. Decrease in the mitochondrial membrane potential, and thus the proton gradient over the membrane, is paralleled by a reduction of TMRE-induced fluorescence. Cells grown at 37°C or 32°C for 5–10 h were incubated with 20 nM TMRE for 30 min at room temperature and washed with PBS, and red mitochondrial fluorescence of 10,000 cells per sample was determined by flow cytometry by using the FL3 channel.
Cytochrome c Release and Western Blots.
Cells were washed in PBS and pelleted by centrifugation at 800 × g for 5 min. Pellets (107 cells) were resuspended in 150 μl of Hepes-sucrose buffer [20 mM Hepes, pH 7.2/5 mM MgCl2/10 mM KCl/1 mM EDTA/250 mM sucrose/1 mM PMSF/1 μg/ml each of aprotinin, leupeptin and pepstatin (Sigma mixture)/25 mM NaF/1 mM sodium vanadate] and were permeabilized by adding 0.025% (vol/vol) digitonin (Sigma). After 2 min at room temperature, cells were pelleted by centrifugation (12,000 × g, 1 min, 4°C), and the supernatant was collected as the “cytosolic” fraction. Protein concentration was determined by using Bradford reagent (Bio-Rad). Equal amounts of protein were mixed with Laemmli sample buffer (4% SDS, 20% glycerol, 10% 2-mercaptoethanol, and 0.125 M Tris⋅HCl), heated at 95°C for 5 min and loaded on an 8% polyacrylamide-SDS gel. After electrophoresis, proteins were transferred to cellulose nitrate 0.2-μm membranes (Schleicher & Schüll, Dassel, Germany). Loading equivalence and transfer efficiency were monitored by Ponceau S staining. The membranes were then incubated for 16 h at 4°C with monoclonal anti-mouse cytochrome c antibody (mAb 7H8.2C12, R & D Systems) followed by a 2-h incubation at room temperature with horseradish peroxidase-conjugated anti-mouse IgG antibodies (Sigma). Signals were developed by using the ECL kit (Amersham Pharmacia), and the membranes were exposed to x-ray film (Fuji) and developed.
Annexin V-Propidium Iodide Staining.
Normal, apoptotic, and necrotic cells were distinguished by using the annexin V-propidium iodide (PI) kit according to the manufacturer's instruction (Roche Diagnostics). After washing in PBS, cells were resuspended for 10 min in the staining solution and analyzed by flow cytometry. The percentages of viable and dead cells were determined from 10,000 cells per sample, by using the FL1 channel for annexin V and the FL2 channel for PI.
Transmission Electron Microscopy.
Cells grown at either 37°C or 32°C for 14 or 24 h were spun down, fixed in 2% glutaraldehyde in 0.1 M cacodylate buffer with 0.1 M sucrose (4 h at room temperature), and postfixed in 1% OsO4 in 0.1 M cacodylate buffer without sucrose (1 h at room temperature). After standard embedding in Epon-812, ultrathin sections were cut with a diamond knife and contrasted with uranyl acetate-lead citrate. The samples were viewed in a JEOL 1200 EX electron microscope operated at 80 kV. Micrographs were taken randomly from different sections of four cultures for each experimental condition.
Statistical Analysis.
Results were expressed as the mean ± SE. Statistically significant differences among groups were evaluated with the use of both ANOVA and Kruskal–Wallis tests. The Newman–Keuls test was used for post-ANOVA individual comparison of the means. P < 0.05 was considered statistically significant.
Results
Lysosomal Rupture Is an Early Event in p53-Induced Apoptosis.
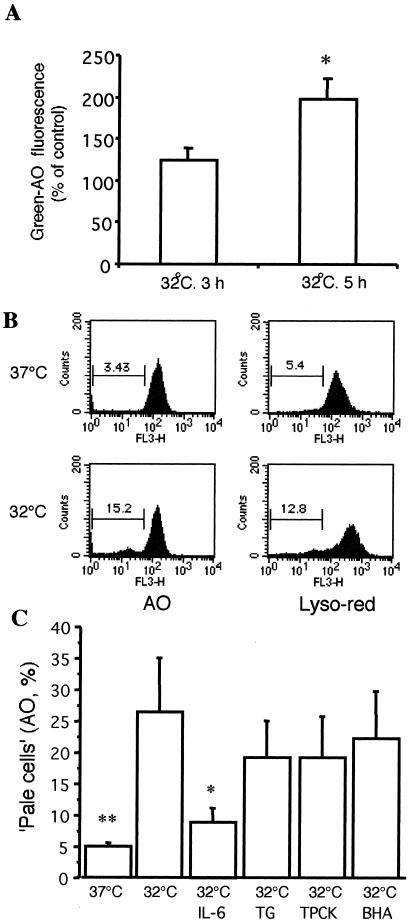
Transfer of M1-t-p53 cells from 37°C to 32°C, which induces wild-type p53 conformation and activity, resulted in apoptosis first detected after 8–10 h as measured on May-Grünwald-Giemsa-stained smears (10, 44). To determine the effect of p53 activity on lysosomal stability, two lysosomotropic fluorescence probes, AO and LysoTracker Red, were used. The highly sensitive AO-relocation method detected release of AO from ruptured lysosomes to the cytosol, with resulting enhanced cellular green fluorescence, already at 5 h after transfer to 32°C (Fig. 1A). The sensitivity of the AO-relocation method is due to the fact that AO is a metachromatic fluorophore that shows green fluorescence at low concentrations, in combination with the higher sensitivity of most photomultipliers to green than to red photons. The results from the highly sensitive AO-relocation method show that wild-type p53 initiates an early lysosomal destabilization pathway of apoptosis. Results from the less sensitive AO and LysoTracker Red-uptake methods, also demonstrated lysosomal rupture after 10 h at 32°C (Fig. 1 B and C) by showing increased numbers of “pale cells”, i.e., cells with reduced numbers of AO- and LysoTracker Red-accumulating lysosomes.
Figure 1.
(A) Early lysosomal rupture assayed with the AO-relocation method. M1-t-p53 cells were stained with AO, rinsed, and cultured at 37°C or 32°C for another 3 h or 5 h. Increase in green-AO fluorescence, indicating release of AO from ruptured lysosomes to the cytosol (10,000 cells per sample), was measured by flow cytometry (means ± SE; n = 6). *, P < 0.05 vs. control at 37°C. (B) Lysosomal rupture assayed with the AO-uptake and LysoTracker Red-uptake methods. M1-t-p53 cells were cultured at 37°C or 32°C for 10 h and then exposed to AO or LysoTracker Red as described in Materials and Methods. Intensity of lysosomal fluorescence from 10,000 cells per sample was measured by flow cytometry. Cells with decreased red fluorescence (“pale” cells) were gated, and their percentages are indicated. (C) Inhibition of lysosomal rupture by IL-6 but not by some other apoptosis inhibitors. After culture of M1-t-p53 cells at 37°C or 32°C for 10 h, cells were exposed to AO and then analyzed by the AO-uptake method. Red lysosomal fluorescence intensity was measured by flow cytometry. (Means ± SE, n = 6). *, P < 0.05 and **, P < 0.01 vs. cells cultured at 32°C without any further treatment.
We have previously shown that induction of p53-induced apoptosis in M1-t-p53 cells can be inhibited by IL-6 and some other cytokines, by the calcium-mobilizing compound TG, the antioxidant BHA, and various protease inhibitors, including TPCK (2, 10, 18, 25, 44–48). In view of the various modes of action of these apoptosis inhibitors, we examined their effects on lysosomal stability in p53-induced apoptosis. As shown in Fig. 1C, lysosomal rupture was completely inhibited by IL-6 after 10 h at the apoptosis-inducing temperature of 32°C. In contrast, the apoptosis inhibitors TG, TPCK, and BHA did not show a significant effect on p53-induced lysosomal rupture (Fig. 1C).
Mitochondrial Damage Occurs After Lysosomal Rupture in p53Induced Apoptosis.
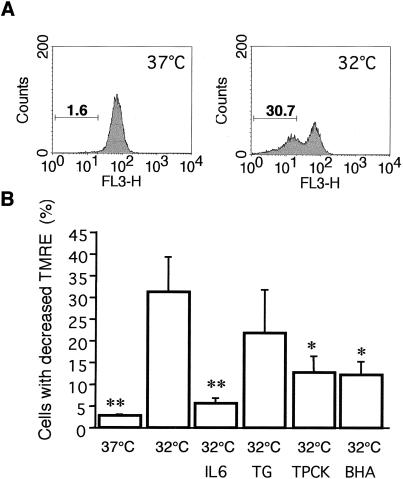
Perturbations in mitochondrial function, involving a decrease in membrane potential (ΔΨm) and cytochrome c release, are important events in apoptosis (27–29). We determined whether p53-induced apoptosis in M1-t-p53 cells is also associated with changes in ΔΨm and release of cytochrome c and, if so, the temporal relationship of such changes to lysosomal rupture. At 5 h after transfer of cells from 37°C to 32°C, there was no significant decrease in ΔΨm. After 10 h at 32°C, a substantial increase in the number of cells with decreased ΔΨm (low mitochondrial uptake of TMRE) was detected (Fig. 2). This change was almost completely inhibited by IL-6, and significantly inhibited by TPCK and BHA (Fig. 2B). These results indicate that some oxidative mechanism as well as serine and cysteine proteases are involved in the p53-induced decrease of mitochondrial membrane potential. Although TG is an effective inhibitor of p53-induced apoptosis in M1-t-p53 cells (46, 47), it did not significantly inhibit the ΔΨm decrease induced by p53 (Fig. 2B).
Figure 2.
Decrease of mitochondrial membrane potential (ΔΨm) and its inhibition by different apoptosis inhibitors. (A) Mitochondrial membrane potential from 10,000 M1-t-p53 cells per sample was measured by flow cytometry. Cells with decreased uptake of TMRE after 10 h at 37°C or 32°C were gated, and their percentages are indicated. (B) M1-t-p53 cells were cultured at 37°C or 32°C for 10 h without or with apoptosis inhibitors, and TMRE-induced fluorescence was measured (means ± SE; n = 4). *, P < 0.05; and **, P < 0.01 vs. cells cultured at 32°C without any further treatment.
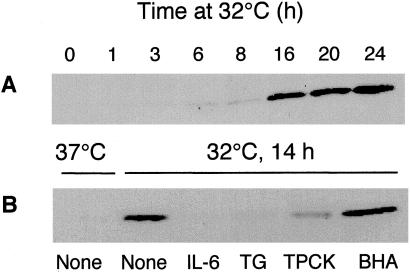
Analysis of cytochrome c release from mitochondria to the cytosol showed only a weak release after 6–8 h at 32°C, and a very substantial release at 14 h and later (Fig. 3). The release of cytochrome c after 14 h was completely inhibited by IL-6, almost completely by TG, and partly by TPCK, but was not inhibited by BHA (Fig. 3B). The results indicate that IL-6 effectively inhibits all of the tested p53-induced changes in lysosomes and mitochondria, whereas the other apoptosis inhibitors inhibited changes only in mitochondria. The ability of BHA to inhibit p53-induced decrease in ΔΨm but not release of cytochrome c, and the ability of TG to inhibit release of cytochrome c but not the decrease in ΔΨm indicate that these apoptosis-associated mitochondrial events are separately regulated.
Figure 3.
Release of cytochrome c into cytosol and its inhibition by different apoptosis inhibitors. (A) M1-t-p53 cells were cultured at 32°C for 1–24 h. (B) Cells were cultured at 37°C or at 32°C for 14 h without (None) or with different apoptosis inhibitors. Cytosolic cytochrome c was determined by Western blotting.
Apoptosis and Postapoptotic Necrosis After Lysosomal Rupture in p53-Induced Apoptosis.
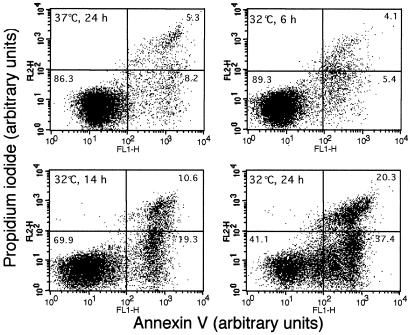
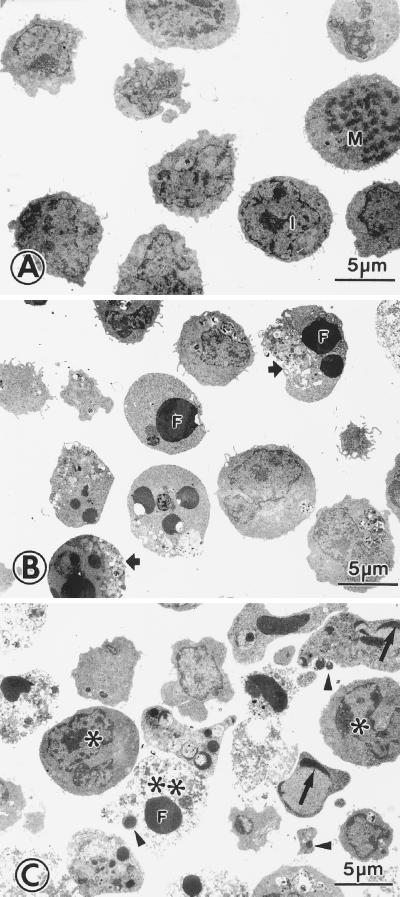
By using May-Grünwald-Giemsa stained smears, the first morphologically detectable apoptotic cells appeared 8–10 h after transfer of M1-t-p53 cells from 37°C to 32°C. Further incubation at this permissive temperature resulted in accumulation of apoptotic cells that underwent secondary necrotic changes detected by trypan blue staining (44). Analysis of apoptosis and necrosis by the combined Annexin V and PI staining showed no increase in apoptotic or necrotic cells above background levels 6 h after transfer to 32°C, but both apoptotic and necrotic cells were detected after 14 h (Fig. 4). Electron microscopy showed that, after transfer from 37°C to 32°C, there were cells with enhanced autophagocytosis, nuclear capping of condensed chromatin, apoptotic bodies, and postapoptotic necrosis (Fig. 5). The results indicate that p53-induced lysosomal rupture was eventually followed by apoptosis and postapoptotic necrosis.
Figure 4.
Induction of apoptosis and postapoptotic necrosis. M1-t-p53 cells were cultured at 37°C for 24 h or at 32°C for 6, 14, and 24 h and then stained with a combination of Annexin V and PI to assay for viable, apoptotic, and necrotic cells. Fluorescence intensities were measured by flow cytometry using FL1 (Annexin V) and FL2 (PI) channels. The values shown in the lower left, lower right, and upper right quadrants of each panel represent the percentage of viable, apoptotic, and necrotic cells, respectively.
Figure 5.
Electron microscopy of apoptotic and postapoptotic necrotic cells. M1-t-p53 cells were cultured at 37°C (A) or at 32°C for 14 h (B) and 24 h (C). Most cells cultured at 37°C were in interphase (I), and there were a few mitotic figures (M). Cells cultured at 32°C showed apoptotic changes, including autophagocytotic vacuoles (short arrows), nuclear capping of condensed chromatin (long arrows), chromatin condensation along nuclear membranes (∗), condensed-fragmented nuclei (F), and apoptotic bodies (arrow heads). At 24 h, many cells showed postapoptotic necrosis (∗∗).
Discussion
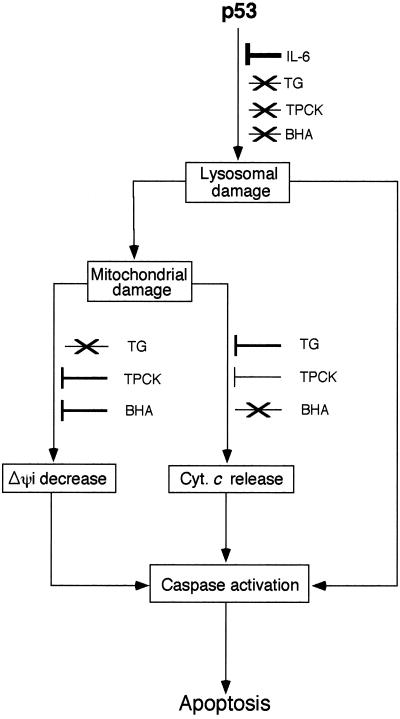
The present experiments indicate that p53-induced apoptosis involves early lysosomal destabilization and later mitochondrial damage, including the decrease of ΔΨm and release of cytochrome c. The findings indicate that p53-induced apoptosis involves a lysosomal-mitochondrial pathway in which lysosomal destabilization plays an initiating role. Lysosomes have been found to act as initiators of apoptosis after exposure to a variety of lysosomal damaging agents, suggesting that some lysosomal rupture may be a general event in apoptosis (reviewed in ref. 49). It has been suggested that lysosomes are rather stable organelles that break only when the cell is already dying for other reasons, but do not initiate cell damage by releasing hydrolytic enzymes into the cytosol. However, the present and other studies (31–37) have shown that lysosomes are vulnerable organelles that can have an early and initiating role in apoptosis. Some of these studies show that minor lysosomal rupture produces degenerative alterations that are rapidly and efficiently repaired by autophagocytotic processes (50). This finding suggests that minor lysosomal leakage might be a rather common phenomenon, and not until lysosomal damage is substantial would cells be unable to survive (reviewed in ref. 49). The release of lysosomal enzymes may cause mitochondrial damage directly (51) or indirectly (39, 42, 51), followed by cytochrome c release, apoptosome formation with Apaf-1, and caspase activation (Fig. 6). There may also be a direct activation of caspases by a lysosomal protease such as cathepsin B (52).
Figure 6.
Model of the lysosomal-mitochondrial pathway in p53-induced apoptosis and differential inhibition of various stages by different apoptosis inhibitors. There may be a direct activation of caspases by enzymes released from lysosomes. Inhibition of lysosomal damage by IL-6 also inhibits the initiation of this process. Cyt. c, cytochrome c. Arrow indicates pathway, ⊥, inhibition of pathway, and ×, pathway not inhibited. The width of ⊥ indicates the degree of inhibition.
Several proteases, such as granzyme B (53, 54), cathepsins B and D (39, 41, 52, 55–57), and caspases (58, 59) appear to be involved in apoptosis induced by various agents. In M1-t-p53 cells, induction of apoptosis by wild-type p53 can be inhibited by the cathepsin B inhibitor benzyloxycarbonyl-Phe-Ala-fluoromethyl ketone (Z-FAfmk) and by some other protease inhibitors including TPCK, but not by the cathepsin D inhibitor pepstatin A or some other protease inhibitors including Nα-p-tosyl-l-lysine chloromethyl ketone (45). Apoptosis suppression by Z-FAfmk and TPCK is upstream of caspase activation (48). Our present findings that the protease inhibitor TPCK inhibits p53-induced decrease of mitochondrial membrane potential and cytochrome c release places the role of certain serine and/or cysteine proteases upstream of mitochondrial damage in the p53-induced apoptosis pathway (Fig. 6). Such serine and/or cysteine proteases may serve as important mediators linking early lysosomal alterations to the mitochondrial pathway in p53-induced apoptosis. The relocation of cytochrome c, Smac/Diablo, and apoptosis-inducing factor (AIF) to the cytosol has been considered a basic event in apoptosis that is followed by caspase activation and apoptotic cell death (27–29). The present results indicate that p53 activation induces an early lysosomal destabilization, before the decrease of mitochondrial membrane potential and cytochrome c release. The mitochondrial damage is then followed by apoptosis and postapoptotic necrosis.
M1-t-p53 cells do not show an early increase in cellular H2O2 production or lipid peroxidation before apoptosis, and no decrease is found in these properties in cells protected from apoptosis by IL-6 (44). However, p53-mediated apoptosis is enhanced by H2O2 and is inhibited by various antioxidants, indicating that the intrinsic degree of cellular oxidative stress can regulate p53-induced apoptosis (44). The present study indicates that, although the antioxidant BHA inhibited p53-induced decrease in mitochondrial membrane potential, it did not inhibit lysosomal alterations, nor did it inhibit p53-induced mitochondrial cytochrome c release. BHA, therefore, acts upstream of caspase activation by blocking some p53-induced mitochondrial damage (Fig. 6).
Cytokines can decrease apoptosis in cancer cells, and the inhibition of cytokine activity may improve cancer therapy by enhancing apoptosis (2, 8, 18). We have previously shown that the cytokine IL-6 can completely inhibit p53-induced apoptosis (2, 8, 9, 18, 25, 44–46, 48) and that calcium-mobilizing compounds such as TG also effectively inhibit apoptosis by a calcineurin-dependent pathway (18, 46, 47). Our present results show that IL-6 inhibits p53-induced lysosomal damage that leads to mitochondrial damage, whereas TG, TPCK, and BHA inhibit some mitochondrial damage but not lysosomal damage. TG did not inhibit p53-induced decrease in mitochondrial membrane potential, but effectively inhibits cytochrome c release from mitochondria. TG also effectively inhibits the resulting caspase activation and apoptosis (18, 46, 47). The results thus show that, although IL-6, TG, TPCK, and BHA inhibit p53-induced apoptosis upstream of caspase activation (18, 45–47), they have distinct abilities to inhibit different changes in the integrity of lysosomes and mitochondria (Fig. 6).
p53 has a central role in apoptotic processes involved in several disorders, including neurodegenerative, autoimmune, and inflammatory diseases and malignancies. Our findings that p53 induces apoptosis initiated by lysosomal destabilization can help to formulate new therapies for these disorders.
Acknowledgments
This work was supported by the Swedish Medical Research Council (Grant 3490 to X.M.Y.), the Swedish Cancer Foundation (Grant 4296 to U.T.B.), and by research grants from the Dolfi and Lola Ebner Center for Biomedical Research, the Otolaryngology Research Foundation, and Mrs. Bernice Gershenson (to L.S.).
Abbreviations
- AO
acridine orange
- BHA
butylated hydroxyanisole
- TG
thapsigargin
- TPCK
N-tosyl-l-phenylalanine chloromethyl ketone
- TMRE
tetramethyl-rhodamine ethyl ester
- PI
propidium iodide
References
- 1.Raff M C. Nature (London) 1992;356:397–400. doi: 10.1038/356397a0. [DOI] [PubMed] [Google Scholar]
- 2.Sachs L, Lotem J. Blood. 1993;82:15–21. [PubMed] [Google Scholar]
- 3.Vaux D L, Korsmeyer S J. Cell. 1999;96:245–254. doi: 10.1016/s0092-8674(00)80564-4. [DOI] [PubMed] [Google Scholar]
- 4.Strasser A, O'Connor L, Dixit V M. Annu Rev Biochem. 2000;69:217–245. doi: 10.1146/annurev.biochem.69.1.217. [DOI] [PubMed] [Google Scholar]
- 5.Thompson C B. Science. 1995;267:1456–1462. doi: 10.1126/science.7878464. [DOI] [PubMed] [Google Scholar]
- 6.Krammer P H. Nature (London) 2000;407:789–795. doi: 10.1038/35037728. [DOI] [PubMed] [Google Scholar]
- 7.Yuan J, Yankner B A. Nature (London) 2000;407:802–809. doi: 10.1038/35037739. [DOI] [PubMed] [Google Scholar]
- 8.Levine A J. Cell. 1997;88:323–331. doi: 10.1016/s0092-8674(00)81871-1. [DOI] [PubMed] [Google Scholar]
- 9.Vogelstein B, Lane D, Levine A J. Nature (London) 2000;408:307–310. doi: 10.1038/35042675. [DOI] [PubMed] [Google Scholar]
- 10.Yonish-Rouach E, Resnitzky D, Lotem J, Sachs L, Kimchi A, Oren M. Nature (London) 1991;352:345–347. doi: 10.1038/352345a0. [DOI] [PubMed] [Google Scholar]
- 11.Lotem J, Sachs L. Blood. 1993;82:1092–1096. [PubMed] [Google Scholar]
- 12.Lowe S W, Schmitt E M, Smith S W, Osborne B A, Jacks T. Nature (London) 1993;362:847–849. doi: 10.1038/362847a0. [DOI] [PubMed] [Google Scholar]
- 13.Clarke A R, Purdie C A, Harrison D J, Morris R G, Bird C C, Hooper M L, Wyllie A H. Nature (London) 1993;362:849–852. doi: 10.1038/362849a0. [DOI] [PubMed] [Google Scholar]
- 14.Oren M. FASEB J. 1992;6:3169–3176. doi: 10.1096/fasebj.6.13.1397838. [DOI] [PubMed] [Google Scholar]
- 15.Ko L J, Prives C. Genes Dev. 1996;10:1054–1072. doi: 10.1101/gad.10.9.1054. [DOI] [PubMed] [Google Scholar]
- 16.Zhao R, Gish K, Murphy M, Yin Y, Notterman D, Hoffman W H, Tom E, Mack D H, Levine A J. Genes Dev. 2000;14:981–993. [PMC free article] [PubMed] [Google Scholar]
- 17.Wang L, Wu Q, Qiu P, Mirza A, McGuirk M, Kirschmeier P, Greene J R, Wang Y, Pickett C B, Liu S. J Biol Chem. 2001;276:43604–43610. doi: 10.1074/jbc.M106570200. [DOI] [PubMed] [Google Scholar]
- 18.Lotem J, Sachs L. Apoptosis. 1999;4:187–196. doi: 10.1023/a:1009614723237. [DOI] [PubMed] [Google Scholar]
- 19.Bartke T, Siegmund D, Peters N, Reichwein M, Henkler F, Scheurich P, Wajant H. Oncogene. 2001;20:571–580. doi: 10.1038/sj.onc.1204124. [DOI] [PubMed] [Google Scholar]
- 20.Oda E, Ohki R, Murasawa H, Nemoto J, Shibue T, Yamashita T, Tokino T, Taniguchi T, Tanaka N. Science. 2000;288:1053–1058. doi: 10.1126/science.288.5468.1053. [DOI] [PubMed] [Google Scholar]
- 21.Han J, Flemington C, Houghton A B, Gu Z, Zambetti G P, Lutz R J, Zhu L, Chittenden T. Proc Natl Acad Sci USA. 2001;98:11318–11323. doi: 10.1073/pnas.201208798. [DOI] [PMC free article] [PubMed] [Google Scholar]
- 22.Lin Y, Ma W, Benchimol S. Nat Genet. 2000;26:122–127. doi: 10.1038/79102. [DOI] [PubMed] [Google Scholar]
- 23.Kannan K, Kaminski N, Rechavi G, Jakob-Hirsch J, Amariglio N, Givol D. Oncogene. 2001;20:3449–3455. doi: 10.1038/sj.onc.1204446. [DOI] [PubMed] [Google Scholar]
- 24.Moroni M C, Hickman E S, Denchi E L, Caprara G, Colli E, Cecconi F, Muller H, Helin K. Nat Cell Biol. 2001;3:552–558. doi: 10.1038/35078527. [DOI] [PubMed] [Google Scholar]
- 25.Lotem J, Sachs L. Leukemia. 1995;9:685–692. [PubMed] [Google Scholar]
- 26.Hoffman W H, Biade S, Zilfou J T, Chen J, Murphy M. J Biol Chem. 2002;277:3247–3257. doi: 10.1074/jbc.M106643200. [DOI] [PubMed] [Google Scholar]
- 27.Kaufmann S H, Hengartner M O. Trends Cell Biol. 2001;11:526–534. doi: 10.1016/s0962-8924(01)02173-0. [DOI] [PubMed] [Google Scholar]
- 28.Shi Y. Nat Struct Biol. 2001;8:394–401. doi: 10.1038/87548. [DOI] [PubMed] [Google Scholar]
- 29.Wang X. Genes Dev. 2001;15:2922–2933. [PubMed] [Google Scholar]
- 30. Lotem, J. & Sachs, L. (2002) Oncogene, in press.
- 31.Brunk U T, Dalen H, Roberg K, Hellquist H B. Free Radical Biol Med. 1997;23:616–626. doi: 10.1016/s0891-5849(97)00007-5. [DOI] [PubMed] [Google Scholar]
- 32.Brunk U T, Svensson I. Redox Rep. 1999;4:3–11. doi: 10.1179/135100099101534675. [DOI] [PubMed] [Google Scholar]
- 33.Kagedal K, Zhao M, Svensson I, Brunk U T. Biochem J. 2001;359:335–343. doi: 10.1042/0264-6021:3590335. [DOI] [PMC free article] [PubMed] [Google Scholar]
- 34.Li W, Yuan X, Nordgren G, Dalen H, Dubowchik G M, Firestone R A, Brunk U T. FEBS Lett. 2000;470:35–39. doi: 10.1016/s0014-5793(00)01286-2. [DOI] [PubMed] [Google Scholar]
- 35.Yuan X M, Li W, Brunk U T, Dalen H, Chang Y H, Sevanian A. Free Radical Biol Med. 2000;28:208–218. doi: 10.1016/s0891-5849(99)00220-8. [DOI] [PubMed] [Google Scholar]
- 36.Neuzil J, Svensson I, Weber T, Weber C, Brunk U T. FEBS Lett. 1999;445:295–300. doi: 10.1016/s0014-5793(99)00141-6. [DOI] [PubMed] [Google Scholar]
- 37.Antunes F, Cadenas E, Brunk U T. Biochem J. 2001;356:549–555. doi: 10.1042/0264-6021:3560549. [DOI] [PMC free article] [PubMed] [Google Scholar]
- 38.Ishisaka R, Utsumi T, Kanno T, Arita K, Katunuma N, Akiyama J, Utsumi K. Cell Struct Funct. 1999;24:465–470. doi: 10.1247/csf.24.465. [DOI] [PubMed] [Google Scholar]
- 39.Guicciardi M E, Deussing J, Miyoshi H, Bronk S F, Svingen P A, Peters C, Kaufmann S H, Gores G J. J Clin Invest. 2000;106:1127–1137. doi: 10.1172/JCI9914. [DOI] [PMC free article] [PubMed] [Google Scholar]
- 40.Zang Y, Beard R L, Chandraratna R A, Kang J X. Cell Death Differ. 2001;8:477–485. doi: 10.1038/sj.cdd.4400843. [DOI] [PubMed] [Google Scholar]
- 41.Roberg K, Johansson U, Ollinger K. Free Radical Biol Med. 1999;27:1228–1237. doi: 10.1016/s0891-5849(99)00146-x. [DOI] [PubMed] [Google Scholar]
- 42.Stoka V, Turk B, Schendel S L, Kim T H, Cirman T, Snipas S J, Ellerby L M, Bredesen D, Freeze H, Abrahamson M, et al. J Biol Chem. 2001;276:3149–3157. doi: 10.1074/jbc.M008944200. [DOI] [PubMed] [Google Scholar]
- 43.Zhao M, Eaton J W, Brunk U T. FEBS Lett. 2000;485:104–108. doi: 10.1016/s0014-5793(00)02195-5. [DOI] [PubMed] [Google Scholar]
- 44.Lotem J, Peled-Kamar M, Groner Y, Sachs L. Proc Natl Acad Sci USA. 1996;93:9166–9171. doi: 10.1073/pnas.93.17.9166. [DOI] [PMC free article] [PubMed] [Google Scholar]
- 45.Lotem J, Sachs L. Proc Natl Acad Sci USA. 1996;93:12507–12512. doi: 10.1073/pnas.93.22.12507. [DOI] [PMC free article] [PubMed] [Google Scholar]
- 46.Lotem J, Sachs L. Proc Natl Acad Sci USA. 1998;95:4601–4606. doi: 10.1073/pnas.95.8.4601. [DOI] [PMC free article] [PubMed] [Google Scholar]
- 47.Lotem J, Kama R, Sachs L. Proc Natl Acad Sci USA. 1999;96:12016–12020. doi: 10.1073/pnas.96.21.12016. [DOI] [PMC free article] [PubMed] [Google Scholar]
- 48.Lotem J, Sachs L. Proc Natl Acad Sci USA. 1997;94:9349–9353. doi: 10.1073/pnas.94.17.9349. [DOI] [PMC free article] [PubMed] [Google Scholar]
- 49.Brunk U T, Neuzil J, Eaton J W. Redox Rep. 2001;6:91–97. doi: 10.1179/135100001101536094. [DOI] [PubMed] [Google Scholar]
- 50.Zdolsek J M, Olsson G M, Brunk U T. Photochem Photobiol. 1990;51:67–76. doi: 10.1111/j.1751-1097.1990.tb01685.x. [DOI] [PubMed] [Google Scholar]
- 51.Zhao M, Brunk U T, Eaton J W. FEBS Lett. 2001;509:399–404. doi: 10.1016/s0014-5793(01)03184-2. [DOI] [PubMed] [Google Scholar]
- 52.Vancompernolle K, Van Herreweghe F, Pynaert G, Van de Craen M, De Vos K, Totty N, Sterling A, Fiers W, Vandenabeele P, Grooten J. FEBS Lett. 1998;438:150–158. doi: 10.1016/s0014-5793(98)01275-7. [DOI] [PubMed] [Google Scholar]
- 53.Smyth M J, Trapani J A. Immunol Today. 1995;16:202–206. doi: 10.1016/0167-5699(95)80122-7. [DOI] [PubMed] [Google Scholar]
- 54.Kam C M, Hudig D, Powers J C. Biochim Biophys Acta. 2000;1477:307–323. doi: 10.1016/s0167-4838(99)00282-4. [DOI] [PubMed] [Google Scholar]
- 55.Foghsgaard L, Wissing D, Mauch D, Lademann U, Bastholm L, Boes M, Elling F, Leist M, Jaattela M. J Cell Biol. 2001;153:999–1010. doi: 10.1083/jcb.153.5.999. [DOI] [PMC free article] [PubMed] [Google Scholar]
- 56.Deiss L P, Galinka H, Berissi H, Cohen O, Kimchi A. EMBO J. 1996;15:3861–3870. [PMC free article] [PubMed] [Google Scholar]
- 57.Wu G S, Saftig P, Peters C, El-Deiry W S. Oncogene. 1998;16:2177–2183. doi: 10.1038/sj.onc.1201755. [DOI] [PubMed] [Google Scholar]
- 58.Earnshaw W C, Martins L M, Kaufmann S H. Annu Rev Biochem. 1999;68:383–424. doi: 10.1146/annurev.biochem.68.1.383. [DOI] [PubMed] [Google Scholar]
- 59.Hengartner M O. Nature (London) 2000;407:770–776. doi: 10.1038/35037710. [DOI] [PubMed] [Google Scholar]


