Abstract
Although the mechanisms controlling the two cell-cycle checkpoints G1-S and G2-M are well studied, it remains elusive how they are linked in higher eukaryotes. In animals, D-type cyclins have been implicated in the control of cell-cycle progression in mitotic as well as in endoreduplicating cells. By contrast, we show that the expression of the D-type cyclin CYCD3;1 in endoreduplicating Arabidopsis trichome cells not only induced DNA replication but also cell divisions.
In yeast, an elaborate network of transcriptional activation and proteolysis causes the advance through the cell cycle. Here G1 cyclins play an important role by inducing the accumulation of S-phase and mitotic cyclins, which in turn promote DNA replication and mitosis (1). In higher eukaryotes little is known about how S phase is linked mechanistically to M phase. Of the two main animal G1 cyclins, CYCD and CYCE, CYCE seems to be involved in initiation of DNA replication, whereas CYCD has been implicated as a sensor of the extracellular growth conditions (2). Misexpression of D-type cyclins in Drosophila results in increased organ growth as mitotic cells undergo additional cell divisions and endoreduplicating cells proceed through further DNA replication cycles, resulting in an increased nuclear size (3). Similarly, expression of D-type cyclins in endoreduplicating human megakaryocytes leads to an increase in the DNA content (4). Thus, it has been proposed that CYCD expression can increase cellular growth, which in turn triggers the current cell-cycle program, i.e., mitosis or endoreduplication (3).
Here we wanted to test the function of two D-type cyclins, CYCD3;1 and CYCD2;2 (CYCD4;1; refs. 5 and 6), in the control of DNA replication and growth in plants by using Arabidopsis leaf hairs (trichomes) as a model system. Trichomes are single-celled hairs that during maturation undergo four rounds of endoreduplication, leading to a characteristic 3–4-branched cell with ≈32C (7). Mutant trichomes with a lesser DNA content (e.g., 16C) are smaller and have fewer branches, whereas trichomes with a higher DNA content (e.g., 64C) are larger and develop more branches. Therefore, trichomes provide an ideal model system to monitor easily the changes that may be expected from the overexpression of D-type cyclins. However, instead of larger cells with more branches, the ectopic expression of one of the D-type cyclins, CYCD3;1, induced cell divisions that led to multicellular trichomes.
Materials and Methods
Plant Material, Growth Conditions, and Plant Transformation.
Plants were grown as described (8). The Arabidopsis ecotype Landsberg erecta (Ler) was used as a wild-type control. All CYCD2;2 analysis was carried out with the homozygous line #1, which showed a strong transgene expression in the T3 generation. The sim seeds were a gift from John Larkin (9). Both trichome marker lines pGL1∷GUS and pGL2∷GUS were a gift from David Marks (10, 11), and the pCYCB1;1∷GUSDB reporter line, FA4C, was a gift from Peter Doerner (12). The pCYCB1;2∷GUSDB reporter line has been described previously (13).
All plasmids were introduced into Agrobacterium strain GV3101(pMP90) (14) by electroporation and transformed into Ler by the floral-dip method (15). Transgenic plants were selected on Murashige and Skoog plates (16) containing 3% sucrose with kanamycin at 50 μg/ml. The presence of the transgene was verified by PCR.
Cell-Cycle Constructs.
To generate the pGL2∷CYCD3;1 construct, the CYCD3;1 cDNA was excised from pBSCYCD3;1 (a gift from Jim Murray; ref. 5) with NotI and inserted in an inverted orientation into the NotI site of pBluescript II SK (pBS, Stratagene; pART61). CYCD3;1 then was excised from pART61 with BamHI and SacI and subcloned into BamHI/SacI-digested pBI101.1pGL2 (a gift from David Marks; ref. 11) to yield plasmid pART67. To generate the pGL2∷CYCD2;2 construct, the CYCD2;2 (CYCD4;1) cDNA was excised from pcycD4 (a gift from Dirk Inzé; ref. 6) with EcoRI and PstI and inserted into EcoRI/PstI-digested pBS (pART68). The CYCD2;2 cDNA then was excised from pART68 by using EcoRV and SacI and inserted into SmaI/SacI-cleaved pBI101.1pGL2 (11) to yield plasmid pART69. To achieve expression within trichomes of both these constructs, a 2.1-kb HindIII/NheI fragment from the 5′-upstream region of the GLABRA2 gene was used (11). Unless stated otherwise, all manipulations were performed by using standard molecular methods (17, 18).
β-Glucuronidase (GUS) Assays.
Whole-mount GUS stainings were performed as described by Schoof et al. (19).
In Situ RNA Hybridization.
In situ detection of mRNA on paraffin-embedded sections of seedlings was carried out as described by Mayer et al. (20). An ≈600-bp antisense probe for CYCD3;1 was generated from pART61 and cut with HincII by using T7 RNA polymerase; a full-length sense probe for CYCD3;1 (pBSCYCD3;1; ref. 5) was synthesized by using T3 RNA polymerase. An antisense probe from a full-length CYCB1;1 cDNA clone was generated by using T7 RNA polymerase; a sense probe for CYCB1;1 was synthesized by using SP6 RNA polymerase. Both CYCB1;1 probes were generated from pCYC1At (21). An antisense probe from a full-length CYCB1;2 cDNA clone was generated by using T7 RNA polymerase; a sense probe was synthesized by using T3 RNA polymerase. The pBSCYCB1;2 vector was used as a template for both the CYCB1;2 probes (22).
Reverse Transcription (RT)-PCR Analysis.
RNA template, prepared with Dynabeads (Dynal, Oslo), was treated with DNase I to remove genomic DNA contamination. RT-PCR was carried out with the TITAN One tube RT-PCR mix (Roche Diagnostics). The 5′ primer used was designed against the 5′ untranslated region of the GL2 gene included in the GL2 promotor fragment used in vector construction, and the 3′ primer were designed against the respective cyclin or GL2 gene. After cycles 15, 18, 21, 24, and 27, 5 μl of the RT-PCR products were separated on an agarose gel, blotted onto a Hybond N+ membrane (Amersham Pharmacia), and hybridized with the respective cDNA probes labeled with the digoxigenin-labeling mix (Roche Diagnostics).
Microscopy.
Leaves from 2-week-old plants were cryofixed by dipping into liquid nitrogen-cooled propane followed by freeze substitution in anhydrous acetone containing 1% glutaraldehyde and 2% osmium tetroxide (−90°C, 35 h; −60°C, 6 h; −35°C, 6 h; 0°C, 1 h; in some cases 20°C, 1h). After washing with pure ethanol, the leaves were stained with 2% uranyl acetate in pure ethanol for 1 h and embedded in Spurr's resin. Semithick (1-μm) sections were stained with toluidine blue and analyzed in the light microscope. For confocal laser scanning microscopy, whole-mount stainings with CYTO13 (Molecular Probes) were analyzed as described (23). Cryoscanning electron microscopy was performed as described by Rumbolz et al. (24).
DNA Measurements.
Trichome nuclei were measured as described by Schnittger et al. (23).
Results
Expression of CYCD3;1 but Not CYCD2;2 Leads to Multicellular Trichomes.
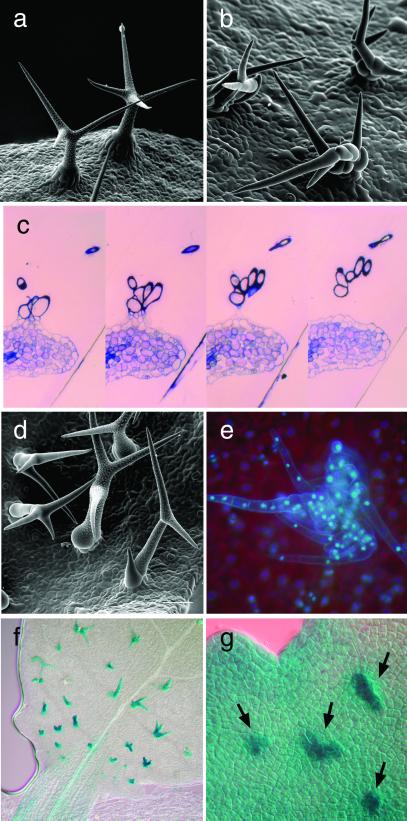
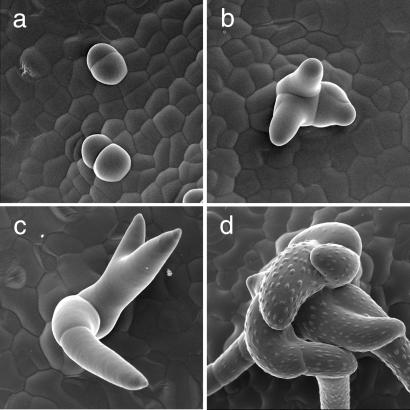
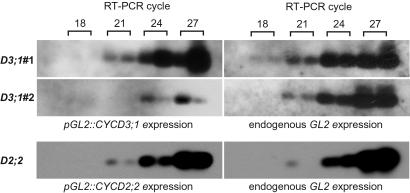
Trichome-specific expression of CYCD3;1 produced an unexpected phenotype. Instead of an increased size of the trichome nucleus, misexpression of CYCD3;1 led to cell divisions and thus multicellular hairs in more than 40 of 60 transformed plants. Scanning electron microscopy indicated multiple cells per trichome (Fig. 1 a, b, and d), which was confirmed by light microscopical analysis of consecutive sections (Fig. 1c). By confocal laser microscopy of CYTO13-stained leaves, multiple nuclei could be found in one trichome (data not shown). Whereas trichomes on wild-type plants are spaced separately over the leaf blade (Fig. 1a), trichomes on pGL2∷CYCD3;1 plants developed more than one trichome per TIS, resulting in clusters of trichomes (Fig. 1 b and d; Table 1). These clusters were caused by cell divisions at very early stages of trichome development before trichome outgrowth (Fig. 2 a–d). For further analysis, two lines with different phenotypic strengths were chosen: pGL2∷CYCD3;1#1, with a cluster frequency of ≈90%, and pGL2∷CYCD3;1#2, with a cluster frequency ≈75% (Table 1). By semiquantitative RT-PCR, we could correlate the higher number of cells per TIS in line 1 with a stronger expression of the transgene (Fig. 3; Table 1).
Figure 1.
Morphological analysis. (a) Scanning electron micrograph of single-celled mature wild-type trichomes. (b) Scanning electron micrograph of multicellular pGL2∷CYCD3;1#1 trichomes. (c) Four consecutive sections through a multicellular pGL2∷CYCD3;1#1 trichome revealing many separate cells. (d) Scanning electron micrograph of pGL2∷CYCD3;1#2 trichomes that have a lower rate of multicellular trichomes in comparison to line 1. (e) Light micrograph of 4′,6-diamidino-2-phenylindole-stained trichomes of pGL2∷CYCD3;1–pGL2∷CYCB1;2 plants showing a strong synergistic phenotype with up to 80 nuclei per trichome initiation site (TIS); similar trichomes arise by the expression of pGL2∷CYCD3;1 in a homozygous sim mutant background. (f) Staining of pGL2∷CYCD3;1 trichomes revealing the expression of the trichome marker line pGL2∷GUS. (g) Staining of pGL2∷CYCD3;1 trichomes (arrows) revealing the expression of the trichome marker line pGL1∷GUS.
Table 1.
Trichome cluster frequency
| Line | Cluster frequency in percent per leaf* | Number of leaves | Total TISs |
|---|---|---|---|
| Ler | 0.2 ± 0.9 | 20 | 409 |
| CYCD3;1#1 | 90.9 ± 6.5 | 20 | 510 |
| CYCD3;1#2 | 77.5 ± 13.4 | 20 | 679 |
| Ler × CYCD3;1#1† | 94.4 ± 4.4 | 20 | 804 |
| Ler × CYCD3;1#2† | 16.3 ± 7.3 | 20 | 564 |
| CYCD2;2 | 0.1 ± 0.6 | 20 | 567 |
| CYCB1;1 | 2.8 ± 3.3 | 20 | 521 |
| CYCB1;1 × CYCD3;1#1‡ | 95.8 ± 3.5 | 20 | 809 |
| CYCB1;1 × CYCD3;1#2‡ | 10.2 ± 4.4 | 20 | 738 |
| CYCDB1;2 | 32.8 ± 8.0 | 20 | 673 |
| Ler × CYCDB1;2† | 13.5 ± 7.9 | 20 | 647 |
| CYCB1;2 × CYCD3;1#1‡ | 91.2 ± 13.0 | 20 | 819 |
| CYCB1;2 × CYCD3;1#2‡ | 72.9 ± 5.4 | 20 | 866 |
| sim | 84.1 ± 8.8 | 20 | 1,212 |
| CYCD3;1#1 × sim† | 94.6 ± 16.2 | 20 | 1,119 |
| CYCD3;1#2 × sim† | 41.6 ± 6.2 | 20 | 1,023 |
| CYCD3;1#1 × sim§ | 100.0 ± 0.0 | 10 | 471 |
Rosette leaf numbers 3 and 4 were counted from at least 10 plants per line, the average ± SD is given.
Only one copy of the transgene present.
Only one copy of each transgene present.
Homozygous mutant for sim, one or two copies of pGL2∷CYCD3;1#1.
Figure 2.
Analysis of pGL2∷CYCD3;1 trichome development. (a–d) Scanning electron micrographs of pGL2∷CYCD3;1 trichomes. (a) Very young dividing trichomes giving rise to trichome clusters. (b and c) Further cell divisions take place as trichomes grow out and elongate. (d) Mature multicellular trichome comprising many cells. Note that the individual cells form papillae.
Figure 3.
Transgene expression analysis. Semiquantitative RT-PCR showing the relative expression strength of pGL2∷CYCD3;1 in lines 1 (D3;1#1) and #2 (D3;1#2) and pGL2∷CYCD2;2 (D2;2) in comparison with endogenous GLABRA 2 (GL2) expression; 18, 21, 24, and 27 indicate the RT-PCR cycle numbers. In pGL2∷CYCD3;1#1, CYCD3;1 is expressed at least 10-fold stronger than in line 2. The expression strength of pGL2∷CYCD2;2 is slightly less than pGL2∷CYCD3;1#1 but ≈10-fold stronger than in pGL2∷CYCD3;1#2.
To analyze whether the induction of cell divisions formed within the trichomes would interfere with cell differentiation, we crossed two trichome marker lines to pGL2∷CYCD3;1 plants (10, 11). We found that all single cells within a multicellular trichome expressed the trichome-specific markers GLABRA 2 (GL2) and GLABRA 1 (GL1) as revealed by the respective promotor GUS fusion constructs (Fig. 1 f and g). In addition, individual cells regularly developed papilla on the cell surface, which is characteristic for late trichome differentiation (Fig. 2d). Thus, it appears that all cells within a multicellular trichome have a trichome fate.
In contrast, trichome development was comparable to wild type in transgenic plant lines expressing the CYCD2;2 (CYCD4;1) transgene, although semiquantitative RT-PCR analysis demonstrated that CYCD2;2 was expressed at a similar level within the trichomes as CYCD3;1 in line pGL2∷CYCD3;1#1 (Table 1; Fig. 3). Thus, the phenotype obtained by ectopic CYCD3;1 expression is specific for this D-type cyclin.
Expression of CYCD3;1 Increases the Total DNA Content in Trichomes.
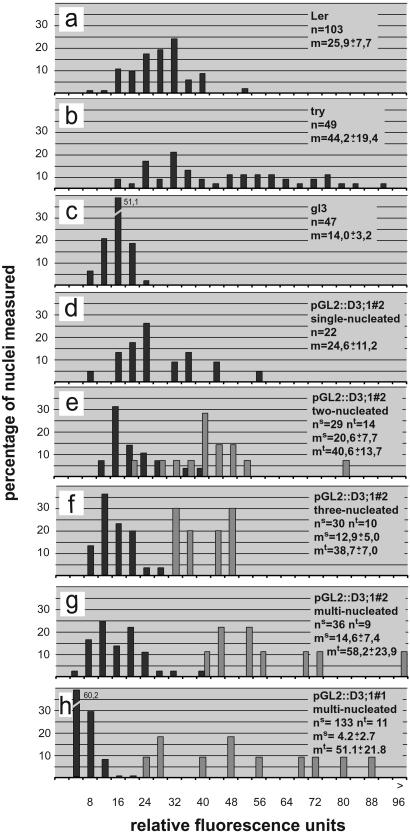
To analyze whether CYCD3;1 expression converted the endoreduplication cycle into a mitotic cycle, we next determined the DNA content of pGL2∷CYCD3;1 trichome nuclei in comparison to wild-type trichomes as well as two mutants with known alterations in ploidy level: glabra 3 (gl3) trichomes, which show on average one round of endoreduplication less than wild type, resulting in 16C, and triptychon (try) with roughly one additional round, giving rise to a nuclear content of 64C (Fig. 4 a–c). We found that expression of CYCD3;1 interfered with but did not totally abolish endoreduplication (Fig. 4 d–h). Overall, single nuclei in a multicellular trichome ranged from 4C to 20C (Fig. 4 e–h). There was a negative correlation between the number of cells per TIS and their nuclear size; the more cells that were in a TIS the less their single-cell DNA content was. However, even in the strongly expressing line #1, a few nuclei with a DNA content of ≈16C could be detected (Fig. 4h). Also by expressing CYCB1;2 in trichomes multicellular trichomes arise (13). There, a similar correlation between an increasing number of cells per trichomes and a decreasing amount of DNA can be found. Summing up the DNA content of all single nuclei in pGL2∷CYCB1;2 trichomes as being the total DNA content per TIS revealed that the wild-type total DNA content of 32C would not be exceeded (13). Therefore, we analyzed the total DNA content per TIS in pGL2∷CYCD3;1 plants. As opposed to CYCB1;2 expression, the wild-type DNA content of 32C was surmounted by CYCD3;1 expression and appeared to rise with the number of cells per TIS from on average 40C in two-nucleated trichomes in line 2 to more than 80C in multinucleated trichomes of line #1 (Fig. 4 e–h). Therefore CYCD3;1 expression also promoted entry into S phase.
Figure 4.
Analysis of DNA content. (a–f) Distribution of DNA contents given in relative fluorescence units of the single nuclei (black bar) and the sum of all nuclei per TIS (light bar). The relative, fluorescence units are calibrated with wild-type, triptychon, and glabra 3 trichome nuclei such that 2 relative fluorescence units roughly represent 2C by defining the major peak in the wild-type trichomes as 32C and the major peak in glabra 3 as 16C in accordance to previously measured trichome nuclei (9, 23, 34). The mean (m) is given for the single nuclei (ms) and the total DNA contents as the sum of all nuclei per TIS (mt). (a) Wild type. (b) triptychon (try). (c) glabra3 (gl3). (d) Single-nucleated pGL2∷CYCD3;1#2 trichomes. (e) Two-nucleated pGL2∷CYCD3;1#2 trichomes. (f) Three-nucleated pGL2∷CYCD3;1#2 trichomes. (g) pGL2∷CYCD3;1#2 trichomes with more than three nuclei. (h) pGL2∷CYCD3;1#1 trichomes with more than three nuclei.
CYCD3;1 Expression Is Not Found in Wild-Type Trichomes.
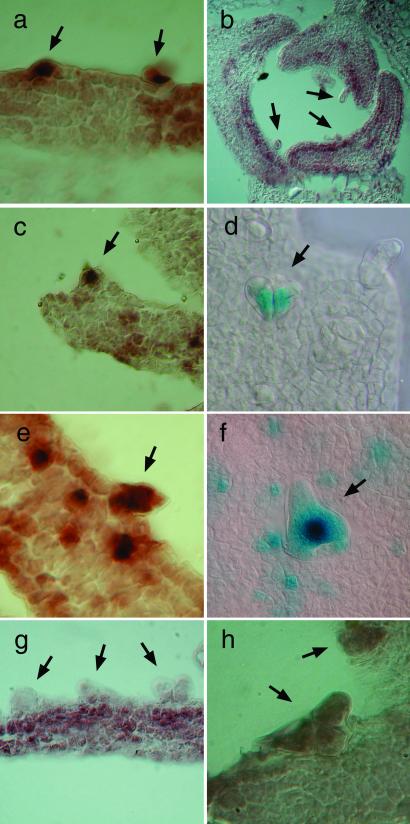
Is CYCD3;1 involved in wild-type trichome development? CYCD3;1 could be engaged in the endoreduplication program in a way that the mitotic aspect of CYCD3;1 function is repressed, leaving the promotive effect on DNA replication. To answer this question we analyzed whether CYCD3;1 is expressed in wild-type trichomes by in situ RNA hybridization. Whereas the control CYCD3;1 sense probe gave no signal, the antisense CYCD3;1 probe revealed a strong signal in trichomes of pGL2∷CYCD3;1 plants (data not shown; Fig. 5a). With the antisense probe in wild-type plants, a signal was detected in leaf primordia and at the margins of young leaves but not in trichomes (Fig. 5b). Thus, CYCD3;1 most likely is not involved in wild-type trichome development.
Figure 5.
Expression analysis. (a) Strong staining with the CYCD3;1 antisense probe in pGL2∷CYCD3;1 trichomes (arrows); no signal was obtained with the CYCD3;1 sense probe (data not shown). (b) Detection of CYCD3;1 mRNA in young leaves with no staining in trichomes (arrows). (c) Detection of CYCB1;1 mRNA in pGL2∷CYCD3;1 trichomes (arrows). (d) Staining of trichomes expressing pCYCB1;1∷GUS in pGL2∷CYCD3;1 plants. (e) Detection of CYCB1;2 mRNA in pGL2∷CYCD3;1 trichomes (arrows). (f) Staining of trichomes expressing pCYCB1;2∷GUS in pGL2∷CYCD3;1 plants. (g) No detection of CYCD3;1 mRNA in sim mutant trichomes (arrows). (h) Detection of GL2 mRNA in sim mutant trichomes (arrows).
Interrelationship of CYCD3;1 and the Mitotic Cyclins CYCB1;1 and CYCB1;2.
To look at the induction of mitosis in pGL2∷CYCD3;1 trichomes in more detail, the expression of two mitotic cyclins, CYCB1;1 and CYCB1;2, was analyzed. CYCB1;1 and CYCB1;2 are not expressed during wild-type trichome development (13). With promotor reporter lines for both cyclins as well as in situ RNA hybridization, ectopic expression of CYCB1;1 and CYCB1;2 was detected in pGL2∷CYCD3;1 trichomes (Fig. 5 c–f). Because we found expression of the B-type cyclins in yet-undivided cells, the induction could not have resulted from a previous round of cell division (Fig. 5f). Thus, the mitotic machinery became activated by the expression of CYCD3;1.
Ectopic expression of CYCB1;2 but not CYCB1;1 also leads to multicellular trichomes (13). However, expression of the mitotic cyclin results in a much weaker phenotype, with on average only 2–3 cells per multicellular trichome. To analyze whether CYCD3;1 acts in one pathway with CYCB1;2, we crossed plants expressing in trichomes CYCB1;1 and CYCB1;2, respectively, to the pGL2∷CYCD3;1 lines. Whereas the progeny of the cross with CYCB1;1 did not show any increase in the cluster frequency (Table 1), the double heterozygote pGL2∷CYCD3;1#2- pGL2∷CYCB1;2 led to an increase from 16 to near 73% cluster frequency. Among the F2 progeny of the pGL2∷CYCB1;2 line crossed to the strong line #1, plants with an extreme increase in the number of cell divisions per TIS were identified; TISs with more than 80 nuclei could be counted (Fig. 1e; Table 1). Thus, the amount of CYCB1;2 appeared to be rate-limiting for mitosis even in pGL2∷CYCD3;1-expressing trichomes, suggesting that induction of CYCB1;2 and thus of mitosis by CYCD3;1 is counteracted by a negative regulator of cell division in trichomes.
A candidate for such a repressor of CYCD3;1 function is the recently identified SIAMESE (SIM) gene (9). In the recessive sim mutant plants, multicellular trichomes also arise. To test whether SIM could restrict CYCD3;1 action, we crossed sim with the pGL2∷CYCD3;1 lines. Already in the F1 generation with the weaker line 2, the cluster frequency increased from 16 to 42%, indicating a concentration dependence of SIM in a pGL2∷CYCD3;1 background. In homozygous sim mutants expressing pGL2∷CYCD3;1, the number of cells per TIS increased to a similar level as seen in pGL2∷CYCB1;2-pGL2∷CYCD3;1 plants (data not shown). Thus, SIM restricts CYCD3;1 function. To test whether this restriction is caused by a transcriptional control, we analyzed the expression of CYCD3;1 in sim mutant trichomes. Whereas we could detect a strong signal for a control gene (GLABRA 2) in sim trichomes, we could not observe CYCD3;1 transcript (Fig. 5 g and h), which together with the observation that wild-type trichomes appeared not to express CYCD3;1, argues that SIM acts downstream or in parallel to CYCD3;1.
Discussion
The data presented here show that expression of one specific D-type cyclin, CYCD3;1, not only promoted S-phase entry but also induced mitosis. Promotion of S phase by D-type cyclin expression has been described also in animals and represents the existing dogma of D-type cyclin function (2). We found that with an increasing number of cells in pGL2∷CYCD3;1 trichomes, the total DNA content increased as well. In contrast, multicellular trichomes arising from CYCB1;2 expression did not surmount the regular wild-type DNA content of 32C, which argues that CYCB1;2 acts downstream of factors controlling the number of cell-cycle rounds, whereas CYCD3;1 can influence the number of cell cycles. Is CYCD3;1 thus involved in growth control? In animals as well as in plants D-type cyclins have been found to control growth by either stimulating the growth of a cell (hypertrophy) or increasing the proliferation rate (hyperplasia; refs. 3 and 25). Mizukami and Fischer (26) reported that in the larger leaves of p35S∷AINTEGUMENTA plants the transcript levels of CYCD3;1 are up-regulated, which could hint at a function of CYCD3;1 in growth control. Conversely, Riou-Khamlichi et al. (5) found that overexpression of CYCD3;1 under 35S promotor control resulted in plants with increased leaf numbers, but CYCD3;1 expression interfered with organogenesis, giving rise to twisted but generally not enlarged leaves. Can a function for CYCD3;1 in growth control be elucidated from its misexpression in trichomes? From a trichome point of view, the multicellular trichomes in pGL2∷CYCD3;1 cause an increase in mass in comparison to wild type. However, comparing one cell in a multicellular pGL2∷CYCD3;1 trichome with a wild-type trichome did not indicate hypertrophy; instead, the cell and nuclear size in pGL2∷CYCD3;1 trichomes were reduced. The observed trichome growth was coupled with cell divisions. However, because wild-type trichomes do not divide, this growth cannot simply be called hyperplasia. Thus the impact of CYCD3;1 on growth is difficult to judge. The controlled misexpression of CYCD3;1 in other tissues and organs should help to answer this question.
A role for the entry into mitosis is very unexpected from what is known about animal D-type cyclins and opens a new view on the function of D-type cyclins in plants. Mitosis in pGL2∷CYCD3;1 trichomes could be induced indirectly by an S phase that in turn could somehow promote entry into mitosis. However, because there are mutants in Arabidopsis with increased endoreduplication levels in trichomes that do not show any signs of cell divisions (kaktus gene group), the CYCD3;1 misexpression phenotype could not result simply from an iterative entry into S phase (27). In addition, a direct function for D-type cyclins at the entry into mitosis is suggested by the findings of Sorrell et al. (28) and Mészáros et al. (29), who could observe a transcriptional peak at the G2-M transition of a D3-type cyclin from tobacco and alfalfa cell cultures, respectively. Also, Mészáros et al. (29) report that in a yeast two-hybrid interaction assay, an alfalfa D-type cyclin interacted with a typical mitotic kinase Cdc2Ms F (CDKB2;1). It will be interesting to see how CYCD3;1 expression acts on the G2-M transition point and whether it is mediated via B-type cyclins, e.g., CYCB1;1 and CYCB1;2. One way to tackle this question is the analysis of mutants for B-type cyclins or silencing of B-type cyclins in pGL2∷CYCD3;1 trichomes. It is already clear that CYCD3;1 action is context-dependent and might not promote both transition points equally. At least the entry into mitosis is limited by additional factors, which is seen by a dramatic increase of cell divisions by coexpressing CYCB1;2 or by expressing CYCD3;1 in a sim mutant background.
CYCD3;1 also has been described to function as a downstream target of cytokinin, and cell cultures expressing CYCD3;1 could grow in the absence of cytokinin (5). It has been shown that these cells have a shortened G1 phase. On the other hand, numerous reports have stressed that cytokinin also has a function at the G2-M transition point (30–33). In light of our data it is possible to unify both observations. The fact that CYCD3;1 expression could shorten the G1 phase and trigger mitosis raises the possibility that CYCD3;1 represents a novel cell-cycle mode in plants for rapid cycling in response to growth factors.
Acknowledgments
We are grateful to Richard Guggenheim and his team from the Rasterelektronenmikroskopie-Labor Universität Basel, especially Joachim Rumbolz and Marcel Düggelin for their help with the SEM analysis. We thank Charles N. David and the Department of Zoology at the Universität München for the use of the cytophotometry device. We thank Peter Doerner, Dirk Inzé, John Larkin, David Marks, and A. S. N. Reddy for providing DNA and/or seeds used in this analysis. We thank Nadja Valtcheva for her help with all plant material. We also thank Isabel Bäurle, Niko Geldner, Maren Heese, Michael Lenhard, and Anna Sorensen for critical reading and helpful comments on the manuscript. This work was supported by grants from the Deutsche Forschungsgemeinschaft (to M.H.).
Abbreviations
- Ler
Landsberg erecta
- pBS
pBluescript II SK
- GUS
β-glucuronidase
- RT
reverse transcription
- TIS
trichome initiation site
Footnotes
This paper was submitted directly (Track II) to the PNAS office.
References
- 1.Nasmyth K. Trends Genet. 1996;12:405–412. doi: 10.1016/0168-9525(96)10041-x. [DOI] [PubMed] [Google Scholar]
- 2.Sherr C J. Trends Biochem Sci. 1995;20:187–190. doi: 10.1016/s0968-0004(00)89005-2. [DOI] [PubMed] [Google Scholar]
- 3.Datar S A, Jacobs H W, de la Cruz A F, Lehner C F, Edgar B A. EMBO J. 2000;19:4543–4554. doi: 10.1093/emboj/19.17.4543. [DOI] [PMC free article] [PubMed] [Google Scholar]
- 4.Zimmet J M, Ladd D, Jackson C W, Stenberg P E, Ravid K. Mol Cell Biol. 1997;17:7248–7259. doi: 10.1128/mcb.17.12.7248. [DOI] [PMC free article] [PubMed] [Google Scholar]
- 5.Riou-Khamlichi C, Huntley R, Jacqmard A, Murray J A. Science. 1999;283:1541–1544. doi: 10.1126/science.283.5407.1541. [DOI] [PubMed] [Google Scholar]
- 6.De Veylder L, de Almeida Engler J, Burssens S, Manevski A, Lescure B, Van Montagu M, Engler G, Inze D. Planta. 1999;208:453–462. doi: 10.1007/s004250050582. [DOI] [PubMed] [Google Scholar]
- 7.Hülskamp M, Schnittger A, Folkers U. Int Rev Cytol. 1999;186:147–178. doi: 10.1016/s0074-7696(08)61053-0. [DOI] [PubMed] [Google Scholar]
- 8.Schnittger A, Folkers U, Schwab B, Jurgens G, Hülskamp M. Plant Cell. 1999;11:1105–1116. doi: 10.1105/tpc.11.6.1105. [DOI] [PMC free article] [PubMed] [Google Scholar]
- 9.Walker J D, Oppenheimer D G, Concienne J, Larkin J C. Development (Cambridge, UK) 2000;127:3931–3940. doi: 10.1242/dev.127.18.3931. [DOI] [PubMed] [Google Scholar]
- 10.Larkin J C, Oppenheimer D, Pollock S, Marks M D. Plant Cell. 1993;5:1739–1748. doi: 10.1105/tpc.5.12.1739. [DOI] [PMC free article] [PubMed] [Google Scholar]
- 11.Szymanski D B, Jilk R A, Pollock S M, Marks M D. Development (Cambridge, UK) 1998;125:1161–1171. doi: 10.1242/dev.125.7.1161. [DOI] [PubMed] [Google Scholar]
- 12.Colon-Carmona A, You R, Haimovitch-Gal T, Doerner P. Plant J. 1999;20:503–508. doi: 10.1046/j.1365-313x.1999.00620.x. [DOI] [PubMed] [Google Scholar]
- 13.Schnittger A, Schöbinger U, Stierhof Y, Hülskamp M. Curr Biol. 2002;12:415–420. doi: 10.1016/s0960-9822(02)00693-0. [DOI] [PubMed] [Google Scholar]
- 14.Koncz C, Schell J. Mol Gen Genet. 1986;204:383–396. [Google Scholar]
- 15.Clough S J, Bent A F. Plant J. 1998;16:735–743. doi: 10.1046/j.1365-313x.1998.00343.x. [DOI] [PubMed] [Google Scholar]
- 16.Murashige T, Skoog F. Physiol Plant. 1962;15:473–497. [Google Scholar]
- 17.Ausubel F M. Current Protocols in Molecular Biology. New York: Wiley; 1994. [Google Scholar]
- 18.Sambrook J, Fritsch E, Maniatis T. Molecular Cloning: A Laboratory Manual. Plainview, NY: Cold Spring Harbor Lab. Press; 1989. [Google Scholar]
- 19.Schoof H, Lenhard M, Haecker A, Mayer K F, Jurgens G, Laux T. Cell. 2000;100:635–644. doi: 10.1016/s0092-8674(00)80700-x. [DOI] [PubMed] [Google Scholar]
- 20.Mayer K F, Schoof H, Haecker A, Lenhard M, Jurgens G, Laux T. Cell. 1998;95:805–815. doi: 10.1016/s0092-8674(00)81703-1. [DOI] [PubMed] [Google Scholar]
- 21.Hemerly A, Bergounioux C, Van Montagu M, Inze D, Ferreira P. Proc Natl Acad Sci USA. 1992;89:3295–3299. doi: 10.1073/pnas.89.8.3295. [DOI] [PMC free article] [PubMed] [Google Scholar]
- 22.Day I S, Reddy A S, Golovkin M. Plant Mol Biol. 1996;30:565–575. doi: 10.1007/BF00049332. [DOI] [PubMed] [Google Scholar]
- 23.Schnittger A, Jurgens G, Hülskamp M. Development (Cambridge, UK) 1998;125:2283–2289. doi: 10.1242/dev.125.12.2283. [DOI] [PubMed] [Google Scholar]
- 24.Rumbolz J, Kassemeyer H-H, Steinmetz V, Deising H B, Mendgen K, Mathys D, Wirtz S, Guggenheim R. Can J Bot. 1999;78:409–421. [Google Scholar]
- 25.Cockcroft C E, den Boer B G, Healy J M, Murray J A. Nature (London) 2000;405:575–579. doi: 10.1038/35014621. [DOI] [PubMed] [Google Scholar]
- 26.Mizukami Y, Fischer R L. Proc Natl Acad Sci USA. 2000;97:942–947. doi: 10.1073/pnas.97.2.942. [DOI] [PMC free article] [PubMed] [Google Scholar]
- 27.Perazza D, Herzog M, Hülskamp M, Brown S, Dorne A M, Bonneville J M. Genetics. 1999;152:461–476. doi: 10.1093/genetics/152.1.461. [DOI] [PMC free article] [PubMed] [Google Scholar]
- 28.Sorrell D A, Combettes B, Chaubet-Gigot N, Gigot C, Murray J A. Plant Physiol. 1999;119:343–352. doi: 10.1104/pp.119.1.343. [DOI] [PMC free article] [PubMed] [Google Scholar]
- 29.Mészáros T, Miskolczi P, Ayaydin F, Pettko-Szandtner A, Peres A, Magyar Z, Horvath G V, Bako L, Feher A, Dudits D. Plant Mol Biol. 2000;43:595–605. doi: 10.1023/a:1006412413671. [DOI] [PubMed] [Google Scholar]
- 30.Laureys F, Dewitte W, Witters E, Van Montagu M, Inze D, Van Onckelen H. FEBS Lett. 1998;426:29–32. doi: 10.1016/s0014-5793(98)00297-x. [DOI] [PubMed] [Google Scholar]
- 31.Redig P, Shaul O, Inze D, Van Montagu M, Van Onckelen H. FEBS Lett. 1996;391:175–180. doi: 10.1016/0014-5793(96)00728-4. [DOI] [PubMed] [Google Scholar]
- 32.Wang T L, Everett N P, Gould A R, Street H E. Protoplasma. 1981;106:23–35. [Google Scholar]
- 33.Zhang K, Letham D S, John P C. Planta. 1996;200:2–12. doi: 10.1007/BF00196642. [DOI] [PubMed] [Google Scholar]
- 34.Szymanski D B, Marks M D. Plant Cell. 1998;10:2047–2062. doi: 10.1105/tpc.10.12.2047. [DOI] [PMC free article] [PubMed] [Google Scholar]


