

Summary
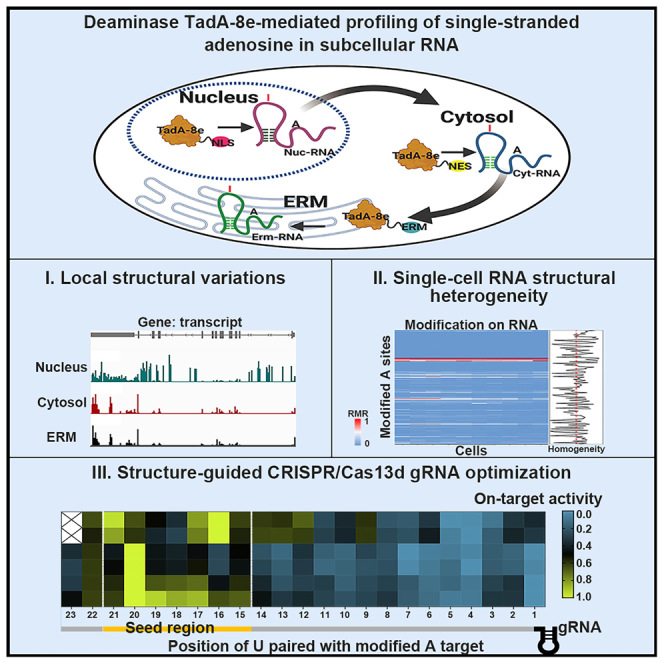
RNA structure plays a crucial role in its function and undergoes dynamic changes throughout its life cycle. To study these dynamics, we developed TAS sequencing (TAS-seq), which expresses the deaminase TadA-8e in specific subcellular compartments to modify single-stranded adenosines, particularly within hairpin loops. We applied TAS-seq to the nucleus, cytosol, and endoplasmic reticulum membrane, identifying adenosine structural variations and compartment-specific regulation of RNA stability. Single-cell TAS-seq revealed structural heterogeneity of cytosolic RNAs. Additionally, adenosines labeled by TAS-seq contribute to guide RNA optimization in the CRISPR-Cas13d system. Our method provides insights into compartment-specific RNA structural dynamics, cell-specific heterogeneity, and their functional implications.
Keywords: subcellular adenosine structure profiling, RNA structural dynamics, gRNA structure and performance
Graphical abstract
Highlights
-
•
TAS-seq enables profiling of subcellular RNA structures via adenosine modification
-
•
TAS-seq resolves cytosolic RNA heterogeneity at the single-cell level
-
•
Adenosine accessibility enhances CRISPR-Cas13d gRNA optimization
Motivation
Understanding RNA structural dynamics across subcellular compartments and single-cell heterogeneity is essential for unraveling RNA regulatory mechanisms. Current in vivo RNA structure profiling methods primarily rely on chemical labeling and compartment isolation, but these approaches are limited by challenges such as the difficulty of purifying certain compartments, distinguishing specific substructures, and the inability to capture full-length subcellular RNA in single cells. To address these limitations, we developed TAS sequencing using subcellularly localized deaminase TadA-8e to enzymatically label single-stranded adenosine in RNA, allowing the detection of substructure-dependent structural variations across compartments and subcellular RNA heterogeneity at the single-cell level.
To study RNA structure in the cell, Wang et al. develop TAS-seq using the deaminase TadA-8e localized to subcellular compartments to enzymatically label single-stranded adenosine in RNA. This technique allows for the detection of local structural variations across compartments and RNA heterogeneity at the single-cell level.
Introduction
RNA structure plays regulatory and catalytic roles in many biological processes, such as transcription,1 polyadenylation,2 splicing,3 translation,4,5,6 localization,5 turnover,7,8 ribozymes, ribosomes, and riboswitches.9 It is thought to form co-transcriptionally on the chromatin template,10,11,12 undergo conformational changes during nuclear maturation, and experience further alternations upon reaching its ultimate functional destination.13,14 Consequently, RNA may exhibit different structures in distinct subcellular compartments. Decoding these compartment-specific structural dynamics and cell-specific heterogeneity can provide valuable insights into RNA biology. Additionally, enhancing our understanding of RNA structure can improve RNA engineering, particularly in the CRISPR-Cas13d system,15,16,17,18 whose efficiency relies heavily on the structure-dependent complementarity between guide RNA (gRNA) and target RNA.19,20
Current in vivo RNA structure profiling predominantly employs chemical probing (e.g., DMS targeting unpaired adenosines/cytidines,21 SHAPE [selective 2'-hydroxyl acylation and primer extension] reagents detecting four flexible nucleotides22) and proximity-based ligation of double-stranded RNA23 (dsRNA) (e.g., UV24 or reversible crosslinkers25). icSHAPE combined with compartment isolation has been applied to analyze RNA from compartments like chromatin, nucleoplasm, and cytoplasm, revealing structural differences relevant to transcription, splicing, translation, and RNA decay.26,27 However, challenges remain for compartments that are difficult to purify, such as the nuclear lamina and endoplasmic reticulum membrane (ERM).28 Even for fractionable compartments, contamination and artifacts remain a challenge.29 For example, fractionation methods for the nucleus often result in contamination from the mitochondrial matrix and ERM.28 Additionally, existing techniques can only identify single- or double-stranded nucleotides and cannot directly distinguish specific substructures like hairpin loops. Inspired by APEX-seq,28 which enables subcellular transcriptome profiling through enzyme-catalyzed biotin labeling and signal peptide-facilitated subcellular localization, we aim to develop a method for simultaneous structural labeling and subcellular RNA profiling within cells.
ADAR (adenosine deaminase RNA specific) editing enzymes have been employed to study in vivo nascent RNA folding by inducing A-to-G mutations in dsRNA.30 Building on this, we propose expanding deaminase applications for RNA structure detection using the engineered TadA enzyme. TadA is a bacterial tRNA adenosine deaminase that modifies adenosine in tRNAArg based on the structure of the anticodon loop.31 The evolved variant, TadA-8e, is coupled with Cas9 (ABE8e, adenine base editor) to catalyze A·T to G·C substitutions in DNA.32 The DNA substrates of ABE8e adopt a constricted, anticodon loop-like but less rigid conformation.33 Interestingly, ABE8e also exhibits off-target activity in RNA, indicating that TadA-8e may have potential for RNA modification.32 Based on this, we hypothesize that TadA-8e may recognize and modify RNA in tRNA-like hairpin loop conformations, enabling the structural profiling of RNA across various subcellular compartments.
In this study, we validated the structural profiling capabilities of TadA-8e using well-characterized RNAs and published structurome data. TadA-8e demonstrated a sequence preference for "UA" and a strong structural affinity for single-stranded adenosines, especially in hairpin loops. TadA-8e was specifically expressed in subcellular compartments, including the nucleus, cytosol, and ERM, to profile single-stranded adenosines in RNAs across these compartments. This approach is termed TAS-seq, TadA-8e deaminase-assisted subcellular structural adenosine sequencing. TAS-seq revealed compartment-specific regulation of RNA stability and local structural variations, and it was also applied to single cells to uncover cytosolic RNA heterogeneity. Additionally, TAS-seq-detected adenosines were used to select highly efficient gRNAs for the CRISPR-Cas13d system, demonstrating excellent performance. TAS-seq provides a method for detecting subcellular single-stranded adenosines in RNA loop structures within cells and optimizing gRNA selection.
Results
Development and performance of TAS-seq for transcriptome-wide RNA profiling
Building on TadA-8e′s structural dependence on DNA,33 we developed a compartment-resolved RNA structure profiling strategy: anchoring TadA-8e to subcellular compartments via localization signals, introducing A-to-G mutations in specific structured RNAs as markers, and sequencing to readout structural markers (Figure 1A). To validate this strategy, we first assessed TadA-8e′s ability to modify RNA across the transcriptome. TadA-8e was expressed in HEK293T cells and specifically directed to the nucleus (Nuc_TAS-seq), cytosol (Cyt_TAS-seq), or ERM (Erm_TAS-seq) using localization signals NLS,34 NES,35 or ERM,28 respectively (Figures S1A and S1B). Subcellular localization of TadA-8e was validated (Figure S1C), and treated cells (with similar TadA-8e expression levels) and control cells (TadA-8e omitted, Ctl_TAS-seq) were sorted for RNA-seq library construction and sequencing (Figures S1D–S1F; Table S1).
Figure 1.

TAS-seq development and performance in HEK293T cells
(A) TAS-seq workflow for subcellular RNA detection.
(B) Mutation types in sequenced reads. The y axis represents the proportion of each mutation type relative to the total mutations, while the x axis indicates the sample source.
(C) Pearson correlation of mutation rates between two biological replicates.
(D) Modification sites across three compartments.
(E) Distribution of modification sites across RNA species and functional regions.
(F) Frequency distribution of RMR values.
(G) Sequence logos centered on modified adenine (A) residues, with RMR bins (0.00–1.00).
(H) Distribution of modified A sites and background A sites along mRNA, in the "UA" context or not.
Data in (C), (E), (H), and (G) were obtained from Cyt_TAS-seq.
As expected, A-to-G substitutions were the most prevalent modification in the treatment samples (Figure 1B), confirming TadA-8e′s ability to modify RNA. The control samples also exhibited a small number of mutations (Figure 1B), likely due to endogenous deaminases.36 To eliminate these, statistical analysis was performed to identify sites in the treatment samples that significantly differed from the control samples (Padj < 0.05, Fisher’s exact test37). The mutation rates (Reads(A-to-G)/Reads(Total)) of these endogenous sites were then excluded (STAR Methods). The remaining mutation rates showed strong correlations between replicates (Figure 1C, Pearson correlation coefficient R = 0.88), with within-replicate correlations higher than those between samples (Figure S2A), demonstrating the robust reproducibility of TAS-seq. Sites detected in both replicates were considered reliable TAS-seq modification sites, with the average mutation rate across replicates used as the reliable mutation rate (RMR).
A total of 0.37–0.9 million TAS-seq modification sites were identified across three subcellular compartments (Figure 1D), covering approximately 9,000 to 10,000 genes (Table S2), spanning exons and introns of mRNA and long noncoding RNA (lncRNA) (Figures 1E, S1G, and S1H). Despite the large number of modified sites, most RMRs were below 0.1 (Figure 1F). The wild-type bacterial TadA exhibited sequence dependence on the "UACG" motif.31 Sequence logo analysis of modification sites revealed an overrepresentation of the "UA" motif with no clear preference for the two bases downstream of the "UA" motif (Figures 1G, S1I, and S1J), indicating that TadA-8e has a more relaxed sequence preference compared with the native TadA. Overall, the widespread modification and relaxed sequence preference demonstrate TAS-seq’s profiling potential across various transcripts.
We assessed the potential effects of TadA-8e expression on cells. First, we analyzed changes in the transcriptome and found minimal alterations in RNA abundance after TadA-8e expression (Figure S2B). Next, we examined the modifications on mRNA stop codons and tRNA anticodon loops, in which the "UA" sequences are enriched. Although 0%–21.9% of stop codons exhibited modifications, their RMRs were predominantly below 0.1 (Figures S2C and S2D), indicating that TadA-8e has minimal impact on these sites. A35, the second nucleotide in the anticodon of tRNAVal(UAC) was modified, with RMRs ranging from 0.30 to 0.51 across compartments (Figure S2E). To examine whether these modifications affect global protein expression, we compared the protein profiles of TadA-8e-expressing and non-expressing cells and found no significant changes (Figure S2F). Additionally, no TadA-8e-induced modifications were found in the genomic DNA of cells expressing NLS-TadA-8e (Figure S2G). These results suggest that TadA-8e expression causes minimal disturbance to cells.
Sequence context alone cannot fully explain TadA-8e’s catalytic specificity. Identical sequence contexts showed divergent RMRs (Figure S1K), while mRNA modification sites exhibited a biased positional distribution that diverged from background A-site patterns (Figures 1H, S1L, and S1M), implicating additional recognition determinants, such as RNA structure and RNA processing. Comparative analysis of in vitro vs. in vivo RNA modifications revealed distinct patterns (Figures S2H–S2L). Given that RNA structure likely differs between environments,38,39 we hypothesized that the structural context might contribute to these differences, similar to the natural TadA’s dependence on the tRNAArg anticodon loop31 (Figure S2H).
TAS-seq’s structural preference for single-stranded adenosine
To investigate TadA-8e’s structural dependence, we analyzed modification sites on well-characterized structured RNAs from the Rfam database,40 including ribosomal RNAs (rRNAs) (18S, 28S, and 5.8S rRNA), small nuclear RNAs (U1, U2, U4, and U5), and RPPH1 lncRNA. Of the 63 modification sites, 90% were single-stranded (Table S2). ROC (receiver operating characteristic) analysis showed an AUC (area under the curve) of 0.82 (Figure 2A), indicating TadA-8e′s preference for single-stranded A (ssA). To supplement the limited number of modification sites, we designed 16 short RNA probes (53–117 nt; Table S3), validated their secondary structures using SHAPE-Map,41,42 and analyzed the modification site context (Figures S2M and S2N). A total of 80 modification sites were identified across these probes (Table S3). Combining both datasets (63 and 80), the overall AUC was 0.83 (Figure 2A), further supporting TadA-8e′s dependence on ssA. To further validate this dependence, we disrupted the RNA probe structure, converting ss-A28 into double-stranded A (ds-A27) while preserving the "UA" context (Figures 2B and S2O). The mutation rate was significantly reduced for recombinant TadA-8e (Figure 2B) and HEK293T-expressed TadA-8e (Figure 2C), confirming TadA-8e′s dependence on single-strandedness.
Figure 2.

TAS-seq structure preference of for single-stranded RNA
(A) ROC curve showing TAS-seq’s accuracy in detecting well-characterized RNAs and RNA probes.
(B) In vitro modification of ss-A or ds-A by recombinant TadA-8e. Left: Secondary structure of the RNA probe, color-coded by SHAPE reactivity scores, with the target A marked by a yellow triangle. Right: Modification rates (mean ± SD) over time. The ss-A follows a single exponential model (rate: 0.168 ± 0.002 min−1), while ds-A shows a slower, non-exponential modification rate.
(C) Modification of RNAs in (B) by cytosol TadA-8e expressed in HEK293T cells. Data are presented as mean ± SD. n = 3.
(D–F) Boxplots showing RMRs of A sites in Cyt_TAS-seq from HEK293T cells, overlapping with icSHAPE in HEK293 cytoplasm26 (D), DMS-MaPseq in whole HEK293T cells43 (E), and DMS-seq in whole K562 cells38 (F).
(G) Boxplot comparing DMS reactivities of A sites in DMS-MaPseq43 with those in icSHAPE from whole HEK293T cells.25
(H–K) Pearson correlations between Gini indices from distinct methods, as indicated.
(L–O) Pearson correlations between modification density (number of modification sites per gene length) in TAS-seq and RNA folding, represented by the Gini indices calculated by four nucleotides for SHAPE-based methods and A/C for DMS-based methods.
For (C)–(G), p values were calculated using the two-sided Mann-Whitney U test. ∗p < 0.05; ∗∗p < 0.01; ∗∗∗p < 0.001; ∗∗∗∗p < 0.0001. Boxplots show the median and 25th–75th percentile range, with the bars indicating the 5th–95th percentile range. For (D)–(G), reactivity scores were divided into four ranges: 0–0.25, 0.25–0.5, 0.5–0.75, and 0.75–1.
The numbers of A sites (D–G) and genes (H–O) used in analyses are labeled.
To assess TAS-seq’s single-strandedness preference across the transcriptome, we compared all TAS-seq data, including TAS-seq in K562 cells, with those from SHAPE- and DMS-based methods44(STAR Methods; Figure S3A). We found that overlaps of A sites detected by TAS-seq (mutation) with other methods and RMRs for these overlapped sites were higher in the high reactivity range (Figures S3C–S3G, S3K, S3M, and 2D–2F), which aligned with DMS-MaPseq (mutation) vs. icSHAPE (RT-stop) and DMS-seq (RT-stop) comparisons (Figures S3H–S3J, S3L, S3N, and 2G). These results suggest that TAS-seq detects similar A sites as other methods, with ssA being more readily modified. To further evaluate this similarity, we used the Gini index38,45 to quantify A-site distribution uniformity across RNA, and found strong positive correlations (R = 0.66–0.68) among all three methods (Figures 2H–2K, and S3B), indicating similar distribution patterns. We also used the Gini index to assess overall RNA folding, where a higher Gini index indicates greater RNA structure folding.26,38 We observed a negative correlation (R = −0.3 to −0.57) between the number of TAS-seq modification sites and RNA folding degree (Figures 2L–2O), suggesting that more folded (double-stranded) regions have fewer modification sites, while less structured (single-stranded) regions have more. These results further support the enrichment of TAS-seq modification on ssA, highlighting TAS-seq’s ability for structural profiling.
Modification sites on rRNAs are primarily located in hairpin loops (Figure S4A), suggesting TadA-8e′s potential substructure preference. To test this, we introduced base substitutions into the hairpin-structured RNA probe to convert it into an unfolded form (Figures 3A and S4B). Although the A site (ss-A31) remained single-stranded, mutation rates for both the recombinant TadA-8e and HEK293T-expressed TadA-8e significantly decreased (Figures 3A and 3B), indicating TadA-8e′s preference for certain substructures. To analyze the transcriptome-wide substructural feature, we predicted secondary RNA structures using RNAfold46,47 and classified them based on the nearest-neighbor model48 (Figure 3C). The predicted structures showed that higher RMRs correlated with greater single-strandedness (Figure S4C). Additionally, hairpin loops were more prevalent with higher RMRs, while other loop types decreased (Figures S4D–S4J). These findings suggest that TAS-seq preferentially detects A sites within hairpin loop structures. Further analysis with a 3D map (Figures 3D and S4K) revealed modification sites concentrated in loops of 4–10 nt (Figure 3D, middle) and helix lengths of 3–5 base pairs (bp) (Figure 3D, right; S4K), with RMRs peaking at specific loop and helix lengths. These patterns were validated by designing hairpin-structured RNA probes with different loop and helix lengths (Figures 3E–3G and S4L–S4T). Notably, the highest in vivo modification rate occurred at a 10 nt loop (Figures 3E–3G, A30), while in vitro it was at a 7-nt loop (Figures S4L–S4N, A28). The in vitro results aligned better with the 3D map, possibly due to RNAfold’s predicted structures more closely matching in vitro folding. This preference for a 7-nt loop reflects TadA-8e′s evolutionary origin: its progenitor, E. coli TadA,31 specifically targets A34 in the 7-nt anticodon loop of tRNAArg (Figure S2H). Despite adaptation to single-stranded nucleic acids and exclusion of rigid tRNA substrates,32,33 TadA-8e likely retains some of the ancestral structural recognition mechanisms, especially the spatial compatibility between the enzyme and RNA substrates. Taken together, these results demonstrate that TAS-seq preferentially modifies stable hairpin substructures, particularly those with restricted shorter loops and longer helices.
Figure 3.

TAS-seq preference for hairpin loop substructure
(A) In vitro modification of ss-A in a hairpin loop or the unfolded RNA by recombinant TadA-8e. Left: Secondary structure of the RNA probe, color-coded by SHAPE reactivity scores, with target A marked by a yellow triangle. Right: Modification rates (mean ± SD) of ss-A in hairpin loop RNA and unfolded RNA fitted a single exponential model, with speeds of 0.034 ± 0.0004 min−1 and 0.0006 ± 0.00002 min−1, respectively.
(B) Modification of RNAs from (A) by TadA-8e expressed in HEK293T cells.
(C) Diagram of substructures based on the nearest-neighbor model.48
(D) 3D map displaying the features of the hairpin structures containing modified ss-As. The model on the left indicates the values of the x axis and y axis. The map shows the loop length (x axis), helix length (y axis), the averaged RMR of modification sites (z axis), and the number of modification sites (color). The jagged pattern in the y-z plane was due to odd y values resulting from the bulge loop. Removing these values smoothed the y-z plane (Figure S4K).
(E) Secondary structure of RNA probes ranked by increasing loop length.
(F) Boxplot showing RMR of target A from (E).
(G) The line plot shows changes in RMRs as loop length increases based on data from (F).
For (B), (F), and (G), data are presented as mean ± SD. n = 3. For (B) and (F), p values were calculated using the two-sided Mann-Whitney U test. ∗p < 0.05; ∗∗p < 0.01; ∗∗∗p < 0.001; ∗∗∗∗p < 0.0001.
TAS-seq can profile subcellular RNA
TadA-8e′s spatial targeting enables compartment-specific RNA labeling, as exemplified by modifications to nuclear XIST lncRNA49 and cytosolic CHMP3 mRNA50 (Figures 4A–4C). To validate the subcellular specificity of TAS-seq modifications, we conducted a comparative analysis with APEX-seq, a method that captures subcellular RNA through proximity labeling.28 APEX-seq reports a spatial specificity of 91% for ERM-enriched RNAs, determined by DESeq2-based comparison of ERM vs. cytosolic RNAs and subsequent ROC analysis.28 Following a similar approach, we calculated enrichment ratios as log2(Erm/Cyt) or log2(Nuc/Cyt) (STAR Methods; Table S2) for TAS-seq. ROC analysis of ERM-enriched RNAs, using ER-enriched RNAs from ribosome profiling51 and non-secretory RNAs as references, revealed a spatial specificity of approximately 70% for TAS-seq (Figure 4D). Analogous analysis of nucleus-enriched RNAs, utilizing validated nuclear and cytoplasmic RNAs from Fractionation-seq,28,52 demonstrated a spatial specificity of around 92% in HEK293T cells and 86% in K562 cells for TAS-seq (Figures 4E and 4F). These results indicate that TAS-seq exhibits lower ERM specificity (70% vs. 91%) compared with APEX-seq28 but demonstrates superior nuclear specificity (92%/86%). This suggests that TAS-seq achieves higher spatial specificity within membrane-enclosed subcellular compartments than in open compartments. Unlike APEX-seq, which relies solely on physical proximity,28 RNA labeling in TAS-seq requires both compartment localization and structural accessibility, such as single-stranded regions. The observed lower spatial specificity of TAS-seq at the ERM likely reflects an inherent trade-off between capturing RNA localization and structural features.
Figure 4.

TAS-seq can detect subcellular RNA
(A) Schematic of TadA-8e localization and subcellular RNA labeling.
(B and C) IGV tracks displaying RMR profiles for XIST lncRNA (B) and CHMP3 mRNA (C).
(D–F) ROC analysis of TAS-seq specificity for HEK293T ERM (D), HEK293T nucleus (E), and K562 nucleus (F)-enriched RNAs. Colored dashed lines and text show ROC cutoffs.
(G–L) Correlation plots between TAS-seq modification differences (y axis) and RNA enrichment ratios (x axis) from Fractionation-seq28 (G and I), LoRNA53 (H, J, and L), and APEX-seq28 (K) methods, as indicated.
To mitigate structural confounding effects on spatial specificity, we conducted an aggregate analysis by treating the modification sites from one sample as a whole. Compartment-specific modification differences were calculated as the ratio of aggregated modification site counts between two samples and were then aligned with the RNA localization ratio from compartment-enriched Fractionation-seq28,52 and APEX-seq28 datasets, as well as compartment-quantified LoRNA53 datasets (STAR Methods; Figure S5A). We found that the differences in nuclear RNA modification between Nuc_TAS-seq and Cyt_TAS-seq increased with higher nuclear enrichment ratios and greater nuclear RNA abundance (Figures 4G, 4H, S5B, and S5C). Cytosolic and ERM-localized RNAs displayed the same patterns as the RNA localization ratio increased (Figures 4I–4L, S5D, and S5E). These findings demonstrate a strong correlation between TAS-seq modifications and RNA localization, highlighting the method’s effectiveness in accurately labeling subcellular RNA. Additionally, we analyzed RNA contamination across compartments and compared it with the icSHAPE and Fractionation method.26 We found slightly higher, but still low, proportions of nuclear RNA in Cyt_TAS-seq and cytosolic RNA in Nuc_TAS-seq compared with those in icSHAPE and Fractionation (Figures S5F–S5H). However, ERM RNA contamination in Nuc_TAS-seq was lower than in icSHAPE and Fractionation (Figure S5H), consistent with the previous report,28 demonstrating Nuc_TAS-seq’s improvement for nuclear RNA profiling.
We observed that RNA folding varies between compartments. For instance, when RNA abundance was similar in the nucleus and cytosol, Nuc_TAS-seq detected more modification sites than Cyt_TAS-seq (Figures 4H and 4J). Since TadA-8e expression levels were consistent across compartments (Figures S1E and S1F), this difference suggests that nuclear RNAs are more easily detected by TAS-seq, indicating that those nuclear RNAs are less structured than cytosolic RNAs. Similarly, Cyt_TAS-seq identified more modification sites than Erm_TAS-seq (Figure 4L), implying that cytosolic RNAs are less folded than ERM-RNAs. These differences in RNA folding may be related to the functional roles of RNA in each compartment, warranting further investigation. Despite the more easily modified nuclear RNA, we found more modification sites in cytosolic RNAs (Figure 1D) due to their high abundance.53 The RMR of the modification site in TAS-seq closely matches the ratio of modified reads to total whole-cell reads (STAR Methods), thereby reflecting the abundance of modified sites in the entire cell (Figures 4H, 4J, and 4L). Since RNA function is closely linked to its abundance,54,55 quantitative structural data are essential for understanding the relationship between RNA structure and its life cycle.
TAS-seq contributes to the study of structure-related cell events
RNA structure influences its life cycle, from transcription and processing to function and degradation.12,23,56,57 Previous studies have shown that more structured RNAs, both in the nucleus and cytoplasm, correlate with shorter half-lives.26 Our findings support this, as fewer TAS-seq modifications (indicating more folded RNA) correlate with shorter RNA half-lives (Figures 5A–5C, S6A, and S6B). Interestingly, these correlations varied across compartments. In the nucleus, the correlation was low (0.42 in K562, 0.25 in HEK293T) (Figures 5A and S6A), while in the cytosol, it was higher (0.55 in K562, 0.30 in HEK293T) (Figures 5B and S6B). The correlation in the ERM was similar to the cytosol (0.32 in HEK293T) (Figure 5C). RNA stability is regulated by global mechanisms, such as 5′ cap and poly(A) tail deprotection,58 exonuclease and endonuclease activity,59 RNA-binding proteins (RBPs),60 and RNA modifications.61,62 However, compartment-specific factors also play a role. For example, nuclear RNA surveillance is influenced by transcription and processing,63 and cytosolic and ERM RNA stability is influenced by translation,64,65 especially protein-folding factors, like endoplasmic reticulum-associated degradation (ERAD) and the unfolded protein response (UPR) in the ER.66 Further analysis revealed stronger correlations between TAS-seq modifications and RNA half-life for mRNA and ncRNA (0.56 vs. 0.5 in K562 cytosol, 0.33 vs. 0.21 in HEK293T cytosol, and 0.34 vs. 0.23 in HEK293T ERM) (Figures S6C–S6H). TAS-seq modifications in the coding sequence (CDS) showed the strongest correlation with RNA half-life (0.61 in K562 cytosol, 0.35 in HEK293T cytosol, and 0.36 in HEK293T ERM) (Figures S6I–S6K). These results suggest that compartment-specific translation may contribute to half-life differences. In summary, TAS-seq modifications reflect compartment-specific RNA stability regulation, highlighting the importance of considering RNA structure in stability studies.
Figure 5.

RNA structure dynamics
(A–C) Scatterplots showing the Pearson correlation between RNA half-life and modification density (number of modification sites per gene length) in the nucleus (A) and cytosol (B) of K562 cells, and ERM of HEK293T cells (C). The "n" represents the number of genes used in analyses.
(D) IGV tracks showing the dynamic structure of HNRNPA2B1 mRNA.
(E) Variation sites across five comparison groups, along with the overlap of variation sites between each pair of groups.
(F) The number of variation sites at the gene level.
(G–I) Distribution of variation sites across mRNA.
(J–L) Enriched GO terms for the top 30% of genes with the highest number of variation sites.
For (G)–(L), variation sites were from a comparison between the nucleus and cytosol of HEK293T cells (G and J), the cytosol and ERM of HEK293T cells (H and K), and the cytosol of HEK293T cells and K562 cells (I and L).
Recent advances in RNA research have emphasized the dynamic nature of RNA structures.67,68 For instance, RNA structures are remodeled during splicing, with increased single-strandedness upstream of 5′ splice sites,69 a pattern also observed in TAS-seq (Figure S6L). Given TAS-seq’s ability to profile subcellular RNA, we applied it to investigate local structural variations across different subcellular compartments and cell lines. For example, HNRNPA2B1 (heterogeneous nuclear ribonucleoprotein A2/B1) mRNA, involved in pre-mRNA processing and mRNA metabolism,70 shows distinct structures between the nucleus and cytoplasm, as confirmed by icSHAPE26 (Figure 5D). TAS-seq similarly revealed consistent adenosine variations in HNRNPA2B1 mRNA (Figure 5D). To account for RNA abundance differences among compartments, we adjusted RMR values (norRMR) by Max Absolute Normalization (STAR Methods). The norRMR represents the relative RMR ratio of mutation sites within the same gene, offering greater accuracy than RMR for analyzing structural variations, as shown in the example of HSP90AB1 (heat shock protein 90 alpha family class B member 1) mRNA (Figure S7A). We then calculated norRMR difference for each modification site across samples, including variation between the nucleus and cytosol (Nuc/Cyt Var), cytosol and ERM (Cyt/Erm Var), and between HEK293T and K562 cells (Nuc_Cell line Var, Cyt_Cell line Var). A variation site was identified when the norRMR difference met statistically rigorous thresholds (greater than random differences, and Padj < 0.01) (STAR Methods).
We identified 0.05 to 0.14 million variation sites, representing 4.7%–13% of total modification sites (Figure 5E; Table S4). The median number of variation sites per gene ranged from 4 to 15 (Figure 5F). These results suggest that most RNA structures remain stable across subcellular compartments and cell lines. There was minimal overlap in variation sites between compared samples (Figure 5E), but nearly half of the genes with variation sites were shared (Figure S7B). This suggests that while variations are widespread across genes, the variation sites are specific to compartments and cell lines. RNA-binding proteins (RBPs) are linked to structural variations.26,67,71 We observed modification variations in RBP-RNA interaction regions, including those of RBM22 (RNA-binding motif protein 22), ZC3H8 (zinc finger CCCH-type containing 8), PHF6 (PHD finger protein 6), SMNDC1 (survival motor neuron domain containing 1), and AATF (apoptosis antagonizing transcription factor) (Figures S7G–S7K). These RBPs are predominantly localized in the nucleus (annotated from UniProt72 and the Human Protein Atlas database73), and nuclear RNAs exhibited higher norRMRs. These outcomes suggest that RNA structures in RBP-RNA interaction regions may be more unfolded, potentially facilitating or resulting from RBP binding.
Then, we examined the distribution of variation sites along mRNA and found that, compared with the total modification sites, the number of variation sites in the CDS region decreased, while those in the UTR regions increased (Figures 5G–5I, S7C, and S7D). UTRs are hotspots for post-transcriptional regulation processes, such as RNA processing and translation.74,75,76 The increase in variation sites may be related to these processes. Gene Ontology (GO) analysis revealed that variation sites correlated with their functions in corresponding compartments. For instance, genes containing Nuc/Cyt_Var sites were enriched in RNA processing and translation pathways, while genes with Cyt/Erm_Var sites were enriched in protein processing pathways (Figures 5J–5L, S7E, and S7F). In summary, these findings suggest that while overall RNA folding may remain largely stable across subcellular compartments or cell lines, local RNA regions may undergo structural changes to facilitate or adapt to specific functions in these contexts.
TAS-seq facilitates the selection of gRNA in the CRISPR-Cas13d system
CRISPR-Cas13d is a pivotal tool in RNA engineering,15,77,78 and particularly popular in RNA knockdown studies,79 with its efficiency influenced by the complementarity between the gRNA and single-stranded target RNA.19,80 Since TAS-seq detects ssA, we hypothesized that TAS-seq could help design optimal gRNA target sites. To test this, we analyzed the relationship between TAS-seq’s modification and gRNA on-target activity from two published gRNA libraries, which underwent cellular fitness (dropout) screening in HEK293 and K562 cells, and a higher dropout rate indicates stronger on-target gRNA activity.20,81 Given Cas13d’s nuclear localization,20,81 we investigated nuclear modification sites on target RNAs. We found that the more modification sites presented in the target RNA, within a certain range (modified A number ≤9), the higher gRNA on-target activity—a trend not observed for background A sites (Figures 6A–6C). These results suggest that the ssA detected by TAS-seq enhances gRNA activity, likely due to the increased accessibility of the target RNA for gRNA binding. Additionally, nuclear RNA exhibited slightly higher gRNA activity than cytosolic RNA (Figures S8A–S8C), likely due to the greater similarity of nuclear RNA to the target RNA. Since both TAS-seq and gRNA activity depend on RNA sequence context, we examined how A-site context impacts gRNA activity. We found that gRNAs targeting TAS-seq-detected A sites, regardless of sequence context, generally exhibited higher on-target activity (Figures S8D and S8E). Next, we compared TAS-seq with icSHAPE26 and DMS-seq38 in gRNA selection. Our findings showed that gRNAs targeting RNA with TAS-seq-detected sites exhibited higher activity than those targeting nucleotides from other methods (Figures 6D, 6E, and S8J–S8M). These results suggest that TAS-seq is more effective for selecting high-activity gRNAs.
Figure 6.

TAS-seq contributes to gRNA selection for the CRISPR-Cas13d system in vivo
(A–C) gRNA on-target activity correlates with nuclear modifications in HEK293T (A and B: libraries 1–2) and K562 (C: library 2).
(D and E) Comparison of TAS-seq with icSHAPE26 (E) and DMS-seq38 (E) for gRNA selection (SHAPE/DMS reactivity threshold ≥0.25).
(F) Heatmap showing the averaged on-target activity (min-max normalized) of gRNAs targeting modified A sites in each position.
For (A)–(E), on-target activity was quantified by gRNA counts at day 7 of 14 (mean ± SE). Two-sided Mann-Whitney U test; ∗∗p < 0.01. Analyzed gRNA numbers (n ≥ 10) are shown near trendlines.
To examine whether the position of TAS-seq-detected sites in target RNA affects gRNA activity, we analyzed the positional correlation between modified A sites and on-target efficacy. gRNAs pairing with TAS-seq-detected sites in the seed region (nucleotides 15–2120) exhibited higher activity than those targeting non-seed regions (Figure 6F), whereas unmodified A sites showed no such trend (Figure S8N), indicating seed-region modification enhances Cas13d editing. Moreover, we evaluated whether TAS-seq could contribute to gRNA selection for different gene categories, including essential, non-essential, coding, and noncoding genes. Our analysis showed that modified target RNAs from various gene types consistently exhibited higher gRNA activity (Figures S8F–S8I). However, for essential genes, the increase in gRNA activity was more pronounced only when the target RNA contained at least three TAS-seq-detected sites (Figure S8F). This could be due to the stronger impact of essential genes on cellular fitness, which diminishes the observed differences in gRNA depletion. Consequently, significant differences in gRNA depletion only emerged when target RNA accessibility reached a threshold of at least three modified sites. These findings establish TAS-seq as a versatile tool for optimizing gRNA across diverse gene types. Within a certain range (modified A number ≤9), the greater the number of TAS-seq-detected sites in the target RNA, especially in the seed region, the higher the gRNA activity.
TAS-seq’s role in guiding gRNA selection extends to the cell-free Cas13d system, which is used in CRISPR diagnostics for nucleic acid detection. We validated this with dCas13d binding affinity data from Kuo et al.'s RNA-CHAMP platform, which showed that dCas13d binding requires a partially unstructured distal region (positions 11–22) in target RNA.82 For instance, a target with unpaired distal nucleotides (Figure S9A) exhibited higher dCas13d binding affinity than its paired counterpart. Distal adenosines in high-affinity targets showed higher RMRs (Figure S9A), aligning with cellular findings. We then designed an RNA library with protospacer flanking sequence (PFS) variations (Table S3), which induced structural changes. Cas13d binding affinities were measured using dissociation constants (kd ≤ 30% relative error) from Kuo et al.'s work,82 covering 136 target RNAs. Among these, target RNAs containing modifications at A18 and A9 (in the "UA" context) were the most abundant (136 and 134 targets, respectively; Table S3). Target RNAs modified at A18 (distal region) exhibited a higher dCas13d binding affinity, despite having lower modification rates compared with A9 (proximal region) (Figure S9B), consistent with Kuo et al.'s findings on the distal region’s importance.82 Moreover, dCas13d binding affinity increased with higher A18 modification rates (Figure S9C). In addition, modification of other adenosines, regardless of their positional context (distal vs. proximal), also enhanced dCas13d binding affinity (Figures S9D and S9E). These results demonstrate a positive correlation between TadA-8e modification and dCas13d binding in vitro. Overall, our findings suggest that TAS-seq-detected sites facilitate gRNA selection for both in vivo and in vitro CRISPR-Cas13d systems.
scTAS-seq at the single-cell level
Single-cell DNA and RNA technologies have uncovered critical differences in RNA abundance,83 splicing,84 and RNA-RBP interactions85—insights often hidden in bulk analyses. Single-cell RNA structure studies can deepen our understanding of cellular identity, RNA dynamics, and their impact on cellular functions. The current single-cell RNA structural method, sc-SPORT, uses chemical reagents to label single-stranded nucleotides, introducing mutations (mutation rate <5%) during reverse transcription.42 However, sc-SPORT is limited by premature reverse transcriptase drop-offs, restricting RNA fragmentation to ∼1,000 nt.42 Additionally, while sc-SPORT captures RNA from entire cells, it struggles to effectively capture subcellular structures, such as those in the cytosol. To overcome these limitations, we performed single-cell Cyt_TAS-seq, validating its ability to detect full-length cytosolic RNA heterogeneity at the single-cell level.
We conducted scTAS-seq on 10 single cells, generating 14 to 40 million mapping reads per cell (Figure S10A). The number of detected genes increased linearly with sequencing depth (Figure S10B). At a typical sequencing depth of 2 million reads per cell, we obtained structural data for approximately 8,000 genes (Figure S10B), demonstrating the high quality of scTAS-seq for single-cell RNA detection. To assess reliability, we combined reads from all cells to create a pseudo-bulk dataset and compared it with true bulk Cyt_TAS-seq data. A strong Pearson correlation was observed between the pseudo-bulk and true bulk data (Figure S10C), confirming scTAS-seq’s reliability. We examined read distribution and found coverage of the entire gene body (Figure 7A), indicating that scTAS-seq captures structural information from full-length RNA. Finally, we detected 0.15 to 0.6 million modification sites per cell (Figure S10D).
Figure 7.

STAS-seq reveals single-cell RNA structural heterogeneity
(A) Gene body coverage of Cyt_scTAS-seq.
(B) Transcript-level structural heterogeneity across cells (homogeneous: 25th percentile; heterogeneous: 75th percentile) with representative gene annotations.
(C and D) Heatmap of RMR and homogeneity R2 to represent the structural homogeneity of MIF mRNA (C) and the structural heterogeneity of BUB3 mRNA (D) (Rows: modifications; Columns: single cells; Line plots: site-specific R2 values).
(E and F) Enriched GO terms for structurally homogeneous (E) and heterogeneous (F) transcripts.
Next, we explored whether scTAS-seq could detect cytosolic RNA structural heterogeneity across cells. The extent of structural heterogeneity for each transcript (∼2,000 genes) was determined by cosine distance analysis as previously,42 which measured RMR variations in each transcript across cells (STAR Methods). Our analysis revealed different levels of structural heterogeneity across cells (Figure 7B; Table S4). For example, the MIF (macrophage migration inhibitory factor) transcript showed negligible RMR differences and low structural heterogeneity (Figure 7C), while the BUB3 (mitotic checkpoint protein) transcript exhibited notable RMR variations and high structural heterogeneity (Figure 7D). Structural heterogeneity may relate to RNA function. For example, rRNAs, which are essential for cellular function, exhibit structural homogeneity.42 Although the poly(A)-dependent scTAS-seq method inherently limits the detection of non-polyadenylated RNAs (e.g., rRNAs, tRNAs, snRNAs), we observed detectable modifications on 28S rRNA. As expected, the 28S rRNA showed structural conservation with a homogeneity score of 0.09 (Figure 7B), lower than the transcriptome-wide average (mean = 0.26), aligning with its essential role as a ribosomal component. To explore the relationship between structural heterogeneity and transcript function, we performed GO term analysis on the 25th percentile (most homogeneous) and 75th percentile (most heterogeneous) of transcripts. Homogeneous transcripts were predominantly enriched in basal metabolic pathways such as rRNA processing, translation, and protein processing (Figure 7E). These pathways are conserved and essential for cell survival,86,87 and RNA structure of these transcripts could be tightly regulated to maintain stability. In contrast, heterogeneous transcripts were mainly involved in regulatory networks governing gene expression, RNA processing, and localization (Figure 7F). These networks are associated with specialized functions, including differentiation, immune responses, metabolic regulation, and neural functions,88,89 and regulatory mechanisms underlying these processes are more complex and variable, suggesting that RNA structure variability may play a key role in their regulation. Overall, scTAS-seq is a powerful tool for detecting cytosolic RNA structural heterogeneity, revealing how structural variation correlates with the functional properties of transcripts and their regulation across cells.
Discussion
This study introduces TAS-seq, a high-throughput method that profiles adenosine structural variations across subcellular RNAs by fusing the deaminase TadA-8e with a localization peptide. TAS-seq demonstrated a sequence preference for "UA" and a strong structural affinity for single-stranded A, particularly in the hairpin loop substructure. We applied TAS-seq to subcellular compartments (nucleus, cytosol, and ERM) and single cells. TAS-seq revealed local structural variations across subcellular compartments. RNA half-life correlates with its structure, and this correlation differs between compartments, highlighting compartment-specific regulation of RNA stability. Additionally, 4.7%–13% of modification sites exhibited significant compartmental differences, partly due to the interplay between RNA and RBPs. These variation sites were enriched in the UTRs, with associated genes linked to compartment-specific regulatory pathways. We hypothesize that local structural changes occur to support compartment-specific functions, possibly through interacting with RBPs. RNA structural heterogeneity was also observed at the single-cell level, with RNA involved in specialized functions exhibiting greater diversity. Additionally, TAS-seq-detected sites were used to select highly efficient gRNAs for the CRISPR-Cas13d system, which outperformed SHAPE-26 and DMS-based38 methods, likely due to TAS-seq’s ability to detect both structurally accessible RNA and its abundance in the entire cell. Overall, TAS-seq is a powerful tool for studying RNA dynamics and optimizing gRNA selection.
TAS-seq has the advantage of detecting A-site structures of RNA in subcellular compartments and exhibits strong compartment specificity for nuclear RNA. For instance, while icSHAPE detected abundant signals for the nuclear XIST lncRNA in the cytoplasm,26 TAS-seq identified numerous modification sites exclusively in the nucleus (Figure S5I). TAS-seq also minimized the ERM RNA contamination in nuclear RNA detection. In addition to detecting adenosine structures across compartments, TAS-seq quantifies their proportion throughout the entire cell, providing quantitative data to deepen our understanding of the relationship between RNA structure and its function. Moreover, TAS-seq is less dependent on sequencing depth than other methods. With 28–38 million reads, TAS-seq detected modification sites on 9,147 to 10,171 genes (Table S2), whereas icSHAPE, with 97–189 million reads, detected structural information on only 3,775 to 5,077 transcripts.26 Finally, scTAS-seq enables the detection of subcellular RNA at the single-cell level, broadening our knowledge of cellular identities.
RNA subcellular localization and structure are crucial in cellular processes such as gene expression regulation, development, differentiation, and stress responses.88,90,91 TAS-seq, which enables the study of specific subcellular adenosine structures at both bulk and single-cell levels, offers valuable insights into the RNA structural dynamics. Additionally, CRISPR-Cas13 systems hold great potential for RNA manipulation, RNA-based therapeutics, diagnostics, and disease modeling.15,17 TAS-seq can be applied to select highly efficient gRNAs for the CRISPR-Cas13d system, improving RNA manipulation efficiency. TadA-8e expression can theoretically be driven by specific promoters, such as cell-type-specific or cell-cycle-specific promoters, allowing the study of RNA structures under different physiological conditions. Furthermore, protein engineering92 could further refine the deaminase, broadening its RNA-probing capabilities. Compared with the native TadA,31 TadA-8e has reduced sequence and structure dependencies. Further engineering could enhance its structure-probing abilities, including greater modification efficiency, minimal sequence context influence, broader substructure specificity, and four-nucleotide recognition. These advancements would significantly improve RNA structure profiling, offering deeper insights into RNA structure dynamics and the mechanisms underlying RNA function regulations.
Limitations of the study
TAS-seq is limited to adenosine modification. Although the overall modification provides insight into RNA folding, TAS-seq cannot directly assess the structure of all nucleotides. Moreover, TAS-seq has sequence context preferences. When comparing RNA structural variation across different compartments, sequence context differences are negligible. However, when comparing structural differences within the same compartment, the sequence context should be considered. In addition, the TadA-8e modification may be hindered by steric constraints, making it difficult to modify adenosine sites deeply embedded in RNA structures or ribonucleoprotein (RNP) complexes. For example, we observed a slight decrease in norRMR at the RBP binding site (Figures S7G and S7K). TadA-8e modified inosine may lead to cellular disturbance, and caution should be taken when analyzing individual cases.
Resource availability
Lead contact
Further information and requests for resources should be directed to and will be fulfilled by the lead contact, Lijia Ma (malijia@westlake.edu.cn).
Materials availability
This study did not generate new unique reagents.
Plasmids generated in this study have been deposited in Table S1.
Data and code availability
-
•
Raw and analyzed data have been deposited at GEO (GEO: GSE278863). RNA probe and target RNA data are available in Table S3. All the public datasets used in the study are listed in the STAR Methods subsection.
-
•
This paper does not report the original code. Data analysis methods are described in the STAR Methods and source code reported in this paper will be shared upon request.
-
•
Any additional information required to reanalyze the data reported in this paper is available from the lead contact upon request.
Acknowledgments
We thank the Biomedical Research Core Facilities and High-Performance Computer Center of Westlake University for their excellent technical assistance. This work was partially supported by Pioneer and Leading Goose R&D Program of Zhejiang (grant no. 2024SSY0033), the Research Center for Industries of the Future (RCIF) at Westlake University, and startup funding to Dr. Lijia Ma from Westlake Educational Foundation.
Author contributions
L.W. and Y.Z. contributed equally to this article. L.W., Z.L., and L.M. conceived and coordinated the whole project. L.W. performed experiments with the help of Y.Z., Z.Y., and P.W. L.W. and Y.Z. analyzed the data and made figures with the help of L.M. L.W. drafted the original manuscript. L.M., Y.Z., and Z. L. reviewed and edited the manuscript.
Declaration of interests
The authors declare no competing interests.
STAR★Methods
Key resources table
| REAGENT or RESOURCE | SOURCE | IDENTIFIER |
|---|---|---|
| Antibodies | ||
| Mouse monoclonal ANTI-FLAG® M2 antibody | Sigma-Aldrich | Cat# F1804; RRID: AB_262044 |
| GAPDH Monoclonal Antibody | Thermo Fisher Scientific | Cat# MA5-15738; RRID: AB_2537652 |
| Goat anti-mouse IgG conjugated with HRP | Thermo Fisher Scientific | Cat# 31430; RRID: AB_228307 |
| Goat anti-Mouse IgG conjugated with Alexa Fluor™ Plus 555 | Thermo Fisher Scientific | Cat# A32727; RRID: AB_2633276 |
| Bacterial and virus strains | ||
| BL21(DE3) Competent E. coli | New England Biolabs | Cat# C2527I |
| Chemicals, peptides, and recombinant proteins | ||
| Lipofectamine™ 3000 | Invitrogen | Cat# L3000015 |
| RNAiso Plus | Takara | Cat# 9108 |
| T7 RNA polymerase | New England Biolabs | Cat# M0251L |
| NAI-N3 | MACKLIN | Cat# N881804 |
| Recombinant TadA-8e | This paper | N/A |
| Critical commercial assays | ||
| VAHTS™ Stranded mRNA-seq Library Prep Kit for Illumina® V2 | Vazyme | Cat# NR602 |
| VAHTS™ Total RNA-seq (H/M/R) Library Prep Kit for Illumina® | Vazyme | Cat# NR603 |
| SMART-Seq® v4 Ultra® Low Input RNA Kit | TaKaRa | Cat# 634891 |
| TruePrep™ DNA Library Prep Kit V2 for Illumina® | Vazyme | Cat# TD503 |
| QiAseq miRNA Library kit | Qiagen | Cat# 331502 |
| Deposited data | ||
| Raw and analyzed data | This paper | GEO: GSE278863 |
| Published SHAPE- and DMS-methods data | RASP V2.0 databases44 | http://rasp2.zhanglab.net/ |
| HEK293T fractionation-seq, APEX-seq | Fazal et al.28 | GEO: GSE116008 |
| K562 fractionation-seq | ENCODE52 | GEO: GSE90236, GSE90220 |
| U2-OS LoRNA | Villanueva et al.53 | ENA: PRJEB49479 |
| HEK293 RNA half-life | Agarwal et al.93 | N/A |
| K562 RNA half-life | Schofield et al.94 | N/A |
| Cas13d gRNA Library 1 | Wessels et al.20 | N/A |
| Cas13d gRNA Library 2 | Liang et al.81 | N/A |
| Cas13d/target RNAs binding affinity | Kuo et al.82 | N/A |
| Experimental models: Cell lines | ||
| HEK293T | ATCC | N/A |
| K562 | ATCC | N/A |
| Oligonucleotides | ||
| RNA probe and target RNA sequences, see Table S3 | This paper | N/A |
| Primers, see Table S1 | This paper | N/A |
| Recombinant DNA | ||
| ABE8e plasmid | Addgene | Cat# 38489 |
| TadA-8e plasmid, see Table S1 | This paper | N/A |
| RNA expression plasmid, see Table S1 | This paper | N/A |
| Software and algorithms | ||
| ImageJ | Schneider et al.95 | https://imagej.net/ij/ |
| RNAfold (version 2.5.1) | Gruber et al.46 | http://rna.tbi.univie.ac.at/ |
| Gene Ontology term analysis | DAVID96 | https://david.ncifcrf.gov |
| STAR | Dobin et al.97 | https://ngcloud.readthedocs.io/projects/pipe-star/en/latest/index.html |
| REDItools2 | Picardi et al.98 | https://github.com/BioinfoUNIBA/REDItools2 |
| HTSeq | Anders et al.99 | https://htseq.readthedocs.io/en/latest/ |
| RSEM | Li et al.100 | https://github.com/deweylab/RSEM |
| DESeq2 | Love et al.101 | https://www.bioconductor.org/packages/release/bioc/html/DESeq2.html |
Experimental model and study participant details
Cell culture
HEK293T cells were cultured in high glucose DMEM medium (Sigma) supplemented with 10% FBS (Gibco) and 1% PS (Gibco) at 37°C with 5% CO2 in 10 cm plates. K562 cells were cultured in RPMI 1640 medium (Gibco), supplemented with 10% FBS and 1% PS, in 175 cm2 flasks at 37°C with 5% CO2. E. coli BL21(DE3) (New England Biolabs, Cat# C2527I) was cultured in an incubator shaker at 37°C and 220 rpm in an LB medium.
Method details
Plasmid construction
The DNA fragment encoding TadA-8e was amplified from the Plasmid ABE8e plasmid (Addgene, Cat# 38489) and cloned into a modified pCDNA3.1 plasmid (Addgene, Cat# V790-20), wherein the CMV promoter had been replaced with an EF-1α promoter. To achieve targeted subcellular localization, NES, 3×NLS, or ERM peptides were fused to the C-terminus of TadA-8e, followed by EGFP as a reporter. The fusion construct contained TadA-8e, a subcellular localization peptide, an FLAG tag, a P2A peptide, and the EGFP coding sequence (Figures S1A and S1B). For the control plasmid, TadA-8e and the localization peptide were omitted. Complete plasmid sequences are provided in Table S1.
DNA templates of RNA probes (Table S3) were commercially synthesized and cloned into the vector backbone (Addgene, Cat# 52963). RNA probe expression was driven by the U6 promoter and terminated by a polyU termination signal (Figure S2M). The mKate2 coding sequence was cloned downstream of the EF-1α promoter to serve as a selectable marker for fluorescence-activated cell sorting (Figures S2M and S2N). These constructs are collectively termed "RNA probe expression plasmids" (sequences in Table S1).
For E. coli expression of recombinant TadA-8e, the coding sequence was codon-optimized. The TadA-8e sequence containing an N-terminal non-cleavable His6 tag was inserted between the NcoI and EcoRI sites of the pET28a plasmid (Addgene, Cat# 69864-3). The final expression plasmid sequence is detailed in Table S1.
Fluorescence imaging of TadA-8e
To assess TadA-8e subcellular localization, HEK293T cells were seeded onto glass coverslips pretreated with TC (Solarbio, Cat# YA0350) in a 12-well dish. After 24-h culture (∼60% confluency), cells were transfected with TadA-8e expression or control plasmids using Lipofectamine 3000 (Invitrogen, Cat# L3000015). Following a 24-h incubation, cells were fixed with 4% paraformaldehyde, blocked with PBS containing 1% BSA, and sequentially incubated with: Mouse monoclonal ANTI-FLAG M2 antibody (Sigma-Aldrich, Cat# F1804) and Goat anti-Mouse IgG conjugated with Alexa Fluor Plus 555 (Thermo Fisher Scientific, Cat# A32727). After washing with 1% BSA and 0.1% Triton X-100 in PBS, cells were mounted using Mounting Medium with DAPI (Solarbio, Cat# S2110). FLAG-tagged TadA-8e localization was imaged using fluorescence confocal microscopy (Nikon ECLIPSE Ti2) with a 60× oil immersion objective.
TadA-8e expression level and whole-cell protein analysis
To assess TadA-8e expression level, EGFP-positive HEK293T cells (FITC signal intensity > 104), were sorted by flow cytometry (Sony MA900) and lyzed in RIPA buffer (Thermo Fisher Scientific, Cat# 89900) supplemented with Protease Inhibitor Cocktail (Thermo Fisher Scientific, Cat# A32965). Lysates were resolved on 4–20% SDS-PAGE gels (GenScript, Cat# 00655) and transferred onto PVDF membranes (MilliporeSigma, Cat# IPVH00010). The FLAG-tagged TadA-8e was detected using mouse monoclonal ANTI-FLAG M2 antibody (Sigma-Aldrich, Cat# F1804) and HRP-conjugated goat anti-mouse IgG (Thermo Fisher Scientific, Cat# 31430). GAPDH protein was detected with GAPDH Monoclonal Antibody (Thermo Fisher Scientific, Cat# MA5-15738) and served as a loading control. Protein band intensities were quantified using ImageJ95 (https://imagej.net/ij/).
For whole-cell protein analysis, protein extraction was performed as previously described.102 Briefly, HEK293T cells were lyzed in RIPA-soluble buffer (50 mM Tris pH 7.5, 150 mM NaCl, 1% NP-40, 0.1% SDS, 1× Protease Inhibitor Cocktail). Lysates were centrifuged at 20,000 × g for 5 min at 4°C, with the supernatant collected as the RIPA-soluble fraction. The pellet was washed once with RIPA-soluble buffer, then resuspended in RIPA-insoluble buffer (50 mM Tris pH 7.5, 150 mM NaCl, 50 mM DTT, 2% SDS, 8 M urea, 1× Protease Inhibitor Cocktail). After 10 min incubation at 95°C with vortex, samples were centrifuged (20,000 × g, 2 min, 25°C) to obtain the RIPA-insoluble fraction. Both fractions were resolved on 4–20% SDS-PAGE gels and stained with Coomassie brilliant blue (Beyotime, Cat# P0017F).
TAS-seq in bulk cells and library construction
For HEK293T cells, TadA-8e expression or control plasmids were transfected using Lipofectamine 3000 at a dose of 10 μg plasmid per 25 flasks (∼60% confluency). For K562 cells, plasmids were delivered via an electroporation system (BTX Gemini X2) in Opti-MEM medium (Gibco) with 10 μg plasmid per 106 cells. Following a 24-h culture, EGFP-positive cells (FITC signal intensity >104) were sorted using a Sony MA900 flow cytometer. Higher expression of TadA-8e resulted in increased modification, so its expression level was carefully controlled to prevent unintended effects. Before library construction, TadA-8e expression uniformity across samples was validated. Approximately 0.5–1 million sorted cells were used for library construction.
For RNA library preparation, cells were lyzed using RNAiso Plus (Takara, Cat# 9108). Total RNA was extracted, treated with Turbo DNase (Invitrogen, Cat# AM2239), and purified via ethanol precipitation. The PolyA plus library was prepared using the VAHTS Stranded mRNA-seq Library Prep Kit for Illumina V2 (Vazyme, Cat# NR602). The Ribo minus library was prepared using the VAHTS Total RNA-seq (H/M/R) Library Prep Kit for Illumina (Vazyme, Cat# NR603). The total-RNA library was prepared the same as the PolyA plus library but excluded mRNA capture. The tRNA-seq102 library was prepared using the QiAseq miRNA Library kit (Qiagen, Cat# 331502) following the manufacturer’s instructions.
For gDNA-seq library preparation, genomic DNA was extracted using the Genomic DNA Kit (TIANGEN, Cat# DP304). The DNA library was prepared using the TruePrep DNA Library Prep Kit V2 for Illumina (Vazyme, Cat# TD503) according to the manufacturer’s instructions.
Overexpression and purification of recombinant TadA-8e protein
The recombinant TadA-8e expression plasmid was transformed into E. coli BL21(DE3) (New England Biolabs, Cat# C2527I) and cultured in an incubator shaker at 37°C and 220 rpm in LB medium for 12–18 h until the absorbance at 600 nm (OD600) reached 0.6. Protein expression was induced by adding 0.1 mM isopropyl β-d-1-thiogalactopyranoside (IPTG), followed by 20 h of incubation at 16°C. Then, recombinant TadA-8e was purified using a method described previously103 with slight modifications. Briefly, E. coli cells were lyzed by sonication in lysis buffer containing 50 mM Tris-HCl (pH 7.5), 1 M KCl, 10% (v/v) Glycerol, 0.02% NP-40, protease inhibitor cocktail (Roche), and 10 mM 2-mercaptoethanol. The lysate was clarified by centrifugation at 4°C, 23,000 × g for 30 min. The supernatant was loaded onto a Ni-NTA Superflow Cartridge (QIAGEN, Cat# 30430), washed with 30 mL of lysis buffer supplemented with 50 mM imidazole, and eluted with a gradient of imidazole from 50 mM to 600 mM in lysis buffer. The eluted protein was concentrated and further purified using size-exclusion chromatography on a Superdex 75 Increase 10/300 GL column (GE Healthcare), with a protein-elution buffer containing 50 mM Tris-HCl (pH 7.5), 200 mM KCl, 10% (v/v) Glycerol, and 2 mM DTT. Finally, the purified protein was concentrated to approximately 4 mg/mL, flash-frozen in liquid nitrogen, and stored at −80°C.
TadA-8e modification on endogenous RNA in vitro
The total RNA of HEK293T cells was extracted using RNAiso Plus, treated with Turbo DNase, and purified via ethanol precipitation. The RNA was denatured at 90°C for 2 min and then immediately chilled on ice for 2 min. The RNA was then diluted into 1× RNA structure folding buffer (50 mM Tris-HCl pH 7.5, 10 mM MgCl2, 150 mM NaCl) on ice. The temperature was gradually raised to 37°C at a rate of 0.1°C/s, and the RNA was incubated at 37°C for 20 min. In vitro modification reactions were performed in modification buffer (50 mM Tris-HCl pH 7.5, 25 mM KCl, 2.5 mM MgCl2, 2% (v/v) Glycerol, 2 mM DTT, 1 U RNase inhibitor (Thermo Scientific, Cat# EO0381)), supplemented with 200 ng total RNA and 10 nM recombinant TadA-8e. For the control sample, the recombinant TadA-8e was replaced by water in the modification reactions. The modification reaction was incubated at 90°C for 60 min and then quenched by incubation at 95°C for 10 min. After that, the RNA was purified by ethanol precipitation and reverse transcribed using SuperScript IV (Invitrogen, Cat# 18090200) with oligo(dT) primers. Specific genes were amplified from the cDNA using gene-specific primers (Table S1). The library was constructed using TruePrep DNA Library Prep Kit V2 for Illumina (Vazyme, Cat# TD503) according to the manufacturer’s instructions. Libraries were sequenced on the Illumina HiSeq 4000 platform.
TadA-8e modification on RNA probes and target RNAs
For in vitro modification, the DNA templates for the RNA probe and target RNA (Table S3) were amplified using T7 primers (Table S1) and subjected to in vitro transcription by T7 RNA polymerase (New England Biolabs, Cat# M0251L). The DNA template was digested with Turbo DNase (Invitrogen, Cat# AM2239), and the RNA was purified using RNAiso Plus (Takara, Cat# 9108) extraction followed by ethanol precipitation. Then, the RNA probe and target RNA were denatured, refolded, and treated with recombinant TadA-8e as described in the section for "TadA-8e modification on endogenous RNA in vitro". Approximal 200 ng RNA and 0.5–10 nM recombinant TadA-8e were used in the modification reaction.
For in vivo modification, both the RNA probe expression plasmids and the TadA-8e expression plasmids were simultaneously transfected into HEK293T cells using Lipofectamine 3000 and allowed to express for 24 h. Cells expressing both EGFP (FITC laser) and mKate2 (PE-Cy5 laser) were sorted using a BD FACSAria Fusion Flow Cytometer (Figure S2N). For the control sample, only the RNA probes were expressed, and mKate2-positive cells were sorted. The sorted cells were then lyzed using RNAiso Plus, and RNA was extracted by isopropanol precipitation.
For both in vitro and in vivo modification, the RNA library was constructed using the same procedure. RNA was treated with Turbo DNase, purified using RNAiso Plus extraction, and subjected to ethanol precipitation. RNA was then reverse-transcribed using SuperScript IV (Invitrogen, Cat# 18090200) and the RT primer (Table S1) according to the manufacturer’s instructions. The resulting cDNA was amplified by PCR primers and P5/P7 primers (Table S1). The dsDNA was purified using AMPure XP beads (Beckman Coulter Life Sciences, Cat# A63882) and sequenced on the Illumina HiSeq 4000 platform.
SHAEP-map for RNA probes
For in vitro SHAPE-Map, the RNA probe was first denatured and refolded as described in the section for "TadA-8e modification on endogenous RNA in vitro". Then, it was treated with 25 mM NAI-N3 (or an equivalent volume of DMSO as the control) at 37°C for 10 min in RNA structure folding buffer. After the reaction, the RNA was purified using RNAiso Plus extraction and ethanol precipitation. Two replicates were performed for each sample.
For in vivo SHAPE-Map, RNA probe plasmids were transfected into HEK293T cells using Lipofectamine 3000, followed by a 24-h incubation. The cells were then dissociated and incubated with 25 mM NAI-N3 (MACKLIN, Cat# N881804) or an equivalent volume of DMSO (control) in PBS buffer at 37°C for 10 min with constant rotation. After incubation, the cells were lyzed using RNAiso Plus, and the RNA was extracted via isopropanol precipitation. Two biological replicates were performed for each sample.
For in vitro and in vivo SHAPE-Map, RNA was annealed with 1 μM Probe RT primer (Table S1) by incubating at 72°C for 3 min, followed by a 10-min incubation on ice. RNA was reverse-transcribed using 10 U/μl SuperScript II (Invitrogen, Cat# 18064014) in reaction buffer (50 mM Tris-HCl pH 8.0, 75 mM KCl, 30 mM MnCl2, 0.8 M betaine), following a thermal cycle: incubating at 25°C for 5 min, 42°C for 8 h, 70°C for 10 min, and finally holding at 4°C. The resulting cDNA was then used for library construction and sequencing, following the same procedure described in the section "TadA-8e modification on RNA probes and target RNAs".
TAS-seq in single cells and library construction
HEK293T cells expressing cytosol-localized TadA-8e were cultured as described for bulk cells. EGFP-positive cells were sorted by flow cytometry (Sony MA900), selecting those with fluorescence signals within a narrow range (FITC intensity >104). Afterward, the cells were diluted in cold PBS buffer to approximately 3 μL per cell. The single-cell PBS solution was then seeded into a 96-well cell culture plate (Thermo Fisher Scientific), and the cell numbers and EGFP fluorescence were checked under a microscope. Next, 2.5 μL of PBS was transferred to an eight-strip tube to isolate individual cells into separate tubes. Then, the scRNA-seq library was constructed using the SMART-Seq v4 Ultra Low Input RNA Kit (TaKaRa, Cat# 634891) and the TruePrep DNA Library Prep Kit V2 for Illumina (Vazyme, Cat# TD503) according to the manufacturer’s instructions. All libraries were sequenced on the Illumina HiSeq 4000 platform.
Data processing of TAS-seq in bulk cells
Sequencing reads were trimmed using 'cutadapt' (version 2.6) with parameters '-n 1 -e 0.1 -O 2 -m 16'. The human (hg38) reference genome was downloaded from RefSeq (http://www.ncbi.nlm.nih.gov/refseq/). For PolyA plus and Ribo minus libraries, the trimmed reads were aligned against the human genome using STAR96 with '--outFilterMultimapNmax 20, --alignEndsType EndToEnd, --outReadsUnmapped Fastx 2, –outSAMstrandField intronMotif, and --outFilterMismatchNmax 20'. For the Total-RNA library, customized references for human 45S rRNA (GenBank: NR_046235.3) and snRNAs (U1, GenBank: NR_004430; U2, GenBank: NR_002716.3; U4, GenBank: NR_003925.1) were used, and alignments were conducted using Bowtie297 with '-q -k 2 -X 500 --no-discordant --no-mixed --no-unal'. The aligned reads were filtered by SAMtools98 with '-F 3332 -f 2′, and only reads with the 'NH:i:1′ flag were retained. REDItools299 was used to calculate A-to-G mutation sites with '-q 25 -S'. Subsequently, sites with base quality lower than 20, coverage lower than 10, annotated in the dbSNP database,100 and A-to-G events lower than 2 were excluded using custom Perl scripts.
The raw mutation rate was calculated by dividing the number of mutated reads by the total number of reads. To remove background noise induced by endogenous deaminase, the mutation rate was calculated as the difference between the raw mutation rates of treatment and control samples. The mutated and non-mutated read counts were treated as a contingency table, and the significance of the differences was evaluated using Fisher’s exact test. The p value was adjusted using the Benjamini-Hochberg (BH) correction method. The following filters were applied to identify high-confidence mutation sites: (1) mutation rate >0, (2) Padj < 0.05, (3) total read coverage ≥10, (4) mutated reads coverage ≥2, and (5) mutation sites detected in two biological replicates simultaneously. Mutation sites passing these filters were considered reliable mutation sites, and their mutation rate was averaged across replicates to form a reliable mutation rate (RMR). For transcript annotation, mutation sites were assigned to the longest NM and NR transcripts using bedtools intersect v2.27.0 with the parameter 'S'.
To identify the variation sites between different subcellular compartments or cell lines, the Max Absolute Normalization method was applied to RMR to ensure comparability between samples. Briefly, for each gene, the RMR of each mutation site was divided by the highest RMR of that gene. This normalized RMR was termed norRMR. The significance of the norRMR difference between samples was analyzed as follows: (1) For each sample, two TadA-8e modification replicates and two control replicates were used to calculate four mutation rates by pairing one treatment sample with one control sample each time; (2) Two sets of four mutation rates were compared using a t-test to calculate a p value. All p values are adjusted (Padj) using the Benjamini-Hochberg (BH) correction method; (3) To estimate random differences in norRMR, the L1 distance for each modification site between replicates was calculated, and the top 5% of L1 distances across all samples were defined as the threshold for random noise. Finally, a mutation site with a norRMR difference greater than 0.25 and Padj < 0.01 was designated as a variation site.
Data processing of tRNA-seq
tRNA libraries were analyzed as previously described.102,104 Briefly, tRNA clusters were identified using 'tRNAscan-SE' v2.0.12105 with the '-b -q' parameters based on the human hg38 reference genome. The tRNA masked reference was generated using 'bedtools' v2.27.0 with '-mc N′ parameter. The pre-tRNA reference was generated by adding 50 nt 5′ and 3′ flanking regions to each tRNA. The mature tRNA reference was generated by adding a CCA tail to each tRNA, and pseudogenes were removed. Sequencing reads were then trimmed using 'cutadapt' (version 2.6) with parameters '-n 1 -e 0.1 -O 2 -m 2′, and mapped to the reference using a matured pipeline for tRNAs analysis (https://github.com/hexavier/tRNA_mapping). Pre-alignment was conducted using 'segemehl' v2.0.12 with '--silent --evalue 500 --differences 3 --maxinterval 1000 --accuracy 80′ parameters, against the tRNA masked and pre-tRNA reference. Reads mapped to the masked genome and pre-tRNAs were removed. The remaining reads were re-aligned to the mature tRNA reference using 'segemehl' v2.0.12 with '--silent --evalue 500 --differences 3 --maxinterval 1000 --accuracy 85′ parameters. The aligned reads were filtered by mapping quality lower than 60, and only those with 'NH:i:1′ flag were retained. The 'REDItools2′ v2.0 was used to calculate the mutation sites in each sample, and the parameters were set as '-q 25 -bq 20 -s 0'. Finally, the A-to-G modification site was identified and selected as the section "Data processing of TAS-seq in bulk cells".
Data processing of gDNA-seq
Sequencing reads were trimmed using 'cutadapt' v2.6 with '-n 1 -e 0.1 -O 2 -m 16′ parameters. Alignment was conducted using STAR with '--outFilterMultimapNmax 20 --alignEndsType EndToEnd --outReadsUnmapped Fastx 2 –outSAMstrandField intronMotif --outFilterMismatchNmax 20′, against the human hg38 genome. The aligned reads were filtered using 'SAMtools' with '-F 3332 -f 2′, and only those with 'NH:i:1′ flag were retained. PCR duplicates were removed using 'MarkDuplicates' v2.22.8 from Picard with default settings. The 'REDItools2′ v2.0 was used to calculate the mutation sites in each sample, and the parameters were set as '-q 25 -bq 20 -s 0'. A-to-G modification site was identified and selected as the section "Data processing of TAS-seq in bulk cells".
Modification assay for certain endogenous RNA, RNA probe, and target RNA
Sequencing reads were trimmed and aligned against the reference sequences. For certain endogenous RNA in vitro, the reference sequences were from specific human transcripts in the NCBI database, including GAS5 (GenBank: NR_002578.3), TMSB10 (GenBank: NM_021103.4), GAPDH (GenBank: NM_002046.7), ACTB (GenBank: NM_001101.5), H3-3A (GenBank: NM_002107.7), HPRT (GenBank: NM_000194.3), STMN1 (GenBank: NM_005563.4), and XIST (GenBank: NR_001564.2). For RNA probe and target RNA, the reference sequences were corresponding DNA templates, and only reads identical in length to the RNA probe and target RNA sequences were retained. A-to-G mutations were identified using a custom Perl script. The mutation rate was calculated as the ratio of G reads to the total A + G reads. Modification rates in treatments were calculated by subtracting background mutation rates (control samples), with values averaged across two biological replicates.
Data processing of SHAEP-Map for RNA probe
Sequencing reads were processed and mapped as described in the section "Modification assay for certain endogenous RNA, RNA probe, and target RNA", with the following modifications: indel-containing reads were excluded, and all types of mutations were counted. The mutation rate for each nucleotide was calculated as the ratio of mismatches to read depth. SHAPE reactivity was determined by subtracting the mutation rate in the DMSO-treated control from the NAI-N3-treated sample. The highest SHAPE reactivity value was normalized to 1. RNA secondary structure was modeled using RNAfold (version 2.5.1) and VARNA (version 3.92) software, incorporating the SHAPE reactivity data.
Data processing of TAS-seq in single cells
Sequencing reads for single-cell analysis were processed similarly to bulk cells, with a few alterations. STAR alignment parameters were: '--outFilterMultimapNmax 20 --alignEndsType EndToEnd --outReadsUnmapped Fastx 2 --outSAMstrandField intronMotif --outFilterScoreMinOverLread 0 --outFilterMatchNminOverLread 0 --outFilterMatchNmin 0 --outFilterMismatchNmax 10'. After alignment, PCR duplicates were removed using the MarkDuplicates tool from Picard with default settings. Mutation sites were identified using REDItools2 with '-q 25 -bq 20 -s 0'. In contrast to bulk cell data, reads in single-cell samples are unstranded, meaning both A-to-G and T-to-C mutations were considered indicative of TadA-8e modification events. The A-to-G mutation site was assigned to the plus-strand gene, while the T-to-C mutation site was assigned to the minus-strand gene. To remove modification sites induced by endogenous deaminases, a background mutation rate was calculated by averaging the mutation rates from two control bulk cell replicates. Any mutation site in the single-cell data that exceeded this average mutation rate was considered a background modification and was excluded from further analysis. After that, the mutation rate was termed RMR (reliable mutation rate).
For the modification heterogeneity analysis, cell#3 was excluded due to low sequencing depth. The remaining nine cells are then aggregated into pseudo-bulk data. Mutation sites identified in fewer than five cells were excluded, and transcripts containing fewer than ten mutation sites were also discarded. Modification heterogeneity at both the transcript level and single adenosine nucleotide level was analyzed using the method described by Wang et al.42 For the former, we applied a quantile normalization to the RMR to minimize putative differences in modification efficiencies in single cells. Then, the cosine distance for each transcript in each cell against its pseudo-bulk was calculated based on the normalized RMR. The dispersion of the pairwise cosine distances was used as the measurement for transcript-level modification heterogeneity. For the latter, the mutation rate of each site was assumed to follow a simple linear model. The R2 of the linear model can be used as a measure of the deviation of the mutation rate in each cell from its average mutation rate. In this analysis, adjusted R2 (adj R2) was calculated to eliminate the impact of missing data in single-cell sequencing.
Comparison between TAS-seq and SHAPE- and DMS-based methods
All SHAPE- and DMS-based data were downloaded from the RASP V2.0 databases,44 including: icSHAPE in HEK293T whole cell,25 icSHAPE in HEK293 whole cell,106 smartSHAPE in HEK293T whole cell,107 icSHAPE in K562 whole cell,106 icSHAPE in HEK293T cytoplasm,26 icSHAPE in HEK293T nucleoplasm,26 DMS-seq in K562 whole cell,38 and DMS-MaPseq in HEK293T whole cell.43 For overlap analysis, only adenosines were considered, and reactivity scores were grouped into four ranges: 0–0.25, 0.25–0.5, 0.5–0.75, and 0.75–1. Overlap rates and reactivity scores for overlapping sites in each range were calculated. The significance of differences in overlap rates and reactivity scores across ranges was assessed using the two-sided Mann-Whitney U test. The Gini index for adenosines in the longest transcript was calculated using RMRs or reactivity scores within 25 nt windows with the DescTools package in R. The same method was applied to the Gini index calculation of two and four nucleotides.
RNA structure prediction
RNA secondary structures were predicted using RNAfold (version 2.5.1) with all parameters set to default values. The input RNA sequence was extended by 50 nucleotides in both 5′ and 3′ directions around the modification site, resulting in total lengths of 101 nt. Single-strand RNAs were categorized into substructures by a custom Perl script based on the nearest-neighbor model.48
RNA subcellular localization analysis
To validate the subcellular localization of RNA modified by TadA-8e, we used subcellular RNA datasets identified by three methods. The first method, Fractionation-seq, purified subcellular compartments and measured RNA enrichment in the nucleus (Nuc_RNA) and cytoplasm (Cyt_RNA). Fractionation-seq data for HEK293T cells were downloaded from the GEO database (GEO: GSE116008), and data for K562 cells were obtained from the ENCODE database (ENCODE: ENCLB555AQT, ENCLB555AQU, ENCLB555ALY, ENCLB555ALX). Reads were mapped to the hg38 genome using the same criteria as in Bulk TAS-seq analysis. For each gene, mapped reads were counted using the htseq-count software (version 0.12.4) with '-m intersection-nonempty -s reverse -i gene_id -t exon'. Differential expression was analyzed using DESeq2,101 and RNA localization ratios were determined as log2(Nuc/Cyt). RNA was classified as nucleus-localized if log2(Nuc/Cyt) > 1 and Padj < 0.05, and cytoplasmic-localized if log2(Nuc/Cyt) < −1 and Padj < 0.05. The second method, APEX-seq, was performed on the nucleus, cytoplasm, and endoplasmic reticulum membrane (ERM) of HEK293T cells.28 RNA localization ratios (log2(Nuc/Ctl), log2(Cyt/Ctl), and log2(Erm/Ctl)) were directly downloaded from the published work28 for downstream analysis. To analyze ERM RNA, log2(fold changes) were normalized to the cytosol by subtracting the corresponding cytosolic log2-fold change, yielding a log2(Erm/Cyt) ratio. The log2(Nuc/Cyt) was calculated by subtracting the log2(Cyt/Ctl) from (log2(Nuc/Ctl). The third method, LoRNA, was a fractionation-based approach that quantifies RNA proportions in specific compartments, including the nucleus, nucleolus, cytosol, cytosolic membrane, and granules of U2-OS cells.53 Quantified RNA proportions across compartments were downloaded from the published study.53 Nuc_RNA was combined for the nucleus and nucleolus, while Cyt_RNA included the cytosol and cytosolic granules. The Erm_RNA (RNA on ERM) was RNA on the membrane.
For relative enrichment analysis, the modification difference between the nucleus or ERM and cytosol was analyzed by DESeq2 using TAS-seq mutation reads. The enrichment ratio was determined as log2(Nuc/Cyt) or log2(Erm/Cyt). Then, ROC analysis was used to value the spatial specificity of relatively enriched RNAs. For nuclear RNA, the true positive list (log2(Nuc/Cyt) > 2) and false positive list RNAs (log2(Nuc/Cyt) < −1) were defined according to the Fractionation-seq data. For ERM RNA, the true positive list represented ER-enriched RNAs identified by proximity-specific ribosome profiling, of which 91% encode secretome proteins,51 and the false positive list represented RNAs not annotated as encoding secreted or transmembrane proteins by Phobius,108 SignalP,109 TMHMM,110 and Uniprot.72 The cutoff of relative RNA enrichment was the value that maximized the difference between the true positive rate (TPR) and false positive rate (FPR).
For aggregate analysis, modification sites from Nuc_TAS-seq and Cyt_TAS-seq were stratified by RMR thresholds (>0, >0.1, >0.15, >0.2, >0.5). Transcripts were then binned according to nuclear/cytoplasmic enrichment ratios (log2(Nuc/Cyt) or log2(Cyt/Nuc)) derived from orthogonal methods. Compartment-specific modification differences were quantified as the ratio of aggregated site counts within matched RMR-enrichment bins. An identical analysis was applied to Erm_TAS-seq vs. Cyt_TAS-seq comparisons. All correlations between modification differences and RNA enrichment ratios were visualized in dot plots.
RNA half-life, splicing, and RBP related analysis
RNA half-life data for HEK293 and K562 cells were downloaded from published work.93,94 RBP binding peak data were downloaded from the ENCODE database (ENCODE: ENCSR295OKT, ENCSR181NRW, ENCSR001KKZ, ENCSR658IQB, ENCSR819XBT). The subcellular location of RBPs was annotated via UniProt72 and the Human Protein Atlas database (https://www.proteinatlas.org/).
For splice site analyses, trimmed reads from Ctl_TAS-seq were aligned to the human hg38 build of the transcriptome with STAR. The parameters were: '--twopassMode Basic --quantMode TranscriptomeSAM GeneCounts --alignIntronMin 20 --alignIntronMax 1000000 --sjdbOverhang 149 --outFilterMismatchNmax 999 --outSJfilterReads Unique --outSAMmultNmax 1 --outSAMmapqUnique 20'. The raw read counts were quantified at the transcript level based on RSEM100 with default parameters. Transcripts with a percentage of abundance lower than 80% were excluded. Exon and intron boundaries from these transcripts were used to identify splice sites, referencing the NCBI RefSeq annotation (Release 110). To isolate splicing-related modifications, we examined exon-intron junction reads (unspliced events) and exon-exon junction reads (spliced events) from the nuclear TAS-seq rRNA-depleted RNA library. Then, modification events were calculated based on these reads. Modification rates were calculated by subtracting background mutation rates (control samples) from Nuc_TAS-seq data, with values averaged across two biological replicates. Finally, modification sites were assigned to the exon-intron boundaries using bedtools intersect v2.27.0 with '-split' parameter. A total of 1,446 high-confidence 5′ss loci were analyzed.
The data source for gRNA in the CRISPR/Cas13d system
For the in vivo assay, the gRNA sequences and on-target activity (cellular fitness, dropout) data were obtained from published studies: Library 1 from Wessels et al.'s work,20 and Library 2 from Liang et al.'s work.81 The gRNA sequences from both libraries were annotated with the gene through sequence alignment to the Refseq NM and NR transcripts. Library 1 includes 40,291 gRNAs targeting 5,154 genes, while Library 2 contains 30,765 gRNAs targeting 6,402 genes, with 647 common gRNAs shared between the two. The on-target activity was calculated by building the count ratios between a time point (day 7 or day 14) and the corresponding input (day 0) sample, followed by -log2-transformation (-log2(foldchange)). For the in vitro assay, Cas13d binding affinities were obtained from the dissociation constant values (kd ≤ 30% relative error) published by Kuo et al.,82 covering 136 target RNAs.
Quantification and statistical analysis
Quantification of Western blot bands and pixel intensity for TadA-8e subcellular localization was performed using ImageJ (https://imagej.net/ij/). For TAS-seq, experiments involved two biological replicates. Fisher’s exact test was used to compare A-to-G mutations between treated and untreated samples. The resulting p values were adjusted for multiple comparisons using the Benjamini-Hochberg procedure, with significance set at Padj < 0.05. Validation experiments with RNA probes were conducted with two or three biological replicates. Barplots in validation analysis were generated using GraphPad Prism (v9.1.0), and statistical significance was determined using the two-sided Mann-Whitney U test. Scatterplots and correlation matrix plots were generated in R (v4.3.2) using the ggplot2 (v3.5.1), ggpubr (v0.6.0), and GGally (v2.2.1) packages. Boxplots and line plots were generated in R (v4.3.2) using the ggplot2 (v3.5.1) packages. For these plots, statistical significance was assessed using the two-sided Mann-Whitney U test and was defined as a p value <0.05, as detailed in the figure legends.
Published: June 25, 2025
Footnotes
Supplemental information can be found online at https://doi.org/10.1016/j.crmeth.2025.101087.
Supplemental information
References
- 1.Skourti-Stathaki K., Proudfoot N.J., Gromak N. Human senataxin resolves RNA/DNA hybrids formed at transcriptional pause sites to promote Xrn2-dependent termination. Mol. Cell. 2011;42:794–805. doi: 10.1016/j.molcel.2011.04.026. [DOI] [PMC free article] [PubMed] [Google Scholar]
- 2.Bevilacqua P.C., Ritchey L.E., Su Z., Assmann S.M. Genome-Wide Analysis of RNA Secondary Structure. Annu. Rev. Genet. 2016;50:235–266. doi: 10.1146/annurev-genet-120215-035034. [DOI] [PubMed] [Google Scholar]
- 3.Warf M.B., Berglund J.A. Role of RNA structure in regulating pre-mRNA splicing. Trends Biochem. Sci. 2010;35:169–178. doi: 10.1016/j.tibs.2009.10.004. [DOI] [PMC free article] [PubMed] [Google Scholar]
- 4.Leppek K., Das R., Barna M. Functional 5' UTR mRNA structures in eukaryotic translation regulation and how to find them. Nat. Rev. Mol. Cell Biol. 2018;19:158–174. doi: 10.1038/nrm.2017.103. [DOI] [PMC free article] [PubMed] [Google Scholar]
- 5.Ishiguro A., Kimura N., Watanabe Y., Watanabe S., Ishihama A. TDP-43 binds and transports G-quadruplex-containing mRNAs into neurites for local translation. Genes Cells. 2016;21:466–481. doi: 10.1111/gtc.12352. [DOI] [PubMed] [Google Scholar]
- 6.Yang J.R., Chen X., Zhang J. Codon-by-codon modulation of translational speed and accuracy via mRNA folding. PLoS Biol. 2014;12 doi: 10.1371/journal.pbio.1001910. [DOI] [PMC free article] [PubMed] [Google Scholar]
- 7.Zalfa F., Eleuteri B., Dickson K.S., Mercaldo V., De Rubeis S., di Penta A., Tabolacci E., Chiurazzi P., Neri G., Grant S.G.N., Bagni C. A new function for the fragile X mental retardation protein in regulation of PSD-95 mRNA stability. Nat. Neurosci. 2007;10:578–587. doi: 10.1038/nn1893. [DOI] [PMC free article] [PubMed] [Google Scholar]
- 8.Garneau N.L., Wilusz J., Wilusz C.J. The highways and byways of mRNA decay. Nat. Rev. Mol. Cell Biol. 2007;8:113–126. doi: 10.1038/nrm2104. [DOI] [PubMed] [Google Scholar]
- 9.Strobel S.A., Cochrane J.C. RNA catalysis: ribozymes, ribosomes, and riboswitches. Curr. Opin. Chem. Biol. 2007;11:636–643. doi: 10.1016/j.cbpa.2007.09.010. [DOI] [PMC free article] [PubMed] [Google Scholar]
- 10.Pan T., Sosnick T. RNA folding during transcription. Annu. Rev. Biophys. Biomol. Struct. 2006;35:161–175. doi: 10.1146/annurev.biophys.35.040405.102053. [DOI] [PubMed] [Google Scholar]
- 11.Incarnato D., Morandi E., Anselmi F., Simon L.M., Basile G., Oliviero S. In vivo probing of nascent RNA structures reveals principles of cotranscriptional folding. Nucleic Acids Res. 2017;45:9716–9725. doi: 10.1093/nar/gkx617. [DOI] [PMC free article] [PubMed] [Google Scholar]
- 12.Yu G., Liu Y., Li Z., Deng S., Wu Z., Zhang X., Chen W., Yang J., Chen X., Yang J.R. Genome-wide probing of eukaryotic nascent RNA structure elucidates cotranscriptional folding and its antimutagenic effect. Nat. Commun. 2023;14:5853. doi: 10.1038/s41467-023-41550-w. [DOI] [PMC free article] [PubMed] [Google Scholar]
- 13.Wan Y., Qu K., Zhang Q.C., Flynn R.A., Manor O., Ouyang Z., Zhang J., Spitale R.C., Snyder M.P., Segal E., Chang H.Y. Landscape and variation of RNA secondary structure across the human transcriptome. Nature. 2014;505:706–709. doi: 10.1038/nature12946. [DOI] [PMC free article] [PubMed] [Google Scholar]
- 14.Piao M., Sun L., Zhang Q.C. RNA Regulations and Functions Decoded by Transcriptome-wide RNA Structure Probing. Genom. Proteom. Bioinform. 2017;15:267–278. doi: 10.1016/j.gpb.2017.05.002. [DOI] [PMC free article] [PubMed] [Google Scholar]
- 15.Kordyś M., Sen R., Warkocki Z. Applications of the versatile CRISPR-Cas13 RNA targeting system. Wiley Interdiscip. Rev. RNA. 2022;13 doi: 10.1002/wrna.1694. [DOI] [PubMed] [Google Scholar]
- 16.Xue Y., Chen Z., Zhang W., Zhang J. Engineering CRISPR/Cas13 System against RNA Viruses: From Diagnostics to Therapeutics. Bioengineering (Basel) 2022;9 doi: 10.3390/bioengineering9070291. [DOI] [PMC free article] [PubMed] [Google Scholar]
- 17.Palaz F., Kalkan A.K., Can Ö., Demir A.N., Tozluyurt A., Özcan A., Ozsoz M. CRISPR-Cas13 System as a Promising and Versatile Tool for Cancer Diagnosis, Therapy, and Research. ACS Synth. Biol. 2021;10:1245–1267. doi: 10.1021/acssynbio.1c00107. [DOI] [PubMed] [Google Scholar]
- 18.Montagud-Martínez R., Márquez-Costa R., Heras-Hernández M., Dolcemascolo R., Rodrigo G. On the ever-growing functional versatility of the CRISPR-Cas13 system. Microb. Biotechnol. 2024;17 doi: 10.1111/1751-7915.14418. [DOI] [PMC free article] [PubMed] [Google Scholar]
- 19.Wessels H.H., Méndez-Mancilla A., Guo X., Legut M., Daniloski Z., Sanjana N.E. Massively parallel Cas13 screens reveal principles for guide RNA design. Nat. Biotechnol. 2020;38:722–727. doi: 10.1038/s41587-020-0456-9. [DOI] [PMC free article] [PubMed] [Google Scholar]
- 20.Wessels H.H., Stirn A., Méndez-Mancilla A., Kim E.J., Hart S.K., Knowles D.A., Sanjana N.E. Prediction of on-target and off-target activity of CRISPR-Cas13d guide RNAs using deep learning. Nat. Biotechnol. 2024;42:628–637. doi: 10.1038/s41587-023-01830-8. [DOI] [PubMed] [Google Scholar]
- 21.Strobel E.J., Yu A.M., Lucks J.B. High-throughput determination of RNA structures. Nat. Rev. Genet. 2018;19:615–634. doi: 10.1038/s41576-018-0034-x. [DOI] [PMC free article] [PubMed] [Google Scholar]
- 22.Wang P.Y., Sexton A.N., Culligan W.J., Simon M.D. Carbodiimide reagents for the chemical probing of RNA structure in cells. Rna. 2019;25:135–146. doi: 10.1261/rna.067561.118. [DOI] [PMC free article] [PubMed] [Google Scholar]
- 23.Xu B., Zhu Y., Cao C., Chen H., Jin Q., Li G., Ma J., Yang S.L., Zhao J., Zhu J., et al. Recent advances in RNA structurome. Sci. China Life Sci. 2022;65:1285–1324. doi: 10.1007/s11427-021-2116-2. [DOI] [PMC free article] [PubMed] [Google Scholar]
- 24.Helwak A., Kudla G., Dudnakova T., Tollervey D. Mapping the human miRNA interactome by CLASH reveals frequent noncanonical binding. Cell. 2013;153:654–665. doi: 10.1016/j.cell.2013.03.043. [DOI] [PMC free article] [PubMed] [Google Scholar]
- 25.Lu Z., Zhang Q.C., Lee B., Flynn R.A., Smith M.A., Robinson J.T., Davidovich C., Gooding A.R., Goodrich K.J., Mattick J.S., et al. RNA Duplex Map in Living Cells Reveals Higher-Order Transcriptome Structure. Cell. 2016;165:1267–1279. doi: 10.1016/j.cell.2016.04.028. [DOI] [PMC free article] [PubMed] [Google Scholar]
- 26.Sun L., Fazal F.M., Li P., Broughton J.P., Lee B., Tang L., Huang W., Kool E.T., Chang H.Y., Zhang Q.C. RNA structure maps across mammalian cellular compartments. Nat. Struct. Mol. Biol. 2019;26:322–330. doi: 10.1038/s41594-019-0200-7. [DOI] [PMC free article] [PubMed] [Google Scholar]
- 27.Liu Z., Liu Q., Yang X., Zhang Y., Norris M., Chen X., Cheema J., Zhang H., Ding Y. In vivo nuclear RNA structurome reveals RNA-structure regulation of mRNA processing in plants. Genome Biol. 2021;22:11. doi: 10.1186/s13059-020-02236-4. [DOI] [PMC free article] [PubMed] [Google Scholar]
- 28.Fazal F.M., Han S., Parker K.R., Kaewsapsak P., Xu J., Boettiger A.N., Chang H.Y., Ting A.Y. Atlas of Subcellular RNA Localization Revealed by APEX-Seq. Cell. 2019;178:473–490.e26. doi: 10.1016/j.cell.2019.05.027. [DOI] [PMC free article] [PubMed] [Google Scholar]
- 29.Sadowski P.G., Groen A.J., Dupree P., Lilley K.S. Sub-cellular localization of membrane proteins. Proteomics (Weinh.) 2008;8:3991–4011. doi: 10.1002/pmic.200800217. [DOI] [PubMed] [Google Scholar]
- 30.Saldi T., Riemondy K., Erickson B., Bentley D.L. Alternative RNA structures formed during transcription depend on elongation rate and modify RNA processing. Mol. Cell. 2021;81:1789–1801.e5. doi: 10.1016/j.molcel.2021.01.040. [DOI] [PMC free article] [PubMed] [Google Scholar]
- 31.Wolf J., Gerber A.P., Keller W. tadA, an essential tRNA-specific adenosine deaminase from Escherichia coli. EMBO J. 2002;21:3841–3851. doi: 10.1093/emboj/cdf362. [DOI] [PMC free article] [PubMed] [Google Scholar]
- 32.Richter M.F., Zhao K.T., Eton E., Lapinaite A., Newby G.A., Thuronyi B.W., Wilson C., Koblan L.W., Zeng J., Bauer D.E., et al. Phage-assisted evolution of an adenine base editor with improved Cas domain compatibility and activity. Nat. Biotechnol. 2020;38:883–891. doi: 10.1038/s41587-020-0453-z. [DOI] [PMC free article] [PubMed] [Google Scholar]
- 33.Lapinaite A., Knott G.J., Palumbo C.M., Lin-Shiao E., Richter M.F., Zhao K.T., Beal P.A., Liu D.R., Doudna J.A. DNA capture by a CRISPR-Cas9-guided adenine base editor. Science. 2020;369:566–571. doi: 10.1126/science.abb1390. [DOI] [PMC free article] [PubMed] [Google Scholar]
- 34.Lu J., Wu T., Zhang B., Liu S., Song W., Qiao J., Ruan H. Types of nuclear localization signals and mechanisms of protein import into the nucleus. Cell Commun. Signal. 2021;19:60. doi: 10.1186/s12964-021-00741-y. [DOI] [PMC free article] [PubMed] [Google Scholar]
- 35.Fukuda M., Asano S., Nakamura T., Adachi M., Yoshida M., Yanagida M., Nishida E. CRM1 is responsible for intracellular transport mediated by the nuclear export signal. Nature. 1997;390:308–311. doi: 10.1038/36894. [DOI] [PubMed] [Google Scholar]
- 36.Nishikura K. Functions and regulation of RNA editing by ADAR deaminases. Annu. Rev. Biochem. 2010;79:321–349. doi: 10.1146/annurev-biochem-060208-105251. [DOI] [PMC free article] [PubMed] [Google Scholar]
- 37.Jung S.H. Stratified Fisher's exact test and its sample size calculation. Biom. J. 2014;56:129–140. doi: 10.1002/bimj.201300048. [DOI] [PMC free article] [PubMed] [Google Scholar]
- 38.Rouskin S., Zubradt M., Washietl S., Kellis M., Weissman J.S. Genome-wide probing of RNA structure reveals active unfolding of mRNA structures in vivo. Nature. 2014;505:701–705. doi: 10.1038/nature12894. [DOI] [PMC free article] [PubMed] [Google Scholar]
- 39.Spitale R.C., Flynn R.A., Zhang Q.C., Crisalli P., Lee B., Jung J.W., Kuchelmeister H.Y., Batista P.J., Torre E.A., Kool E.T., Chang H.Y. Structural imprints in vivo decode RNA regulatory mechanisms. Nature. 2015;519:486–490. doi: 10.1038/nature14263. [DOI] [PMC free article] [PubMed] [Google Scholar]
- 40.Kalvari I., Nawrocki E.P., Ontiveros-Palacios N., Argasinska J., Lamkiewicz K., Marz M., Griffiths-Jones S., Toffano-Nioche C., Gautheret D., Weinberg Z., et al. Rfam 14: expanded coverage of metagenomic, viral and microRNA families. Nucleic Acids Res. 2021;49:D192–D200. doi: 10.1093/nar/gkaa1047. [DOI] [PMC free article] [PubMed] [Google Scholar]
- 41.Siegfried N.A., Busan S., Rice G.M., Nelson J.A.E., Weeks K.M. RNA motif discovery by SHAPE and mutational profiling (SHAPE-MaP) Nat. Methods. 2014;11:959–965. doi: 10.1038/nmeth.3029. [DOI] [PMC free article] [PubMed] [Google Scholar]
- 42.Wang J., Zhang Y., Zhang T., Tan W.T., Lambert F., Darmawan J., Huber R., Wan Y. RNA structure profiling at single-cell resolution reveals new determinants of cell identity. Nat. Methods. 2024;21:411–422. doi: 10.1038/s41592-023-02128-y. [DOI] [PMC free article] [PubMed] [Google Scholar]
- 43.Zubradt M., Gupta P., Persad S., Lambowitz A.M., Weissman J.S., Rouskin S. DMS-MaPseq for genome-wide or targeted RNA structure probing in vivo. Nat. Methods. 2017;14:75–82. doi: 10.1038/nmeth.4057. [DOI] [PMC free article] [PubMed] [Google Scholar]
- 44.Mu K., Fei Y., Xu Y., Zhang Q.C. RASP v2.0: an updated atlas for RNA structure probing data. Nucleic Acids Res. 2025;53:D211–D219. doi: 10.1093/nar/gkae1117. [DOI] [PMC free article] [PubMed] [Google Scholar]
- 45.Wittebolle L., Marzorati M., Clement L., Balloi A., Daffonchio D., Heylen K., De Vos P., Verstraete W., Boon N. Initial community evenness favours functionality under selective stress. Nature. 2009;458:623–626. doi: 10.1038/nature07840. [DOI] [PubMed] [Google Scholar]
- 46.Gruber A.R., Lorenz R., Bernhart S.H., Neuböck R., Hofacker I.L. The Vienna RNA websuite. Nucleic Acids Res. 2008;36:W70–W74. doi: 10.1093/nar/gkn188. [DOI] [PMC free article] [PubMed] [Google Scholar]
- 47.Lorenz R., Bernhart S.H., Höner Zu Siederdissen C., Tafer H., Flamm C., Stadler P.F., Hofacker I.L. ViennaRNA Package 2.0. Algorithms Mol. Biol. 2011;6:26. doi: 10.1186/1748-7188-6-26. [DOI] [PMC free article] [PubMed] [Google Scholar]
- 48.Turner D.H., Mathews D.H. NNDB: the nearest neighbor parameter database for predicting stability of nucleic acid secondary structure. Nucleic Acids Res. 2010;38:D280–D282. doi: 10.1093/nar/gkp892. [DOI] [PMC free article] [PubMed] [Google Scholar]
- 49.Ballabio A., Willard H.F. Mammalian X-chromosome inactivation and the XIST gene. Curr. Opin. Genet. Dev. 1992;2:439–447. doi: 10.1016/s0959-437x(05)80155-8. [DOI] [PubMed] [Google Scholar]
- 50.Lefebvre F.A., Cody N.A.L., Bouvrette L.P.B., Bergalet J., Wang X., Lécuyer E. CeFra-seq: Systematic mapping of RNA subcellular distribution properties through cell fractionation coupled to deep-sequencing. Methods. 2017;126:138–148. doi: 10.1016/j.ymeth.2017.05.017. [DOI] [PubMed] [Google Scholar]
- 51.Jan C.H., Williams C.C., Weissman J.S. Principles of ER cotranslational translocation revealed by proximity-specific ribosome profiling. Science. 2014;346 doi: 10.1126/science.1257521. [DOI] [PMC free article] [PubMed] [Google Scholar]
- 52.ENCODE Project Consortium An integrated encyclopedia of DNA elements in the human genome. Nature. 2012;489:57–74. doi: 10.1038/nature11247. [DOI] [PMC free article] [PubMed] [Google Scholar]
- 53.Villanueva E., Smith T., Pizzinga M., Elzek M., Queiroz R.M.L., Harvey R.F., Breckels L.M., Crook O.M., Monti M., Dezi V., et al. System-wide analysis of RNA and protein subcellular localization dynamics. Nat. Methods. 2024;21:60–71. doi: 10.1038/s41592-023-02101-9. [DOI] [PMC free article] [PubMed] [Google Scholar]
- 54.Grammatikakis I., Lal A. Significance of lncRNA abundance to function. Mamm. Genome. 2022;33:271–280. doi: 10.1007/s00335-021-09901-4. [DOI] [PubMed] [Google Scholar]
- 55.Liu Y., Beyer A., Aebersold R. On the Dependency of Cellular Protein Levels on mRNA Abundance. Cell. 2016;165:535–550. doi: 10.1016/j.cell.2016.03.014. [DOI] [PubMed] [Google Scholar]
- 56.Herbert A., Hatfield A., Lackey L. How does precursor RNA structure influence RNA processing and gene expression? Biosci. Rep. 2023;43 doi: 10.1042/bsr20220149. [DOI] [PMC free article] [PubMed] [Google Scholar]
- 57.Cao X., Zhang Y., Ding Y., Wan Y. Identification of RNA structures and their roles in RNA functions. Nat. Rev. Mol. Cell Biol. 2024;25:784–801. doi: 10.1038/s41580-024-00748-6. [DOI] [PubMed] [Google Scholar]
- 58.Deng M., Wang X., Xiong Z., Tang P. Control of RNA degradation in cell fate decision. Front. Cell Dev. Biol. 2023;11 doi: 10.3389/fcell.2023.1164546. [DOI] [PMC free article] [PubMed] [Google Scholar]
- 59.Houseley J., Tollervey D. The many pathways of RNA degradation. Cell. 2009;136:763–776. doi: 10.1016/j.cell.2009.01.019. [DOI] [PubMed] [Google Scholar]
- 60.Li W., Deng X., Chen J. RNA-binding proteins in regulating mRNA stability and translation: roles and mechanisms in cancer. Semin. Cancer Biol. 2022;86:664–677. doi: 10.1016/j.semcancer.2022.03.025. [DOI] [PMC free article] [PubMed] [Google Scholar]
- 61.Gilbert W.V., Nachtergaele S. mRNA Regulation by RNA Modifications. Annu. Rev. Biochem. 2023;92:175–198. doi: 10.1146/annurev-biochem-052521-035949. [DOI] [PMC free article] [PubMed] [Google Scholar]
- 62.Boo S.H., Kim Y.K. The emerging role of RNA modifications in the regulation of mRNA stability. Exp. Mol. Med. 2020;52:400–408. doi: 10.1038/s12276-020-0407-z. [DOI] [PMC free article] [PubMed] [Google Scholar]
- 63.Rambout X., Maquat L.E. Nuclear mRNA decay: regulatory networks that control gene expression. Nat. Rev. Genet. 2024;25:679–697. doi: 10.1038/s41576-024-00712-2. [DOI] [PMC free article] [PubMed] [Google Scholar]
- 64.Schoenberg D.R., Maquat L.E. Regulation of cytoplasmic mRNA decay. Nat. Rev. Genet. 2012;13:246–259. doi: 10.1038/nrg3160. [DOI] [PMC free article] [PubMed] [Google Scholar]
- 65.Łabno A., Tomecki R., Dziembowski A. Cytoplasmic RNA decay pathways - Enzymes and mechanisms. Biochim. Biophys. Acta. 2016;1863:3125–3147. doi: 10.1016/j.bbamcr.2016.09.023. [DOI] [PubMed] [Google Scholar]
- 66.Ottens F., Efstathiou S., Hoppe T. Cutting through the stress: RNA decay pathways at the endoplasmic reticulum. Trends Cell Biol. 2024;34:1056–1068. doi: 10.1016/j.tcb.2023.11.003. [DOI] [PubMed] [Google Scholar]
- 67.Spitale R.C., Incarnato D. Probing the dynamic RNA structurome and its functions. Nat. Rev. Genet. 2023;24:178–196. doi: 10.1038/s41576-022-00546-w. [DOI] [PMC free article] [PubMed] [Google Scholar]
- 68.Wu M.T., D'Souza V. Alternate RNA Structures. Cold Spring Harb Perspect Biol. 2020;12 doi: 10.1101/cshperspect.a032425. [DOI] [PMC free article] [PubMed] [Google Scholar]
- 69.Ding Y., Tang Y., Kwok C.K., Zhang Y., Bevilacqua P.C., Assmann S.M. In vivo genome-wide profiling of RNA secondary structure reveals novel regulatory features. Nature. 2014;505:696–700. doi: 10.1038/nature12756. [DOI] [PubMed] [Google Scholar]
- 70.He Y., Smith R. Nuclear functions of heterogeneous nuclear ribonucleoproteins A/B. Cell. Mol. Life Sci. 2009;66:1239–1256. doi: 10.1007/s00018-008-8532-1. [DOI] [PMC free article] [PubMed] [Google Scholar]
- 71.Sanchez de Groot N., Armaos A., Graña-Montes R., Alriquet M., Calloni G., Vabulas R.M., Tartaglia G.G. RNA structure drives interaction with proteins. Nat. Commun. 2019;10:3246. doi: 10.1038/s41467-019-10923-5. [DOI] [PMC free article] [PubMed] [Google Scholar]
- 72.UniProt Consortium UniProt: the Universal Protein Knowledgebase in 2023. Nucleic Acids Res. 2023;51:D523–D531. doi: 10.1093/nar/gkac1052. [DOI] [PMC free article] [PubMed] [Google Scholar]
- 73.Thul P.J., Åkesson L., Wiking M., Mahdessian D., Geladaki A., Ait Blal H., Alm T., Asplund A., Björk L., Breckels L.M., et al. A subcellular map of the human proteome. Science. 2017;356 doi: 10.1126/science.aal3321. [DOI] [PubMed] [Google Scholar]
- 74.Mayr C. What Are 3' UTRs Doing? Cold Spring Harb. Perspect. Biol. 2019;11 doi: 10.1101/cshperspect.a034728. [DOI] [PMC free article] [PubMed] [Google Scholar]
- 75.Hong D., Jeong S. 3'UTR Diversity: Expanding Repertoire of RNA Alterations in Human mRNAs. Mol. Cells. 2023;46:48–56. doi: 10.14348/molcells.2023.0003. [DOI] [PMC free article] [PubMed] [Google Scholar]
- 76.Ryczek N., Łyś A., Makałowska I. The Functional Meaning of 5'UTR in Protein-Coding Genes. Int. J. Mol. Sci. 2023;24 doi: 10.3390/ijms24032976. [DOI] [PMC free article] [PubMed] [Google Scholar]
- 77.Granados-Riveron J.T., Aquino-Jarquin G. CRISPR-Cas13 Precision Transcriptome Engineering in Cancer. Cancer Res. 2018;78:4107–4113. doi: 10.1158/0008-5472.Can-18-0785. [DOI] [PubMed] [Google Scholar]
- 78.Zhu G., Zhou X., Wen M., Qiao J., Li G., Yao Y. CRISPR-Cas13: Pioneering RNA Editing for Nucleic Acid Therapeutics. Biodes. Res. 2024;6:0041. doi: 10.34133/bdr.0041. [DOI] [PMC free article] [PubMed] [Google Scholar]
- 79.Gupta R., Ghosh A., Chakravarti R., Singh R., Ravichandiran V., Swarnakar S., Ghosh D. Cas13d: A New Molecular Scissor for Transcriptome Engineering. Front. Cell Dev. Biol. 2022;10 doi: 10.3389/fcell.2022.866800. [DOI] [PMC free article] [PubMed] [Google Scholar]
- 80.Bandaru S., Tsuji M.H., Shimizu Y., Usami K., Lee S., Takei N.K., Yoshitome K., Nishimura Y., Otsuki T., Ito T. Structure-based design of gRNA for Cas13. Sci. Rep. 2020;10 doi: 10.1038/s41598-020-68459-4. [DOI] [PMC free article] [PubMed] [Google Scholar]
- 81.Liang W.W., Müller S., Hart S.K., Wessels H.H., Méndez-Mancilla A., Sookdeo A., Choi O., Caragine C.M., Corman A., Lu L., et al. Transcriptome-scale RNA-targeting CRISPR screens reveal essential lncRNAs in human cells. Cell. 2024;187:7637–7654.e7629. doi: 10.1016/j.cell.2024.10.021. [DOI] [PMC free article] [PubMed] [Google Scholar] [Retracted]
- 82.Kuo H.C., Prupes J., Chou C.W., Finkelstein I.J. Massively parallel profiling of RNA-targeting CRISPR-Cas13d. Nat. Commun. 2024;15:498. doi: 10.1038/s41467-024-44738-w. [DOI] [PMC free article] [PubMed] [Google Scholar]
- 83.Chen G., Ning B., Shi T. Single-Cell RNA-Seq Technologies and Related Computational Data Analysis. Front. Genet. 2019;10:317. doi: 10.3389/fgene.2019.00317. [DOI] [PMC free article] [PubMed] [Google Scholar]
- 84.Faigenbloom L., Rubinstein N.D., Kloog Y., Mayrose I., Pupko T., Stein R. Regulation of alternative splicing at the single-cell level. Mol. Syst. Biol. 2015;11:845. doi: 10.15252/msb.20156278. [DOI] [PMC free article] [PubMed] [Google Scholar]
- 85.Brannan K.W., Chaim I.A., Marina R.J., Yee B.A., Kofman E.R., Lorenz D.A., Jagannatha P., Dong K.D., Madrigal A.A., Underwood J.G., Yeo G.W. Robust single-cell discovery of RNA targets of RNA-binding proteins and ribosomes. Nat. Methods. 2021;18:507–519. doi: 10.1038/s41592-021-01128-0. [DOI] [PMC free article] [PubMed] [Google Scholar]
- 86.Aubert M., O'Donohue M.F., Lebaron S., Gleizes P.E. Pre-Ribosomal RNA Processing in Human Cells: From Mechanisms to Congenital Diseases. Biomolecules. 2018;8 doi: 10.3390/biom8040123. [DOI] [PMC free article] [PubMed] [Google Scholar]
- 87.Roux P.P., Topisirovic I. Signaling Pathways Involved in the Regulation of mRNA Translation. Mol. Cell Biol. 2018;38 doi: 10.1128/mcb.00070-18. [DOI] [PMC free article] [PubMed] [Google Scholar]
- 88.Suter B. RNA localization and transport. Biochim. Biophys. Acta. Gene Regul. Mech. 2018;1861:938–951. doi: 10.1016/j.bbagrm.2018.08.004. [DOI] [PubMed] [Google Scholar]
- 89.Su Z., Huang D. Alternative Splicing of Pre-mRNA in the Control of Immune Activity. Genes. 2021;12 doi: 10.3390/genes12040574. [DOI] [PMC free article] [PubMed] [Google Scholar]
- 90.Chin A., Lécuyer E. RNA localization: Making its way to the center stage. Biochim. Biophys. Acta. Gen. Subj. 2017;1861:2956–2970. doi: 10.1016/j.bbagen.2017.06.011. [DOI] [PubMed] [Google Scholar]
- 91.Martin K.C., Ephrussi A. mRNA localization: gene expression in the spatial dimension. Cell. 2009;136:719–730. doi: 10.1016/j.cell.2009.01.044. [DOI] [PMC free article] [PubMed] [Google Scholar]
- 92.Sinha R., Shukla P. Current Trends in Protein Engineering: Updates and Progress. Curr. Protein Pept. Sci. 2019;20:398–407. doi: 10.2174/1389203720666181119120120. [DOI] [PubMed] [Google Scholar]
- 93.Agarwal V., Kelley D.R. The genetic and biochemical determinants of mRNA degradation rates in mammals. Genome Biol. 2022;23:245. doi: 10.1186/s13059-022-02811-x. [DOI] [PMC free article] [PubMed] [Google Scholar]
- 94.Schofield J.A., Duffy E.E., Kiefer L., Sullivan M.C., Simon M.D. TimeLapse-seq: adding a temporal dimension to RNA sequencing through nucleoside recoding. Nat. Methods. 2018;15:221–225. doi: 10.1038/nmeth.4582. [DOI] [PMC free article] [PubMed] [Google Scholar]
- 95.Schneider C.A., Rasband W.S., Eliceiri K.W. NIH Image to ImageJ: 25 years of image analysis. Nat. Methods. 2012;9:671–675. doi: 10.1038/nmeth.2089. [DOI] [PMC free article] [PubMed] [Google Scholar]
- 96.Sherman B.T., Hao M., Qiu J., Jiao X., Baseler M.W., Lane H.C., Imamichi T., Chang W. DAVID: a web server for functional enrichment analysis and functional annotation of gene lists (2021 update) Nucleic Acids Res. 2022;50:W216–W221. doi: 10.1093/nar/gkac194. [DOI] [PMC free article] [PubMed] [Google Scholar]
- 97.Dobin A., Davis C.A., Schlesinger F., Drenkow J., Zaleski C., Jha S., Batut P., Chaisson M., Gingeras T.R. STAR: ultrafast universal RNA-seq aligner. Bioinformatics. 2013;29:15–21. doi: 10.1093/bioinformatics/bts635. [DOI] [PMC free article] [PubMed] [Google Scholar]
- 98.Picardi E., Pesole G. REDItools: high-throughput RNA editing detection made easy. Bioinformatics. 2013;29:1813–1814. doi: 10.1093/bioinformatics/btt287. [DOI] [PubMed] [Google Scholar]
- 99.Anders S., Pyl P.T., Huber W. HTSeq--a Python framework to work with high-throughput sequencing data. Bioinformatics. 2015;31:166–169. doi: 10.1093/bioinformatics/btu638. [DOI] [PMC free article] [PubMed] [Google Scholar]
- 100.Li B., Dewey C.N. RSEM: accurate transcript quantification from RNA-Seq data with or without a reference genome. BMC Bioinf. 2011;12:323. doi: 10.1186/1471-2105-12-323. [DOI] [PMC free article] [PubMed] [Google Scholar]
- 101.Love M.I., Huber W., Anders S. Moderated estimation of fold change and dispersion for RNA-seq data with DESeq2. Genome Biol. 2014;15:550. doi: 10.1186/s13059-014-0550-8. [DOI] [PMC free article] [PubMed] [Google Scholar]
- 102.Torres A.G., Rodríguez-Escribà M., Marcet-Houben M., Santos Vieira H.G., Camacho N., Catena H., Murillo Recio M., Rafels-Ybern À., Reina O., Torres F.M., et al. Human tRNAs with inosine 34 are essential to efficiently translate eukarya-specific low-complexity proteins. Nucleic Acids Res. 2021;49:7011–7034. doi: 10.1093/nar/gkab461. [DOI] [PMC free article] [PubMed] [Google Scholar]
- 103.Xiao Y.L., Liu S., Ge R., Wu Y., He C., Chen M., Tang W. Transcriptome-wide profiling and quantification of N(6)-methyladenosine by enzyme-assisted adenosine deamination. Nat. Biotechnol. 2023;41:993–1003. doi: 10.1038/s41587-022-01587-6. [DOI] [PMC free article] [PubMed] [Google Scholar]
- 104.Hoffmann A., Fallmann J., Vilardo E., Mörl M., Stadler P.F., Amman F. Accurate mapping of tRNA reads. Bioinformatics. 2018;34:1116–1124. doi: 10.1093/bioinformatics/btx756. [DOI] [PubMed] [Google Scholar]
- 105.Chan P.P., Lin B.Y., Mak A.J., Lowe T.M. tRNAscan-SE 2.0: improved detection and functional classification of transfer RNA genes. Nucleic Acids Res. 2021;49:9077–9096. doi: 10.1093/nar/gkab688. [DOI] [PMC free article] [PubMed] [Google Scholar]
- 106.Sun L., Xu K., Huang W., Yang Y.T., Li P., Tang L., Xiong T., Zhang Q.C. Predicting dynamic cellular protein-RNA interactions by deep learning using in vivo RNA structures. Cell Res. 2021;31:495–516. doi: 10.1038/s41422-021-00476-y. [DOI] [PMC free article] [PubMed] [Google Scholar]
- 107.Piao M., Li P., Zeng X., Wang X.W., Kang L., Zhang J., Wei Y., Zhang S., Tang L., Zhu J., et al. An ultra low-input method for global RNA structure probing uncovers Regnase-1-mediated regulation in macrophages. Fundam. Res. 2022;2:2–13. doi: 10.1016/j.fmre.2021.12.007. [DOI] [PMC free article] [PubMed] [Google Scholar]
- 108.Käll L., Krogh A., Sonnhammer E.L.L. Advantages of combined transmembrane topology and signal peptide prediction--the Phobius web server. Nucleic Acids Res. 2007;35:W429–W432. doi: 10.1093/nar/gkm256. [DOI] [PMC free article] [PubMed] [Google Scholar]
- 109.Teufel F., Almagro Armenteros J.J., Johansen A.R., Gíslason M.H., Pihl S.I., Tsirigos K.D., Winther O., Brunak S., von Heijne G., Nielsen H. SignalP 6.0 predicts all five types of signal peptides using protein language models. Nat. Biotechnol. 2022;40:1023–1025. doi: 10.1038/s41587-021-01156-3. [DOI] [PMC free article] [PubMed] [Google Scholar]
- 110.Krogh A., Larsson B., von Heijne G., Sonnhammer E.L. Predicting transmembrane protein topology with a hidden Markov model: application to complete genomes. J. Mol. Biol. 2001;305:567–580. doi: 10.1006/jmbi.2000.4315. [DOI] [PubMed] [Google Scholar]
Associated Data
This section collects any data citations, data availability statements, or supplementary materials included in this article.
Supplementary Materials
Data Availability Statement
-
•
Raw and analyzed data have been deposited at GEO (GEO: GSE278863). RNA probe and target RNA data are available in Table S3. All the public datasets used in the study are listed in the STAR Methods subsection.
-
•
This paper does not report the original code. Data analysis methods are described in the STAR Methods and source code reported in this paper will be shared upon request.
-
•
Any additional information required to reanalyze the data reported in this paper is available from the lead contact upon request.