

Abstract
Various diseases, such as colon cancer, gastric cancer, celiac, and bleeding, pose a significant risk to the gastrointestinal (GI) tract, which serves as a fundamental component of the human body. It is less invasive to observe the inner part for disease recognition by using endoscopy and colonoscopy devices. Gastroenterologists consider the increased frame rate in video endoscopy to be challenging when it comes to identifying pathological findings. The detailed examination requires an experienced gastroenterologist. The ordinary procedure takes much time in disease classification. A machine-learning-based computer-aided diagnostic system (CADx) is in high demand for helping Gastroenterologists diagnose GI tract diseases with high accuracy (Acc). CADx takes very little time in diagnosing diseases and supports the training of clinicians. With the assistance of a gastroenterologist, CADx has an impact on reducing the mortality rate by finding diseases in their early stages. In an extensive examination of CADx, the focus is placed on ailments affecting the GI tract, various imaging methods, as well as diverse forms of CADx and techniques. These encompass preprocessing, feature extraction (both handcrafted and deep learning features), feature selection, and classification. In addition, future research directions in the area of automatic disease identification and categorization employing endoscopic frames are being looked into based on the existing literature.
Keywords: CADx, Disease classification, GI tract, Machine learning, Segmentation
Introduction
Visual data are very important and dominate over the other forms of data. Efficient algorithms are used to compute the visual data and acquire the necessary information. The CADx has multiple applications, such as disease recognition and classification, recognizing faces on social networks, assisting remote sensing, and enhancing security systems [1]. In addition, AI-powered systems can locate disasters in far-off locations by analyzing satellite images. Similarly, the health care system generates significant information about diseases using visual data promptly. Once the multimedia data is processed and analyzed, it is essential to promptly address the results of the challenges within the existing healthcare system. A way of healthy living can be improved by the advancements in technology in the medical industry. With the help of advancements in technology, now a day man can visualize and inspect the inner parts of the human body by adopting procedures such as endoscopy and other techniques that were unapproachable in the past. The gastroenterologist examines the internal part of the GI tract by inserting a camera through a long wire tube to identify any potential diseases. The digestive system, sometimes referred to as the GI system, which is essential to the process of breaking down and absorbing nutrients from food. GI tract is composed of eleven parts. The endoscopy procedures are categorized into two methods upper endoscopy and colonoscopy, the procedure which is adopted to observe the stomach, and small intestine by inserting the tube from the mouth is known as upper endoscopy while examining the large colon, intestine, and rectum inserting the long tube through the rectum is referred as colonoscopy. The GI tract is vulnerable due to several diseases such as colon and gastric cancer affecting the bowl and stomach respectively. The literature shows that every year 0.7 million cases are reported related to gastric cancer [2]. It is essential to comprehend the intricacies of the gastrointestinal system in order to preserve general health and avoid digestive diseases. A balanced diet, adequate hydration, and proper nourishment all support this vital physiological system's optimal operation. Figure 1 shows the pictorial view of the GI tract.
Fig. 1.

Anatomy of GI tract [3]
According to the National Center for Health Statistics, in new cancer cases, 606,880 out of 1,762,450 were death cases in the United States. Moreover, stomach cancer is revealed as the fifth deadliest cancer, resulting in an estimated 783,000 deaths in 2018 [4]. Cancer is dominant in central Asia and Middle Eastern countries reported internationally. The intensity of GI diseases increased in the United States of America where 60–70 million people were affected by bowel cancer (colorectal cancer) [5] and 700,000 cancer deaths and 1.3 million new cases were revealed in 2018 statistics [6]. World Health Organization (WHO) international agency declared that colorectal malignancy is the third and second most normal disease in people. The abnormal growth of cells leads to the development of various diseases, including cancer. The abnormal cells are produced from the affected older cells that never die. When compared with normal cells, cancer cells have different characteristics including the growth of cells into other tissues [7]. Cancer is a very dangerous case when the deoxyribonucleic acid (DNA) of a cell becomes damaged which can form a cancer cell. Types of diseases in the GI tract are illustrated in Fig. 2.
Fig. 2.
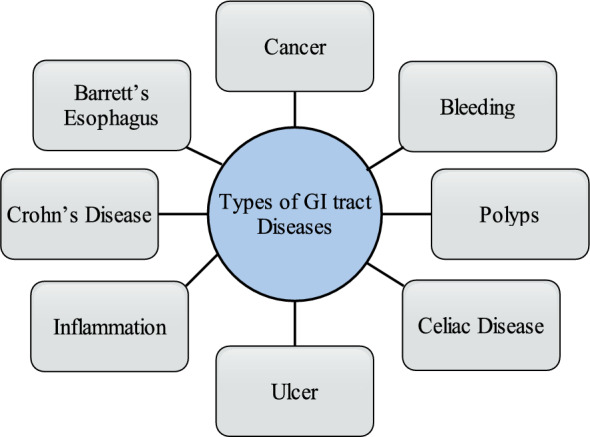
Categories of GI tract diseases
There are two possibilities when the DNA of a cell gets damaged, In one case the damaged cell is repaired and in the second case, the cell dies. The second case is very dangerous in which new cells are produced like DNA as its parents[8]. Bleeding refers to a medical condition in which various abnormal conditions affect the GI tract [9]. GI tract bleeding is the most common abnormality and its detection is particularly very important in screening [10]. A polyp is a very dangerous disease like cancer that leads to unusual mucosal growth, typically benign. However, some colorectal polys are diminutive and very dangerous. If Polys is not treated in the early stage, it can affect the other regions of the GI tract [11]. The colon and small bowel are the most suitable places for growing polyps that grow in any region of the GI tract [12]. Celiac disease has become more complex to diagnose [13]. The small intestine contains such a type of disorder [14]. Excessive acidity in the stomach can cause ulcer disease in the abdominal [15]. The disease due to cells that are damaged by gastric juices is known as a peptic disease [16]. Inflammation of the gastric lining is associated with dyspepsia and acid reflux [17]. H Pylori is the main cause of gastric inflammation [18]. When the mucosal surface is infected or inflamed then it is caused to Crohn's disease [19]. Some time Crohn's disease can also damage the ileum(parts of the small intestine) [20]. Normal squamous esophageal epithelium can inflammation by BE disorder caused by metaplastic intestinal epithelium encompassing goblet cells [21]. A pictorial view of all discussed diseases of GI tract is given in Fig. 3. Gastric cancer clinical conditions are presented in Table 1.
Fig. 3.

Pictorial view of GI tract diseases a cancer b bleeding c polyps d celiac disease e ulcer f inflammation g Crohn’s Disease h Barrett’s Esophagus[22]
Table 1.
Gastric cancer clinical conditions
| No | Name | Clinical conditions |
|---|---|---|
| 1 | Normal | The mucosa is free from irregular structure and abnormal lining. |
| 2 | Metaplasia | The existence of gastric-type mucus-secreting cells is described by the gastric metaplasia in the mucosa of the epithelium of the duodenum. The gastric foveolar epithelium caused limits the syndrome to a duodenal bulb and includes the replacement of normal absorptive and goblet cells [23]. |
| 3 | Dysplasia | When the cells of the gastric mucosa are transformed into abnormal then stomach epithelial dysplasia appears. The most common type of stomach cancer adenocarcinoma forms when this cell irregularity appears[24]. |
| 4 | Sparce | Integrin beta and MMP-2 protein levels and SPARC are upregulated in stomach tumors examined with adjacent noncancerous tissues [25]. |
| 5 | Atrophic | Atrophic type cancer is also known as Type A or Type B gastritis. Atrophic is the process of persistent gastric lining, pointing to the loss of gastric epithelial cells and their future replacement by intestinal and fibrous tissue [26]. |
When the disease is examined and detected in its early stage might be possible to recover timely which saves human life. Early examination of GI tract can put an impact on human health. Conversely, the screening procedure is time taking and demands hefty costs for disease diagnosing that gives rise to an unfavorable atmosphere and discontentment. Norway and the US have conducted tests at prices of $450 and $1100 per case, respectively, demonstrating a similar approach [27]. Various diseases that are visually visible, such as gastric cancer, bleeding, and stomach ulcers, have the potential to impact the GI tract [28]. The medical field encompasses a vast domain to acquire a region of interest in GI tract. The exponential growth of multimedia data, including videos and images, poses challenges in terms of storage, processing power, and bandwidth requirements. Multimedia data comes in various formats, resolutions, and encoding schemes, making it difficult to handle the heterogeneity of data sources. This heterogeneity introduces challenges in data integration, interoperability, and compatibility across different multimedia platforms. Extracting meaningful information from multimedia data involves challenges in content understanding, feature extraction, object recognition, and semantic analysis [29]. Using modalities of different companies, varying specifications, the orientation of diseases, cleansing, and illumination effects are founded in the frames of endoscopy and colonoscopy. Different types of image modalities are discussed in the following section.
Images modalities
The medical image acquisition procedure is adopted without any biopsy renowned as modalities. Therefore, screening of the GI tract is performed using endoscopy as an invasive method. In addition, an endoscope consists of a long wire-attached instrument with a camera [30]. Endoscopy techniques are being found with diversities. Several types are introduced but major categories are traditional wired video endoscopy and wireless capsule endoscopy, both are used for screening of GI tract. Some of these types of endoscopy procedures are discussed as:
Traditional wired video endoscopy (WVE): WVE is composed of different parts including the light source, charged couple camera (CCD), liquid crystal display (LCD) screen, flexible wire, light source, and monitor to observe the individual frame of an image. The WVE is a less invasive method where a secondary channel is used for biopsy or taking tissue samples from the lesion areas [31]. This procedure needs accurate control by gastroenterologists over the movement of the endoscope during the cleansing process using the accessory channel [32]. The wired endoscopy procedure having the camera with its front end is shown in Fig. 4.
Wireless capsule endoscopy (WCE): The more secure, convenient, and efficient way is the wireless capsule endoscopy for observing the GI tract. WCE faces some challenges such as capsule cost with the cost of an expert, screening without camera control, and lack of a secondary channel. The one noninvasive procedure is the WCE, but its field of view (FOV) is out of control for visualizing small bowel when compared with WVE. However, WCE still provides painless solutions when compared with WVE [34]. The advantage of WCE over other techniques is its capturing long-length videos, such as in the case of a single patient 45 min to 8 h are taken and more than 50000 frames are generated. The process of manual screening takes time with a specialist endoscopist and the specific region of the GI tract which is being observed [35].
High-definition video endoscopy (HDVE): The density of transistors in a single chip is cumulative as enhancement in technology is being made. The microscopic view can be magnified by using HDVE. The targeted area can be visualized 150 times magnified in HDVE and the microvascular structure of mucosal can be visualized more visible and clearly by the HDVE instance of WVE [36].
Zoom/magnifying endoscopy (ME): The improved endoscopy technique is known as ME in which a lens is used to the magnifying the mucosal surface. HDVE and ME both have similar features such as magnifying the microvascular structure of mucosal [37]. The standard WVE with some filter of the lens is used for magnification [38].
Chromoendoscopy (CH): Chromoendoscopy is the process used traditionally for investigating the mucosal structure wherein spraying dyes are instilled into the GI tract during visualization that makes disease area or cancerous area more clear and reported useful in many cases [39].
Virtual chromoendoscopy (VCH): The VCH is more user-friendliness as compared to the CH. The CH is primarily utilized alongside image processing algorithms and bandpass filters, which produce a dye-like effect. Furthermore, other endoscopic procedures conducted with the VCH do not require the application or removal of dye through spraying and suction. VCH and HDVE are used alternatively and controlled with a single switch for on/off which makes them more sophisticated and user-friendly [40]. The term digital, electronic, and dye-less is used for VCH in the literature [41].
Narrow band imaging (NBI): The mucosal irregularities are highlighted using NBI associated with polys and dysplasia [42]. The NBI is a more convenient and refined procedure because it uses filters and makes the microvascular structure, vein, and capillaries more highlighted without using dye [43].
Confocal laser endomicroscopy (CLE): CLE is a novel gadget in the endoscopist armamentarium. It contains closed histological information. The limit of gastroenterologists is to disentangle the infinitesimal pieces of information which appear in various screening procedures in the GI tract. Starting late, the field of utilization has reached out to give hepatobiliary and intrastomach CLE imaging. CLE licenses"sharp,"coordinated biopsies, and can control endoscopic interventions. Regardless, CLE is in like manner translational in its system and licenses commonsense imaging that put impacts our perception of gastrointestinal diseases. Subnuclear imaging with CLE licenses acknowledgment and depiction of wounds and may even be used for the desire for a response to centered treatment [44]. The illustration of all discussed endoscopy apparatuses is given below in Fig. 5.
Fig. 4.
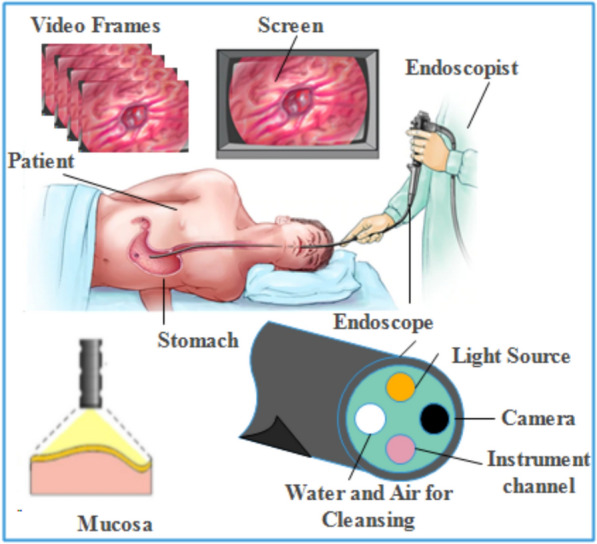
Image acquisition and setup for endoscopic screening [33]
Fig. 5.

Illustrations of Endoscopic apparatus a WVE b WCE c HDVE d ME e CH f VCH g MBI h CLE [45]
However, an appropriate technique for processing visual data due to both ongoing development and the limited availability of training data is needed. Therefore, effective, reliable, and scalable data processing techniques are required that can handle substantial amounts of data. In addition, within the healthcare system, visual data necessitates parallel processing and the utilization of elastic heterogeneous resources to achieve swift processing [46]. Choosing the right feature extraction technique for CADx is an essential decision. Likewise, the extracted features play a significant role in tasks such as segmentation and classification. Both image preprocessing and image segmentation hold significant importance in obtaining image descriptors [47]. The study focuses on several aspects related to the screening of the GI tract, including different modalities that can be utilized. In addition, the paper discusses feature selection techniques and different classification methods employed in this field. A generalized model of the CADx is shown in Fig. 6.
Fig. 6.

An overview of the CADx
There are enormous approaches used in CADx such as Harshala Gammulle et al.proposed two methods for disease recognition using handcrafted and deep learning features methods [48]. Vajira et al. present five distinct ML models using global features and deep NN models for multiple disease detection and classification in the GI tract [49]. Novel techniques with good accuracy are employed in which data mining techniques are applied with neural networks for GI tract disease detection and classification [50]. The proposed model of CADx is employed for disease classification [51]. The approach describes the benefits of automatic disease detection and classification over manual findings with endoscopy images that are very fast and accurate [52]. The study concentrates on the real-time use of CAD technologies that give endoscopists instant feedback to make it easier to integrate CAD systems into clinical processes [53]. Using AI-based diagnostic techniques on video data is a crucial step in achieving this objective. In a recent study, NBI zoom video clips of EAC and NDBE were used to assess a deep learning model that had been built on static images.
Output-based CADx systems are depicted in Fig. 7.
Content-based image retrieval CADX: By retrieving well-matched images or collections of images from the database using content-based image retrieval (CBIR) algorithms, a descriptor is produced, which is then condensed by feature extraction [54]. CBIR is a straightforward solution that aids Gastroenterologists in identifying abnormalities by allowing them to choose required insights from a sequence of frames. [55]. All data of endoscopic procedures retrieved that hold similar pathological conditions such as bleeding, inflammation, and ulcer [56]. Therefore, CBIR is referred to as CADx because a query image is fed into it after features matched by a single or set of images are provided at its output [57]. Generally, the discrimination between the normal or abnormal regions in the frames is achieved by classification and segmentation methods that are described ahead.
Disease classification CADX: Classification-based CADX system classifies the lesion or nonlesion area in the frames of the endoscopy and it can also perform multilevel classification further checks the grade or severity-level of the disease so that treatment started at the early stage of the disease [58]. The modern approaches for disease classification are supervised(labeled or data-driven) and unsupervised (unlabeled) based learning. In supervised learning, the descriptor of each frame is extracted. It is combined with the label of each class, resulting in the attachment of the class label to every feature vector within the entire dataset. The model predicts the label of the relevant class after training while in the unsupervised model, the label is not required similar feature-based clustering is performed in the training phase and the model can classify the normal and abnormal areas in the frames of endoscopy [59].
Disease segmentation CADX: The process of selecting the required area from the image based on similar features is called segmentation also referred to as a perceptual grouping of pixels. The pixels with similar characteristics show the disease area also called the subimage in the frame [60]. The segmentation-based CADx systems take an image as input and provide the annotated image. Detecting diseases using the segmentation method remains a difficult undertaking due to the presence of various factors in the GI tract area, such as blood, polyps, and bubbles, which introduce variations. Therefore, segmentation could be performed in real time or later on recorded frames of videos [61].
Summarizing endoscopic procedures CADX: Recall (Rec), sometimes referred to as sensitivity/hit rate/true positive rate, is one statistic used to evaluate the effectiveness of CADx systems. Recall offers information on the correct identified sample relative to the real sample of the positive class.. The term FPR (false positve rate) and FNR(false-negative rate) measures the postive and negative classes prediction. Other metrics are included precision (Prec), accuracy, specificity (Spec), F1 score, and region of interest. These measures scale how well the system can accurately classify and segment data.
Fig. 7.
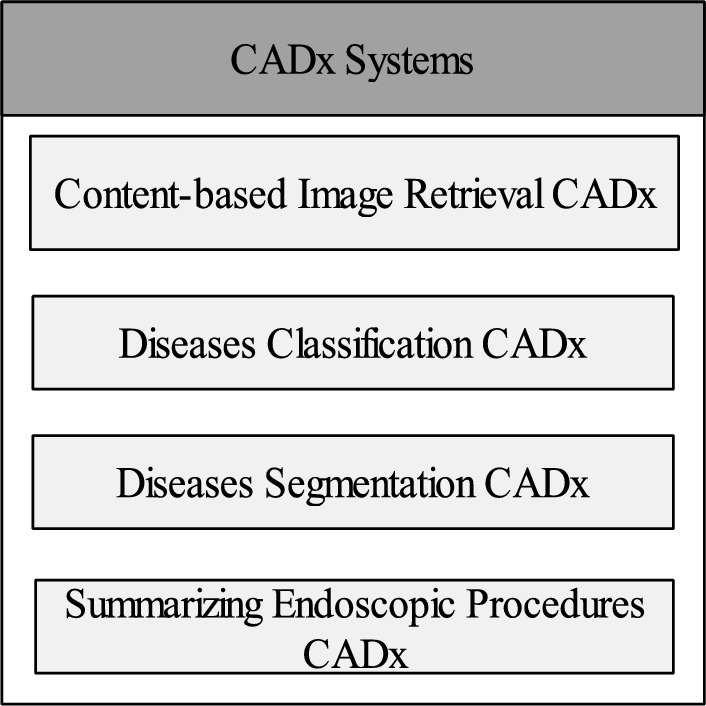
Output-based CADx systems
The complete review is organized as follows: Sect."Preprocessing of endoscopic frames"offers a detailed analysis of the various preprocessing techniques applied in prior studies. Sect."Polyps segmentation methods"outlines the approaches employed for segmenting the affected area in the frames. The methods for feature extraction, including both deep learning and handcrafted techniques, are discussed in Sect."Feature extraction methods". Sect."Features selection methods"delves into the approaches for feature selection, while Sect."Disease classification methods"focuses on classification methods. In Sects."Datasets" and "Performance measures", the datasets used and the evaluation metric employed are described, respectively. In the last, Sect."Challenges and findings"offerings the conclusions drawn from the review, and Sect."Conclusion"highlights the challenges and potential avenues for future research.
Preprocessing of endoscopic frames
CADx includes preprocessing as an initial stage because endoscopic frames contain a lot of challenges including feeble cleansing, bubbles, insertion of instruments, distortion of lenses, illumination invariance, and the existence of food particles [62]. Likewise, endoscopic images are suffered from various factors such as poor contrast and disease orientation [63]. Thresholding techniques are utilized on parts of the frames to eliminate noise in the images, while image clipping methods isolate particular regions and break down the background into small noise elements such as edges, points, and lines. Simple and median filters reduce the noise from the frames by designing an affecting noise filter [64]. Preprocessing deals with various operations including image resizing, noise removal, median filters, color space transformation, and histogram equalization for improving the visualization of the frames. The image enhancement is performed for making the image more appealing and revealing the contents of the image that are not perceived by the naked eye [65]. Furthermore, image enhancement is done by adjusting the contrast, pixel color value, removing noise, and normalizing the endoscopic frames [66]. The technique brightness preserving dynamic fuzzy histogram equalization (BPDFHE) is employed for enhance the brightness of the images [67]. The different color spaces which include RGB, CIEXYZ, CIELAB, YIQ, HSV YUV, and HIS are used for improving the quality of the frames [68]. The implementation of the CLAHE preprocessing technique enhances the outcomes in the classification of colorectal cancer conditions. [69]. The available frames of endoscopy come with RGB color space. Histogram equalization improves the visualization of RGB frames [70]. The preprocessing techniques including HSV, CIELAB, and other color spaces support color feature extraction [71]. Statistics of color and moments are used as color space. There are three color space channels hue, saturation, and intensity that are transformed in HSI color space [72]. Three channels are used with radial basis filters also known as the kernel. Disease detection and classification need to be considered using endoscopy-based images. Only a few frames of images own abnormalities during capturing the images in the GI tract. Sometimes the abnormal areas in the image cannot be identified by the human eyes due to the lack of the image capturing standard [73]. For improving image quality, the process where image enhancement, color space selection, size, and texture adjustment is performed. Hence, existing techniques can be accommodated by handling all these issues [74]. Color utilization variation in the image frames may cause false detection of abnormalities in the image classification [75]. A low colorspace is used during the capturing of frames from the GI tract by endoscopic procedures. Hence for improving the Acc, several preprocessing methods are conducted to show images more appealing for the detection of abnormal areas [76]. The random rotation occurs in the endoscopic frames due to variation in the field of view. Several methods are discovered that determine the variations in the visual area of the endoscopic frames [77]. The changes in light and distance to the mucosa in the gastroscopy images may cause scale invariance in the endoscopic frames [78]. The preprocessing helps to segment the abnormal area of the GI tract. Polyps are detected by CNN-based approaches using annotated image datasets that are prepared by an experienced colonoscopist. In the following section, different segmentation approaches are comprehensively described.
Polyps segmentation methods
In the recent times, the field of automatic disease detection, particularly in areas such as polyp detection and segmentation, has become an important research area. Consequently, numerous algorithms and effective approaches have been devised to detect polyps [79]. The analysis of polyp is done based on texture and color methods. utilization of manually designed descriptors to capture and learn the distinctive characteristics from the images [80]. In the research industry, CNN has gained considerable prominence due to its notable achievements in public challenges. [81]. Novel software modules and algorithms are specifically developed for the detection of edge and polyp shots, employing CNN [82]. Moreover, a range of methods is utilized for detecting polyps in colonoscopy data. The CNN models are employed in transfer learning and postprocessing approaches [83]. Similarly, the model's ability to detect polyps has been enhanced and the production of polyp images occurs by using generative adversarial networks [84]. A high-sensitivity algorithm utilizes to identify the real-time pattern from the images is known as you only look once (YOLO) to detect and pinpoint polyps [85]. A SEM-supervised method is used to segment the abnormal area of the illness [86]. Moreover, the Spec and Sen of these systems are high in terms of performance [87]. In recent times, the standard of computer vision approaches has improved using data-driven methods, including the method of segmentation, where feature maps are acquired from the layers of deep CNN models [88]. Different deep-learning models are employed in the literature for disease segmentation as shown in Table 2.
Table 2.
A summary of results compiled over the Kvasir-SEG dataset
The initial introduction of the segmentation approach relies on a fully convolutional network (FCN) [96]. The FCN architecture has been modified and expanded to create UNet [97]. Furthermore, UNet is composed of two pathways known as the encoder and decoder, which serve as the analysis and synthesis components, respectively. The encoder explores the information deeply using different depth of filters and also, decreased the dimensions of the feature maps while the decoder combined the information and provide segmented output. The encoder–decoder architecture, exemplified by UNet and FCN, holds great importance in the realm of semantic segmentation [98]. In the literature, various versions of UNet have been documented for biomedical segmentation. Among the pretrained networks utilized, both VGG16 and VGG19 are included which are trained by the ImageNet dataset that can also be replaced by the encoder for segmentation tasks [99]. As a result, ResNet50 and similar residual networks have achieved remarkable success in transfer learning [100]. As described in the upcoming section, the process of extracting features holds significant significance in disease segmentation and classification.
Feature extraction methods
The color information (pixel intensity) is transformed into numeric data which shows the pattern and representation of instances in the images known as features. The recent literature reports the methods how to extract the descriptors (most important information/features) from the frames using different feature engineering methods. The required low-level information about the diseases is extracted that is employed by the classifiers [58]. It is difficult to explore the descriptor of lesions in the frames of the GI tract explicitly because of even conspicuous variations in shape and color [101]. The important features are color, texture, geometric, hybrid, and deep learning features. There are three classes of feature extraction including the spatial domain which deals with pixels directly, the frequency domain works using a frequency of the specific information including Fourier transform and wavelet techniques, and deep features learn automatically using deep models. Moreover, The spatial domain deals with pixel intensities while the frequency domain describes the rate of change in the intensity of the pixels. The spatial–temporal domain has some feature extraction methods [102]. The process of extracting features is categorized into four groups, namely color features, geometric features, texture features, and feature learning. Texture and color information is commonly used to characterize the features of GI tract diseases. Texture features are categorized into three types such as local binary patterns (LBP) that capture local information using 8 x 8 sliding windows, filter-based features, and shape-based which are crucial for GI tract disease identification [103]. Frames of video endoscopy are transformed into HSI color space for feature exploration [104]. The feature sets are made by splitting the images into patches with chromaticity movements calculation [105]. The CIELAB color space methods are used for detecting abnormal regions using local patches [106]. The texture and shape of the image help to find an interesting region in the image frame [107]. A single frame of image is subdivided into small partitions to extract insights from each patch. Texture analysis is used in finding abnormal parts of the frames, it is used as a descriptor for pattern analysis of gastric tumors or malignancies [108]. Feature extraction methods utilized for texture analysis encompass histogram-oriented gradient (HOG) that apply thresh hold and extract information using 9 bins based over gradient (magnitude of the rate of change) and orientations (angles), scale-invariant feature transform (SIFT) [109], segmentation-based fractal texture analysis (SFTA) [110] collects the fractal information from the images, LBP, and Otsu's methods [111]. Homogeneous textures are used for the identification of lesions in the endoscopic frames [112]. The texture is computed using Discrete Fourier transform method and statistical analysis of normalized gray-level co-occurrence matrices is calculated that represents the texture of the images [113]. Discrete wavelet transform (DWT) based features are combined with LBP features to extract texture information from WCE frames and classifiers are trained on these features [114]. Features extraction methods are depicted in Fig. 8.
Fig. 8.
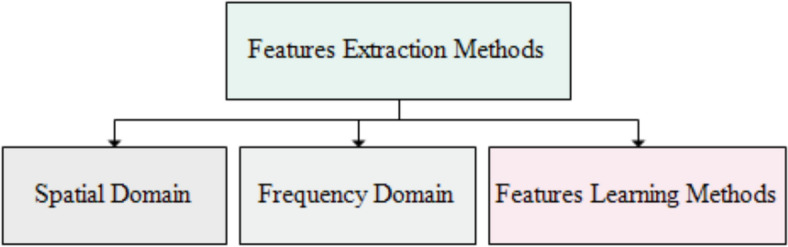
Features extraction methods
Spatial domain
Spatial features refer to the intensity of local pixels in the image. Moreover, spatial features are used to analyze the features including texture analysis (Texture analysis involves identifying patterns and structures within an image), color analysis (Color analysis involves identifying the colors present in an image and their distribution), and shape analysis (Shape analysis involves identifying the shapes of objects in an image). The spatial features are extracted by domain experts who design a specific technique according to their knowledge. It is difficult to extract complex patterns using handcrafted techniques. Feature extraction is a predominant and important method like preprocessing and segmentation that are used for GI tract disease findings. Feature extraction methods in the spatial domain are depicted in Fig. 9. Feature extraction is a key emphasis for Ailment detection. The processing of feature extraction in the spatial domain deals with direct pixels manipulation. Every pixel of the endoscopic frames is precisely investigated for abnormalities recognition [108]. Several methods of feature extraction are developed for infection finding and getting perceptual information. The multiple methods of feature extraction in the spatial domain are discussed in the following section.
Fig. 9.

Overview of feature extraction methods using a special domain
Color characteristics
The basic visual features that are extracted from the endoscopic frames are the colors that show the visual spectrum of the mixed light with various bandwidths. The mucosal surface is visualized by using color information of gastric frames acquainted using NBI and CH. Colors are considered very important in clinical pathology finding such as inflammation, bleeding, ulcers, etc. Endoscopic frames contain colorful information where each color information is recognized as the color channel (RGB). However, gray images are made with a single-intensity channel. Mostly colon and gastric frames have low contrast color space [115]. Endoscopic frames are represented by different color spaces such as CIE-LAB, CIELUV, CIEXYZ, HSV, and RGB in various applications but which one is more important for any particular malignancies could not be determined.
Color histograms: The histogram is the basic information that can be derived from an image's channel [116]. A histogram indicates a pixel strength probability and provides information on the color distribution. In the zoom endoscopy, the study of the different channels in a single color space is carried out and the individual channel is combined as a single frame [117]. Likewise, the two-color channels histogram including RGB and HSI are utilized. The features of the color histogram and RGB histogram are used to detect the specific region of the disease. Besides, the HSV color histogram is considered better than the RGB color histogram in some experiments. Therefore, the conversion of RGB color space into other color spaces is performed for improving results. Classification of bleeding frames is performed by using HSV color space that shows greater uniformity of colors [118]. HSV color histograms gain more importance than image histograms of the local RGB color. The primary colors are used to compute thresholds for the segmentation of the colonoscopy images, and the segmentation error is reduced by using the CIE-LAB color space [119].
Color moments: Colors are very sensitive to lighting. These are changed in a complex GI tract during data acquisition under different lighting conditions that offer new challenges when using colors as descriptors to identify gastric anomalies. Due to lighting changes, color moments are meant to cope with color variations. The basic function of the methods of polynomials and HSI color space is to detect diseases such as bleeding and ulcers in endoscopic frames. The bleeding regions are identified and classified by using color arrangements [120]. Several methods of feature extraction are developed using different statistical approaches to describe the color characteristics in the RGB frames. The diseases including precancerous lesions are identified by statistical characteristics using endoscopic frames [121]. The technique optimum multithresholding flattens the boundaries of diseases and morphological operations are performed to fill the holes for disease detection [122]. Owing to a lack of control over camera movement in the WCE procedure, the major problem is the camera distortion in various systems. The camera's variable distance from the mucosal wall creates undesirable effects. Uniformly spaced channels and light reflections are distinguished by the CIE-LAB color space. Kurtosis, variances, and entropy are the color moments that are calculated to detect the Ulcer and bleeding from image channels [123]. Color features are extracted by HIS color space for visual perception [124]. Similarly, the numerical statistical measurements of various composite channels for bleeding detection in WCE frames are computed over a variety of color attributes.
Salient color features: salient color features mean specific patterns in the frames. A process of conversion from RGB to other color space (CMYK, CIE-LAB) is done to detect the salient regions such as polyps, and bleeding [125]. First-order moments are determined to shape the collection of features. Moreover, in CIE-LAB color space, characteristics of particular pixels are defined for the identification of affected regions where the transformation of RGB to HSV is done [126]. Furthermore, HSV color space is inverted to RGB color space for the detection of the bleeding regions [46].
Local color features: By splitting any image into small patches, the information on local color is obtained from images. Using the patches, valuable features (descriptors) are extracted [127]. The local information from the frames is determined and analyzed. Descriptors can also be included the pixel spatial position and as well as color information. Similarly, the distance between color pixels is considered for computing the abnormalities using CH frames [128].
Texture features
A recurring pattern in an image is recognized as a texture that provides information about surface characteristics including roughness and flatness. Texture in frames is classified by employing a difference-based micro-block technique in which multiscale symmetry is discriminated [129]. Pixel-level and dense macroblock changes are referred to as local features that combine the K-rotation with Gaussian distribution. A descriptor based on a higher-order local feature-based method is proposed that processes the local information to encode global descriptors [130]. An average spatial pyramid pooling is merged using a multiscale difference (MSD) and micro-block difference (MD) based texture descriptor which is created by multiscale SDMD [131]. A novel multiscale frequency-based classification approach is proposed by including the color difference-based representation (CDR) method for texture exploration. The local and differential excitation vectors are used for extracting a variety of textural formations. The combination of the CDRs is used to create various texture features [132]. Similarly, texture analysis is very famous and gained a lot of significance in medical imaging such as cancerous regions detection and representation of texture methods using endoscopic frames.
Local binary pattern: A very helpful texture describing the method by using images is LBP where all neighboring pixels are compared with the central pixel and binary code is assigned to every pixel that determines the simple LBP pattern and later on binary codes are converted into decimals. A histogram is created by computing the occurrence of binary codes where the local texture in the images is represented. There are numerous developments made to increase the representational power of the LBP. Here, illumination variations are dealt with by multiscale LBP [133]. The LBP deals with the various structure of neighboring pixels (8,16,24) and is also employed with various other LBP variants (LBP59, LBP256, LBP10) that extract features for the problem of image classification [134]. Similarly, vector quantization is used with uniform LBP for abnormalities detection [135]. Refined local pattern features-based LBP is introduced for the grouping of texture and a more advanced technique is reported to extract a refined completed LBP (RCLBP) combined to create a JRLP texture descriptor [136].
Statistical texture features: To represent the texture of pictures, statistical measures are commonly used. Statistics on intensity distribution provide details about the texture of the image. GLCM is introduced in which pixels in pair form are found whose frequency is measured. Besides, from these matrices, several statistics including contrast, energy, similarity, and correlation are determined to describe the texture of images [137]. Similarly, anomalies are detected by the texture of the endoscopic images using Haralick's features [138]. Moreover, YIQ color space with statistical features is employed to approximate the diseases in the GI tract. Texture information is obtained for disease classification by computing GLCM. Texture features involve the computation of entropy, an inverse moment of difference, energy-angular second moment, and correlation are used for the analysis of GI tract diseases [139]. In short, statistical metrics (mean, standard deviation) are used for texture features analysis. Some common statistical texture features such as LBP, and gray-level run length matrix (GLRLM) features. Gray-level co-occurrence matrix (GLCM) features describe the second-order statistics of an image, which capture the spatial relationship among a couple of pixels. LBP features describe the distribution of local binary patterns within an image, which captures the texture information in a more local and fine-grained way than GLCM features. GLRLM features describe the distribution of pixel runs of the same gray level within an image, which captures information about the length and orientation of texture patterns.
Geometric features
Geometric features contain information about edges, corners, points, lines, blobs, ridges, image texture with salient points, and shape bases features as addressed in the following sections.
Edge-based features: Normally, colorectal cancer has no distinctive form or scale. However, features (edges or contours) of some lesions like polyps and tumors are detected by using a geometric model [140]. Similarly, Sobel which is famous for sharp variation detection, and Canny edge detector are used to design a model that finds the shapes and edges of the polyps [141]. The features of Gastric cancer disease are extracted using edge-based features [142]. Celiac disease tissues of normal and abnormal are examined by the geometric feature extraction approach [143].
Shape-based features: The shape-based modeling including smooth spiral, fractal dimension, and Koch-snowflake efficient methods are performed using frames of NBI [144]. Based on the optical colonoscopy images, very important features are extracted from multiscale objects [145]. Some geometrical features of polyps are determined by the HLAC method [146]. HLAC technique uses the product–sum formula over auto-correlation for feature extraction using endoscopic images [147]. Features of the elliptical pattern are used to recognize the polyps abnormalities in the colonoscopy frames [148]. Geometric features that make 3D trajectory construction using frames of endoscopy by using fuzzy logic [65].
Hybrid features
In the spatial domain, frames are processed to extract the various descriptors. In some particular conditions, these methods of feature extraction may work well, for example, color features for bleeding detection). However, these characteristics have minimal discrimination power to identify complicated anomalies (e.g., cancer, polyps, and Ulcers) when used separately. Hybrid features deal with environmental problems such as variations of rotation, size, and illumination in the images. To achieve stronger discrimination against accidents, two or more forms of characteristics are combined. Below are hybrid methods that are used for the automatic diagnosis of lesions.
Color texture features: The inflammation region in the GI tract is illustrated by applying combined characteristics of the colors such as red color and filter-based texture are utilized [149]. The composite characteristics of the edge-based, texture, and colors help to recognize the diseases in the GI tract [150].
Local binary pattern and color texture features: A composition of RGB and HSV introduces modified LBP features from the endoscopic frames [151]. The combination of color and texture detail is used in various research works such as HV histogram from HSV and similarly, HIS contains detailed information in I channel, RGB, and RG histogram combined, same as hue histogram are used in combination fashion [152]. Super pixels are raw materials to extract LBP texture, color histogram, and PHOG. Multiple color channels in a mixture fashion support the extraction of more refine texture detail from the images. Gaussian-filtered LBP (GF-LBP) combined features are used to extract texture from endoscopic images [153]. The pyramidal histogram is used in the extraction of texture information. In the same way, texture-based patches are isolated from the LBP characteristics for classification by using patch information [154]. LBP texture is arranged in the paired form with moments of color. Texture color information is acquired by the use of color histogram and LBP texture in a combined fashion [155]. The explanation of color features and texture descriptors in combined form is reported where various components are fused including color histogram, HSV, and LBP components [156]. Furthermore, the LBP of 8 and 16 pixels with the central neighborhood pixel is extracted to combine texture and color information. LBP and uniform features are combined and used for getting information from endoscopic frames [157]. The chrominance is determined by the histogram in which RGB to HIS transformation is executed using endoscopic images.
Statistical color texture features: An imaging histogram is utilized to compute the statistical moments (entropy, standard deviation) that represent the HIS and RGB color spaces. The dominant colors with eight in quantity are computed from GLCM frames where texture and color characteristics are combined [158, 159]. In the same way, color characteristics are presented by the bi-dimensional ensemble empirical mode decomposition approach where computation is made by intrinsic mode functions (IMFs) using endoscopic frames [160].
Color and geometric with texture features
Geometric texture features: Texture features (LBP, SIFT, and HOG, etc.) are combined with geometric (PHOG function) and color information (RGB) to describe the descriptor where significant deep unmonitored features are extracted [161]. SIFT is used to classify the endoscopic frames combined with shape-based HOG and LBP features [162]. Statistical moments support determining the topological characteristics in the picture [163]. The physical (geometric) characteristics are determined to classify any potential for the affected region from NBI images [164]. Using the high-order kernel to design an algorithm named graph matching algorithm for clustering the information of the frames [165]. The combination of the edges and nodes is recognized as a graph where nodes and edges are referred to as pixels and relationships between nodes have similarities respectively.
Geometric and color features: standard deviation and mean statistics are calculated for polyps detection using frames of endoscopy [166]. Heterogeneous, colors and point-based SIFT characteristics are combined to segment the lesion in frames of endoscopy [167]. Salient features are extracted using SIFT techniques in person re-identification [168]. For segmenting disease, visual data (edges, colors, and textures) is used and an edge-based model is suggested as an ACWE [169]. The following section describes the feature extraction approaches used in the frequency domain.
Frequency domain
Images are used without transformation in most cases for disease prediction. Frequency domain procedures are performed based on pixel intensities and the rate of change in intensities. The features are extracted using exponential Fourier analysis that determines the rate of changes in pixel intensities. The transformation (z, Laplace, and Fourier transformation) into the frequency domain is done before the feature extraction in most cases [170]. The feature extraction methods in the frequency domain are shown in Fig. 10.
Fig. 10.

Overview of features extraction methods using frequency domain
There are multiple methods of frequency domain such as hybrid, color, and texture feature extraction. The color texture method is further classified as Gabor and GLCM-based color texture, LBP, and statistical color texture in the wavelet domain. Similarly, geometrical color, texture, and combined form are used as color texture methods. The frequency domain methods for texture feature include LBP in the wavelet domain and statistical texture are used for disease identification and classification [146]. Color feature methods of frequency domain are DWT-based and Fourier filter-based.
Color features
Discrete wavelet transform-based color features: Different methods are used to transform endoscopic frames into color features (color information). The coefficient of wavelets is employed to extract the color information from the endoscopic frames by the transformation of pyramidal discrete wavelets [171]. The statistical methods including mean, standard deviation, scale, and rotation are utilized to extract features by the dual-tree- discrete wavelet transform (DT-DWT) approach [172]. A novel method produces feature vectors by computing six complex orientation sub-bands in every breakdown scale [173]. Color eight sub-bands are proposed to extract features. Stationary wavelet transform represents the de-correlated detail sub-bands by computing variance and shows better performance in contrast with DT-DWT-based features. Before DWT computing, images are transformed into CIE-LAB color space for feature extraction [174]. Fourier filters support to extract colors features for disease identification.
Color features based on Fourier filter: Frames of endoscopy are filtered using ring filters after the transformation into the Fourier domain [175]. The method of ring-shape band-pass filters utilizes ring width sizes of minimal (1) and maximal (15) for the analysis of multiscale objects. Using different size ring-shape filters, RGB frames are filtered for getting statistical information [176]. The information is obtained by splitting individual channels of RGB space into R, G, and B separately. The Fourier filter is applied on any separate channel of any color space like RGB, LAB, and CIELAB [177].
Texture features
Image surfaces and super-pixels are analyzed statistically for texture features (softness or stiffness) extraction in the frequency domain. Whereas an image is transformed into the frequency domain before extracting texture information. Generally, the computation of statistical measures represents texture in the outcome of the operation.
Statistical features: Image classification tasks are performed by the wavelet sub-bands statistical methods. Adjacent sub-bands descriptors are represented and modeled using linear regression that makes a difference between the sample and texture of the class [178]. In the wavelet sub-band, four local features are used to define the texture descriptors where wavelet coefficients model the heterogeneous and incrementally generated histogram (HIGH). The techniques of texture concatenation of all sub-band create the image vector (non-negative multiresolution vectors (NNMV)). The low-dimension WCE frames are employed to compute the linear subspace of NNMVs [179]. DFTs are computed for transforming the frames of the WCE [180]. Operation of the log transform is conducted using changing magnitudes for co-occurrence matrices normalization. Various statistics are computed using co-occurrence matrices of WCE images to represent the texture features. Different patches are found in the images that are utilized by DWT for lesion detection where four statistical measurements of GLCM are used [181]. The Gabor wavelet transforms (GWT) with the based comparison between DT-DWT and DWT is performed to get texture features [182].
Local binary pattern: The transformation of images is done and texture features are extracted by the curve-let transformation. The image texture for Ulcer classification is represented by implementing uniform-LBP features based on the coefficient of the transformed domain [183].
Texture analysis based on Gabor filter: Likewise, the log of Gabor filters are applied to WCE frames after the contour-let transformation. The result of the filters is computed by the mean and standard deviation to represent the texture features [184]. Gabor texture features are represented by applying the properties of scale, rotation, and illumination variations shift-invariance [185].
Hybrid features
Supplementary discriminative power is achieved by combining the various types of features referred to as hybrid features. Hybrid features are widely used in both spatial and frequency domains. The combination of color and texture features is employed in the frequency domain which provides better results than the spatial domain. The hybrid methods in the frequency domain are described below.
Color and texture features based on Gabor filters: Texture features based on Gabor are fused with color components by taking the mean and variance of each sample. A random forest classifier is trained using color texture features based on Gabor [186]. The ratios of various color components are utilized to analyze the frames of the WCE. The differentiation between cancerous and noncancerous cells is done by extracting texture, shape and intensities based features in the diseases classification [187]. Both color and texture information is obtained by combining the homogeneous texture features where the log of Gabor filters (LoG) is employed based on RGB color space. The composite fashion of Gabor-based texture and scalable colors makes a partition of the WCE frames of the GI tract. The classification of WCE frames is performed by using MPEG-7 features [188]. MPEG-7 features are used from where edge histogram features and dominant color descriptors are extracted that help to detect the abnormal region in Crohn's.
Color and texture based on grey-level co-occurrence matrices: Texture and color features are extracted by LUV color space with WCC matrices and Gray-level co-occurrence matrices (GLCM) are extended where from sub-bands of wavelets, statistics of GLCM are computed [189]. RGB color channels are exploited by combining GLCM-based texture features and color information. In the transformation of every channel, GLCM-based characteristics are presented by sub-bands of DWT. WCE frames are used in the DWT process where GLCM features are extracted, and later using RGB images and HSV color spaces, statistical measures are computed [190]. The combined methods GLCM and color moments are employed to compute features from images and channels respectively for making a complete set of features [191].
Local binary pattern and color features in wavelet domain: The transformation of RGB to CIE-XYZ color space and from contour-let to LBP is made for feature extraction from the WCE images [192]. Bleeding is identified in the testing phase of HSI and RGB color. The transformation to CIE-XYZ color space response is better than other color spaces. The new approach is introduced where first DFT uses color channels and later, using wavelet domain and GLCM is calculated [193]. Intera-color histograms and color channel support extract features with the help of the opponent color-local binary pattern (OC-LBP). By using texture information from images, DWT and LBP features are extracted from middle-level sub-band images. WCE images are captured with RGB and HSI format from where DWT-based LBP is extracted for classification [194]. YCbCr color space having color information is employed to extract DWT-based LBP features that have texture information [195].
Statistical color texture using wavelet domain: In general, statistical measurements including skewness, mean, standard deviation, variance, and kurtosis statistics are used to calculate the sub-bands of images, while energy, inverse difference, entropy, moment, covariance, and contrast are used to calculate the sub-bands of images'features. DCT transforms color curve-let covariance (3 C) images RGB to HSV color space and 3 C of images is used to compute second-order statistics. Leukocytes are categorized using wavelet decomposition approach [196]. A set of features is formed by the 3 C for the detection of tumors in small bowel [197]. HSI color space is used by texture features, same as texture and color features are fused that are recognized as statistical features [198]. Likewise, the integration of Hu moment and Fourier descriptors creates the final feature set. The transformation from DT-CWT to ME frames that are used in texture feature computation using frames of sub-band having six-level. Irregularities in the form of pit-pattern features are represented and computed by statistics or Weibull parameters [199].
Combination of geometric and texture features: A segmentation of polyps is performed by the watershed method [100]. A feature combination approach referred to as a marker is proposed where the fusion of k-mean clustering and Gabor texture is made for polyp shape analysis. The term motility describes muscle contraction that unites and drives contents. Moreover, for the classification of a specific area in WCE frames, the contraction method is adopted by using the Gabor filter for edge detection [200]. Crisp segments are shaped with edge detection by LoG and SUSAN’s edge detector in the colonoscopy frames [201].
Combination of texture features: The discrimination power increases when the combination of texture with another type of feature. The sign pattern (SP) and the magnitude pattern (MP) map the texture and multiscale wavelet transform-based techniques known as MRIR split texture as a step function [202]. MP having wavelet sub-bands are utilized by the step function fitted and calculated by the SDMVs with frequency vectors (FVs) of SP [203]. The combined features of LBP with multiple shapes and sizes are got by the Gaussian filters named Leung-Malik LBP (LM-LBP) which help to detect several pathological situations from frames of endoscopy [204]. Generally, Texture features are a powerful tool for analyzing and classifying medical gastrointestinal frames. Texture features capture information about the patterns and variations in intensity and contrast within an image, which can be indicative of underlying tissue structures and pathologies. Similarly, by simply concatenating the feature vectors of the various texture features into a single feature vector, such as when we extract the Gabor and Haralick features from an image, merging the two feature vectors into a single feature vector. A summary of the feature extraction methods that are employed for the classification of GI tract diseases is shown in Table 3.
Table 3.
Summary of feature extraction methods and GI tract disease classification
| Refs | Years | Methods | Datasets | Modality | Results |
|---|---|---|---|---|---|
| [205] | 2023 | Feature Engineering methods are employed for GI tract disease detection and classification. | 8000 images | VE |
99.24% Acc |
| [206] | 2023 | Hybrid approach is used for GI tract disease classification. | 8000 images | VE |
97.25% Acc |
| [207] | 2022 | Deep features are extracted for GI tract disease identification. | 8000 images | VE |
97.00% Acc |
| [29] | 2021 | Transfer learning approaches are used with variants of SVM classifiers GI tract diseases are categorized. | 4000 images | VE |
95.02% Acc |
| [161] | 2020 |
CS-LBP and auto color correlogram are employed for feature extraction and K-mean and SVM classify the frames of endoscopy. |
200 images | WCE |
95.00% Acc |
| [208] | 2020 | GLRLM-based features are used for colorectal polyp findings using SVM. | 86 videos | VE |
98.83% Acc |
| [209] | 2020 | Color and texture features are employed for Polyps identification and classification using an SVM classifier. |
300 Images |
WCE |
86.00% Rec |
| [210] | 2019 | ASWSVD is used for feature extraction and multiple classifiers classify the diseases of GI tract | 5,293 and 8,740 images | WCE | 86.00% Pre |
| [211] | 2019 | An ulcer is classified by an SVM classifier using color and texture features. | 9000 images | WCE |
99.00% Acc |
| [212] | 2018 | Cancer is identified using GLCM and Gabor texture methods and disease classification is performed by multiple classifiers. |
176 Images |
CH |
87.20% Acc |
| [106] | 2018 | Cancer identification and classification are performed by RF and KNN methods using Fourier, HIS, and Statistical techniques for feature extraction. | 280 images | VE | 86.00% Sen |
| [213] | 2017 | Polyps are detected using super pixel-based clustering and SVM classifiers. | 39 images | WCE |
94.00% Acc |
Feature learning methods
Features extraction methods are divided canonically into two types, bag of features (BOF) and deep learning approaches. Moreover, feature presentation methods are employed for the dictionary of the visual words while neural networks for classification and deep learning CNN are utilized for feature extraction using visual data in the form of images. Feature extraction methods including BOF and deep learning methods are given in Fig. 11. The detail of each method is shown in the coming sections.
Fig. 11.

An overview of feature learning methods
Bag of features
The term Bag of Features (BoF) is an extension of the Bag of Words (BoW) used in natural language processing while BoF is applied to image representation in computer vision rather than text. The BoF model is a feature extraction technique used in computer vision, where local image descriptors (e.g., SIFT) are clustered into a visual vocabulary, and images are represented as histograms of these visual words. Although BoF generates structured numerical representations [214]. In various classification tasks, the BOF model or bag of the visual word is widely used where image features representation is denoted as a visual word. The features in the frames of endoscopy are represented in the form of visual words that are used for learning the dictionary or codebook. The feature selection methods include filter (variance thresholding, TF-IDF), wrapper (e.g., SVM-RFE), and hybrid approaches (PCA + wrapper are employed to refine BoF features by removing irrelevant or redundant elements, improving model efficiency and accuracy. Combining BoF with feature selection enhances performance in tasks like image classification and object recognition by reducing dimensionality, minimizing noise, and optimizing discriminative power [215]. As a feature vector, the histogram is used for every frame [216]. SIFT features distinct visual words that are obtained and referred to as dictionaries [217]. Characteristics are represented in vector quantization by computing the histogram of visual words. These features are used for the classification and clustering of the diseases in the frames. SIFT features are used to extract dense features for disease classification [218]. The k-mean clustering algorithm produces visual vocabulary and quantized features set to recognize cancer tissues in the endoscopic frames. BOF methods are employed with big-scale SIFT and dense detectors for producing pCLE imagery [219]. Visual word-based color histograms and the frames of endoscopic are tested by techniques including LAB, CMYK, RGB, HSV, and YCbCr color spaces for bleeding detection [220]. Moreover, two-level of saliency detects the bleeding area in GI tact, and homomorphic filters are used to normalize the colors and illuminate the component L for filtering. Similarly, an adaptive color histogram produces vocabulary in the form of visual words [221]. The deep feature methods are discussed in the following section.
Deep learning methods for feature extraction
The existing deep learning models and their architectures are discussed comprehensively in this section. The models are employed for detecting and classification of GI tract diseases (Ulcers, polyps, bleeding, stomach cancer, colorectal cancer, and colon disease). The literature reports that the supervised CNN-based models use the labels (name of the classes) for classification. In unsupervised learning, clusters are created by the model as it learns from the data itself. The unsupervised learning models known for data creation, picture encoding, and augmentation in the medical field are GANs and auto-encoders (AEs). Generally, for the unsupervised model, annotated image datasets are intractable to obtain features.
-
Artificial neural networks: It is a part of ML where neurons are connected with a cascade style called a neural network that comprises input, hidden, and output layers. Furthermore, the layer which is located between the input and output layers is known as the hidden layer which consists of more than one layer, adding more layers leads to a deep neural network (DNN) [222]. Disease segmentation is done by using DNN and CNN for feature extraction [223]. Likewise, the combined fashion of all layers makes a fully connected artificial neural network (ANN) and the model of ANN is found in changed structures according to the problem [224]. The general model of ANN is shown in Fig. 12.
The model of ANN is bioinspired which is mathematically formalized the behavior of the biological neurons [226]. Multilayer perceptron(MPL) is used for image analysis and classification [227]. However, for analysis and efficient training, the MLP model is considered hard due to its dense structure [228].
-
Convolutional neural networks: Deep CNN is the primary model for feature extraction and classification as a supervised learning model in computer vision. Convolutional, pooling, and soft-max layers make up the majority of the layers that make up CNN, but they also serve as their fundamental building blocks. More convolutional layers give the images more detail [229]. The feature maps are down-sampled before being followed by the convolutional layer using average and maximum pooling. In addition, using the max-pooling layer, a dense CNN model is built for feature classification tasks [230]. The backpropagation and stochastic gradient descent methods are very crucial to training the CNN model [231]. Model train on the label images dataset and predict and generate the class label and compute the model Acc [232]. The results of classification are compiled using 5-fold cross-validation. In the same way, each input image is convolved at each convolution layer l with a set of n kernels and added biases each producing a new feature map the transformation process of nonlinear features is carried out at each convolution layer l (“*” denotes the convolutional operation).
1 The models of TL including LeNet, AlexNet, VGG −16, etc., extract features and classify the diseases using frames of endoscopy [233]. Benign and malignant diseases are segmented and classify by using TL techniques for feature extraction and serially fusion [234]. The deep models including ResNet, DenseNet, and GoogleNet contain a more complex network that improves the efficiency and training procedures [235]. TL is a technique where the dataset can be attached and features can also be extracted from the layers of the modified model [230].
-
Region-level CNNs: The selection of a particular region in the images for disease analysis using a bounding box is a very famous research area in the medical domain. In the same way, the prominent deep models with a little bit of improvement include region-CNN (R-CNN) [236], fast R-CNN[237], and Faster R-CNN [238] detect diseases by selecting a specific area from the image. Furthermore, a well-known selective searching method of the R-CNN model functions like a region-level recognition by generating thousands of object proposals [239]. The Swin-transformer method is employed for deep feature extraction [240]. In addition, the region is selected by the bounding box in classification problems where regression refines the bounding box [241]. Generally, the Fast R-CNN model identifies features of the proposal and extracts features for disease identification and also warps them into squares [242]. The deep learning models perform better in terms of clinical diagnosis including cancer segmentation [243]. The new proposed Region-of-Interest (RoI) pooling layer where after reshaping the proposals into fixed-size are fed into CNN which perform classification operation [244]. The region proposal network (RPN) is adopted by R-CNN where class-specified objects or nonobjects are classified by feature extraction [244]. Like RPN, the new model finds the class probability and various bounding boxes simultaneously known as a single-shot detector (SSD) [245]. Similarly, YOLO and RetinaNet show their performance with a faster prediction speed [246]. The YOLO model detects the knobbles in the lung using CT scan images [247].
Deep learning models outperform as compared to the handcrafted methods where segmentation tasks for pixel-wise recognition achieve great development. Segmentation tasks are performed pixel-wise with FCNs and U-Net where features are extracted by down and up-sampling and pixel-to-pixel spatial correspondence is achieved [248]. Low-level and high-level features are combined in U-Net to get accurate predictions. Similarly, 3-D image analysis is performed by U-Net which is based on the model of volumetric CNN [249]. The key element of pixel-wise segmentation that increases the spatial dimension is the Up-sampling in the U-Net that overcomes the gap between dense and coarse features map in disease prediction. In addition, instant detection and segmentation are performed by advanced frameworks referred to as Mask R-CNN [250]. The advancement of Faster R-CNN is R-CNN Mask that prediction disease using segmentation approaches with images of ground truth (segmentation mask) in parallel [251]. Unsupervised deep models consist of auto-encoders and a GAN.
Auto-encoders (AE): In the deep models, an AE and an encoder–decoder architecture are a part of typical unsupervised learning. The function of the encoder block is to encode the pixel intensities to the low-dimensional attributes, whereas, in the decoder block, intensities of original frames are reconstructed from the low-dimensional learned features. Similarly, AE discriminates the difference between learned features and input features to low automatically by learning discriminative image features [252]. The various composites AE blocks increased the performance of the stacked AE (SAE) while AE is limited, very complicated, and has highly nonlinear patterns by allowing for the representative power of a single-layer [253]. The complex patterns inherent in the frames and multiple levels of information are represented by the different layers of SAE where lower and higher layers of the network represent the simple patterns while inputs the SAE. Moreover, SAE-based models are generally used as an unsupervised feature encoders in the medical domain [254]. For example, in the disease classification methods, the learned feature of the CNN and SAE model is used [255]. For accurate organ segmentation, on 2-D + time, DCE-MRI is represented with spatial and sequential features [256]. Moreover, model performance boosts up by 50% by applying subsequent histogram matching and classifying tissue with SAE [257].
Generative adversarial network: In unsupervised learning, GAN is considered an optimistic model for feature extraction and classification problems [258]. GAN models are very crucial for image analysis which is composed of two neural network models such as a generator, and a discriminator model. The simulated and naturally produced frames are distinguished by the discriminator network while images are generated by the generator's subsequent learning process. GAN models are found in invariants that provide good presentation including deep convolutional GANs [259]. The training is performed simultaneously by the Star GAN model on various domains [260]. The cycle and shape consistency method’s limitations are introduced for disease segmentation which is part of the GAN model [261]. Moreover, in the MRI process, radiation planning with contextual information to synthesize CT images is performed by the GAN model [262]. GANs model is used for the analysis of intestinal mucositis which is detected in cancer patients [263]. The strategy in which knowledge is acquired in one task and used to solve related several problems just by changing input and output layers of data is referred to as TL [264]. Limited data is dealt with to transfer learning. The deep model training directly is not possible without annotated medical datasets images that are smaller than natural image datasets. The deep network demands large datasets for training and gets knowledge from natural images to solve medical imaging problems. Therefore, different diseases are classified automatically such as stage prostate cancer is classified with multiparametric MRI and TL models [265]. GAN detects the colorectal tumor automatically and further tumor buds are identified in the GI tract [266]. A comprehensive study describes the methods to diagnose colorectal cancer using deep-learning approaches including GAN for feature learning [267]. The structure of the GAN model is composed of data generator, discriminator (categorizes real and fake information), and selector switch which toggle between generated data and real data. The architecture of the GAN model is illustrated in Fig. 13.
Fig. 12.

Architecture of artificial neural network [225]
Fig. 13.

Illustration of the structure of the GAN model
The frames are given to TL models as input for obtaining features and later on, the classification of tumor is performed in the different levels [268]. The feature learning approaches are mostly targeted for disease detection and classification where deep learning models are employed that demand more images for better feature learning [269]. In short, the above discussion reveals that feature extraction approaches like the feature engineering method (handcrafted and deep learning) get valuable information from the frames of the endoscopy and help to classify the diseases of the GI tract. Feature selection is a crucial technique that minimizes the redundancy of the features and saves the computation cost of the classifiers [270–272]. In summary, handcrafted features are designed by human experts to capture specific characteristics of an image, while deep features are learned automatically by neural networks [98, 205, 273–277]. Handcrafted features include edge detectors, texture descriptors, and shape features, while deep features are typically learned through convolutional neural networks (CNNs) trained on large datasets. Handcrafted features are often simpler and faster to compute than deep features, but may not perform as well on complex tasks such as object recognition. Deep features can capture more abstract and complex characteristics of an image than handcrafted features and can adapt to different datasets and tasks. Deep features require large amounts of data and computational resources for training, while handcrafted features can be designed with much smaller datasets and computational resources. Handcrafted features are often used in conjunction with traditional machine learning algorithms, while deep features are typically used in conjunction with deep learning models. Handcrafted features are interpretable, meaning that they can be easily understood and visualized. On the other hand, deep features are often more opaque and difficult to interpret [278–280]. Deep features are shown to outperform then handcrafted features on many image-processing tasks like segmentation and classification. Handcrafted features are still widely used in applications where computational resources are limited or where interpretability is important. The choice between handcrafted features and deep features depends on the specific task, available data, and computational resources. Both types of features have their strengths and weaknesses, and the best approach will depend on the specific requirements of the application. The important feature selection methods are described in the following section. Feature learning methods for computer-aided diagnoses of abnormalities in the GI tract are presented in Table 4.
Table 4.
Summary of feature-learning methods for GI tract disease classification
| Refs | Years | Methods | Datasets | Modality | Results |
|---|---|---|---|---|---|
| [281] | 2020 | LSST feature-based multiple diseases of the GI tract are classified by SVM, RBF Kernel. |
50 videos |
WCE |
92.23% Acc |
| [282] | 2020 | The colorectal disease is classified by ANN using CNN-based features. |
4000 frames |
VE |
93.00% F1 |
| [283] | 2020 | Multiple diseases of GI tract are classified by ANN using CNN features. | 130,00 frames | VE |
92.00% Acc |
| [284] | 2018 | FCN extracts feature for ANN-based classification of various GI tract illnesses |
20,000 frames |
VE | 78.70% Acc |
| [285] | 2018 | ANN-based classification is performed using WCNN deep features. |
10,000 frames |
VE WCE |
96% Acc |
| [286] | 2018 | Bleeding is classified by SVM using YIQ features method. |
100 frames |
WCE | 98% Acc |
Features selection methods
The methods for selecting features are essential for reducing the size of large datasets and enabling the model to achieve high accuracy. In addition, they are divided into categories according to supervised and unsupervised concepts, including filter, wrapper, hybrid, and embedding approaches. Figure 14 depicts a summary of feature selection techniques.
Fig. 14.

An overview of feature selection Methods
Filter methods
Statistical measures are taken to score the correlation between input variables in the filter methods. The most relevant features are filters by applying supervised feature selection techniques. A subset of an ideal element is chosen from the given feature set of information using filter approaches rather than a learning method. Ordinarily, certain evaluation criteria are adopted to calculate the score of features. At that point, the best scores are picked from the given feature vectors. The assessment standards might be multivariable or univariable measures. Although multivariable measures think about more than two-route connections inside the list of capabilities, univariable measures assess each component autonomously. Likewise, multivariable measures can recognize excess features and consequently are treated as broader. The three methods PCA, entropy, and mRMR are described below.
Principal component analysis: In the realm of feature selection methods, some techniques utilize PCA for dimensionality reduction [287]. Using PCA, correlated variables are converted into uncorrelated ones or clusters, and the principle components connecting each cluster are then determined by computing the optimized distance between each cluster. Deep CNN features and handmade features are both analyzed by PCA. It extracts the common structure of latent contents from the dataset, which contains information on these contents. In situations where the dataset is extensive, PCA is widely recognized as a popular technique for handling multivariate scenarios [288]. In general, the dimension of feature vectors is efficiently reduced through the use of PCA. [289]. In general, PCA primarily focuses on transforming correlated variables into uncorrelated variables, often referred to as clusters. To establish the principal components that connect correlated variables into uncorrelated variables, also known as clusters, these clusters are utilized to compute the ideal distance between one another. By figuring out the appropriate separation between each cluster, principal components are drawn between them [290]. PCA calculates and gives optimized features [291]. The dataset consists of information regarding the shared structure of latent contents, which is derived through PCA [292]. PCA is commonly regarded as the favored technique in multivariate statistics when dealing with larger dataset sizes [293]. PCA recognizes the principal components that involve data variation and helps to reduce the dimensionality of the problem that gains frugality [288]. Nevertheless, despite employing patch techniques for feature extraction, the approach was unsuccessful in accurately categorizing the abnormal section of the frames [294]. Several feature extraction and selection methods are developed for finding abnormalities from endoscopic procedures [295]. The abnormalities are detected in the GI tract by using methods that start from color descriptors to hybrid features [296]. Each high-dimensional dataset contains meaningless and redundant features that may affect the performance of the algorithms, such as in classification procedures where model performance may deteriorate for accurate sample prediction. Therefore, the important and possible best features are required for the training of the classifier so that the model provides better Acc.
Minimal redundancy maximal relevance: The approach, initially developed using F statistics to measure continuous features, selects features with high correlation to the class and low correlation among themselves [297]. The mRMR method controls the redundancy of the selected features by finding mutual information between them. The scope of “minimum redundancy maximum relevance” (mRMR) is used in a variety of domains such as in the medical field used for speech recognition and cancer diagnosis. In addition, Mutual information is calculated to measure relevance and redundancy in the pattern classification systems.[298]. A method, normalized mutual information feature selection (NMIFS) is a variant of mRMR where redundancy terms are normalized by measuring the mutual information [299]. In addition, the features are selected using two methods include the Mutual Information Difference (MID) criterion and the Mutual Information Quotient (MIQ) criterion, which employs discrimination and relevance-to-redundancy ratios in the feature selection process [300]. The mRMR selector is widely recognized as the top technique for reducing dimensionality due to its exceptional accuracy. However, a significant challenge arises in cases where crucial features are both correlated and redundant. This poses an issue as the m best features may not necessarily be the optimal choice for the mRMR selector. It is a computationally expensive technique, sharply affected by the number of features. In most approaches, top-ranking features are selected based on mutual information, F test, etc., without considering relationships among features.
- Entropy: The entropy algorithm serves as an optimal feature search method, effectively addressing the issue of the initially selected population. It achieves feature reduction by prioritizing those with the highest entropy, repeatedly computing and refining until reaching the final optimal set of features. By locating the root node and evaluating all entities, entropy facilitates the process. [301]. Entropy is defined as
2
The entropy is applied to capture the best feature in GI tract disease classification problem [302]. The colonoscopy image classification research is performed using the entropy method for feature optimization [303]. Fuzzy entropy plays an important role in diagnosing polyps using colonoscopic frames [304]. Colorectal abnormalities are detected and classified by the selection of optimized features using the entropy method [305].
Wrappers methods
In the wrapper methods, the evaluation of the optimized feature vector is done from the given possible feature set. The wrapper approach improves the performance of the predefined feature learning algorithm by selecting superior feature subsets. However, compared to the filter method, this technique requires more computational resources. [306]. Search techniques are employed for getting feature subsets that reduce the computation cost of the classifiers [307]. The quality of the chosen feature subset is assessed through learning algorithms [308]. This procedure is iteratively carried out up to the given threshold [309]. The overall model performance is significantly enhanced by optimizing the feature set with highly renowned wrapper methods such as ant colony optimization (ACO), genetic algorithms (GA), particle swarm optimization (PSO), and atom search optimization (ASO). GA is also used in signature patterns feature optimization [310]. ACO and PSO are employed for stomach illness diagnosing, identification, and categorization [311]
Hybrids methods
Hybrid methods are the integration of two methods such as wrappers and filter methods. It performs well as compared to individual methods [312]. Mostly two hybridization ways are frequently employed to crossbreed wrappers and filters together for feature selection [313]. Filter methods are used to lessen the feature set while the wrapper approach is implemented on the optimized set of features for getting the final best features. The entropy coded GLEO approach is used for feature selection [314]. The use of the filter approach as a local search approach in the domain of the wrapper approach [315] performs better than the feature subset size and learning execution approach. The filter method reduces the features by selecting the most optimized feature from the feature set to decrease the computation cost of the classifiers. Features can also be selected using a score of the feature vectors.
Embedded methods
Embedded methodologies are arbitration of feature transforming hybrid methods into feature learning algorithms by using the wrappers and filter methods [316]. Generally, filters and wrapper methods are in collaboration with the learning algorithm [317]. Similarly, the learning algorithm requires both methods for achieving better performance in a few times than the wrapper methods [318]. Ultimately, the wrapper methods outperform the individual feature learning algorithms in terms of performance.
Disease classification methods
Deep convolutional neural network (DCNN) architecture detects and classifies diseases automatically [319, 320]. Moreover, CNN architecture provides optimized features that are used for GI tract disease identification and classification [71, 162]. SVM and multilayer feed-forward neural network (MFNN) classifiers influence Acc and Prec [285]. The statistical methods are used for the extraction of texture features such as a colorectal lesions detector used for polyps detection and a multilayer perceptron is exploited for classification [321]. Therefore, to classify frames containing stomach abnormalities, various classification techniques are employed, including SVM, neural networks, deep learning networks, and YOLO object detection methods [322]. The SVM technique is applied for Crohn's disease classification [323]. CADx assists in diagnosing a disease that might belong to the normal class or malignant class [324], CADx can save the precious time of the medical experts. Some CADx after identifying the abnormalities show the grade severity level of the disease [325]. CADx can distinguish between multiple types of diseases [326]. Feature fusion appraoch is used to detect and classify the GI tract disease [327]. In the process of image classification, datasets are used with their respective labels, these datasets are considered the input of the CADx which may or may not preprocess the images before being given to the system [328]. Classifiers are trained by giving them vectors of numeric values known as descriptors [329, 330]. The work is presented for obtained information about the disease whether it is a bleeding or other disease of the GI tract area between frames intervals [331, 332]. It is difficult for a gastroenterologist to estimate the disease during surgery or biopsy because of the uncontrolled procedure of endoscopy [333]. Some advanced CADx also performs the preprocessing itself and retrieves image frames as a dataset [334]. The captured frames from the GI tract can show similar pathological conditions such as bleeding and Ulcer.
The existing work on the GI tract is impressive but is not performed well with diverse image datasets and it is not better generalized over multiple image modalities with different characteristics [343]. SVM was utilized to categorize the retrieved feature sets in a recent work for the categorization of the GI tract frames. We create feature vectors using InceptionNet and VGGNet. The collected characteristics are classified using several cutting-edge classifiers. A combined feature set is used, together with a proposed Radial Basis Function (RBF) and a kernel-based SVM classifier, to accurately categorize diverse GI tract disorders. Among the 23 classes, the radial basis function showed the best results [344]. Handcrafted features are extracted by speeded-up robust features (SURF) with a multiclass support vector machine (M-SVM). In this study, a linear SVM (LSVM) was utilized to classify these features, yielding an accuracy score of 82.91% in the multiclass classification task. [345]. Categorization of SURF extracted from endoscopic images was achieved using a multiclass SVM. To classify these features, a linear SVM (LSVM) was utilized, resulting in a multiclass classification accuracy score of 82.91%. [346]. Linear discriminant analysis (LDA) technique is used with multi fold SVM to avoid false labeling that increases the training time of the classifiers [347]. Table 5 provides a comparative analysis of recently developed methods, presenting information on datasets, image modalities, and evaluation metrics such as Sen, Spe, and Acc. A feature learning approach was presented to classify the benchmark datasets Kavasir and PH2. The experiment involved utilizing a pre-trained network for extracting features, employing an existing architecture, and freezing certain layers while fine-tuning the network on medical datasets. The LSVM acts as the backbone in this pipeline for classifying the extracted features. The method demonstrates exceptional performance, achieving an accuracy of 93.38% for Kavasir and 91.67% for PH2. [348].
Table 5.
Summary of deep learning methods with image modalities, datasets, and classification results
| Refs | Years | Methods | Datasets | Image Modalities | Results |
|---|---|---|---|---|---|
| [335] | 2020 | (ResNet50, InceptionV3), (SVM,KNN,LDA) | Videos frames | VCE |
97.20% Sen, 95.63% Spe 95.94% Acc |
| [336] | 2020 | SegNet (encoder-decoder) | NBI images | Endoscopy |
98.04% Sen, 95.03% Spe |
| [337] | 2020 | Deep CNN, SVM, Fuzzy | Endoscopy frames | WCE |
82.71% Sen 87.03% Spe |
| [338] | 2019 | (DWT,PSO),(KNN,PNN,DT,SVM) | SB2,SB3 | VCE |
88.43% Sen, 84.60% Spe, 86.45% Acc |
| [87] | 2018 | R-CNN | Videos frames | VCE |
97.30% Sen, 98.00% Spe |
| [339] | 2018 | GAN | CVC | WVE |
74.00% Sen, 94.00% Spe, 91.00%Acc |
| [340] | 2018 | Transfer Learning | Kvasir | WVE | 83.00% Acc |
| [341] | 2018 | GANs | GIANA | VCE |
88.00%Sen, 99.90% Spe, 99.00% Acc |
| [342] | 2017 | CNN | Kvasir | WVE |
75.00% Sen 75.00% Spe |
The examination of the existing literature indicates that each stage holds significance in the segmentation and classification of GI tract diseases. In addition, deep learning necessitates numerous and extensive annotated datasets, which pose challenges in terms of feasibility and limited accessibility for use as benchmarks in deep learning approach [349]. In the upcoming section of this work, you will find comprehensive information about several difficult datasets that are utilized in the study.
Datasets
Researchers often rely on a wide range of open-source image datasets to validate their proposed methods. five datasets, Kvasir [112], Ulcer [350], Nerthus [351], Kvasir-SEG [255], and CVC-ColonDB [352] are considered in this study. The three datasets Kvasir, Ulcer, and Nerthus are used for disease classification while Kvasir-SEG and CVC-Colon DB are employed for the disease segmentation approach.
Kvasir dataset: Kvasir is an open-source image dataset that has been verified and annotated by gastroenterologists and endoscopists, two skilled medical professionals. The 4000 photos in the Kvasir dataset are divided into 8 classes. The numerous anatomical landmarks, clinical findings, or endoscopic techniques are represented by these classifications. A total of 500 photos representing various diseases are included in each class [112]. The dataset is divided into three separate sections with different compositions. Anatomical landmarks including the Z-line, pylorus, and cecum are included in the first section. Endoscopic procedures and pathological findings, including polyps, esophagitis, and ulcerative colitis, are the main topics of the second section. The third and last part of the dataset,"dyed resection margins"and"dyed and lifted polyp,"deals with the removal of polyps. The Kvasir dataset's single frame from each class is represented visually in Fig. 15.
Ulcer dataset: The Ulcer dataset was created at POF Hospital Pakistan and is still kept confidential. It has 2413 total photos divided into three groups: ulcer, healthy, and bleeding. There are 1086 photographs in the class for bleeding, 709 images in the class for healthy individuals, and 618 images in each class for ulcers. The resolution of each image in the collection is 381 x 321, and these measurements hold for all three classes. The WCE technique was used to create the dataset. Figure 16 shows visual representations of sample frames from each of the three classes in the Ulcer dataset [350].
-
Nerthus dataset: A colonoscopy, a medical procedure that includes looking inside the body with an endoscope, produced the images in the Nerthus dataset. The dataset, which includes various bowel cleansing intensities, is open-source. This dataset is made up of 5525 frames that were taken from 21 videos and divided into four different classes [48]. Figure 17 displays the sample frames from the Nerthus dataset. The summary of the datasets is depicted in Table 6.
A summary of the three challenging datasets reveals that these datasets are obtained using WCE and WVE and the frames of the datasets are classified in terms of diseases.
-
Kvasir-SEG dataset: It is difficult to do pixel-wise segmentation of images while working with medical imaging datasets. The freely available Kvasir-SEG dataset offers segmentation masks that correlate to annotated medical images. The expert gastroenterologists that validated this dataset with colonoscopy were meticulous in their curation and selection. It contains 1000 photos of polyps and is a useful tool for assessing the Graft-U-Net's efficiency [255]. Figure 18 illustrates a range of frame resolutions, spanning from 332 x 487 to 1920 x 1072 pixels, in the original and ground truth sample frames of the Kvasir-SEG Dataset.
The dataset was edited by an accomplished endoscopist from Oslo University Hospital in Norway. Additionally, a cutting-edge open-access database called CVC-ClinicDB was used, which contains 612 images taken from 31 colonoscopy sequences at a resolution of 384288 [354].
CVC-Clinic DB dataset: An open-access CVC-Clinic DB dataset composed of 612 images having a dimension size of 384 × 288 pixels. The dataset is collected by colonoscopy procedure [354]. Figure 19 illustrates the original image samples along with their respective ground truth. CVC-ClinicDB consists of actual frames of endoscopy and ground truth masks which represents the polyp area in the original frames.
Fig. 15.

Kvasir dataset class-wise sample frames
Fig. 16.

Sample frames of the Ulcer dataset contain three classes a bleeding b healthy c Ulcer
Fig. 17.

Class-wise sample frames from the Nerthus dataset a class 0 b class 1 c class 2 d class 3
Table 6.
Summary of Kvasir, ulcer, and nerthus datasets
Fig. 18.

Sample frames of “Kvasir-SEG dataset” a Original images b segmented mask
Fig. 19.

Sample frames of “CVC-ClinicDB” dataset a original frames b ground truth frames
Performance measures
The important performance measures protocols are specified that determine the model performance. The term true positive (Tpos) presents that model’s prediction is correct over the positive class. The first term “true” shows model decision and the second word “negative/positive” is the type of class. Similarly, true negative (Tneg) informs about correct prediction over negative class samples. The erroneously identified positive samples are false positives (Fpos). The negative class is predicted wrong showing the term (Fneg). The mathematical presentation of each evaluation metric is shown in Table 7. The evaluation metric “Rec”, which stands for sensitivity is the proportion of correctly predicted positive samples out of all the positive samples that exist. The “Prec” technique referred to as positive predictive value provides the information of correctly identified positive samples among the total samples identified as positive. Conversely, the performance measure “Spec” is also called negative rate and informs about correctly identified negative values among all samples of actual negative class. “Acc” is the model’s correct prediction among all samples of positive and negative classes. The AUC value is also used to accurately differentiate between all dataset classifications. The accuracy of segmentation findings is frequently assessed using the evaluation metrics mean intersection over union (mIoU) and dice coefficient in image segmentation algorithms.
Table 7.
Performance measures of the CADx
| Performance measures | Mathematical representation | Performance measures | Mathematical representation |
|---|---|---|---|
| Sen/Rec/hit rate/TPR | Spec/Selectivity/TNR | ||
| Prec | G.M | ||
| F1.S | F2.S | ||
| Acc | AUC | ||
| mDice | mIoU |
The overlap between the predicted segmentation mask and the actual segmentation mask is evaluated using both measures. The harmonic mean of recall and precision is the F1 score. The recall is the percentage of properly predicted positive pixels out of all genuine positive pixels, whereas precision measures the percentage of correctly predicted positive pixels out of all correctly predicted positive pixels. Another metric developed from precision and recall, with a stronger emphasis on recall, is the F2 score. In situations where recall is important, it prioritizes recall, making it more sensitive to properly anticipating positive pixels. A statistic for assessing the effectiveness of binary classification tasks is the geometric mean. By presenting the segmentation problem as a binary classification problem, where each pixel is classified as either foreground or background, it can be used to segment images.
Comparisons with existing surveys
The literature addresses various methods for identifying diseases in the GI tract. The CADx is designed for segmentation of diseases and multiclass classification tasks. The proposed study presents different stages of CADx that are compared to existing literature. In addition, advanced endoscopy techniques are employed to obtain high-definition frames. However, each survey typically focuses on only one stage of the CADx for detecting abnormalities in the GI tract. As a result, this comprehensive survey aims to address this gap by thoroughly examining and incorporating all stages of the CADx system. Table 8 compares the operation of the proposed study stages with the existing literature. The short notation used in Table 8 is expressed as data sets (D), accuracy (A), classification (C), feature extraction methods (F), segmentation (S), and imaging technologies (I).
Table 8.
Comparing endoscopy and computer-aided diagnosis (CADx) with previous surveys and review articles, the surveys either discussed these aspects (✓) or did not include them (×)
| Refs/Years | Description | I | S | F | C | A | D |
|---|---|---|---|---|---|---|---|
| Perperidis et al (2020) [355] | Provides a comprehensive overview of images'colors, noise, and modalities of GI tract screening, position, FOV, and accuracy. | ✓ | × | × | × | × | × |
| Kim et al (2021)[356] | The summary of early gastric cancer screening with the notion is described including modalities advancement that is used for visualizing the micro-vascular structures. | ✓ | × | × | × | × | × |
| Weigt, J., et al (2021) [357] | The effecting parameters of the modalities such as problems in training, cost, and lesion detection accuracy are addressed with the current improvements in modalities that provide future directions about diseases. | ✓ | × | × | × | × | × |
| Kolb et al (2021) [358] | Elaborate and point out the suitable imaging technology for diagnosing GI tract diseases. | ✓ | × | × | × | × | × |
| Caroppo et al (2021) [359] | Explores the segmentation, feature extraction, and selection methods related to CADx which are not addressed explicitly in earlier literature. | ✓ | × | ✓ | ✓ | ✓ | ✓ |
| Adewole, S., et al (2021) [360] | A detailed overview of visual and nonvisual WCE is given where the occurrence of events in WCE, and different GI-tract scenarios with quantitative measures are described. | × | × | × | × | ✓ | × |
| Muhammad, K., et al (2020) [361] | The pros and con of the WCE over other endoscopy methods used in CADx is addressed. | × | ✓ | × | ✓ | × | × |
| Soffer, S., et al (2020) [52] | Summarizes the imaging modalities used in GI tract screening such as ways to diagnose celiac disease by using techniques of computer vision. | ✓ | × | × | ✓ | ✓ | × |
| Xia, J., et al (2020) [362] | A detailed survey on segmentation, and classification techniques, with identification of major challenges in WCE. | × | ✓ | × | ✓ | × | × |
| Ali, H., et al (2019) [295] | A detailed overview including segmentation, feature selection, and classification methods in the CADx system is briefly described. | × | ✓ | ✓ | ✓ | × | × |
| Rahim et al (2020) [363] | The methods and results comparison with statistical measures of CADx systems are described explicitly. | × | × | ✓ | ✓ | × | × |
| Proposed work | The detail of CADx system methods used for detecting and classifying the diseases in the GI tract is addressed as image acquisition techniques and their challenges. | ✓ | ✓ | ✓ | ✓ | ✓ | ✓ |
Challenges and findings
The acquisition of frames or videos is done using endoscopy and colonoscopies which are manufactured in varying technologies that causes variations in resolution and quality of frames. The following are some challenges related to the GI tract area.
-
i.
Frames of endoscopy consist of poor contrast and insufficient color space. Colors in the images are not uniformly distributed which increases the error rate [364].
-
ii.
The abnormal area in the GI tract cannot be detected due to the varying geometrical shapes, colors, and sizes of the disease [365, 366].
-
iii.
The quality of image visualization is affected by the illumination, scale, rotation invariance, instrument inclusion, poor cleansing, and presence of air bubbles which can also affect disease identification and classification [221].
-
iv.
Due to major practical obstacles, the deployment of real-time CADx systems for the identification of GI tract diseases in clinical locations continues to be a challenging and difficult scientific endeavor. The gathering and professional annotation of extensive, varied datasets that thoroughly cover every kind of GI tract disease is the most significant obstacle among these. The diagnostic breadth of current CADx systems is limited because to their training on a small number of disease classes (generally 5–8), and their performance deteriorates when they try to expand to other classes. This constraint is mostly caused by the rarity of some GI illnesses, data imbalance, and annotation expenses, all of which make the development of comprehensive datasets exceedingly resource-intensive [368].
-
v.
The lack of public, multiinstitutional, high-resolution, multiclass datasets, along with hardware, regulatory, and clinical integration challenges, further hinders the translation of these systems into real-time hospital use. Future research must concentrate on developing semi-supervised and few-shot learning techniques, creating synthetic data, and promoting international collaborations for data sharing. Moreover, increasing the number of classes frequently decreases classification accuracy because deep learning models have trouble generalizing across underrepresented and visually similar conditions [369].
Conclusion
Automatic disease detection supports medical experts in diagnosing diseases and employing them in the medical domain such as clinical application and scientific research. The advancement in deep learning enables the detection of textural and morphological patterns particularly using medical imaging data. Furthermore, methods including handcrafted and deep learning are considered SOTA methods such as region-level disease detection, image-level classification, and pixel-wise disease segmentation. Deep learning models are designed to possess significant power and efficiency when it comes to automatically detecting and classifying diseases. Deep learning faces some challenges such as limitation and inequality in data, deprived evaluation metrics, domain knowledge and interpretability of the model, and video-based real-time diagnostic still have to be addressed. Therefore, three approaches are discussed in this article such as features extraction in spatial and frequency domains, features learning and selection approaches, and disease classification. In the same way, the combination of deep models performs better for challenging problems in medical and engineering.
The increasing demand for machine learning and the ongoing evolution of image capture techniques have spurred a growing area of investigation dedicated to employing machine learning in the automatic detection, analysis, and categorization of diseases within endoscopy images. Nevertheless, a generalized model for high accuracy and precision is required because existing approaches show poor results for cross-dataset evaluation.
Future directions
In the future, advancements in GI tract disease detection and classification are expected to involve several key areas. Firstly, molecular diagnostics will play a significant role by analyzing genetic profiles and identifying specific biomarkers associated with different diseases. This will enable early detection, personalized treatment plans, and improved classification. Secondly, noninvasive diagnostic tools, such as advanced high resolution imaging techniques and capsule endoscopy, will be developed to provide more comfortable and accurate diagnoses without invasive procedures. Artificial intelligence and machine learning algorithms will also revolutionize disease detection and classification in the GI tract. These technologies will analyze large datasets to identify patterns, predict outcomes, and improve diagnostic accuracy. In addition, the analysis of the gut microbiome and integration of multiomics data (genomics, proteomics, metabolomics, and transcriptomic) will provide a comprehensive understanding of GI tract diseases, potentially leading to improved classification and personalized treatment strategies. Overall, these future directions hold great promise but require ongoing research and validation before widespread implementation.
Quantum computing holds tremendous potential for transforming GI tract disease detection and classification. With their unparalleled data processing capabilities, quantum computers can efficiently analyze vast datasets, including genomic information, medical records, and imaging data, leading to more accurate disease identification and classification. Quantum machine learning algorithms, leveraging quantum properties like superposition and entanglement, can optimize the analysis of complex data, enabling a better understanding of disease factors and enhancing predictive models for personalized treatment strategies. Moreover, quantum simulations offer improved molecular modeling, facilitating faster drug discovery and development for GI tract diseases by predicting therapeutic efficacy and potential side effects. In addition, quantum computing can optimize treatment plans by efficiently considering multiple variables, resulting in personalized strategies that maximize treatment effectiveness and minimize adverse effects. Although still an evolving field, further research and development in quantum computing hardware and algorithms are crucial to fully harnessing its power in revolutionizing GI tract disease detection and classification.
Author contribution
All authors contributed equally in this work. thank you
Funding
This work was supported by the National Research Foundation of Korea (NRF) grant funded by the Korea government(MSIT) (No. RS-2023-00218176) and the Soonchunhyang University Research Fund.
Available of data and materials
No datasets were generated or analysed during the current study.
Declarations
Ethical approval
Not applicable.
Conflict of interest
The authors declare no competing interests.
Footnotes
Publisher's Note
Springer Nature remains neutral with regard to jurisdictional claims in published maps and institutional affiliations.
Contributor Information
Muhammad Ramzan, Email: ramzan097@gmail.com.
Muhammad Attique Khan, Email: attique.khan@ieee.org.
Yunyoung Nam, Email: ynam.cse@gmail.com.
References
- 1.Shafiq U, Hamza A, Mirza AM, Baili J, AlHammadi DA, et al. A novel network-level fused deep learning architecture with shallow neural network classifier for gastrointestinal cancer classification from wireless capsule endoscopy images. BMC Med Inform Decis Making. 2025;25:150. [DOI] [PMC free article] [PubMed] [Google Scholar]
- 2.Wong MC, Huang J, Chan PS, Choi P, Lao XQ, Chan SM, et al. Global incidence and mortality of gastric cancer, 1980–2018. JAMA Network Open. 2021;4:e2118457–e2118457. [DOI] [PMC free article] [PubMed] [Google Scholar]
- 3.F. Sedighipour Chafjiri, "Anatomical Classification of the Gastrointestinal tract Using Ensemble Transfer Learning," University of Saskatchewan, 2023.
- 4.Rawla P, Barsouk A. Epidemiology of gastric cancer: global trends, risk factors and prevention. Przeglad Gastroenterol. 2019;14:26. [DOI] [PMC free article] [PubMed] [Google Scholar]
- 5.Melson JE, Imperiale TF, Itzkowitz SH, Llor X, Kochman ML, Grady WM, et al. AGA White Paper: Roadmap for the Future of Colorectal Cancer Screening in the United States. Clin Gastroenterol Hepatol. 2020;18:2667–78. [DOI] [PubMed] [Google Scholar]
- 6.Rao M, Zhu Y, Qi L, Hu F, Gao P. Circular RNA profiling in plasma exosomes from patients with gastric cancer. Oncol Lett. 2020;20:2199–208. [DOI] [PMC free article] [PubMed] [Google Scholar]
- 7.Lian D, Amin B, Du D, Yan W. Enhanced expression of the long non-coding RNA SNHG16 contributes to gastric cancer progression and metastasis. Cancer Biomarkers. 2018;21:151–60. [DOI] [PubMed] [Google Scholar]
- 8.Sitarz R, Skierucha M, Mielko J, Offerhaus GJA, Maciejewski R, Polkowski WP. Gastric cancer: epidemiology, prevention, classification, and treatment. Cancer Manag Res. 2018;10:239. [DOI] [PMC free article] [PubMed] [Google Scholar]
- 9.E. Tuba, S. Tomic, M. Beko, D. Zivkovic, and M. Tuba, "Bleeding Detection in Wireless Capsule Endoscopy Images Using Texture and Color Features," in 2018 26th Telecommunications Forum (TELFOR), 2018, pp. 1-4.
- 10.X. Xing, X. Jia, and M.-H. Meng, "Bleeding Detection in Wireless Capsule Endoscopy Image Video Using Superpixel-Color Histogram and a Subspace KNN Classifier," in 2018 40th Annual International Conference of the IEEE Engineering in Medicine and Biology Society (EMBC), 2018, pp. 1-4. [DOI] [PubMed]
- 11.Akarsu M, Akarsu C. Evaluation of new technologies in gastrointestinal endoscopy. JSLS J Soc Laparoend Surg. 2018;22:1. [DOI] [PMC free article] [PubMed] [Google Scholar]
- 12.Gora MJ, Quénéhervé L, Carruth RW, Lu W, Rosenberg M, Sauk JS, et al. Tethered capsule endomicroscopy for microscopic imaging of the esophagus, stomach, and duodenum without sedation in humans (with video). Gastroint Endoscopy. 2018;88:830–40. [DOI] [PMC free article] [PubMed] [Google Scholar]
- 13.Singh P, Arora A, Strand TA, Leffler DA, Catassi C, Green PH, et al. Global prevalence of celiac disease: systematic review and meta-analysis. Clin Gastroenterol Hepatol. 2018;16:823–36. [DOI] [PubMed] [Google Scholar]
- 14.A. Perperidis, K. Dhaliwal, S. McLaughlin, and T. Vercauteren, "Image computing for fibre-bundle endomicroscopy: A review," arXiv preprint arXiv:1809.00604, 2018. [DOI] [PMC free article] [PubMed]
- 15.Souaidi M, Abdelouahed AA, El Ansari M. Multi-scale completed local binary patterns for ulcer detection in wireless capsule endoscopy images. Multimedia Tools Appl. 2019;78:13091–108. [Google Scholar]
- 16.Scally B, Emberson JR, Spata E, Reith C, Davies K, Halls H, et al. Effects of gastroprotectant drugs for the prevention and treatment of peptic ulcer disease and its complications: a meta-analysis of randomised trials. Lancet Gastroenterol Hepatol. 2018;3:231–41. [DOI] [PMC free article] [PubMed] [Google Scholar]
- 17.Jambi HA, Khattab HAE-RH. Potential antioxidant, anti-inflammatory and gastroprotective effect of grape seed extract in indomethacin-induced gastric ulcer in rats. Int J Pharmacol. 2019;15:209–18. [Google Scholar]
- 18.Gemilyan M, Hakobyan G, Benejat L, Allushi B, Melik-Nubaryan D, Mangoyan H, et al. Prevalence of Helicobacter pylori infection and antibiotic resistance profile in Armenia. Gut Pathogens. 2019;11:28. [DOI] [PMC free article] [PubMed] [Google Scholar]
- 19.Collij V, Imhann F, Vila AV, Fu J, Dijkstra G, Festen EA, et al. SLC39A8 missense variant is associated with Crohn’s disease but does not have a major impact on gut microbiome composition in healthy subjects. PloS One. 2019;14:e0211328. [DOI] [PMC free article] [PubMed] [Google Scholar]
- 20.Rimola J, Alfaro I, Fernández-Clotet A, Castro-Poceiro J, Vas D, Rodríguez S, et al. Persistent damage on magnetic resonance enterography in patients with Crohn’s disease in endoscopic remission. Aliment Pharmacol Therapeut. 2018;48:1232–41. [DOI] [PubMed] [Google Scholar]
- 21.Martincorena I, Fowler JC, Wabik A, Lawson AR, Abascal F, Hall MW, et al. Somatic mutant clones colonize the human esophagus with age. Science. 2018;362:911–7. [DOI] [PMC free article] [PubMed] [Google Scholar]
- 22.G. search, "List of all GI tract endoscopy images " 2020.
- 23.Gupta S, Li D, El Serag HB, Davitkov P, Altayar O, Sultan S, et al. AGA clinical practice guidelines on management of gastric intestinal metaplasia. Gastroenterology. 2020;158:693–702. [DOI] [PMC free article] [PubMed] [Google Scholar]
- 24.A. M. Boyce, P. Florenzano, L. F. de Castro, and M. T. Collins, "Fibrous dysplasia/mccune-albright syndrome," in GeneReviews®[Internet], ed: University of Washington, Seattle, 2019. [PubMed]
- 25.Sen S, Jain S, Venkataramani S, Raghunathan A. SparCE: Sparsity Aware General-Purpose Core Extensions to Accelerate Deep Neural Networks. IEEE Trans Comp. 2018;68:912–25. [Google Scholar]
- 26.Rioux JE, Devlin MC, Gelfand MM, Steinberg WM, Hepburn DS. 17β-estradiol vaginal tablet versus conjugated equine estrogen vaginal cream to relieve menopausal atrophic vaginitis. Menopause. 2018;25:1208–13. [DOI] [PubMed] [Google Scholar]
- 27.Kadry S, Alhaisoni M, Nam Y, Zhang Y, Rajinikanth V, et al. Computer-aided gastrointestinal diseases analysis from wireless capsule endoscopy: A framework of best features selection. IEEE Access. 2020;8:132850–9. [Google Scholar]
- 28.K. Pogorelov, "DeepEIR: A Holistic Medical Multimedia System for Gastrointestinal Tract Disease Detection and Localization," 2019.
- 29.M. Ramzan, M. Raza, M. Sharif, and Y. Nam, "Gastrointestinal tract infections classification using deep learning," 2021.
- 30.Rondonotti E, Spada C, Adler S, May A, Despott EJ, Koulaouzidis A, et al. Small-bowel capsule endoscopy and device-assisted enteroscopy for diagnosis and treatment of small-bowel disorders: European Society of Gastrointestinal Endoscopy (ESGE) technical review. Endoscopy. 2018;50:423–46. [DOI] [PubMed] [Google Scholar]
- 31.J. Friedlander, J. Prager, E. Deboer, and R. Deterding, "Multi-use scope," ed: Google Patents, 2018.
- 32.O. Azeroual, G. Saake, and M. Abuosba, "Data quality measures and data cleansing for research information systems," arXiv preprint arXiv:1901.06208, 2019.
- 33.B. M. C. Staff, "Biopsy: Types of biopsy procedures used to diagnose cancer," 2020.
- 34.Sivakumar P, Kumar BM. A novel method to detect bleeding frame and region in wireless capsule endoscopy video. Cluster Comp. 2018;1:1–7. [Google Scholar]
- 35.Ozawa T, Ishihara S, Fujishiro M, Saito H, Kumagai Y, Shichijo S, et al. Novel computer-assisted diagnosis system for endoscopic disease activity in patients with ulcerative colitis. Gastroint Endoscopy. 2019;89:416–21. [DOI] [PubMed] [Google Scholar]
- 36.Barakat MT, Girotra M, Huang RJ, Banerjee S. Scoping the scope: endoscopic evaluation of endoscope working channels with a new high-resolution inspection endoscope (with video). Gastroint Endoscopy. 2018;88:601–11. [DOI] [PMC free article] [PubMed] [Google Scholar]
- 37.Nguyen TH, Ahsen OO, Liang K, Zhang J, Mashimo H, Fujimoto JG. Correction of circumferential and longitudinal motion distortion in high-speed catheter/endoscope-based optical coherence tomography. Biomed Opt Exp. 2021;12:226–46. [DOI] [PMC free article] [PubMed] [Google Scholar]
- 38.Di Maio P, Iocca O, De Virgilio A, Giudice M, Pellini R, D’Ascanio L, et al. Narrow band imaging in head and neck unknown primary carcinoma: A systematic review and meta-analysis. Laryngos. 2020;130:1692–700. [DOI] [PubMed] [Google Scholar]
- 39.Carballal S, Maisterra S, López-Serrano A, Gimeno-García AZ, Vera MI, Marín-Garbriel JC, et al. Real-life chromoendoscopy for neoplasia detection and characterisation in long-standing IBD. Gut. 2018;67:70–8. [DOI] [PubMed] [Google Scholar]
- 40.Feuerstein JD, Rakowsky S, Sattler L, Yadav A, Foromera J, Grossberg L, et al. Meta-analysis of dye-based chromoendoscopy compared with standard-and high-definition white-light endoscopy in patients with inflammatory bowel disease at increased risk of colon cancer. Gastroint Endoscopy. 2019;90:186–95. [DOI] [PubMed] [Google Scholar]
- 41.Iacucci M, Kaplan GG, Panaccione R, Akinola O, Lethebe BC, Lowerison M, et al. A randomized trial comparing high definition colonoscopy alone with high definition dye spraying and electronic virtual chromoendoscopy for detection of colonic neoplastic lesions during IBD surveillance colonoscopy. Am J Gastroenterol. 2018;113:225. [DOI] [PubMed] [Google Scholar]
- 42.Vleugels JL, Rutter MD, Ragunath K, Rees CJ, Ponsioen CY, Lahiff C, et al. Diagnostic Accuracy of Endoscopic Trimodal Imaging and Chromoendoscopy for Lesion Characterization in Ulcerative Colitis. J Crohn’s Colitis. 2018;12:1438–47. [DOI] [PubMed] [Google Scholar]
- 43.Tsuji S, Takeda Y, Tsuji K, Yoshida N, Takemura K, Yamada S, et al. Clinical outcomes of the “resect and discard” strategy using magnifying narrow-band imaging for small (< 10 mm) colorectal polyps. Endoscopy Int Open. 2018;6:E1382–9. [DOI] [PMC free article] [PubMed] [Google Scholar]
- 44.Tabatabaei N, Kang D, Kim M, Wu T, Grant CN, Rosenberg M, et al. Clinical translation of tethered confocal microscopy capsule for unsedated diagnosis of eosinophilic esophagitis. Sci Reports. 2018;8:2631. [DOI] [PMC free article] [PubMed] [Google Scholar]
- 45.G. search, "All endoscopy Appratus," 2020.
- 46.Pogorelov K, Suman S, Azmadi Hussin F, Saeed Malik A, Ostroukhova O, Riegler M, et al. Bleeding detection in wireless capsule endoscopy videos—Color versus texture features. J Appl Clin Med Phys. 2019;20:141–54. [DOI] [PMC free article] [PubMed] [Google Scholar]
- 47.Figueiredo IN, Leal C, Pinto L, Figueiredo PN, Tsai R. Hybrid multiscale affine and elastic image registration approach towards wireless capsule endoscope localization. Biomed Signal Proc Control. 2018;39:486–502. [Google Scholar]
- 48.H. Gammulle, S. Denman, S. Sridharan, and C. Fookes, "Two-Stream Deep Feature Modelling for Automated Video Endoscopy Data Analysis," in International Conference on Medical Image Computing and Computer-Assisted Intervention, 2020, pp. 742-751.
- 49.V. Thambawita, D. Jha, H. L. Hammer, H. D. Johansen, D. Johansen, P. Halvorsen, et al., "An Extensive Study on Cross-Dataset Bias and Evaluation Metrics Interpretation for Machine Learning applied to Gastrointestinal Tract Abnormality Classification," arXiv preprint arXiv:2005.03912, 2020.
- 50.Li T, Long L. Imaging Examination and Quantitative Detection and Analysis of Gastrointestinal Diseases Based on Data Mining Technology. J Med Syst. 2020;44:31. [DOI] [PubMed] [Google Scholar]
- 51.Khan MA, Khan MA, Ahmed F, Mittal M, Goyal LM, Hemanth DJ, et al. Gastrointestinal diseases segmentation and classification based on duo-deep architectures. Pattern Recogn Lett. 2020;131:193–204. [Google Scholar]
- 52.Soffer S, Klang E, Shimon O, Nachmias N, Eliakim R, Ben-Horin S, et al. Deep learning for wireless capsule endoscopy: a systematic review and meta-analysis. Gastroint Endoscopy. 2020;92:831. [DOI] [PubMed] [Google Scholar]
- 53.Struyvenberg MR, De Groof AJ, van der Putten J, van der Sommen F, Baldaque-Silva F, Omae M, et al. A computer-assisted algorithm for narrow-band imaging-based tissue characterization in Barrett’s esophagus. Gastroint Endoscopy. 2021;93:89–98. [DOI] [PubMed] [Google Scholar]
- 54.M. Rashad, S. Nooh, I. Afifi, and M. Abdelfatah, "Effective of modern techniques on content-based medical image retrieval: a survey," ed, 2022.
- 55.Obukhova NA, Motyko AA, Pozdeev AA. Two-Stage Method for Polyps Segmentation in Endoscopic Images. In: Computer Vision in Control Systems. 6th ed. Berlin: Springer; 2020. p. 93–106. [Google Scholar]
- 56.Shen B. Inflammatory bowel disease–associated bleeding. In: Atlas of Endoscopy Imaging in Inflammatory Bowel Disease. US: Elsevier; 2020. p. 551–9. [Google Scholar]
- 57.Kuang Y, Lan T, Peng X, Selasi GE, Liu Q, Zhang J. Unsupervised multi-discriminator generative adversarial network for lung nodule malignancy classification. IEEE Access. 2020;8:77725–34. [Google Scholar]
- 58.Majid A, Yasmin M, Rehman A, Yousafzai A, Tariq U. Classification of stomach infections: A paradigm of convolutional neural network along with classical features fusion and selection. Microscopy Res Tech. 2020;83:562–76. [DOI] [PubMed] [Google Scholar]
- 59.Jain S, Seal A, Ojha A, Krejcar O, Bureš J, Tachecí I, et al. Detection of abnormality in wireless capsule endoscopy images using fractal features. Comp Biol Med. 2020;127:104094. [DOI] [PubMed] [Google Scholar]
- 60.Nguyen N-Q, Vo DM, Lee S-W. Contour-Aware Polyp Segmentation in Colonoscopy Images Using Detailed Upsamling Encoder-Decoder Networks. IEEE Access. 2020;8:99495–508. [Google Scholar]
- 61.Gruosso M, Capece N, Erra U. Human segmentation in surveillance video with deep learning. Multimedia Tools Appl. 2020;80:1–25. [Google Scholar]
- 62.Ali H, Sharif M, Yasmin M, Rehmani MH, Riaz F. A survey of feature extraction and fusion of deep learning for detection of abnormalities in video endoscopy of gastrointestinal-tract. Artif Intell Rev. 2020;53:2635–707. [Google Scholar]
- 63.Ono S, Kawada K, Dohi O, Kitamura S, Koike T, Hori S, et al. Linked Color Imaging Focused on Neoplasm Detection in the Upper Gastrointestinal Tract: A Randomized Trial. Ann Internal Med. 2021;174:18–24. [DOI] [PubMed] [Google Scholar]
- 64.P. Sharma, P. Hans, and S. C. Gupta, "Classification Of Plant Leaf Diseases Using Machine Learning And Image Preprocessing Techniques," in 2020 10th International Conference on Cloud Computing, Data Science & Engineering (Confluence), 2020, pp. 480-484.
- 65.Münzer B, Schoeffmann K, Böszörmenyi L. Content-based processing and analysis of endoscopic images and videos: A survey. Multimedia Tools Appl. 2018;77:1323–62. [Google Scholar]
- 66.Muslim HSM, Khan SA, Hussain S, Jamal A, Qasim HSA. A knowledge-based image enhancement and denoising approach. Comput Math Organ Theory. 2019;25:108–21. [Google Scholar]
- 67.Khan MW, Sharif M, Yasmin M, Fernandes SL. A new approach of cup to disk ratio based glaucoma detection using fundus images. J Integr Des Proc Sci. 2016;20:77–94. [Google Scholar]
- 68.P. Eze, P. Udaya, R. Evans, and D. Liu, "Comparing Yiq and Ycbcr Colour Image Transforms for Semi-Fragile Medical Image Steganography," 2019.
- 69.Sarwinda D, Paradisa RH, Bustamam A, Anggia P. Deep learning in image classification using residual network (ResNet) variants for detection of colorectal cancer. Proc Comp Sci. 2021;179:423–31. [Google Scholar]
- 70.Sundara Vadivel P, Yuvaraj D, Navaneetha Krishnan S, Mathusudhanan S. An efficient CBIR system based on color histogram, edge, and texture features. Concurr Comp: Pract Exp. 2019;31:e4994. [Google Scholar]
- 71.Rashid M, Yasmin M, Afza F, Tanik UJ. Deep CNN and geometric features-based gastrointestinal tract diseases detection and classification from wireless capsule endoscopy images. J Exp Theor Artif Intell. 2019;1:1–23. [Google Scholar]
- 72.Khojasteh P, Aliahmad B, Kumar DK. A novel color space of fundus images for automatic exudates detection. Biomed Signal Proc Control. 2019;49:240–9. [Google Scholar]
- 73.Gao Xue-Feng, Zhang Can-Gui, Huang Kun, Zhao Xiao-Lin, Liu Ying-Qiao, Wang Zi-Kai, Ren Rong-Rong, Mai Geng-Hui, Yang Ke-Ren, Chen Ye. An oral microbiota-based deep neural network model for risk stratification and prognosis prediction in gastric cancer. J Oral Microbiol. 2025;17(1):2451921. [DOI] [PMC free article] [PubMed] [Google Scholar]
- 74.Smith D, Kapoor Y, Hermans A, Nofsinger R, Kesisoglou F, Gustafson TP, et al. 3D printed capsules for quantitative regional absorption studies in the GI tract. Int J Pharm. 2018;550:418–28. [DOI] [PubMed] [Google Scholar]
- 75.Ortega S, Fabelo H, Iakovidis DK, Koulaouzidis A, Callico GM. Use of hyperspectral/multispectral imaging in gastroenterology. Shedding some–different–light into the dark. J Clin Med. 2019;8:36. [DOI] [PMC free article] [PubMed] [Google Scholar]
- 76.Ashraf R, Ahmed M, Jabbar S, Khalid S, Ahmad A, Din S, et al. Content based image retrieval by using color descriptor and discrete wavelet transform. J Med Syst. 2018;42:44. [DOI] [PubMed] [Google Scholar]
- 77.S. Ali, F. Zhou, C. Daul, B. Braden, A. Bailey, S. Realdon, et al., "Endoscopy artifact detection (EAD 2019) challenge dataset," arXiv preprint arXiv:1905.03209, 2019.
- 78.Liu X, Sinha A, Ishii M, Hager GD, Reiter A, Taylor RH, et al. Dense depth estimation in monocular endoscopy with self-supervised learning methods. IEEE Trans Med Imag. 2019;39:1438–47. [DOI] [PMC free article] [PubMed] [Google Scholar]
- 79.Sasmal P, Bhuyan MK, Dutta S, Iwahori Y. An unsupervised approach of colonic polyp segmentation using adaptive markov random fields. Pattern Recogn Lett. 2022;154:7–15. [Google Scholar]
- 80.Ameling S, Wirth S, Paulus D, Lacey G, Vilarino F. Texture-based polyp detection in colonoscopy. In: Bildverarbeitung für die Medizin 2009. US: Springer; 2009. p. 346–50. [Google Scholar]
- 81.Bernal J, Tajkbaksh N, Sánchez FJ, Matuszewski BJ, Chen H, Yu L, et al. Comparative validation of polyp detection methods in video colonoscopy: results from the MICCAI 2015 endoscopic vision challenge. IEEE Trans Med Imag. 2017;36:1231–49. [DOI] [PubMed] [Google Scholar]
- 82.Wang Y, Tavanapong W, Wong J, Oh JH, De Groen PC. Polyp-alert: Near real-time feedback during colonoscopy. Comp Methods Programs Biomed. 2015;120:164–79. [DOI] [PubMed] [Google Scholar]
- 83.Shin Y, Qadir HA, Aabakken L, Bergsland J, Balasingham I. Automatic colon polyp detection using region based deep cnn and post learning approaches. IEEE Access. 2018;6:40950–62. [Google Scholar]
- 84.I. J. Goodfellow, J. Pouget-Abadie, M. Mirza, B. Xu, D. Warde-Farley, S. Ozair, et al., "Generative adversarial networks," arXiv preprint arXiv:1406.2661, 2014.
- 85.J. Redmon, S. Divvala, R. Girshick, and A. Farhadi, "You only look once: Unified, real-time object detection," in Proceedings of the IEEE conference on computer vision and pattern recognition, 2016, pp. 779-788.
- 86.Iqbal A, Sharif M. UNet: A semi-supervised method for segmentation of breast tumor images using a U-shaped pyramid-dilated network. Expert Syst Appl. 2023;221:119718. [Google Scholar]
- 87.Yamada M, Saito Y, Imaoka H, Saiko M, Yamada S, Kondo H, et al. Development of a real-time endoscopic image diagnosis support system using deep learning technology in colonoscopy. Sci Reports. 2019;9:1–9. [DOI] [PMC free article] [PubMed] [Google Scholar]
- 88.Esteva A, Chou K, Yeung S, Naik N, Madani A, Mottaghi A, et al. Deep learning-enabled medical computer vision. NPJ Dig Med. 2021;4:1–9. [DOI] [PMC free article] [PubMed] [Google Scholar]
- 89.Ramzan M, Raza M, Sharif MI, Kadry S. Gastrointestinal Tract Polyp Anomaly Segmentation on Colonoscopy Images Using Graft-U-Net. J Personal Med. 2022;12:1459. [DOI] [PMC free article] [PubMed] [Google Scholar]
- 90.Song P, Li J, Fan H. Attention based multi-scale parallel network for polyp segmentation. Comp Biol Med. 2022;146:105476. [DOI] [PubMed] [Google Scholar]
- 91.Lin Y, Wu J, Xiao G, Guo J, Chen G, Ma J. BSCA-Net: Bit Slicing Context Attention Network for Polyp Segmentation. Pattern Recogn. 2022;1:108917. [Google Scholar]
- 92.Park K-B, Lee JY. SwinE-Net: hybrid deep learning approach to novel polyp segmentation using convolutional neural network and Swin Transformer. J Comput Des Eng. 2022;9:616–32. [Google Scholar]
- 93.X. Zhao, L. Zhang, and H. Lu, "Automatic polyp segmentation via multi-scale subtraction network," in International Conference on Medical Image Computing and Computer-Assisted Intervention, 2021, pp. 120-130.
- 94.J. Wei, Y. Hu, R. Zhang, Z. Li, S. K. Zhou, and S. Cui, "Shallow attention network for polyp segmentation," in International Conference on Medical Image Computing and Computer-Assisted Intervention, 2021, pp. 699-708.
- 95.T. Kim, H. Lee, and D. Kim, "Uacanet: Uncertainty augmented context attention for polyp segmentation," in Proceedings of the 29th ACM International Conference on Multimedia, 2021, pp. 2167-2175.
- 96.J. Long, E. Shelhamer, and T. Darrell, "Fully convolutional networks for semantic segmentation," in Proceedings of the IEEE conference on computer vision and pattern recognition, 2015, pp. 3431-3440. [DOI] [PubMed]
- 97.Zhang C, Li S, Huang D, Wen B, Wei S, Song Y, Xianghua W. Development and Validation of an AI-Based Multimodal Model for Pathological Staging of Gastric Cancer Using CT and Endoscopic Images. Acad Radiol. 2025;1:1. [DOI] [PubMed] [Google Scholar]
- 98.Jiang Q, Yulin Y, Ren Y, Li S, He X. A review of deep learning methods for gastrointestinal diseases classification applied in computer-aided diagnosis system. Med Biol Eng Comput. 2025;63(2):293–320. [DOI] [PubMed] [Google Scholar]
- 99.Hasan MM, Islam N, Rahman MM. Gastrointestinal polyp detection through a fusion of contourlet transform and Neural features. J King Saud Univ-Comput Inform Sci. 2020;1:1. [Google Scholar]
- 100.Kang J, Gwak J. Ensemble of instance segmentation models for polyp segmentation in colonoscopy images. IEEE Access. 2019;7:26440–7. [Google Scholar]
- 101.Alaskar H, Hussain A, Al-Aseem N, Liatsis P, Al-Jumeily D. Application of convolutional neural networks for automated ulcer detection in wireless capsule endoscopy images. Sensors. 2019;19:1265. [DOI] [PMC free article] [PubMed] [Google Scholar]
- 102.Srivastava D, Rajitha B, Agarwal S. Content-based image retrieval for categorized dataset by aggregating gradient and texture features. Neural Comput Appl. 2021;33:1–15. [Google Scholar]
- 103.Patel A, Rani K, Kumar S, Figueiredo IN, Figueiredo PN. Automated bleeding detection in wireless capsule endoscopy images based on sparse coding. Multimedia Tools Appl. 2020;80:1–14. [Google Scholar]
- 104.Ali H, Sharif M, Yasmin M, Rehmani MH. Color-based template selection for detection of gastric abnormalities in video endoscopy. Biomed Signal Process Control. 2020;56:101668. [Google Scholar]
- 105.Singh V, Srivastava V, Mehta DS. Machine learning-based screening of red blood cells using quantitative phase imaging with micro-spectrocolorimetry. Opt Laser Technol. 2020;124:105980. [Google Scholar]
- 106.de Souza Jr LA, Palm C, Mendel R, Hook C, Ebigbo A, Probst A, et al. A survey on Barrett’s esophagus analysis using machine learning. Comp Biol Med. 2018;96:203–13. [DOI] [PubMed] [Google Scholar]
- 107.Depeursinge A. Multiscale and multidirectional biomedical texture analysis: finding the needle in the haystack. In: Biomedical texture analysis. UK: Elsevier; 2017. p. 29–53. [Google Scholar]
- 108.Ali H, Sharif M, Yasmin M, Rehmani MH. Computer-based classification of chromoendoscopy images using homogeneous texture descriptors. Comp Biol Med. 2017;88:84–92. [DOI] [PubMed] [Google Scholar]
- 109.Wang Y, Zhao L, Gong L, Chen X, Zuo S. A monocular SLAM system based on SIFT features for gastroscope tracking. Med Biol Eng Comput. 2023;61:511–23. [DOI] [PubMed] [Google Scholar]
- 110.Dewi IA, Fahrudin NF, Raina J. Segmentation-Based Fractal Texture Analysis (SFTA) to Detect Mass in Mammogram Images. ELKOMIKA: Jurnal Teknik Energi Elektrik, Teknik Telekomunikasi, Teknik Elektronika. 2021;9:203. [Google Scholar]
- 111.Soltanpour S, Boufama B, Wu QJ. A survey of local feature methods for 3D face recognition. Pattern Recogn. 2017;72:391–406. [Google Scholar]
- 112.K. Pogorelov, K. R. Randel, C. Griwodz, S. L. Eskeland, T. de Lange, D. Johansen, et al., "Kvasir: A multi-class image dataset for computer aided gastrointestinal disease detection," in Proceedings of the 8th ACM on Multimedia Systems Conference, 2017, pp. 164-169.
- 113.Mishra S, Majhi B, Sa PK, Sharma L. Gray level co-occurrence matrix and random forest based acute lymphoblastic leukemia detection. Biomed Signal Process Control. 2017;33:272–80. [Google Scholar]
- 114.Sudha D, Ramakrishna M. "Comparative study of features fusion techniques. Int Conf Recent Adv Electron Commun Technol (ICRAECT). 2017;2017:235–9. [Google Scholar]
- 115.Li Y, Deng L, Yang X, Liu Z, Zhao X, Huang F, et al. Early diagnosis of gastric cancer based on deep learning combined with the spectral-spatial classification method. Biomed Opt Express. 2019;10:4999–5014. [DOI] [PMC free article] [PubMed] [Google Scholar]
- 116.Nazir M, Jan Z, Sajjad M. Facial expression recognition using histogram of oriented gradients based transformed features. Cluster Comput. 2018;21:539–48. [Google Scholar]
- 117.M. Akbari, M. Mohrekesh, K. Najariani, N. Karimi, S. Samavi, and S. R. Soroushmehr, "Adaptive specular reflection detection and inpainting in colonoscopy video frames," in 2018 25th IEEE International Conference on Image Processing (ICIP), 2018, pp. 3134-3138.
- 118.A. F. Din and A. S. A. Nasir, "Automated cells counting for leukaemia and malaria detection based on RGB and HSV colour spaces analysis," in Proceedings of the 11th National Technical Seminar on Unmanned System Technology 2019, 2021, pp. 981-996.
- 119.Khalil A, Rahman SU, Alam F, Ahmad I, Khalil I. Fire Detection Using Multi Color Space and Background Modeling. Fire Technol. 2020;57:1–19. [Google Scholar]
- 120.Arab S, Rezaee K, Moghaddam G. A novel fuzzy expert system design to assist with peptic ulcer disease diagnosis. Cogent Eng. 2021;8:1861730. [Google Scholar]
- 121.Wang Y-K, Syu H-Y, Chen Y-H, Chung C-S, Tseng YS, Ho S-Y, et al. Endoscopic Images by a Single-Shot Multibox Detector for the Identification of Early Cancerous Lesions in the Esophagus: A Pilot Study. Cancers. 2021;13:321. [DOI] [PMC free article] [PubMed] [Google Scholar]
- 122.Naqi S, Sharif M, Yasmin M, Fernandes SL. Lung nodule detection using polygon approximation and hybrid features from CT images. Curr Med Imaging. 2018;14:108–17. [Google Scholar]
- 123.Sathiyamoorthi V, Ilavarasi A, Murugeswari K, Ahmed ST, Devi BA, Kalipindi M. A deep convolutional neural network based computer aided diagnosis system for the prediction of Alzheimer’s disease in MRI images. Measurement. 2021;171:108838. [Google Scholar]
- 124.Y. Liao, S. Xiong, and Y. Huang, "Research on fire inspection robot based on computer vision," in IOP Conference Series: Earth and Environmental Science, 2021, p. 052066.
- 125.Hajabdollahi M, Esfandiarpoor R, Khadivi P, Soroushmehr SR, Karimi N, Najarian K, et al. Segmentation of bleeding regions in wireless capsule endoscopy for detection of informative frames. Biomed Signal Process Control. 2019;53:101565. [Google Scholar]
- 126.Deeba F, Islam M, Bui FM, Wahid KA. Performance assessment of a bleeding detection algorithm for endoscopic video based on classifier fusion method and exhaustive feature selection. Biomed Signal Process Control. 2018;40:415–24. [Google Scholar]
- 127.S. Ramesh, R. Hebbar, M. Niveditha, R. Pooja, N. Shashank, and P. Vinod, "Plant disease detection using machine learning," in 2018 International conference on design innovations for 3Cs compute communicate control (ICDI3C), 2018, pp. 41-45.
- 128.C.-H. Huang, H.-Y. Wu, and Y.-L. Lin, "HarDNet-MSEG: A Simple Encoder-Decoder Polyp Segmentation Neural Network that Achieves over 0.9 Mean Dice and 86 FPS," arXiv preprint arXiv:2101.07172, 2021.
- 129.Dong Y, Wu H, Li X, Zhou C, Wu Q. Multiscale symmetric dense micro-block difference for texture classification. IEEE Trans Circuits Syst Video Technol. 2018;29:3583–94. [Google Scholar]
- 130.Ghalati MK, Nunes A, Ferreira H, Serranho P, Bernardes R. Texture analysis and its applications in biomedical imaging: A survey. IEEE Rev Biomed Eng. 2021;15:222. [DOI] [PubMed] [Google Scholar]
- 131.Hu Y, Wang Z, AlRegib G. Texture classification using block intensity and gradient difference (BIGD) descriptor. Signal Process: Image Commun. 2020;83:115770. [Google Scholar]
- 132.Liu M, Li F, Yan H, Wang K, Ma Y, Shen L, et al. A multi-model deep convolutional neural network for automatic hippocampus segmentation and classification in Alzheimer’s disease. NeuroImage. 2020;208:116459. [DOI] [PubMed] [Google Scholar]
- 133.Youbi Z, Boubchir L, Boukrouche A. Human ear recognition based on local multi-scale LBP features with city-block distance. Multimedia Tools Appl. 2019;78:14425–41. [Google Scholar]
- 134.Hassaballah M, Alshazly HA, Ali AA. Ear recognition using local binary patterns: A comparative experimental study. Expert Syst Appl. 2019;118:182–200. [Google Scholar]
- 135.Pan Z, Wu X, Li Z. Central pixel selection strategy based on local gray-value distribution by using gradient information to enhance LBP for texture classification. Expert Syst Appl. 2019;120:319–34. [Google Scholar]
- 136.Humeau-Heurtier A. Texture feature extraction methods: A survey. IEEE Access. 2019;7:8975–9000. [Google Scholar]
- 137.Chitalia RD, Kontos D. Role of texture analysis in breast MRI as a cancer biomarker: A review. J Mag Res Imaging. 2019;49:927–38. [DOI] [PMC free article] [PubMed] [Google Scholar]
- 138.Souaidi M, El Ansari M. Multi-scale analysis of ulcer disease detection from WCE images. IET Image Process. 2019;13:2233–44. [Google Scholar]
- 139.Korkmaz SA, Binol H. Classification of molecular structure images by using ANN, RF, LBP, HOG, and size reduction methods for early stomach cancer detection. J Mol Struc. 2018;1156:255–63. [Google Scholar]
- 140.Sanchez-Gonzalez A, Garcia-Zapirain B, Sierra-Sosa D, Elmaghraby A. Automatized colon polyp segmentation via contour region analysis. Comput Biol Med. 2018;100:152–64. [DOI] [PubMed] [Google Scholar]
- 141.Poornima D, Karegowda AG. A review of image segmentation techniques applied to medical images. Int J Data Mining Emerg Technol. 2018;8:78–94. [Google Scholar]
- 142.Y. Li, X. Li, X. Xie, and L. Shen, "Deep learning based gastric cancer identification," in 2018 IEEE 15th International Symposium on Biomedical Imaging (ISBI 2018), 2018, pp. 182-185.
- 143.Guo X, Zhang L, Hao Y, Zhang L, Liu Z, Liu J. Multiple abnormality classification in wireless capsule endoscopy images based on EfficientNet using attention mechanism. Rev Sci Instrument. 2021;92:094102. [DOI] [PubMed] [Google Scholar]
- 144.Chiu HM. Diagnosis of Early Colorectal Carcinoma: Endoscopic Diagnosis and Classification. In: Endoscopy in Early Gastrointestinal Cancers, vol. 1. US: Springer; 2021. p. 57–68. [Google Scholar]
- 145.Nogueira-Rodríguez A, Domínguez-Carbajales R, López-Fernández H, Iglesias Á, Cubiella J, Fdez-Riverola F, et al. Deep Neural Networks approaches for detecting and classifying colorectal polyps. Neurocomputing. 2021;423:721–34. [Google Scholar]
- 146.Ali H, Sharif M, Yasmin M, Rehmani MH. A shallow extraction of texture features for classification of abnormal video endoscopy frames. Biomed Signal Process Control. 2022;77:103733. [Google Scholar]
- 147.Z. Lai and Z. Jia, "Multi-lesion classification of WCE images based on deep sparse feature selection and feature fusion," in 2022 3rd International Conference on Electronic Communication and Artificial Intelligence (IWECAI), 2022, pp. 461-466.
- 148.Rahman S, Azam B, Khan SU, Awais M, Ali I. Automatic identification of abnormal blood smear images using color and morphology variation of RBCS and central pallor. Comput Med Imaging Graph. 2021;87:101813. [DOI] [PubMed] [Google Scholar]
- 149.Charfi S, El Ansari M. Computer-aided diagnosis system for colon abnormalities detection in wireless capsule endoscopy images. Multimedia Tools Appl. 2018;77:4047–64. [Google Scholar]
- 150.Kalimuthu KR, Daha T. Intelligent gastro tumour segmenter: Methodology and result analysis on segmentation of gastro polyp tumour in colon images using stepwise image processing techniques. Int J Appl Eng Res. 2018;13:1820–6. [Google Scholar]
- 151.Bhunia AK, Bhattacharyya A, Banerjee P, Roy PP, Murala S. A novel feature descriptor for image retrieval by combining modified color histogram and diagonally symmetric co-occurrence texture pattern. Pattern Anal Appl. 2019;23:1–21. [Google Scholar]
- 152.Veluchamy M, Subramani B. Fuzzy dissimilarity color histogram equalization for contrast enhancement and color correction. Appl Soft Comput. 2020;89:106077. [Google Scholar]
- 153.Chowdhary CL, Acharjya D. Segmentation and feature extraction in medical imaging: a systematic review. Procedia Comput Sci. 2020;167:26–36. [Google Scholar]
- 154.D. Misra, C. Crispim-Junior, and L. Tougne, "Patch-based CNN evaluation for bark classification," in European Conference on Computer Vision, 2020, pp. 197-212.
- 155.Porebski A, Truong Hoang V, Vandenbroucke N, Hamad D. Combination of LBP Bin and Histogram Selections for Color Texture Classification. J Imaging. 2020;6:53. [DOI] [PMC free article] [PubMed] [Google Scholar]
- 156.Veerashetty S, Patil NB. Novel LBP based texture descriptor for rotation, illumination and scale invariance for image texture analysis and classification using multi-kernel SVM. Multimedia Tools Appl. 2020;79:9935–55. [Google Scholar]
- 157.Charfi S, El Ansari M. A locally based feature descriptor for abnormalities detection. Soft Comput. 2020;24:4469–81. [Google Scholar]
- 158.Lohithashva B, Aradhya VM, Guru D. Violent video event detection based on integrated LBP and GLCM texture features. Revue d’Intell Artif. 2020;34:179–87. [Google Scholar]
- 159.B. Giritharan, X. Yuan, J. Liu, B. Buckles, J. Oh, and S. J. Tang, "Bleeding detection from capsule endoscopy videos," in 2008 30th Annual International Conference of the IEEE Engineering in Medicine and Biology Society, 2008, pp. 4780-4783. [DOI] [PubMed]
- 160.Al-Baddai S, Marti-Puig P, Gallego-Jutglà E, Al-Subari K, Tomé AM, Ludwig B, et al. A recognition–verification system for noisy faces based on an empirical mode decomposition with Green’s functions. Soft Comput. 2020;24:3809–27. [Google Scholar]
- 161.Ponnusamy R, Sathiamoorthy S, Visalakshi R. An efficient method to classify GI tract images from WCE using visual words. Int J Electr Comput Eng. 2020;10:2088–8708. [Google Scholar]
- 162.Owais M, Arsalan M, Choi J, Mahmood T, Park KR. Artificial intelligence-based classification of multiple gastrointestinal diseases using endoscopy videos for clinical diagnosis. J Clin Med. 2019;8:986. [DOI] [PMC free article] [PubMed] [Google Scholar]
- 163.Saeed T, Muhammad Attique K, Ameer H, Mohammad S, Wazir Zada K, Fatimah A, Leila J, Jamel B. Neuro-XAI: Explainable deep learning framework based on deeplabV3+ and bayesian optimization for segmentation and classification of brain tumor in MRI scans. J Neurosci Methods. 2024;410:110247. [DOI] [PubMed] [Google Scholar]
- 164.Nakagawa K, Ishihara R, Aoyama K, Ohmori M, Nakahira H, Matsuura N, et al. Classification for invasion depth of esophageal squamous cell carcinoma using a deep neural network compared with experienced endoscopists. Gastroint Endoscopy. 2019;90:407–14. [DOI] [PubMed] [Google Scholar]
- 165.Yu X, Liu H, Wu Y, Ruan H. Kernel-based low-rank tensorized multiview spectral clustering. Int J Intell Syst. 2021;36:757–77. [Google Scholar]
- 166.Liu W-N, Zhang Y-Y, Bian X-Q, Wang L-J, Yang Q, Zhang X-D, et al. Study on detection rate of polyps and adenomas in artificial-intelligence-aided colonoscopy. Saudi J Gastroenterol: Off J Saudi Gastroenterol Assoc. 2020;26:13. [DOI] [PMC free article] [PubMed] [Google Scholar]
- 167.Mohammed BA, Al-Ani MS. Review Research of Medical Image Analysis Using Deep Learning. UHD J Sci Technol. 2020;4:75–90. [Google Scholar]
- 168.Jabeen K, Muhammad Attique K, Ameer H, Hussain Mobarak A, Shrooq A, Usman T, Isaac O. An EfficientNet integrated ResNet deep network and explainable AI for breast lesion classification from ultrasound images. CAAI Trans Intell Technol. 2024. 10.1049/cit2.12385. [Google Scholar]
- 169.Yang X, Jiang X. A hybrid active contour model based on new edge-stop functions for image segmentation. Int J Ambient Comput Intell (IJACI). 2020;11:87–98. [Google Scholar]
- 170.Borisov AV, Zakharova OA, Samarinova AA, Yunusova NV, Cheremisina OV, Kistenev YV. A Criterion of Colorectal Cancer Diagnosis Using Exosome Fluorescence-Lifetime Imaging. Diagnostics. 2022;12:1792. [DOI] [PMC free article] [PubMed] [Google Scholar]
- 171.Giri KJ, Bashir R. A block based watermarking approach for color images using discrete wavelet transformation. Int J Inform Technol. 2018;10:139–46. [Google Scholar]
- 172.Madheswari K, Venkateswaran N. Swarm intelligence based optimisation in thermal image fusion using dual tree discrete wavelet transform. Quant InfraRed Thermogr J. 2017;14:24–43. [Google Scholar]
- 173.Hou X, Shen L, Sun K, Qiu G. “Deep feature consistent variational autoencoder,” in. IEEE Winter Conf Appl Comput Vision (WACV). 2017;2017:1133–41. [Google Scholar]
- 174.Giri KJ, Quadri S, Bashir R, Bhat JI. DWT based color image watermarking: a review. Multimedia Tools Appl. 2020;79:32881–95. [Google Scholar]
- 175.Wang Q, Pan N, Xiong W, Lu H, Li N, Zou X. Reduction of bubble-like frames using a rss filter in wireless capsule endoscopy video. Opt Laser Technol. 2019;110:152–7. [Google Scholar]
- 176.Al-Shebani Q, Premaratne P, McAndrew DJ, Vial PJ, Abey S. A frame reduction system based on a color structural similarity (CSS) method and Bayer images analysis for capsule endoscopy. Artif Intell Med. 2019;94:18–27. [DOI] [PubMed] [Google Scholar]
- 177.R. Ismail and S. Nagy, "On Metrics Used in Colonoscopy Image Processing for Detection of Colorectal Polyps," in New Approaches for Multidimensional Signal Processing, ed: Springer, 2021, pp. 137-151.
- 178.Wu W, Li A-D, He X-H, Ma R, Liu H-B, Lv J-K. A comparison of support vector machines, artificial neural network and classification tree for identifying soil texture classes in southwest China. Comp Electron Agr. 2018;144:86–93. [Google Scholar]
- 179.Dong Y, Tao D, Li X. Nonnegative multiresolution representation-based texture image classification. ACM Trans Intell Syst Technol (TIST). 2015;7:1–21. [Google Scholar]
- 180.Hassan AR, Haque MA. Computer-aided gastrointestinal hemorrhage detection in wireless capsule endoscopy videos. Comput Methods Prog Biomed. 2015;122:341–53. [DOI] [PubMed] [Google Scholar]
- 181.B. Taha, N. Werghi, and J. Dias, "Automatic polyp detection in endoscopy videos: A survey," in 2017 13th IASTED International Conference on Biomedical Engineering (BioMed), 2017, pp. 233-240.
- 182.Das L, Das J, Nanda S. Detection of exon location in eukaryotic DNA using a fuzzy adaptive Gabor wavelet transform. Genomics. 2020;112:4406–16. [DOI] [PubMed] [Google Scholar]
- 183.Hayat NAM, Noh ZM, Yatim NM, Radzi SA. Analysis of local binary pattern using uniform bins as palm vein pattern descriptor. J Phys Conf Ser. 2020;1:012043. [Google Scholar]
- 184.N. E. Koshy and V. P. Gopi, "A new method for ulcer detection in endoscopic images," in 2015 2nd International Conference on Electronics and Communication Systems (ICECS), 2015, pp. 1725-1729.
- 185.Zhdanova M, Voronin V, Semenishchev E, Balabaeva O, Zelensky A. Gastric polyps detection based on endoscopic video using modified dense micro-block difference descriptor. Appl Mach Learn. 2020;2020:115110D. [Google Scholar]
- 186.Janse MH, van der Sommen F, Zinger S, Schoon EJ. Early esophageal cancer detection using RF classifiers. Med Imaging 2016: Comput-Aided Diagn. 2016;1:97851D. [Google Scholar]
- 187.Shang Hui, Feng Tao, Han Dong, Liang Fengying, Zhao Bin, Lihang Xu, Cao Zhendong. Deep learning and radiomics for gastric cancer serosal invasion: automated segmentation and multi-machine learning from two centers. J Cancer Res Clin Oncol. 2025;151(2):1–12. [DOI] [PMC free article] [PubMed] [Google Scholar]
- 188.Ashour AS, Dey N, Mohamed WS, Tromp JG, Sherratt RS, Shi F, et al. Colored video analysis in wireless capsule endoscopy: a survey of state-of-the-art. Curr Med Imaging. 2020;16:1074–84. [DOI] [PubMed] [Google Scholar]
- 189.A. Goyal and R. Gunjan, "Bleeding Detection in Gastrointestinal Images using Texture Classification and Local Binary Pattern Technique: A Review," in E3S Web of Conferences, 2020, p. 03007.
- 190.Mathialagan P, Chidambaranathan M. Computer Vision Techniques for Upper Aero-Digestive Tract Tumor Grading Classification-Addressing Pathological Challenges. Pattern Recogn Lett. 2021;1:1. [Google Scholar]
- 191.N. Ghatwary, "Automatic Esophageal Abnormality Detection and Classification," University of Lincoln, 2020.
- 192.M. Mathew and V. P. Gopi, "Transform based bleeding detection technique for endoscopic images," in 2015 2nd International Conference on Electronics and Communication Systems (ICECS), 2015, pp. 1730-1734.
- 193.Y.-J. Zhang, "Image Basics," in Handbook of Image Engineering, ed: Springer, 2021, pp. 3-53.
- 194.R. Ponnusamy and S. Sathiamoorthy, "Bleeding and Z-line classification by DWT based SIFT using KNN and SVM," in International Conference On Computational Vision and Bio Inspired Computing, 2019, pp. 679-688.
- 195.Garg M, Dhiman G. A novel content-based image retrieval approach for classification using GLCM features and texture fused LBP variants. Neural Comput Appl. 2020;1:1–18. [Google Scholar]
- 196.Rauf F, Albarakati H M, Jabeen K, Alsenan S, Hamza A, Teng S, Nam Y. Artificial intelligence assisted common maternal fetal planes prediction from ultrasound images based on information fusion of customized convolutional neural networks. Front Med. 2024;11:1486995. [DOI] [PMC free article] [PubMed] [Google Scholar]
- 197.Hayman CV, Vyas D. Screening colonoscopy: The present and the future. World Journal of Gastroenterology. 2021;27:233. [DOI] [PMC free article] [PubMed] [Google Scholar]
- 198.L. Serpa-Andrade, V. Robles-Bykbaev, L. González-Delgado, and J. L. Moreno, "An approach based on Fourier descriptors and decision trees to perform presumptive diagnosis of esophagitis for educational purposes," 2015 IEEE International Autumn Meeting on Power, Electronics and Computing (ROPEC), 2015, pp. 1-5.
- 199.H.-o. Yamano, "Magnifying Endoscopy: Pit Pattern Diagnosis," in Endoscopic Management of Colorectal T1 (SM) Carcinoma, ed: Springer, 2020, pp. 11-16.
- 200.Drozdzal M, Seguí S, Radeva P, Malagelada C, Azpiroz F, Vitrià J. Motility bar: a new tool for motility analysis of endoluminal videos. Comput Biol Med. 2015;65:320–30. [DOI] [PubMed] [Google Scholar]
- 201.Prasath V. Polyp detection and segmentation from video capsule endoscopy: A review. J Imaging. 2017;3:1. [Google Scholar]
- 202.Ghatwary N, Ahmed A, Grisan E, Jalab H, Bidaut L, Ye X. In-vivo Barrett’s esophagus digital pathology stage classification through feature enhancement of confocal laser endomicroscopy. J Med Imaging. 2019;6:014502. [DOI] [PMC free article] [PubMed] [Google Scholar]
- 203.Dong Y, Feng J, Liang L, Zheng L, Wu Q. Multiscale sampling based texture image classification. IEEE Signal Process Lett. 2017;24:614–8. [Google Scholar]
- 204.A. T. Abiko, B. Vala, and S. Patel, "Detecting Mucosal Abnormalities from Wireless Capsule Endoscopy Images," in International Conference on Intelligent Data Communication Technologies and Internet of Things, 2018, pp. 872-878.
- 205.Naz J, Sharif MI, Sharif MI, Kadry S, Rauf HT, Ragab AE. A Comparative Analysis of Optimization Algorithms for Gastrointestinal Abnormalities Recognition and Classification Based on Ensemble XcepNet23 and ResNet18 Features. Biomedicines. 2023;11:1723. [DOI] [PMC free article] [PubMed] [Google Scholar]
- 206.Ahmed IA, Senan EM, Shatnawi HSA. Hybrid Models for Endoscopy Image Analysis for Early Detection of Gastrointestinal Diseases Based on Fused Features. Diagnostics. 2023;13:1758. [DOI] [PMC free article] [PubMed] [Google Scholar]
- 207.Iqbal I, Walayat K, Kakar MU, Ma J. Automated identification of human gastrointestinal tract abnormalities based on deep convolutional neural network with endoscopic images. Intell Syst Appl. 2022;16:200149. [Google Scholar]
- 208.Shafi A, Rahman MM. Decomposition of color wavelet with higher order statistical texture and convolutional neural network features set based classification of colorectal polyps from video endoscopy. Int J Electr Comput Eng. 2020;10:2986. [Google Scholar]
- 209.Deeba F, Bui FM, Wahid KA. Computer-aided polyp detection based on image enhancement and saliency-based selection. Biomed Signal Process Control. 2020;55:101530. [Google Scholar]
- 210.P. Harzig, M. Einfalt, and R. Lienhart, "Automatic disease detection and report generation for gastrointestinal tract examination," in Proceedings of the 27th ACM International Conference on Multimedia, 2019, pp. 2573-2577.
- 211.Khan MA, Rashid M, Sharif M, Javed K, Akram T. Classification of gastrointestinal diseases of stomach from WCE using improved saliency-based method and discriminant features selection. Multimedia Tools Appl. 2019;78:27743–70. [Google Scholar]
- 212.Ali H, Yasmin M, Sharif M, Rehmani MH. Computer assisted gastric abnormalities detection using hybrid texture descriptors for chromoendoscopy images. Comput Methods Prog Biomed. 2018;157:39–47. [DOI] [PubMed] [Google Scholar]
- 213.O. H. Maghsoudi, "Superpixels based segmentation and SVM based classification method to distinguish five diseases from normal regions in wireless capsule endoscopy," arXiv preprint arXiv:1711.06616, 2017.
- 214.Yuan Y, Yao X, Han J, Guo L, Meng MQ-H. Discriminative joint-feature topic model with dual constraints for WCE classification. IEEE Trans Cybernet. 2017;48:2074–85. [DOI] [PubMed] [Google Scholar]
- 215.Gueye L, Yildirim-Yayilgan S, Cheikh FA, Balasingham I. “Automatic detection of colonoscopic anomalies using capsule endoscopy,” in. IEEE Int Conf Image Process (ICIP). 2015;2015:1061–4. [Google Scholar]
- 216.Miyaki R, Yoshida S, Tanaka S, Kominami Y, Sanomura Y, Matsuo T, et al. A computer system to be used with laser-based endoscopy for quantitative diagnosis of early gastric cancer. J Clin Gastroenterol. 2015;49:108–15. [DOI] [PubMed] [Google Scholar]
- 217.Stahlberg F. Neural machine translation: A review. J Artif Intell Res. 2020;69:343–418. [Google Scholar]
- 218.Yuan Y, Li B, Meng MQ-H. Bleeding frame and region detection in the wireless capsule endoscopy video. IEEE J Biomed Health Inform. 2015;20:624–30. [DOI] [PubMed] [Google Scholar]
- 219.Riaz F, Hassan A, Nisar R, Dinis-Ribeiro M, Coimbra MT. Content-adaptive region-based color texture descriptors for medical images. IEEE J Biomed Health Inform. 2015;21:162–71. [DOI] [PubMed] [Google Scholar]
- 220.V. Monga, Y. Li, and Y. C. Eldar, "Algorithm unrolling: Interpretable, efficient deep learning for signal and image processing," arXiv preprint arXiv:1912.10557, 2019.
- 221.Noh A, Sabrina Xin XQ, Nuraini Z, Juin Shin W, Derrick Y, Byeong Yun A, Khek YuH, Hyunsoo C. Machine learning classification and biochemical characteristics in the real-time diagnosis of gastric adenocarcinoma using Raman spectroscopy. Sci Reports. 2025;15(1):2469. [DOI] [PMC free article] [PubMed] [Google Scholar]
- 222.Dao DV, Ly H-B, Vu H-LT, Le T-T, Pham BT. Investigation and Optimization of the C-ANN Structure in Predicting the Compressive Strength of Foamed Concrete. Materials. 2020;13:1072. [DOI] [PMC free article] [PubMed] [Google Scholar]
- 223.A. Dertat, "Applied Deep Learning - Part 1: Artificial Neural Networks," Aug 8, 2017 2017.
- 224.Koopialipoor M, Fahimifar A, Ghaleini EN, Momenzadeh M, Armaghani DJ. Development of a new hybrid ANN for solving a geotechnical problem related to tunnel boring machine performance. Eng Comput. 2020;36:345–57. [Google Scholar]
- 225.Heidari AA, Faris H, Mirjalili S, Aljarah I, Mafarja M. Ant lion optimizer: theory, literature review, and application in multi-layer perceptron neural networks. In: Nature-Inspired Optimizers. US: Springer; 2020. p. 23–46. [Google Scholar]
- 226.Zhang S, Yao L, Sun A, Tay Y. Deep learning based recommender system: A survey and new perspectives. ACM Comput Surveys (CSUR). 2019;52:1–38. [Google Scholar]
- 227.Bera S, Shrivastava VK. Analysis of various optimizers on deep convolutional neural network model in the application of hyperspectral remote sensing image classification. Int J Remote Sens. 2020;41:2664–83. [Google Scholar]
- 228.Kaur T, Gandhi TK. Deep convolutional neural networks with transfer learning for automated brain image classification. Mach Vision Appl. 2020;31:1–16. [Google Scholar]
- 229.K. A. Sankararaman, S. De, Z. Xu, W. R. Huang, and T. Goldstein, "The impact of neural network overparameterization on gradient confusion and stochastic gradient descent," in International Conference on Machine Learning, 2020, pp. 8469-8479.
- 230.Umer MJ, Sharif M, Raza M, Kadry S. A deep feature fusion and selection-based retinal eye disease detection from OCT images. Expert Syst. 2023;1:e13232. [Google Scholar]
- 231.Wen B, Ravishankar S, Pfister L, Bresler Y. Transform Learning for Magnetic Resonance Image Reconstruction: From Model-Based Learning to Building Neural Networks. IEEE Signal Process Mag. 2020;37:41–53. [Google Scholar]
- 232.Wang X, Tao H, Wang B, Jin H, Li Z. CFI-ViT: A coarse-to-fine inference based vision transformer for gastric cancer subtype detection using pathological images. Biomed Signal Process Control. 2025;100:107160. [Google Scholar]
- 233.M. Habibzadeh, M. Jannesari, Z. Rezaei, H. Baharvand, and M. Totonchi, "Automatic white blood cell classification using pre-trained deep learning models: Resnet and inception," in Tenth International Conference on Machine Vision (ICMV 2017), 2018, p. 1069612.
- 234.Shibata T, Teramoto A, Yamada H, Ohmiya N, Saito K, Fujita H. Automated Detection and Segmentation of Early Gastric Cancer from Endoscopic Images Using Mask R-CNN. Appl Sci. 2020;10:3842. [Google Scholar]
- 235.Ren S, He K, Girshick R, Sun J. Faster r-cnn: Towards real-time object detection with region proposal networks. Adv Neural Inform Process Syst. 2015;1:91–9. [DOI] [PubMed] [Google Scholar]
- 236.C. Chen, M.-Y. Liu, O. Tuzel, and J. Xiao, "R-CNN for small object detection," in Asian conference on computer vision, 2016, pp. 214-230.
- 237.Lin T-L, Chang H-Y, Chen K-H. The pest and disease identification in the growth of sweet peppers using faster R-CNN and mask R-CNN. J Internet Technol. 2020;21:605–14. [Google Scholar]
- 238.Iqbal A, Sharif M. BTS-ST: Swin transformer network for segmentation and classification of multimodality breast cancer images. Knowledge-Based Syst. 2023;267:110393. [Google Scholar]
- 239.Rosati R, Romeo L, Silvestri S, Marcheggiani F, Tiano L, Frontoni E. Faster R-CNN approach for detection and quantification of DNA damage in comet assay images. Comput Biol Med. 2020;123:103912. [DOI] [PubMed] [Google Scholar]
- 240.Jin S, Su Y, Gao S, Wu F, Hu T, Liu J, et al. Deep learning: individual maize segmentation from terrestrial lidar data using faster R-CNN and regional growth algorithms. Front Plant Sci. 2018;9:866. [DOI] [PMC free article] [PubMed] [Google Scholar]
- 241.Li L, Geng Y, Chen T, Lin K, Xie C, Qi J, Wei H, et al. Deep learning model targeting cancer surrounding tissues for accurate cancer diagnosis based on histopathological images. J Trans Med. 2025;23(1):110. [DOI] [PMC free article] [PubMed] [Google Scholar]
- 242.A. Yao, T. Kong, and Y. Chen, "Region proposal for image regions that include objects of interest using feature maps from multiple layers of a convolutional neural network model," ed: Google Patents, 2019.
- 243.W. Liu, D. Anguelov, D. Erhan, C. Szegedy, S. Reed, C.-Y. Fu, et al., "Ssd: Single shot multibox detector," in European Conference on Computer Vision, 2016, pp. 21-37.
- 244.Sirazitdinov I, Kholiavchenko M, Mustafaev T, Yixuan Y, Kuleev R, Ibragimov B. Deep neural network ensemble for pneumonia localization from a large-scale chest x-ray database. Comp Electr Eng. 2019;78:388–99. [Google Scholar]
- 245.George J, Skaria S, Varun V. Using YOLO based deep learning network for real time detection and localization of lung nodules from low dose CT scans. Med Imaging 2018: Comp-Aided Diagn. 2018;1:105751I. [Google Scholar]
- 246.Wang S, Cong Y, Zhu H, Chen X, Qu L, Fan H, et al. Multi-scale Context-guided Deep Network for Automated Lesion Segmentation with Endoscopy Images of Gastrointestinal Tract. IEEE J Biomed Health Inform. 2020;1:1. [DOI] [PubMed] [Google Scholar]
- 247.D. Müller, I. S. Rey, and F. Kramer, "Automated Chest CT Image Segmentation of COVID-19 Lung Infection based on 3D U-Net," arXiv preprint arXiv:2007.04774, 2020. [DOI] [PMC free article] [PubMed]
- 248.X. Mo, K. Tao, Q. Wang, and G. Wang, "An efficient approach for polyps detection in endoscopic videos based on faster R-CNN," in 2018 24th International Conference on Pattern Recognition (ICPR), 2018, pp. 3929-3934.
- 249.Zimmermann RS, Siems JN. Faster training of Mask R-CNN by focusing on instance boundaries. Comp Vis Image Unders. 2019;188:102795. [Google Scholar]
- 250.Huang F, Zhang J, Zhou C, Wang Y, Huang J, Zhu L. A deep learning algorithm using a fully connected sparse autoencoder neural network for landslide susceptibility prediction. Landslides. 2020;17:217–29. [Google Scholar]
- 251.Yuan C, Chen X, Yu P, Meng R, Cheng W, Wu QJ, et al. Semi-supervised stacked autoencoder-based deep hierarchical semantic feature for real-time fingerprint liveness detection. J Real-Time Image Process. 2020;17:55–71. [Google Scholar]
- 252.Öztürk Ş. Stacked auto-encoder based tagging with deep features for content-based medical image retrieval. Expert Syst Appl. 2020;161:113693. [Google Scholar]
- 253.D. Jha, P. H. Smedsrud, M. A. Riegler, P. Halvorsen, T. de Lange, D. Johansen, et al., "Kvasir-seg: A segmented polyp dataset," in International Conference on Multimedia Modeling, 2020, pp. 451-462.
- 254.Y. Lei, Y. Fu, T. Wang, R. L. Qiu, W. J. Curran, T. Liu, et al., "Deep Learning in Multi-organ Segmentation," arXiv preprint arXiv:2001.10619, 2020.
- 255.Rueden CT, Schindelin J, Hiner MC, DeZonia BE, Walter AE, Arena ET, et al. ImageJ2: ImageJ for the next generation of scientific image data. BMC Bioinform. 2017;18:529. [DOI] [PMC free article] [PubMed] [Google Scholar]
- 256.Yi X, Walia E, Babyn P. Generative adversarial network in medical imaging: A review. Med Image Anal. 2019;58:101552. [DOI] [PubMed] [Google Scholar]
- 257.A. Radford, L. Metz, and S. Chintala, "Unsupervised representation learning with deep convolutional generative adversarial networks," arXiv preprint arXiv:1511.06434, 2015.
- 258.Y. Choi, M. Choi, M. Kim, J.-W. Ha, S. Kim, and J. Choo, "Stargan: Unified generative adversarial networks for multi-domain image-to-image translation," in Proceedings of the IEEE conference on computer vision and pattern recognition, 2018, pp. 8789-8797.
- 259.Z. Zhang, L. Yang, and Y. Zheng, "Translating and segmenting multimodal medical volumes with cycle-and shape-consistency generative adversarial network," in Proceedings of the IEEE conference on computer vision and pattern recognition, 2018, pp. 9242-9251.
- 260.D. Nie, R. Trullo, J. Lian, C. Petitjean, S. Ruan, Q. Wang, et al., "Medical image synthesis with context-aware generative adversarial networks," in International Conference on Medical Image Computing and Computer-Assisted Intervention, 2017, pp. 417-425. [DOI] [PMC free article] [PubMed]
- 261.Wu J, Gan Y, Li M, Chen L, Liang J, Zhuo J, et al. Patchouli alcohol attenuates 5-fluorouracil-induced intestinal mucositis via TLR2/MyD88/NF-kB pathway and regulation of microbiota. Biomed Pharmacother. 2020;124:109883. [DOI] [PubMed] [Google Scholar]
- 262.F. Zhuang, Z. Qi, K. Duan, D. Xi, Y. Zhu, H. Zhu, et al., "A comprehensive survey on transfer learning," Proceedings of the IEEE, 2020.
- 263.Aldoj N, Lukas S, Dewey M, Penzkofer T. Semi-automatic classification of prostate cancer on multi-parametric MR imaging using a multi-channel 3D convolutional neural network. Eur Radiol. 2020;30:1243–53. [DOI] [PubMed] [Google Scholar]
- 264.Liu X, Guo S, Zhang H, He K, Mu S, Guo Y, et al. Accurate colorectal tumor segmentation for CT scans based on the label assignment generative adversarial network. Med Phys. 2019;46:3532–42. [DOI] [PubMed] [Google Scholar]
- 265.Tamang LD, Kim BW. Deep learning approaches to colorectal cancer diagnosis: a review. Appl Sci. 2021;11:10982. [Google Scholar]
- 266.Rehman A, Naz S, Razzak MI, Akram F, Imran M. A deep learning-based framework for automatic brain tumors classification using transfer learning. Circuits, Syst, Signal Process. 2020;39:757–75. [Google Scholar]
- 267.Ohata EF, Chagas JVSD, Bezerra GM, Hassan MM, de Albuquerque VHC. A novel transfer learning approach for the classification of histological images of colorectal cancer. J Supercomput. 2021;77:9494–519. [Google Scholar]
- 268.Sharif MI, Raza M, Anjum A, Saba T, Shad SA. Skin lesion segmentation and classification: A unified framework of deep neural network features fusion and selection. Expert Syst. 2022;39:e12497. [Google Scholar]
- 269.Rubab S, Kashif A, Muhammad N, Shah JH, et al. Lungs cancer classification from CT images: An integrated design of contrast based classical features fusion and selection. Pattern Recogn Lett. 2020;129:77–85. [Google Scholar]
- 270.Rauf F, Ghassen Ben B, Wardah A, Areej A, Mehrez M, Seob J, Yunyoung N. DenseIncepS115: a novel network-level fusion framework for Alzheimer’s disease prediction using MRI images. Front Oncol. 2024;14:1501742. [DOI] [PMC free article] [PubMed] [Google Scholar]
- 271.Sharif MI, Alhussein M, Aurangzeb K, Raza M. A decision support system for multimodal brain tumor classification using deep learning. Comp Intell Syst. 2021;8:1–14. [Google Scholar]
- 272.Amin J, Anjum MA, Sharif A, Sharif MI. A modified classical-quantum model for diabetic foot ulcer classification. Intell Decis Technol. 2022;16:23–8. [Google Scholar]
- 273.Zafar M, Sharif MI, Sharif MI, Kadry S, Bukhari SAC, Rauf HT. Skin lesion analysis and cancer detection based on machine/deep learning techniques: A comprehensive survey. Life. 2023;13:146. [DOI] [PMC free article] [PubMed] [Google Scholar]
- 274.Fayyaz AM, Sharif MI, Azam S, Karim A, El-Den J. Analysis of Diabetic Retinopathy (DR) Based on the Deep Learning. Information. 2023;14:30. [Google Scholar]
- 275.Hasan SM, Uddin MP, Al Mamun M, Sharif MI, Ulhaq A, Krishnamoorthy G. A Machine Learning Framework for Early-Stage Detection of Autism Spectrum Disorders. IEEE Access. 2022;11:15038–57. [Google Scholar]
- 276.Saikia R, Roopam D, Anupam S, Ngangbam Herojit S, Muhammad Attique K, Salam SD. VNLU-Net: Visual Network with Lightweight Union-net for Acute Myeloid Leukemia Detection on Heterogeneous Dataset. Biomed Signal Process Control. 2025;107:107840. [Google Scholar]
- 277.Shaukat N, Amin J, Sharif MI, Sharif MI, Kadry S, Sevcik L. Classification and Segmentation of Diabetic Retinopathy: A Systemic Review. Appl Sci. 2023;13:3108. [Google Scholar]
- 278.S. M. Redwan, M. P. Uddin, A. Ulhaq, and M. I. Sharif, "Power Spectral Density-Based Resting-State EEG Classification of First-Episode Psychosis," arXiv preprint arXiv:2301.01588, 2022. [DOI] [PMC free article] [PubMed]
- 279.Kundu AK, Fattah SA, Wahid KA. Least square saliency transformation of capsule endoscopy images for PDF model based multiple gastrointestinal disease classification. IEEE Access. 2020;8:58509–21. [Google Scholar]
- 280.Poudel S, Kim YJ, Vo DM, Lee S-W. Colorectal Disease Classification using Efficiently Scaled Dilation in Convolutional Neural Network. IEEE Access. 2020;8:99227. [Google Scholar]
- 281.Tsuboi A, Oka S, Aoyama K, Saito H, Aoki T, Yamada A, et al. Artificial intelligence using a convolutional neural network for automatic detection of small-bowel angioectasia in capsule endoscopy images. Digest Endoscopy. 2020;32:382–90. [DOI] [PubMed] [Google Scholar]
- 282.Mahmood F, Chen R, Durr NJ. Unsupervised reverse domain adaptation for synthetic medical images via adversarial training. IEEE Trans Med Imaging. 2018;37:2572–81. [DOI] [PubMed] [Google Scholar]
- 283.Iakovidis DK, Georgakopoulos SV, Vasilakakis M, Koulaouzidis A, Plagianakos VP. Detecting and locating gastrointestinal anomalies using deep learning and iterative cluster unification. IEEE Trans Med Imaging. 2018;37:2196–210. [DOI] [PubMed] [Google Scholar]
- 284.Ghosh T, Fattah SA, Wahid KA, Zhu W-P, Ahmad MO. Cluster based statistical feature extraction method for automatic bleeding detection in wireless capsule endoscopy video. Comp Biol Med. 2018;94:41–54. [DOI] [PubMed] [Google Scholar]
- 285.Lyu Y, Feng Y, Sakurai K. A Survey on Feature Selection Techniques Based on Filtering Methods for Cyber Attack Detection. Information. 2023;14:191. [Google Scholar]
- 286.Aït-Sahalia Y, Xiu D. Principal component analysis of high-frequency data. J Am Stat Assoc. 2019;114:287–303. [Google Scholar]
- 287.Du K-L, Swamy M. Principal component analysis. In: Neural Networks and Statistical Learning. US.: Springer; 2019. p. 373–425. [Google Scholar]
- 288.Giraldo-Zuluaga J-H, Salazar A, Gomez A, Diaz-Pulido A. Camera-trap images segmentation using multi-layer robust principal component analysis. Vis Comput. 2019;35:335–47. [Google Scholar]
- 289.Nanni L, Ghidoni S, Brahnam S. Handcrafted vs. non-handcrafted features for computer vision classification. Pattern Recogn. 2017;71:158–72. [Google Scholar]
- 290.Silva DM, Rothe-Neves R, Melges DB. Long-latency event-related responses to vowels: N1–P2 decomposition by two-step principal component analysis. Int J Psychophysiol. 2020;148:93–102. [DOI] [PubMed] [Google Scholar]
- 291.G. R. Kumar, K. Nagamani, and G. A. Babu, "A framework of dimensionality reduction utilizing PCA for neural network prediction," in Advances in Data Science and Management, ed: Springer, 2020, pp. 173-180.
- 292.Bchir O, Ismail M, ALaseem N. Empirical comparison of visual descriptors for ulcer recognition in wireless capsule endoscopy video. Comput Sci Inf Technol. 2018;1:1. [Google Scholar]
- 293.Ali H, Sharif M, Yasmin M, Rehmani MH, Riaz F. A survey of feature extraction and fusion of deep learning for detection of abnormalities in video endoscopy of gastrointestinal-tract. Artif Intell Rev. 2019;1:1–73. [Google Scholar]
- 294.C. Sindhu and V. Valsan, "Automatic detection of colonic polyps and tumor in wireless capsule endoscopy images using hybrid patch extraction and supervised classification," in 2017 International Conference on Innovations in Information, Embedded and Communication Systems (ICIIECS), 2017, pp. 1-5.
- 295.Peng H, Long F, Ding C. Feature selection based on mutual information criteria of max-dependency, max-relevance, and min-redundancy. IEEE Trans Pattern Anal Mach Intell. 2005;27:1226–38. [DOI] [PubMed] [Google Scholar]
- 296.Wang SP, Zhang Q, Lu J, Cai Y-D. Analysis and prediction of nitrated tyrosine sites with the mRMR method and support vector machine algorithm. Curr Bioinform. 2018;13:3–13. [Google Scholar]
- 297.Estévez PA, Tesmer M, Perez CA, Zurada JM. Normalized mutual information feature selection. IEEE Trans Neural Networks. 2009;20:189–201. [DOI] [PubMed] [Google Scholar]
- 298.G. Gulgezen, Z. Cataltepe, and L. Yu, "Stable and accurate feature selection," in Joint European Conference on Machine Learning and Knowledge Discovery in Databases, 2009, pp. 455-468.
- 299.Iqbal, Saeed, Xiaopin Zhong, Zongze Wu, Dina Abdulaziz AlHammadi, Weixiang Liu, and Imran Arshad Choudhry. "Hierarchical Continual Learning for Domain-Knowledge Retention in Healthcare Federated Learning." IEEE Transactions on Consumer Electronics (2025).
- 300.Naz J, Sharif M, Raza M, Shah JH, Yasmin M, Kadry S, et al. Recognizing gastrointestinal malignancies on WCE and CCE images by an ensemble of deep and handcrafted features with entropy and PCA based features optimization. Neural Process Lett. 2021;1:1–26. [Google Scholar]
- 301.Sziová B, Nagy S, Fazekas Z. Application of Structural Entropy and Spatial Filling Factor in Colonoscopy Image Classification. Entropy. 2021;23:936. [DOI] [PMC free article] [PubMed] [Google Scholar]
- 302.Sasmal P, Bhuyan MK, Iwahori Y, Kasugai K. Colonoscopic polyp classification using local shape and texture features. IEEE Access. 2021;9:92629–39. [Google Scholar]
- 303.Zeng Y, Chapman WC Jr, Lin Y, Li S, Mutch M, Zhu Q. Diagnosing colorectal abnormalities using scattering coefficient maps acquired from optical coherence tomography. J Biophoton. 2021;14:e202000276. [DOI] [PMC free article] [PubMed] [Google Scholar]
- 304.Al-Tashi Q, Md Rais H, Abdulkadir SJ, Mirjalili S, Alhussian H. A review of grey wolf optimizer-based feature selection methods for classification. Evol Mach Learn Techn. 2020;1:273–86. [Google Scholar]
- 305.Zebari R, Abdulazeez A, Zeebaree D, Zebari D, Saeed J. A comprehensive review of dimensionality reduction techniques for feature selection and feature extraction. J Appl Sci Technol Trends. 2020;1:56–70. [Google Scholar]
- 306.Lee JS, Yun J, Ham S, Park H, Lee H, Kim J, et al. Machine learning approach for differentiating cytomegalovirus esophagitis from herpes simplex virus esophagitis. Sci Reports. 2021;11:1–8. [DOI] [PMC free article] [PubMed] [Google Scholar]
- 307.Kurteva E, Bamford A, Cross K, Watson T, Owens C, Cheng F, et al. Colonic basidiobolomycosis-an unusual presentation of eosinophilic intestinal inflammation. Front Pediatr. 2020;8:142. [DOI] [PMC free article] [PubMed] [Google Scholar]
- 308.Iqbal S, Xiaopin Z, Mohammad S, Zongze W, Dina Abdulaziz A, Weixiang L, Shabbab Ali A, Yang L. Transforming Healthcare Diagnostics With Tensorized Attention and Continual Learning on Multi-Modal Data. IEEE Trans Consumer Electron. 2025;1:1. [Google Scholar]
- 309.M. A. Khan, A. Majid, N. Hussain, M. Alhaisoni, Y.-D. Zhang, S. Kadry, et al., "Multiclass stomach diseases classification using deep learning features optimization," 2021.
- 310.Song X-F, Zhang Y, Gong D-W, Gao X-Z. A fast hybrid feature selection based on correlation-guided clustering and particle swarm optimization for high-dimensional data. IEEE Trans Cybernet. 2021;1:1. [DOI] [PubMed] [Google Scholar]
- 311.Al-Rajab M, Lu J, Xu Q. A framework model using multifilter feature selection to enhance colon cancer classification. Plos One. 2021;16:e0249094. [DOI] [PMC free article] [PubMed] [Google Scholar]
- 312.Fayyaz AM, Raza M, Shah JH, Kadry S, Martínez OS. An Integrated Framework for COVID-19 Classification Based on Ensembles of Deep Features and Entropy Coded GLEO Feature Selection. Int J Uncertain, Fuzziness Knowledge-Based Syst. 2023;31:163–85. [Google Scholar]
- 313.Sadeghian Z, Akbari E, Nematzadeh H. A hybrid feature selection method based on information theory and binary butterfly optimization algorithm. Eng Appl Artif Intell. 2021;97:104079. [Google Scholar]
- 314.S. Yang, C. Lemke, B. F. Cox, I. P. Newton, I. Näthke, and S. Cochran, "A Learning Based Microultrasound System for the Detection of Inflammation of the Gastrointestinal Tract," IEEE Transactions on Medical Imaging, 2020. [DOI] [PubMed]
- 315.Sayed GI, Hassanien AE, Azar AT. Feature selection via a novel chaotic crow search algorithm. Neural Comput Appl. 2019;31:171–88. [Google Scholar]
- 316.Koul N, Manvi SS. Colon Cancer Classification Using Binary Particle Swarm Optimization and Logistic Regression. In: Emerging Technologies in Data Mining and Information Security. Berlin: Springer; 2021. p. 211–7. [Google Scholar]
- 317.Ma B, Li X, Xia Y, Zhang Y. Autonomous deep learning: a genetic DCNN designer for image classification. Neurocomputing. 2020;379:152–61. [Google Scholar]
- 318.D. Mane and U. V. Kulkarni, "A survey on supervised convolutional neural network and its major applications," in Deep Learning and Neural Networks: Concepts, Methodologies, Tools, and Applications, ed: IGI Global, 2020, pp. 1058-1071.
- 319.IJspeert J, Bevan R, Senore C, Kaminski M, Kuipers E, Mroz A, et al. Detection rate of serrated polyps and serrated polyposis syndrome in colorectal cancer screening cohorts: a European overview. Gut. 2017;66:1225–32. [DOI] [PubMed] [Google Scholar]
- 320.Ocaña MIG, Román KL-L, Urzelai NL, Ballester MÁG, Oliver IM. Medical Image Detection Using Deep Learning. In: Deep Learning in Healthcare. Cham.: Springer; 2020. p. 3–16. [Google Scholar]
- 321.Li B, Wu Y, Wang Z, Xing M, Xu W, Zhu Y, et al. Non-invasive diagnosis of Crohn’s disease based on SERS combined with PCA-SVM. Anal Methods. 2021;13:5264–73. [DOI] [PubMed] [Google Scholar]
- 322.Bisen RG, Rajurkar AM, Manthalkar R. Segmentation, Detection, and Classification of Liver Tumors for Designing a CAD System. In: Computing in Engineering and Technology. Cham: Springer; 2020. p. 103–11. [Google Scholar]
- 323.Ghani MKA, Mohammed MA, Arunkumar N, Mostafa SA, Ibrahim DA, Abdullah MK, et al. Decision-level fusion scheme for nasopharyngeal carcinoma identification using machine learning techniques. Neural Comput Appl. 2020;32:625–38. [Google Scholar]
- 324.Mateen H, Basar R, Ahmed AU, Ahmad MY. Localization of wireless capsule endoscope: A systematic review. IEEE Sens J. 2017;17:1197–206. [Google Scholar]
- 325.Naz J, Raza M, Shah JH, Yasmin M, Kadry S, et al. Recognizing gastrointestinal malignancies on WCE and CCE images by an ensemble of deep and handcrafted features with entropy and PCA based features optimization. Neural Process Lett. 2023;55:115–40. [Google Scholar]
- 326.Chang R-I, Chiu Y-H, Lin J-W. Two-stage classification of tuberculosis culture diagnosis using convolutional neural network with transfer learning. J Supercomput. 2020;1:1–16. [Google Scholar]
- 327.Q. Wang, Q. Ning, X. Yang, B. Chen, Y. Lei, C. Zhao, et al., "Global Descriptors of Convolution Neural Networks for Remote Scene Images Classification," in Artificial Intelligence in China, ed: Springer, 2020, pp. 1-11.
- 328.N. Ghatwary, A. Ahmed, and X. Ye, "Automated detection of Barrett’s esophagus using endoscopic images: a survey," in Annual conference on medical image understanding and analysis, 2017, pp. 897-908.
- 329.Araújo-Martins M, Pimentel-Nunes P, Libânio D, Borges-Canha M, Dinis-Ribeiro M. How Is Endoscopic Submucosal Dissection for Gastrointestinal Lesions Being Implemented? Results from an International Survey. GE-Portug J Gastroenterol. 2020;27:1–17. [DOI] [PMC free article] [PubMed] [Google Scholar]
- 330.Vieira PM, Silva CP, Costa D, Vaz IF, Rolanda C, Lima CS. Automatic segmentation and detection of small bowel angioectasias in WCE images. Ann Biomed Eng. 2019;47:1446–62. [DOI] [PubMed] [Google Scholar]
- 331.Ribeiro MG, Neves LA, Do Nascimento MZ, Roberto GF, Martins AS, Tosta TAA. Classification of colorectal cancer based on the association of multidimensional and multiresolution features. Expert Syst Appl. 2019;120:262–78. [Google Scholar]
- 332.Chan HP, Hadjiiski LM, Samala RK. Computer-aided diagnosis in the era of deep learning. Med Phys. 2020;47:e218–27. [DOI] [PMC free article] [PubMed] [Google Scholar]
- 333.Wang X, Qian H, Ciaccio EJ, Lewis SK, Bhagat G, Green PH, et al. Celiac disease diagnosis from videocapsule endoscopy images with residual learning and deep feature extraction. Comput Methods Programs Biomed. 2020;187:105236. [DOI] [PubMed] [Google Scholar]
- 334.Guo L, Xiao X, Wu C, Zeng X, Zhang Y, Du J, et al. Real-time automated diagnosis of precancerous lesions and early esophageal squamous cell carcinoma using a deep learning model (with videos). Gastroint Endoscopy. 2020;91:41–51. [DOI] [PubMed] [Google Scholar]
- 335.Shahril R, Saito A, Shimizu A, Baharun S. Bleeding Classification of Enhanced Wireless Capsule Endoscopy Images using Deep Convolutional Neural Network. J Inform Sci Eng. 2020;36:91–108. [Google Scholar]
- 336.Koh JEW, Hagiwara Y, Oh SL, Tan JH, Ciaccio EJ, Green PH, et al. Automated diagnosis of celiac disease using DWT and nonlinear features with video capsule endoscopy images. Future Generat Comp Syst. 2019;90:86–93. [Google Scholar]
- 337.K. Pogorelov, O. Ostroukhova, M. Jeppsson, H. Espeland, C. Griwodz, T. de Lange, et al., "Deep learning and hand-crafted feature based approaches for polyp detection in medical videos," in 2018 IEEE 31st International Symposium on Computer-Based Medical Systems (CBMS), 2018, pp. 381-386.
- 338.S. Nadeem, M. A. Tahir, S. S. A. Naqvi, and M. Zaid, "Ensemble of Texture and Deep Learning Features for Finding Abnormalities in the Gastro-Intestinal Tract," in International Conference on Computational Collective Intelligence, 2018, pp. 469-478.
- 339.Pogorelov K, Ostroukhova O, Petlund A, Halvorsen P, De Lange T, Espeland HN, et al. “Deep learning and handcrafted feature based approaches for automatic detection of angiectasia,” in. IEEE EMBS Int Conf Biomed Health Inform (BHI). 2018;2018:365–8. [Google Scholar]
- 340.Ahmad J, Muhammad K, Lee MY, Baik SW. Endoscopic image classification and retrieval using clustered convolutional features. J Med Syst. 2017;41:196. [DOI] [PubMed] [Google Scholar]
- 341.Samel NS, Mashimo H. Application of OCT in the gastrointestinal tract. Appl Sci. 2019;9:2991. [Google Scholar]
- 342.Haile MB, Salau AO, Enyew B, Belay AJ. Detection and classification of gastrointestinal disease using convolutional neural network and SVM. Cog Eng. 2022;9:2084878. [Google Scholar]
- 343.V. Vats, P. Goel, A. Agarwal, and N. Goel, "SURF-SVM based identification and classification of gastrointestinal diseases in wireless capsule endoscopy," arXiv preprint arXiv:2009.01179, 2020.
- 344.M. S. Hossain, A. Al Mamun, M. G. Hasan, and M. M. Hossain, "Easy scheme for ulcer detection in wireless capsule endoscopy images," in 2019 1st International Conference on Advances in Science, Engineering and Robotics Technology (ICASERT), 2019, pp. 1-5.
- 345.Jabeen K, Damaševičius R, Alsenan S, Baili J, Zhang Y-D, Verma A. An intelligent healthcare framework for breast cancer diagnosis based on the information fusion of novel deep learning architectures and improved optimization algorithm. Eng Appl Artif Intell. 2024;137:109152. [Google Scholar]
- 346.Ahmed A. Medical Image Classification using Pre-trained Convolutional Neural Networks and Support Vector Machine. Int J Comp Sci Network Secur. 2021;21:1–6. [Google Scholar]
- 347.He J-Y, Wu X, Jiang Y-G, Peng Q, Jain R. Hookworm detection in wireless capsule endoscopy images with deep learning. IEEE Trans Image Process. 2018;27:2379–92. [DOI] [PubMed] [Google Scholar]
- 348.Liaqat A, Khan MA, Shah JH, Sharif M, Yasmin M, Fernandes SL. Automated ulcer and bleeding classification from WCE images using multiple features fusion and selection. J Mech Med Biol. 2018;18:1850038. [Google Scholar]
- 349.K. Pogorelov, K. R. Randel, T. de Lange, S. L. Eskeland, C. Griwodz, D. Johansen, et al., "Nerthus: A bowel preparation quality video dataset," in Proceedings of the 8th ACM on Multimedia Systems Conference, 2017, pp. 170-174.
- 350.M. Akbari, M. Mohrekesh, E. Nasr-Esfahani, S. R. Soroushmehr, N. Karimi, S. Samavi, et al., "Polyp segmentation in colonoscopy images using fully convolutional network," in 2018 40th Annual International Conference of the IEEE Engineering in Medicine and Biology Society (EMBC), 2018, pp. 69-72. [DOI] [PubMed]
- 351.K. Pogorelov, P. T. Schmidt, M. Riegler, P. Halvorsen, K. R. Randel, C. Griwodz, et al., "Kvasir," pp. 164-169, 2017.
- 352.Bernal J, Sánchez FJ, Fernández-Esparrach G, Gil D, Rodríguez C, Vilariño F. WM-DOVA maps for accurate polyp highlighting in colonoscopy: Validation vs. saliency maps from physicians. Comput Med Imaging Graph. 2015;43:99–111. [DOI] [PubMed] [Google Scholar]
- 353.Perperidis A, Dhaliwal K, McLaughlin S, Vercauteren T. Image computing for fibre-bundle endomicroscopy: A review. Med Image Anal. 2020;62:101620. [DOI] [PMC free article] [PubMed] [Google Scholar]
- 354.Kim Y-J, Cho HC, Cho H-C. Deep Learning-Based Computer-Aided Diagnosis System for Gastroscopy Image Classification Using Synthetic Data. Appl Sci. 2021;11:760. [Google Scholar]
- 355.Weigt J, Repici A, Antonelli G, Afifi A, Kliegis L, Correale L, et al. Performance of a new integrated CADe/CADx system for detection and characterization of colorectal neoplasia. Endoscopy. 2021;1:1. [DOI] [PubMed] [Google Scholar]
- 356.Kolb JM, Wani S. Barrett’s esophagus: current standards in advanced imaging. Trans Gastroenterol Hepatol. 2021;6:1. [DOI] [PMC free article] [PubMed] [Google Scholar]
- 357.Caroppo A, Leone A, Siciliano P. Deep transfer learning approaches for bleeding detection in endoscopy images. Comput Med Imaging Graph. 2021;1:101852. [DOI] [PubMed] [Google Scholar]
- 358.S. Adewole, P. Fernandez, J. Jablonski, S. Syed, A. Copland, M. Porter, et al., "Lesion2Vec: Deep Metric Learning for Few Shot Multiple Lesions Recognition in Wireless Capsule Endoscopy," arXiv preprint arXiv:2101.04240, 2021.
- 359.Muhammad K, Khan S, Kumar N, Del Ser J, Mirjalili S. Vision-based personalized Wireless Capsule Endoscopy for smart healthcare: Taxonomy, literature review, opportunities and challenges. Future Gen Comp Syst. 2020;113:266–80. [Google Scholar]
- 360.Xia J, Xia T, Pan J, Gao F, Wang S, Qian Y-Y, et al. Use of artificial intelligence for detection of gastric lesions by magnetically controlled capsule endoscopy. Gastroint Endoscopy. 2021;93:133–9. [DOI] [PubMed] [Google Scholar]
- 361.Rahim T, Usman MA, Shin SY. A survey on contemporary computer-aided tumor, polyp, and ulcer detection methods in wireless capsule endoscopy imaging. Comput Med Imaging Graph. 2020;1:101767. [DOI] [PubMed] [Google Scholar]
- 362.Kurniawan N, Keuchel M. Flexible gastro-intestinal endoscopy—clinical challenges and technical achievements. Comput Struct Biotechnol J. 2017;15:168–79. [DOI] [PMC free article] [PubMed] [Google Scholar]
- 363.Turan M, Almalioglu Y, Araujo H, Konukoglu E, Sitti M. Deep endovo: A recurrent convolutional neural network (rcnn) based visual odometry approach for endoscopic capsule robots. Neurocomputing. 2018;275:1861–70. [Google Scholar]
- 364.Martinez-Herrera SE, Benezeth Y, Boffety M, Emile J-F, Marzani F, Lamarque D, et al. Identification of precancerous lesions by multispectral gastroendoscopy. Signal, Image Video Process. 2016;10:455–62. [Google Scholar]
- 365.Jiang Q, Yu Y, Ren Y, Li S, He X. A review of deep learning methods for gastrointestinal diseases classification applied in computer-aided diagnosis system. Med Biol Eng Comput. 2025;63:293–320. [DOI] [PubMed] [Google Scholar]
- 366.Liao J, Lam H-K, Jia G, Gulati S, Bernth J, Poliyivets D, et al. A case study on computer-aided diagnosis of nonerosive reflux disease using deep learning techniques. Neurocomputing. 2021;445:149–66. [Google Scholar]
Associated Data
This section collects any data citations, data availability statements, or supplementary materials included in this article.
Data Availability Statement
No datasets were generated or analysed during the current study.