

Abstract
This study investigated the viability of rice husk-derived biochar (RHB) as a partial substitute for cement in concrete. The used RHB, characterized by a novel chemical composition abundant in silicon and aluminum oxides, was incorporated into ordinary concrete at increasing substitution ratios up to 25% by cement weight. A comprehensive evaluation was conducted to assess the influence of RHB on various properties of concrete, including physical (setting time, standard consistency, workability), mechanical (compressive and tensile strength), microstructural (XRD, and EDX), and radiation shielding characteristics. The results indicated that RHB marginally increased cement setting time, with a maximum 7.14% increase observed at a 25% replacement level. However, it significantly increased water demand for standard consistency, reaching 35.7% at 25% replacement. The increased water demand correlated with a reduction in workability, with a maximum slump reduction rate of 57.3% at a 25% replacement level. The optimal replacement levels for mechanical strength enhancement were at 10% for compressive strength and 15% for tensile strength, achieving improvements of 13.74% and 9.48%, respectively. Additionally, Monte Carlo simulation code and PhyX software were employed for assessing gamma and fast neutron radiation attenuation characteristics of concrete. Gamma-ray attenuation tests revealed moderate improvements in the concrete’s gamma-ray shielding capacity. Interestingly, the 15% RHB sample demonstrated a higher linear attenuation compared to the other samples, a result of its increased density. On the contrary, the 25RHB sample is less valuable. The 15RHB sample had the highest value for FCS (0.090 cm−1) indicating its efficacy as a neutron shield.
Keywords: Rice husk biochar, Mechanical properties, Microstructure, Radiation shielding, Linear attenuation coefficient
Subject terms: Engineering, Civil engineering
Introduction
The rising global temperatures provide clear evidence of climate change, with carbon dioxide (CO2) emissions recognized as a primary driver to this phenomenon1. The construction sector possesses a significant carbon footprint, necessitating urgent research into mitigation strategies. CO2 emissions are generated throughout the construction lifecycle, from raw material extraction and processing to cement production2. As a fundamental industry within the construction and building sector, cement production faces significant challenges, including the depletion of fossil fuels, scarcity of raw materials, increasing global demand, and growing environmental concerns. This industry is responsible for approximately 7% of global CO2 emissions, making it a substantial contributor to climate change3. The Intergovernmental Panel on Climate Change (IPCC) has identified carbon capture and storage (CCS) as a promising technology for mitigating CO2 emissions from this sector4. CCS encompasses the capture of CO2 from point sources, such as cement kilns, its transportation via pipelines or other means, and its long-term geological storage in suitable formations, such as depleted oil and gas reservoirs, thereby preventing its release into the atmosphere. However, the widespread deployment of CCS is currently hindered by significant economic barriers, including high capital and operational costs, and substantial energy requirements for capture and compression, which can reduce the overall efficiency of the industrial process5,6.
Biochar is a carbon-rich solid material, produced via thermochemical conversion (pyrolysis) of biomass under oxygen-limited conditions, offering a promising avenue for carbon sequestration7. Its highly porous structure and recalcitrant nature enable the long-term stabilization of carbon, effectively removing it from the active carbon cycle. Biochar is widely used as an environmentally friendly material in a variety of applications. For instance, wood-based biochar is commonly used for wastewater treatment for removing heavy metals and carbon sequestration due to its high carbon content and porous structure8, while rice husk biochar is widely applied as a soil amendment9 and as a supplementary cementitious material in concrete. Corn cob biochar is often utilized as a soil ameliorant, as well as in fuel cells and bio composites material10, whereas bamboo biochar, known for its excellent adsorptive properties, is ideal for air and water purification systems11. Similarly, coconut shell biochar is frequently employed in biodiesel production and capacitive deionization12. These diverse types of biochar cater to a wide range of industrial, agricultural, and environmental applications, highlighting their versatility and importance13.
Incorporating biochar into cementitious materials offers a dual benefit: it reduces the embodied carbon footprint of concrete by partially replacing cement clinker, a major source of CO2 emissions, and can also enhance certain properties, such as workability, strength, and durability, depending on the biochar feedstock, production conditions, and incorporation rate14. While some studies report improvements in compressive strength, others observe a decrease, highlighting the importance of optimizing biochar properties and mix design15. The physicochemical properties of biochar, including elemental composition, stability, surface area, and functional groups, are significantly influenced by its origin and processing conditions (e.g., pyrolysis temperature)16. The chemical composition of biochar, primarily consisting of carbon, hydrogen, oxygen, nitrogen, and sulfur, along with trace amounts of other elements (e.g., potassium, phosphorus, calcium), is significantly influenced by both the original biomass feedstock and the pyrolysis conditions employed during its production. Pyrolysis, the thermal decomposition of organic material in an oxygen-limited environment, can be conducted at varying temperatures and heating rates, leading to diverse biochar properties. Lower temperature pyrolysis (typically in the range of 300–450 °C) generally results in biochar with a higher proportion of volatile matter and a less developed aromatic structure. These biochars tend to have a higher H/C (hydrogen to carbon) and O/C (oxygen to carbon) molar ratios, indicating a more aliphatic (less aromatic) character17. Conversely, higher temperature pyrolysis (above 600 °C) leads to increased carbonization and the development of more condensed aromatic structures. This results in biochars with higher fixed carbon content, greater porosity, increased surface area, and enhanced formation of more ordered graphitic domains. The H/C and O/C molar ratios decrease with increasing pyrolysis temperature, reflecting the loss of hydrogen and oxygen-containing functional groups18. This structural variability, ranging from relatively amorphous to more graphitic, distinguishes biochar from the highly ordered, crystalline structure of graphene. This difference is crucial in determining biochar’s diverse applications, as different structures confer different properties related to adsorption, reactivity, and stability4. The use of diverse biochar types in concrete has been the subject of numerous investigations, with a focus on their impact on physical, mechanical, and microstructural characteristics. Table 1 presents the key findings of several studies on the various properties of concrete.
Table 1.
Properties of concrete incorporating various types of biochar powders in literature studies.
| References | Biochar type | Optimum replacement/addition ratio | Main conclusions | Other notes |
|---|---|---|---|---|
| Akhtar& Sarmah1 |
Pulp and paper mill residues Rice husk |
0.1% of the total volume | At a seven-day curing period, compressive strength increased by 10% with the addition of pulp and paper mill biochar and by 6% with rice husk biochar. In contrast, the control sample achieved its maximum compressive strength at 28 days. Furthermore, biochar significantly enhanced the flexural strength of the concrete. Specifically, the incorporation of poultry litter and rice husk biochar at a concentration of 0.1% yielded optimal results, exhibiting a 20% increase in flexural strength compared to the control specimens | The incorporation of rice husk biochar at a concentration of 0.1% resulted in a marginal increase in the splitting tensile strength. Furthermore, the inclusion of biochar in the concrete mix led to a minor reduction in overall production costs owing to the partial substitution of cement |
| Gupta et al.21 | Wood waste | 0.5% of cement weight | The addition of wood biochar at a dosage of 0.50% by weight of cement yielded enhancements in compressive strength of 17% at 7 days and 16% at 28 days. Subsequent exposure to elevated temperatures revealed that the incorporation of 1–2 wt% of wood biochar served to minimize thermal degradation, resulting in strength retention that was 20% higher than the control specimens | After exposure to 550 °C, concrete with 2% biochar showed up to a 45% improvement in impermeability relative to plain concrete. The addition of 1% biochar and subsequent densification also enhanced water tightness, reducing capillary absorption and water penetration by 28% and 43%, respectively, compared to control samples |
| Ahmad et al.22 | Wheat straw | 1.5% of cement weight | After a 30-day curing period, mortars containing wheat straw biochar exhibited improved mechanical and durability properties. Specifically, compressive strength increased by 4.1%, 12.8%, and 17.3% with biochar contents of 0.5%, 1.0%, and 1.5%, respectively, compared to the control mortar. At a 1.5% biochar content, flexural strength also increased by 9.0%, while sorptivity and water absorption were reduced by 33.8% and 25%, respectively | Energy dispersive spectroscopy analysis of the mortar samples revealed the presence of specific elements, suggesting the potential formation of new hydration products that may contribute to the observed property changes. Furthermore, the incorporation of 1.5% wheat straw biochar resulted in a reduction of 30% and 31% in the volume of total and permeable air voids, respectively, compared to the control mortar |
| Qin et al.23 | Synthetic eucalyptus plywood | 6.5% of cement weight | At a biochar content of 6.5 wt%, the compressive strength of the concrete increased by 32.9% and 35.2% at 7 and 28 days, respectively. However, exceeding this content resulted in splitting tensile strengths lower than those observed in the control specimens | An increase in biochar content correlated with higher water absorption in the concrete specimens |
| Javed et al.20 |
Bagasse Coconut husk Peanut husk Rice husk Wheat husk |
2% of cement weight | Optimal compressive strength in biochar-modified mortars was observed at a 2 wt% replacement of cement. Bagasse biochar yielded the highest compressive strength, exhibiting an 18% increase, potentially attributable to its comparatively high silica content (16.62%) and finer particle size. The mechanical performance results were corroborated by findings from XRD, SEM, FTIR, EDX, and Raman spectroscopic analyses. An enhanced degree of hydration, leading to increased formation of hydration products, was also observed | The effectiveness of the tested biochars in modifying the properties of cement pastes and mortars followed the descending order: bagasse > rice husk > peanut husk > coconut husk > wheat husk |
| Sirico et al.24 | Forestry waste residues | 2% of cement weight | The incorporation of biochar at an optimal content of 2 wt% by weight of cement (w/wc) resulted in enhanced mechanical properties and internal microstructure of the concrete. Compared to the control mix, this optimal biochar content led to improvements in compressive strength of 3%, 7%, and 9% at curing ages of 28 days, 1 year, and 2 years, in order. Additionally, results revealed that biochar additions of both 2% and 5% w/wc yielded strength increases of 9% and 5%, respectively, compared to the control mix | The observed reduction in water absorption and sorptivity in biochar-modified concrete correlates with a decrease in workability as biochar content increases. This improved microstructure can be attributed to the densification effect imparted by the biochar particles |
| Liu et al.25 | Bamboo biochar | 4% of cement weight | Due to its high silicon and aluminum oxide ratios, bamboo biochar exhibits a pozzolanic effect in mortar. At 7 days, the compressive strength of mortars with 4% biochar replacement reached 10.9 MPa, representing 58.7% of the strength achieved at 40 days with an increase rate of 32.9%. This indicates that bamboo biochar contributes positively to the compressive strength of mortar, particularly at early ages | A 1 wt% replacement of cement with bamboo biochar represents the optimal dosage for maximizing crack resistance in biochar mortar, while replacements between 1 and 3 wt% demonstrate a consistently positive effect. The beneficial effects of bamboo biochar on compressive strength and fracture toughness are attributed to its filling and self-curing effects within the cement matrix, as well as its participation in hydration reactions |
| Ling et al.26 | Wood waste | 3% of cement weight | With increasing wood waste biochar fineness, a decreasing trend followed by an increasing trend was observed for both rapid carbonation depth and the chloride diffusion coefficient. Optimal reductions of 17.9% and 32% in these parameters, respectively, were achieved with biochar additions of 1–3%. A biochar dosage of 3 wt% yielded the maximum compressive strength, representing an 18.48% increase. However, beyond a 5 wt% addition, biochar incorporation resulted in a decline in compressive strength, although the resulting values remained superior to those of the control mix | At a 3% cement replacement ratio, wood waste biochar enhanced the cement hydration, resulting in an increased formation of hydration products. Complementary SEM and XRD analyses revealed that the addition of biochar also enhanced the concrete microstructure by providing additional nucleation sites and filling internal pores |
| Qing et al.27 | Corn straw | 1–3% of cement weight | A 1 wt% replacement of cement with corn straw biochar (CSB) was determined to be optimal for compressive strength, resulting in a 5.3% increase. In three-point bending tests, concrete modified with a 3 wt% CSB replacement exhibited enhanced load-bearing capacity and crack resistance, with a reduced damage scale at equivalent loading stages. Compared to plain concrete (PC), the CSB-modified concrete (RHB3) showed increases in peak load of 7.2%, 5.1%, and 11.4% and increases in initial fracture toughness of 46.8%, 32.3%, and 36.7% at 7, 14, and 28 days, respectively. Concurrently, the allowable damage scale decreased by 22.2%, 29.0%, and 11.3% at these respective ages | The addition of biochar decreased both the ductility and fracture energy of the concrete. At a 3 wt% biochar addition, the fracture energy of the modified concrete, compared to control mix, decreased by 3.6% at 7 days, 33.3% at 14 days, and 33.2% at 28 days |
| Jia et al.28 | Municipal solid waste | 1–10% of cement weight | Replacing less than 5% of cement with biochar resulted in a 9.2% increase in compressive strength. Biochar also significantly enhanced both the flexural and splitting tensile strength of the concrete, leading to a 20% improvement in toughness at a 10% cement replacement level. However, concrete containing a very small proportion of biochar demonstrated lower freeze–thaw resistance compared to both the control and the 10% replacement mixtures | The water demand for normal consistency increased, while the setting time decreased, with increasing biochar replacement of cement. This behavior is attributed to the hydrophilic and porous nature of biochar. At a 30% biochar dosage, minimal slump was observed, and the plasticity of the concrete was significantly reduced |
| Pang et al.29 | Waste synthetic eucalyptus plywood boards | 3% of cement weight | A total of 168 concrete specimens were cast with four biochar (RHB) addition levels (0%, 3%, 5%, and 10%) to investigate mechanical strength at 7 and 28 days. Following exposure to elevated temperatures, mass loss, residual strength, microstructure, and stress–strain behavior were also analyzed. Results indicated that a 3% RHB addition significantly enhanced mechanical properties under ambient conditions. Specifically, the incorporation of 3% RHB increased residual compressive strength by 4.8%, 26.3%, and 25% at 300 °C, 500 °C, and 700 °C, respectively, compared to the control specimens | The optimal RHB content of 3 wt% enhances micro-filling effects and promotes secondary cement hydration, resulting in increases of 9.9%, 7.2%, and 6.8% in compressive strength, splitting tensile strength, and flexural strength, in order, for 28-day cured biochar concrete samples compared to the control concrete at ambient temperature |
| Mekky et al.30 | Alum sludge | 5% of cement weight | Concrete containing 5% alum sludge biochar exhibited the highest compressive strength (31 MPa) among the tested replacement percentages, closely approaching that of the control mix at 33.35 MPa. The 5% alum sludge biochar concrete mix also demonstrated a slight improvement in durability, specifically in terms of permeability and abrasion resistance, attributed to the enhanced pozzolanic activity of the biochar. Furthermore, life cycle assessment revealed a substantial environmental advantage for the 5% biochar mix, showing a 32.2% reduction in global warming potential compared to conventional concrete | Analytical analysis confirms the pozzolanic nature of alum sludge biochar |
| Hylton et al.31 | 16 various biochar types | 10% of cement weight | Following 28 days of limewater curing, all 16 biochar mortar samples exhibited compressive strengths comparable to or exceeding those of the control. At a 10% cement replacement level, milled biochar generally yielded comparable or enhanced compressive strength after a 28-day curing period, irrespective of feedstock or pyrolysis conditions within the tested subset. While performance varied among biochar types, white hardwood biochar demonstrated a particularly notable improvement, exceeding the control compressive strength by slightly over 48% | This study demonstrates that a diverse range of biochar compositions, when milled to a particle size below their inherent microporosity, can effectively serve as a 10% cement replacement |
| Wang et al.32 | Peanut shell-based biomass | 10–20% of cement weight | The incorporation of 10%–20% biochar by mass resulted in a significant increase in tensile strain capacity and a reduction in crack opening width. This improvement is attributed to the presence of fine biochar particles within the fiber/matrix interfacial transition zone, which weakens the fiber-matrix bond strength. Concurrently, while inducing a minimal compressive strength reduction of approximately 10%, the inclusion of biochar offers the benefit of a reduced carbon footprint for engineered cementitious composites, thereby enhancing its sustainability | Incorporating biochar can reduce both total and specific carbon emissions by up to 58.3% without negatively impacting compressive strength or tensile performance. Furthermore, the use of biochar contributes to lower overall costs due to its lower unit price compared to cement and the potential for reduced carbon taxes. This cost-effectiveness, combined with the significant reduction in carbon emissions, underscores biochar’s potential to enhance sustainability in construction. Consequently, incorporating 10% and 20% biochar presents a sustainable, cost-effective, and mechanically sound solution for various construction applications |
This study introduces a novel rice husk-derived biochar as a potential concrete admixture. The key innovation is the biochar’s unique chemical composition, characterized by a substantially higher content of silicon and aluminum oxides, exceeding 43% by the total weight and approximately 92% of the mineral weight. This contrasts sharply with conventional rice husk biochar used in previous research, where these oxides constituted less than 20%19–21. This elevated silicon and aluminum oxide content is expected to enhance the concrete’s pozzolanic activity, leading to improved strength, durability, and microstructure. Beyond the unique chemical composition of the RHB, this study’s novelty lies also in the comprehensive investigation of the resulting concrete’s radiation shielding properties to provide novel insights into fast neutrons and gamma ray attenuation behavior of RHB-amended concrete.
Materials properties
Cement
In this study, Type I Ordinary Portland Cement (OPC) with a 42.5 N strength grade, conforming to ASTM C15033, was utilized. This OPC was sourced from Wadi El-Nile cement company. The physical and mechanical properties of the OPC are detailed in Table 2, while its chemical composition, determined via X-Ray Fluorescence (XRF) analysis, is presented in Table 3. Specific gravity was determined according to ASTM C18834. The initial and final setting times, along with standard consistency, were evaluated using a Vicat apparatus (Fig. 1a). Soundness was assessed using a Le Chatelier apparatus (Fig. 1b) following BS EN 196–3:200535. Compressive strength testing was performed after 28 days of curing, in accordance with ASTM C109/C109M-1136, to verify the mechanical performance of the resulting concrete. Particle size distribution of the OPC, determined using laser scattering particle size analysis, is illustrated in Fig. 1c, revealing a mean particle size of approximately 9 μm. Mineralogical and microstructural characterization was conducted using X-ray diffraction (XRD) with the results presented in Fig. 1d. XRD analysis revealed the presence of the principal crystalline phases in Portland cement clinker: alite (C3S), belite (C2S), tricalcium aluminate (C3A), tetracalcium aluminoferrite (C4AF), and gypsum. This mineralogical profile, consistent with the chemical composition determined by XRF, demonstrates that the cement’s composition is in accordance with the expected mineralogy for its type, thereby confirming its quality and compliance with relevant industry standards.
Table 2.
Properties of used cement.
| Physical properties | Soundness (mm) | Mortar compressive strength (MPa) | |||||||
|---|---|---|---|---|---|---|---|---|---|
| Color | Specific gravity | Initial setting time (min) | Final setting time (min) | Surface area(cm2/g) | Standard consistency (w/c%) | 3 days | 7 days | 28 days | |
| Grey | 3.16 | 120 | 210 | 3550 | 28% | 1 | 25 | 33 | 43 |
Table 3.
Chemical composition of used cement (% mass).
| SiO2 | CaO | Al2O3 | Fe2O3 | MgO | SO3 | Na2O | P2O5 | Cl | TiO2 | LOI* |
|---|---|---|---|---|---|---|---|---|---|---|
| 21.52 | 61.89 | 3.8 | 1.88 | 2.26 | 2.81 | 0.55 | 0.21 | 0.14 | 0.51 | 3.11 |
* LOI: Loss on Ignition at 1000 °C.
Fig. 1.

(a) Vicat apparatus, (b) Le Chatelier instrument, (c) Particle size distribution of cement, (d) XRD pattern of the used cement.
Aggregates
Natural siliceous sand, sampled in accordance with ASTM D7537, served as the fine aggregate in this study. Particle size distribution was determined through sieve analysis following ASTM C13638 to verify compliance with design specifications and standard limits. The results of the sieve analysis are presented in Fig. 2a. The calculated Fineness Modulus (FM) of 2.47 indicates a typical mean particle size, consistent with ASTM C33 requirements. The physical properties of the fine aggregate are summarized in Table 4. For coarse aggregates, crushed dolomite with a nominal maximum size 19 mm was used as the coarse aggregate in all concrete mixes. Gradation testing, essential for design compliance and adherence to standard limits, was performed using sieve analysis according to ASTM C13639, as shown in Fig. 2b. The physical properties of the coarse aggregate are summarized in Table 4. The crushing value was determined according to BS 812 Part 11040. ASTM C12841was used to determine specific gravity and absorption. Bulk density and voids content were measured according to ASTM C2942. The content of fine materials was assessed according to ASTM C14243. The procedures employed for determining the physical properties of the coarse aggregate are illustrated in Fig. 2c,d.
Fig. 2.

(a) Particle size distribution of sand, (b) particle size distribution of dolomite, (c) crushing test of dolomite, and (d) absorption test of dolomite.
Table 4.
Physical properties of the used aggregates.
| Property | Specific gravity | Bulk density (kg/m3) | Voids (%) | Absorption (%) | Clay and fine materials (%) | Crushing value (%) | Fineness modulus |
|---|---|---|---|---|---|---|---|
| Fine Aggregate | 2.55 | 1745 | 31.6 | 0.8 | 1 | – | 2.47 |
| Coarse Aggregate | 2.68 | 1675 | 37.5 | 0.45 | 0.5 | 19 | – |
Water and superplasticizer
Clean potable water conforming to the standards outlined in ASTM C1602/C1602M44, was used for concrete specimen mixing and curing. On the other hand, biochar particles exhibit a high porosity and water absorption capacity, which can significantly affect the workability of concrete mixtures. The high porosity of biochar leads to increased water absorption, reducing the available free water in the mix and thus lowering concrete fluidity. To address this challenge and enhance workability, the addition of chemical admixtures, specifically superplasticizers (SP), is essential. These admixtures improve the distribution of biochar particles within the mix and counteract the negative effects of water absorption. A commercially available SP, Sikament NN, supplied by the Egyptian branch of Sika Company, was incorporated during mixing at a constant dosage of 0.395% by cementitious materials weight. This SP meets the requirements for Type (F) chemical admixtures as specified in ASTM C49445. Key characteristics of the SP are presented in Table 5. The inclusion of the SP was driven by concerns over the potential difficulty in achieving a uniform concrete mixture and the expected reduction in workability due to biochar’s high-water absorption. Furthermore, the relatively low water-to-cementitious materials (w/c) ratio employed could also negatively impact mixture workability. Figure 3 shows the appearance of the used mixing and curing water in addition to the used SP.
Table 5.
Properties of the used superplasticizer.
| Manufacturer’s recommended ratio | Color | Raw material | Density | PH value | Solid content ratio | Category |
|---|---|---|---|---|---|---|
| 1% to 3% of cement weight | Dark Brown Liquid | Sulfonated Naphthalene Formaldehyde | 1.2 kg/L | (8.5 ± 1) | 30% | high-range water reducer derived from modified polycarboxylates |
Fig. 3.

(a) Mixing and curing water, and (b) the used SP (Sikament NN).
Rice husk biochar (RHB)
As previously described, biochar is a carbon-rich material produced via pyrolysis of organic biomass under oxygen-deprived conditions. This process involves heating organic materials, such as agricultural waste, wood chips, or manure, to elevated temperatures, inducing thermochemical decomposition of the biomass, releasing volatile gases, and leaving a carbon-rich solid residue. The properties of biochar are contingent upon the type of biomass used and the specific pyrolysis parameters, including temperature, heating rate and residence time. Biochar presents significant potential for enhancing environmental sustainability by sequestering carbon for extended periods, thereby reducing greenhouse gas emissions and mitigating climate change. This study investigates RHB to explore its influence on the physical and mechanical properties, and, for the first time, the radiation shielding properties of concrete. RHB, shown after a grinding process in Fig. 4a, is an innovative material derived from the thermal decomposition of rice husks, a byproduct of rice milling. Rice husk was pyrolyzed at a temperature exceeding 600 °C using a pilot-scale continuous pyrolysis unit. The resulting biochar was analyzed by Eurofins laboratories, an institution accredited by the European Biochar Certificate (ERHB). The analysis encompassed ultimate analysis (CHNSO) to determine organic carbon content and calculate H/C and O/C molar ratios, indicative of carbon stability.
Fig. 4.

(a) Appearance of RHB powder after grinding, (b) grinding machine, (c) TEM image of RHB, (d) Particles size distribution of RHB, and (e) XRD patterns of RHB powder.
Additionally, ash content, moisture content, trace metal content, and polycyclic aromatic hydrocarbon content were assessed. The results of the complete analysis of the used RHB are provided in Appendix 1. The analysis report details the parameters, methodology, applicable ERHB parameter thresholds, and the results on both as-received and dry bases. The rice husk biochar exhibits a 44.8% organic carbon fraction (dry basis) and demonstrates reasonable carbon stability, as indicated by an H/Corg ratio of 0.23. While the ash content is relatively high at 49.9% (dry basis) compared to biochar derived from woody feedstocks, however, its composition is of considerable importance for construction applications. No thresholds are specified for trace metals in biochar intended for basic materials; therefore, this rice husk biochar is suitable for use in building materials. Regarding organic contamination, the polycyclic aromatic hydrocarbons (PAHs) analysis revealed a total of 2.2 mg/kg for the 16 EPA PAHs, representing favorable results. No contamination was detected for the 8 EPA PAHs, benzo(e)pyrene, or benzo(j)fluoranthen, further confirming the suitability of this rice husk biochar for use in building materials.
Following the initial preparation process, and in order to achieve a final particle size suitable for use as a partial cement replacement, with a fineness higher than that of ordinary Portland cement, the RHB was ground using an appropriate grinding machine, as shown in Fig. 4b. The mentioned figure shows a vibratory pulverizer (ring mill), containing two rings and a puck within a 20.32 cm diameter grinding bowl, was utilized to grind the RHB particles for five minutes for each sample consists of 500 g. This grinding equipment is recognized for its high efficiency, rapidly reducing various wet or dry materials (such as minerals, rocks, or soil) to a + 400 mesh fineness within a single minute. The current investigation utilized RHB, which exhibits a high silica content (Table 6) and a porous structure, as confirmed by the Transmission Electron Microscopy (TEM) image in Fig. 4c. These characteristics suggest RHB’s potential as a partial cement substitute in concrete. With a specific surface area of 3900 cm2/gm and a density of approximately 1.3 g/cm3, RHB exhibits appropriate pozzolanic characteristics. These properties enable it to significantly enhance concrete strength and durability.
Table 6.
Chemical composition of RHB powder (% mass).
| SiO2 | CaO | Al2O3 | Fe2O3 | MgO | K2O | Na2O | SO3 | P2O5 | Cl | LOI |
|---|---|---|---|---|---|---|---|---|---|---|
| 26.30 | 0.33 | 16.90 | 0.17 | 0.29 | 1.16 | 0.27 | 0.68 | 0.27 | 0.40 | 53.20 |
As presented n Table 6, the RHB used contains a high proportion of silicon and aluminum oxides, constituting 43.2% of the total weight and approximately 92.37% of the weight of the ash mineral compounds in RHB, excluding carbon dioxide. When incorporated into concrete, RHB offers several advantages. Its high surface area and porosity contribute to improved water retention and reduced permeability, potentially enhancing the concrete’s resistance to cracking and environmental degradation. The pozzolanic oxides in RHB react with calcium hydroxide in the cement paste to form additional calcium-silicate-hydrate (C-S–H), thereby increasing concrete strength and durability. Furthermore, incorporating biochar into concrete can significantly reduce the carbon footprint of construction materials, promoting sustainability through the utilization of agricultural waste and reduced reliance on traditional Portland cement. However, challenges remain regarding the use of RHB in concrete. One primary concern is the potential variability in RHB quality, which can affect concrete workability, consistency, and performance. Careful control of the RHB production process is necessary to ensure uniformity in its physical and chemical properties. Additionally, while biochar can improve certain properties of concrete, it may also reduce workability, necessitating the use of superplasticizers or other admixtures to achieve the desired consistency. The particle size distribution of the RHB used is shown in Fig. 4d, with an average particle size of 17.5 µm. The XRD scan pattern (Fig. 4e) demonstrate the amorphous nature of the biochar particles. The mineralogical composition of RHB show a partially amorphous diffractogram since a broad band between 2theta = 15 to 2theta = 25 of the carbon diffraction is observed, indicating an amorphous carbon structure with randomly oriented aromatic sheets as detected by (Dehkhoda et al. 2014)46. Additionally, the low intensity sharp peaks correspond to miscellaneous inorganic components identified by quartz, graphite and coquimbite minerals, where the coquimbite is a secondary sulfate mineral which occurs due to oxidation process of iron sulfide and crystallized during the biochar production process.
Experimental program and test setup.
Preliminary compressive strength test on RHB mortar
A preliminary compressive strength test was conducted on cement mortar cubes (Fig. 5) with dimensions of 50 × 50 × 50 mm at curing age of 28 days to evaluate the suitability of the designed RHB replacement ratios before utilizing them as a partial cement substitute in concrete. Standard mortar proportions, as per ASTM C109/C109M36, consist of one part cement and 2.75 parts dry natural siliceous sand by weight, with a water-cement ratio of 0.485. The results, presented in Fig. 6, demonstrate that the optimal RHB replacement ratio is 15%, resulting in 8.71% improvement in compressive strength compared to the control mix. Furthermore, preliminary findings indicate that addition ratios exceeding 20% may negatively impact the compressive strength of the mortar cubes, as evidenced by a strength reduction of 2.07% relative to the control mix at a 25% substitution ratio. Based on these observations, the substitution ratios employed appear suitable for application in concrete mixes.
Fig. 5.
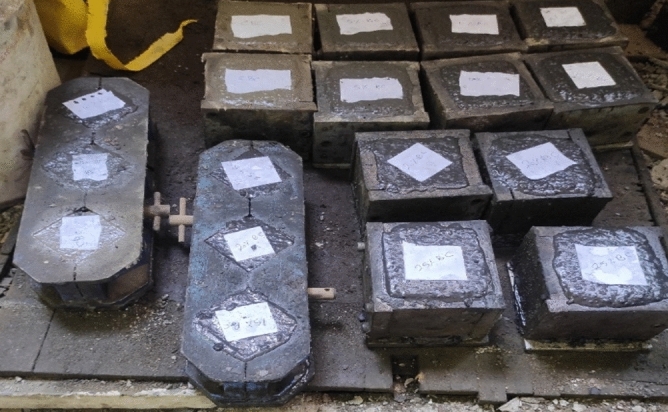
Sample of RHB mortar and concrete cube specimens.
Fig. 6.

Compressive strength of mortar cubes.
Concrete mix design
The experimental program aimed to design and evaluate ordinary concrete mixes to assess the mechanical, physical, and radiation shielding properties of RHB as a partial cement replacement material. Concrete mixes were prepared following the guidelines outlined in the ACI 211.1 method47, ensuring consistency and comparability. For the control concrete mix, the ingredients per cubic meter (1 m3) were as follows: 380 kg of cement, 1190 kg of coarse aggregate, 720 kg of fine aggregate, and 142.5 kg of water, with a detailed breakdown provided in Table 7. The (w/c) ratio was maintained at 0.375 to ensure a balance between strength and workability, while an SP dosage of approximately 0.395% by cementitious materials weight was incorporated to enhance the mixture’s fluidity and homogeneity. Although this w/c ratio is relatively low compared to conventional concrete mixes, it was deemed appropriate for ensuring sufficient workability when combined with a high-range water reducer admixture, such as Sikament NN. Furthermore, a lower w/c ratio was essential to achieve enhanced interfacial bonding and densification, particularly given RHB’s porous structure and its tendency to absorb water. RHB was introduced into the concrete mix at five increased replacement levels, extending up to 25% of cement weight. This aligns with recent studies that have explored the use of different biochar types at high substitution rates31,32.
Table 7.
Mix design of the investigated RHB concrete mixes in (kg/m3).
| Mix description | ID | Cement (kg) | Aggregate (kg) | Water (lit) | w/c ratio | SP (kg) | RHB (kg) | |
|---|---|---|---|---|---|---|---|---|
| Dolomite | Sand | |||||||
| Control mix | CO | 380 | 1190 | 720 | 142.5 | 0.375 | 1.5 | - |
| 5% RHB | 5RHB | 361 | 1190 | 720 | 142.5 | 0.375 | 1.5 | 19 |
| 10% RHB | 10RHB | 342 | 1190 | 720 | 142.5 | 0.375 | 1.5 | 38 |
| 15% RHB | 15RHB | 323 | 1190 | 720 | 142.5 | 0.375 | 1.5 | 57 |
| 20% RHB | 20RHB | 304 | 1190 | 720 | 142.5 | 0.375 | 1.5 | 76 |
| 25% RHB | 25RHB | 285 | 1190 | 720 | 142.5 | 0.375 | 1.5 | 95 |
The inclusion of high RHB substitution rates is justified by the growing recognition of biochar as a multifunctional material offering numerous sustainability benefits. Biochar contributes to carbon sequestration, as it is derived from biomass that draws down atmospheric carbon during its growth cycle, followed by the stabilization of such carbon via pyrolysis, making its use in concrete an effective strategy for reducing the carbon footprint of construction materials. Furthermore, biochar’s role in sustainability extends to its potential for waste valorization, as its production often involves agricultural by-products like rice husks, which would otherwise be discarded or burned, contributing to environmental pollution. Despite these advantages, the mechanical and physical properties of the resulting concrete must be carefully optimized, as excessive RHB content can adversely impact strength and workability due to increased water absorption and reduced binder content. This experimental program, therefore, aimed to strike a balance, leveraging the benefits of RHB at higher substitution levels, up to 25% replacement rate of cement weight, while ensuring the concrete maintains adequate performance.
Specimens’ preparation and curing
To determine the compressive strength of concrete samples incorporating the investigated RHB, steel molds with dimensions of 100 × 100 × 100 mm were prepared for casting the various concrete mixes. Additionally, steel cylinders with a diameter of 100 mm and a height of 200 mm were prepared for tensile strength measurements. Concrete specimens were prepared and cured in accordance with ASTM C192/C192M48, which outlines standardized procedures for mixing, casting, and curing concrete in laboratory conditions. For the mixing procedure of the various mixtures, coarse and fine aggregates were initially mixed for two minutes, followed by the incorporation and mixing of cement and RHB for two minutes. Finally, the predetermined water quantities containing the liquid SP were added to the mixture, and mechanical mixing continued for an additional three minutes. Following casting, a mechanical vibrator was used to ensure proper compaction and surface finishing. After 24 h, the specimens were demolded and transferred to a curing tank containing potable water at room temperature and a relative humidity of at least 90%. Curing process continued for approximately 28 days. Subsequently, the specimens were removed from the curing tank and dried in an oven at 105 °C for two hours to eliminate residual moisture before testing. To minimize the risk of thermal cracking, the drying process was carefully controlled. This involved gradually ramping up the temperature and maintaining it for two hours, thereby ensuring uniform moisture removal and preventing the induction of thermal stress.
Tests setup
Physical properties of fresh concrete
To gain a deeper understanding of the influence of incorporating biochar as a partial replacement for cement in this study, the effects of various replacement ratios on the properties of fresh concrete were thoroughly examined and compared with those of the control mix. The investigated properties included initial and final setting times, standard consistency, and slump test performance. These parameters were selected to provide a comprehensive evaluation of how biochar affects the workability and fresh-state performance of concrete. Considering the highly porous structure of biochar, which can increase water absorption and retention, its inclusion may influence the water-cement ratio, setting times, and overall rheological behavior of the mix. This study aims to address these factors to clarify the role of biochar in modifying fresh concrete properties and its potential implications for practical applications.
Initial and final setting times denote the time required for cement paste to achieve a specified level of rigidity. Conversely, standard consistency signifies the water content necessary for a modified cement paste to attain a particular degree of stiffness. The initial and final setting times, along with consistency percentages for all formulated mixes, were determined using a Vicat needle apparatus. These measurements adhered to the guidelines outlined in ASTM C 19149. On the other hand, the slump cone test was conducted in accordance with the procedures specified in ASTM C143/C143M50. This test employed a standard slump cone with a height of 300 mm, a top diameter of 100 mm, and a base diameter of 200 mm.
Mechanical properties
Standard 100 mm cubes were employed to determine the compressive strength of concrete mixes with various RHB ratios. Three specimens from each mix were tested to obtain the average 28-day compressive strength, following the standards of BS EN 1239051. A uniaxial loading machine with a 3000 kN capacity was utilized to measure the compressive strength of all concrete specimens. The same machine was also used to determine the splitting tensile strength values of 100 mm diameter × 200 mm height cylindrical concrete specimens at 28 days of curing, following the standards of ASTM C49652. The splitting tensile strength was obtained by applying a compressive load along the length of the cylinders. The reported splitting tensile strength values represent the average of three tested cylinders under identical mix design. On the testing date, after 28 days of curing, concrete cylinders were positioned horizontally within the testing machine. A continuous load was then applied to the concrete cylinders until the failure point.
Microstructural analysis
Microstructural analysis of the various concrete specimens was conducted using XRD and Energy Dispersive X-ray Spectroscopy (EDX). XRD is a non-destructive technique that identifies the crystalline phases within a material through analysis of its distinct diffraction pattern53. It is fundamental for elucidating the complex processes of cement hydration by providing detailed information on the mineralogical composition and microstructural evolution of cementitious materials. This technique offers invaluable insights into the underlying mechanisms governing the development of cement paste properties. XRD is particularly useful for identifying the constituent minerals and distinguishing between crystalline (characterized by long-range atomic order) and amorphous (lacking long-range order) phases within a material. In concrete properties studies, XRD is routinely employed to analyze the properties and microstructural phases of various materials, including cement, crushed concrete powder, cement paste samples, and even supplementary cementitious materials such as nanomaterials and pozzolanic additives. In the present research, RHB powder was analyzed via XRD to confirm its chemical composition as determined by other methods and to verify its expected amorphous nature. Furthermore, six powdered samples from both the control and RHB-modified concrete mixes were subjected to XRD analysis to provide a microstructural basis for interpreting the observed mechanical performance. The samples were obtained by carefully crushing and sieving core fragments of 28-day cured concrete to a uniform particle size passing through a 75-micron sieve. To minimize the influence of coarse aggregates, only portions containing the cementitious matrix and fine aggregates were selected. XRD analysis was performed in accordance with ASTM C136554. For EDX, it’s an analytical technique employed for elemental characterization and analysis. Through its utilization, quantitative information concerning the relative abundance of various elements within a sample can be obtained55. EDX analysis was employed in this study to quantify the elemental composition of concrete samples, facilitating the comparison of their respective elemental weight percentages. These data served as crucial inputs for Monte Carlo and PhyX simulations of concrete radiation shielding, as detailed in Section "Experimental results", while simultaneously enabling the evaluation of how compositional variations, particularly the calcium-to-silicon (Ca/Si) ratio, influence the concrete’s mechanical strength. EDX measurements were conducted based on ASTM E1508 guidelines56.
Radiation shielding measurements
To assess the radiation shielding capabilities of the prepared concrete mixes, both simulation and computational approaches were employed. Monte Carlo simulations and Phy-X software were used to evaluate the radiation shielding performance against gamma and fast neutrons.
MC Simulation
Monte Carlo N-Particle (MC) is a general-purpose computational code that utilizes the Monte Carlo method for simulating the transport of gamma rays and neutrons in diverse environments57. In this work, the Monte Carlo method was used to simulate the movement of natural particles as well as to predict the gamma/neutron radiation performance of concrete shields in the energy range of gamma rays (γp) at 0.015 ≤ γp ≤ 15 MeV. The goal is to determine and compare the intensity of γ-rays before and after passing through the samples under study. This code is used in the study of radiation shielding, as well as calculating radiation doses in addition to detector design58. The simulation code features operation across a wide range of energy levels, accommodating all different engineering designs and enabling rapid calculations. Several data lines must be available to create the input file for the code, which include the distance between the source and the detector, the dimensions of the source, the elemental composition, and the chemical composition of the samples under study. As shown in Fig. 7, the geometric configuration for the simulation was created using a pre-set 3D setup. The data about the used code was detailed in the previous published work59. Also, the Phy-X/PSD (PhyX) was used to validate the MC results. It is an online tool for figuring out radiation doses and shielding characteristics60–62.
Fig. 7.

The 3-D view of the radiation attenuation system used for the prepared concrete samples.
The concrete shield consists of concrete cubes representing the control mix and the mixes containing increasing proportions of RHB, each with dimensions of 100 × 100 × 100 mm, where the shield thickness is 10 cm. This thickness is substituted into the Beer-Lambert equation as follows63:
 |
1 |
where μ is the linear attenuation coefficient (cm⁻1), T is the material thickness (cm), and C₀ and C are the initial and final counts of gamma-ray photons measured before and after shielding. Additionally, the values of other γ-ray attenuation parameters, such as the half-value thickness (HVT), tenth-value thickness (TVT), mean free path (MFP), effective atomic number (Zef), transfer factor (TF) and radiation protection (RPE) were calculated using the following equations.63–66:
 |
2 |
 |
3 |
 |
4 |
Each of these attenuation parameters provides unique insights into the shielding performance of concrete against γ-rays. The mass attenuation coefficient represents the attenuation per unit mass and is crucial for comparing materials with different densities, making it a fundamental parameter in material selection for radiation shielding. The HVT and TVT are the thickness of material required to reduce the gamma-ray intensity by half and tenth, offering a practical measure of the material’s efficiency in attenuating radiation. While HVT is often used for quick evaluations, TVT is more critical for scenarios requiring higher attenuation, highlighting the complementary nature of these parameters in assessing and optimizing shielding performance.
PhyX software
Phy-X is a web-based software tool designed for the assessment of radiation shielding parameters and radiation doses. It facilitates the determination of parameters including LAC, MAC, HVT, TVT, MFP, effective atomic number, and electronic density. These calculations are essential for the design of radiation protection materials used in X-ray and gamma-ray applications. The user-friendly interface allows input of the chemical composition of a given substance, enabling the computation of its properties across a broad spectrum of radiation energies and sources.
Experimental results
Physical properties results
Setting times and consistency results
Cement paste samples containing RHB powder obtained high standard consistency values compared to the control mix. This can be attributed to several factors, including the porous nature of RHB powder, which can absorb and retain a portion of the mixing water, which reduces the amount of free water available for flow and proper dispersion of cement particles. Consequently, a higher water dosage is necessary to compensate for this internal absorption and to ensure adequate workability67. The use of high replacement ratios contributed to this effect of increased standard consistency values, with an increase rate of 35.7% at 25% replacement ratio with cement. Regarding setting times for the cement paste samples containing RHB, a decrease in setting times was observed up to a 15% replacement ratio with cement, which supports the hypothesis of pozzolanic activity of this powder. This observation is consistent with findings from several studies68–70, which attributed the reduction in initial and final setting times upon biochar addition to its filler effect and absorption of free water. The shortened setting time is attributed to biochar particles acting as filler and moisture absorbers. This effect is further influenced by the hydrophilic or hydrophobic nature of the biochar, which depends on its production temperature and contributes to micro-filling71. However, when the replacement ratio exceeded this threshold, an increase in setting times was observed. The recorded increases were slight, with the maximum increase in final setting time in the 25 RHB mix reaching 7.14% compared to the control mix. These results provide a preliminary indication that the optimal replacement ratios for the type of biochar powder used in the current study range from 10 to 15% of the cement weight. Figure 8 shows the values of setting times and consistency values of all designed mixes in this study.
Fig. 8.

Setting times and consistency values of control and RHB cement pastes.
Slump test result
The effect of using RHB powder as a partial cement replacement material on slump values was investigated. As shown in Fig. 9, a significant decrease in slump values was observed. The porous microstructure and surface fineness of the RHB powder likely contributed to this reduction in slump, consequently affecting the workability of the resulting concrete. Biochar particles have been shown to retain higher amounts of free water within their porous structure68. Replacing 25% of the cement with RHB resulted in a 57.3% decrease in slump values compared to the control mix. These findings align with previous research on other biochar types, which indicates that increasing the proportion of biochar in concrete mixes generally leads to decreased workability72.
Fig. 9.
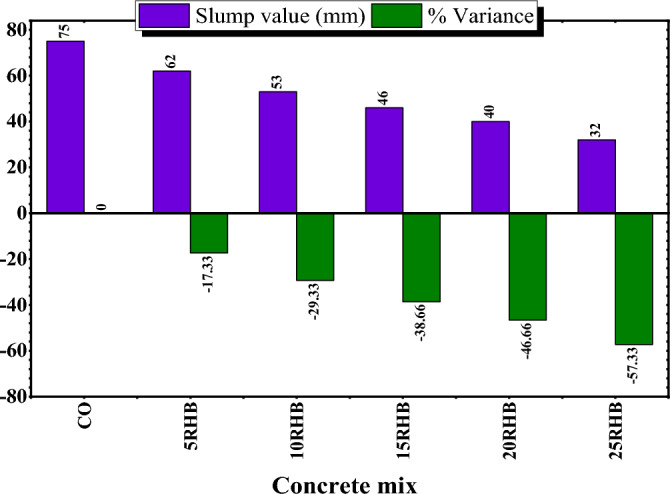
Slump values for control and RHB concrete mixes.
Mechanical properties results
Compressive strength results
The compressive strength results of the control and RHB concrete specimens, illustrated in Fig. 10, demonstrate the potential of RHB to enhance concrete compressive strength. The observed performance enhancement is due to the RHB’s chemical composition and moderate pozzolanic activity. This synergistic interaction leads to increased C-S–H gel formation, enhanced concrete density through void filling by fine RHB particles, and a refined microstructure with reduced pore connectivity, ultimately improving the overall mechanical performance of the concrete. Among the samples containing RHB powder, 10% replacement ratio with cement yielded the optimal improvement, resulting in 13.74% increase in compressive strength. This optimal replacement ratio aligns with the findings of Gomes et al.73, who reported that incorporating 5% and 10% water treatment sludge biochar enhanced the compressive strength of natural sludge mortar by 37% and 46%, respectively. Other studies have also demonstrated optimal concrete performance at a 10% biochar replacement ratio, albeit with varying degrees of improvement31,32. The biochar used in this study is characterized by a higher combined percentage of silicon and aluminum oxides (43.2%) compared to other biochar types previously incorporated into concrete. For example, rice husk-derived biochar used by Yang et al. (2021)74 contained only 16.51% of these oxides, which are crucial for promoting hydration reactions. In that study, this lower oxide content, coupled with the high porosity of the biochar particles, led to approximately 5.5% reduction in compressive strength value at 5% cement replacement ratio at curing age of 28 days. In the present study, 25% replacement ratio of cement with RHB achieved compressive strength value that are close to the control mix, highlighting the potential for incorporating substantial quantities of this biochar into concrete mixtures while maintaining satisfactory mechanical properties. This approach promotes the production of sustainable and environmentally friendly concrete. This sustainability stems from biochar’s nature as a stable form of carbon derived from organic matter that would otherwise release CO2 through decomposition or combustion. The biochar’s stable carbon structure remains within the concrete matrix, contributing to long-term carbon sequestration and reducing the concrete’s carbon footprint.
Fig. 10.

Compressive strength for control and RHB concrete specimens.
Tensile strength results
The highest tensile strength in concrete cylinders was observed in samples containing 15% biochar powder (Fig. 11). This optimal ratio for improving tensile strength at 15% RHB resulted in a 9.48% improvement rate compared to the control mix. Beyond this ratio, a slight decline in tensile strength was observed, although all mixes still outperformed the control. These results support the hypothesis of using rice husk biochar as a high-volume replacement for cement while maintaining satisfactory mechanical properties. It is worth mentioning that the maximum replacement ratio of 25% RHB maintained a tensile strength comparable to the control mix, with a slight improvement of approximately 1.83%. Furthermore, this approach offers significant environmental benefits, including reduced CO₂ emissions associated with cement production, promotion of waste recycling, and enhanced sustainability of construction materials. The investigation demonstrated a nuanced response of concrete properties to the incorporation of RHB. While a 10% RHB replacement level resulted in optimal compressive strength, likely attributed to enhanced moderate pozzolanic activity leading to increased C-S–H gel formation and improved microstructural refinement through void filling by fine RHB particles as mentioned previously, the optimum tensile strength exhibited a peak at 15% replacement level. The enhancement in the tensile strength of concrete using rice husk biochar as a partial cement replacement was also documented by Zeidabadi et al. (2018)75, who reported higher tensile strength values compared to the control mix, up to the maximum replacement level of 10% used in their study. RHB generally demonstrates a more pronounced positive effect on the tensile strength of concrete compared to its influence on compressive strength. This is evidenced by the fact that the optimal RHB replacement level for improving tensile strength was found to be 15%, which surpasses the 10% optimal level observed for compressive strength. Moreover, 25% RHB replacement level did not reduce the tensile strength value when compared to the control mix, while compressive strength showed a decline at this same replacement ratio. This preferential enhancement in tensile strength has been consistently reported in previous research28,76 and can be attributed to the unique characteristics of the biochar, such as its fibrous structure and inherent porosity, likely contribute to improved tensile strength through mechanisms like crack bridging and stress redistribution. The fibrous RHB particles may act as internal bridges, spanning and bridging microcracks that tend to form under tensile loading. Additionally, the inherent porosity of RHB may facilitate stress redistribution, mitigating stress concentrations and improving the overall tensile resistance of the concrete matrix.
Fig. 11.

Tensile strength for control and RHB concrete specimens.
Microstructural analysis results
XRD analysis
XRD analysis is a cornerstone technique for explaining the complexities of cement hydration. By providing detailed information on the mineralogical composition and structural evolution of cementitious systems, XRD offers invaluable insights into the mechanisms governing the development of hydration products. In this study, XRD analysis was conducted to investigate the mineralogical composition and hydration behavior of RHB-modified binders. The analysis was performed on powdered fragments carefully extracted from the inner core of 28-day moisture-cured concrete cubes. To minimize interference from coarse aggregates, only portions free of larger aggregates were selected. However, as the extracted material contained fine aggregates (sand), the analyzed samples are more accurately described as mortar-based rather than pure cement paste. XRD was carried out on six mortar samples corresponding to all RHB mix designs (5RHB, 10RHB, 15RHB, 20RHB, and 25RHB), and the results were compared with the reference control sample (CO), as shown in Fig. 12. XRD analysis successfully identified calcium silicate hydrate (CSH, PDF#00–033-0306) and Portlandite (CH, PDF#00–004-0733) as the primary hydration products in all samples, confirming their well-established roles in setting and strength development besides traces of Ettringite phase (PDF#00–041-1451) and quartz (SiO2, PDF#01–083-0539). The most important compound overriding the properties of concrete is CSH. It is formed after hydration reaction directly. A higher content of CSH results in a super interfacial transition zone (ITZ) layer, which leads to enhanced mechanical properties of concrete, especially the compressive strength. The presence of portlandite is a double-edged sword in concrete. On the one hand, the optimum content of portlandite reduces the pore volume of the concrete matrix and contributes slightly to strength development due to its crystalline form. Conversely, a higher or lower content of portlandite can lead to loss of strength or durability77. The presence of quartz (silica) particles helps in more densification of the concrete matrix and formation of CSH gel. It is also responsible for enhancing the ITZ between the aggregate and cement paste matrix. Ettringite plays a complex role in concrete. While controlled formation can contribute to a denser microstructure and improved properties, excessive formation can have detrimental effects78. Figure 12 demonstrates an increase in CSH peak intensity in RHB samples compared to the control mix, with the most pronounced peaks observed at 10% and 15% RHB incorporation. This increase coincides with a slight reduction in portlandite peaks, suggesting moderate pozzolanic activity of the RHB. The significant increase in CSH intensity observed in the 10% and 15% RHB samples compared to the control highlights the influence of RHB on the hydration process. RHB’s porous structure and functional groups can interact with cement components, potentially influencing hydration kinetics and the formation of hydration products. The high silicon and aluminum oxide content (approximately 43%) of the biochar used in this study suggests moderate pozzolanic potential. Furthermore, RHB incorporation can enhance concrete durability by reducing permeability, improving chloride ion resistance, and refining the overall microstructure, as reported in the literature63. XRD analysis provided further insights into the mineralogical transformations within the concrete matrix. While ettringite peaks were evident in both control and RHB samples, a slight reduction in their intensity was observed in the RHB samples, likely attributed to the consumption of calcium ions by pozzolanic reactions between the RHB and the cement. Conversely, the presence of quartz peaks, originating from the silica content within the RHB, was evident and their intensities generally increased with increasing RHB percentages. This observation, coupled with the enhanced CSH formation and the observed reduction in portlandite, indicates that the incorporation of RHB significantly alters the mineralogical composition of the concrete matrix. These findings provide valuable insights into the mechanisms underlying the observed improvements in the mechanical properties of the RHB-modified concrete.
Fig. 12.

XRD patterns of the control and RHB mixes.
EDX analysis results
As previously mentioned, EDX test was employed for chemical characterization and elemental analysis of the concrete samples, enabling a comparative analysis of elemental weight percentages. These results served two primary purposes: firstly, they provided input data for developing the simulation models of concrete radiation shielding behavior using MC codes and the PhyX software, as detailed in section "Radiation shielding performance". Secondly, they were used to evaluate and interpret changes in concrete mechanical strength by examining variations in specific parameters, particularly the Ca/Si ratio. Increased carbon levels were observed in concrete samples with higher RHB content, attributable to the fact that over 52% of the RHB used consisted of carbon, which volatilized during the XRF analysis used to determine the RHB’s chemical composition. The Ca/Si ratio proved to be a key parameter influencing the strength development of the various concrete formulations. By manipulating the Ca/Si ratio through careful selection of cementitious materials and admixtures, concrete properties can be tailored to meet specific design requirements, thus enhancing overall efficiency and durability. A clear trend emerged: a decrease in the Ca/Si ratio correlated with increased C-S–H polymerization, leading to improved compressive strength. As highlighted in the XRD analysis, replacing cement with RHB, which has moderate pozzolanic potential, promotes a reaction with the CH formed during cement hydration. This reaction consumes CH and generates additional C-S–H. During this process, silicon from the RHB integrates into the C-S–H structure, effectively decreasing the overall Ca/Si ratio within the C-S–H gels.The Ca/Si ratio within the C-S–H gels served as an indicator of the degree of polymerization of these hydrates within the hardened concrete matrix. A lower Ca/Si ratio typically indicates a higher degree of polymerization, reflecting the formation of longer C-S–H chains and consequently, enhanced mechanical properties. Consistent with the findings of Kim (2013)79, a reduction in the Ca/Si ratio within the C-S–H phase is associated with C-S–H chain elongation and increased polymerization. In agreement with Choudhary et al. (2021)80 and Dadsetan and Bai (2017)81, a strong correlation was observed between compressive strength and the Ca/Si ratio: a decrease in the Ca/Si ratio corresponded to an increase in compressive strength. These findings emphasize the critical role of C-S–H polymerization in enhancing concrete’s mechanical properties. Several literature studies82,83 also demonstrated a clear inverse relationship between the Ca/Si ratio and concrete compressive strength. Fig. 13 presents EDX patterns of the primary elements that constitute the hydration products in different concrete specimens, which include O, Ca and Si peaks as detailed by (wt.%) in Table 8. Notably, Fig. 13 also includes C peak, enabling a comparative analysis of carbon levels between RHB samples and the control. Figure 13 illustrates the comparison between EDX spectra for concrete specimens. Table 8 provides the EDX results for the different mixes and shows the Ca/Si ratio, which is an indicator for C-S–H in concrete which plays an important role in strength development of concrete as previously mentioned. The results show that the Ca/Si ratios of 5.95, 5.69, 4.84, 4.89, 5.11, and 5.6 for CO, 5RHB, 10RHB, 15RHB, 20RHB, and 25RHB, respectively. From the results, it can be concluded that the order in Ca/Si ratio is CO > 5RHB > 25RHB > 20RHB > 15RHB > 10RHB. EDX analysis revealed a correlation between Ca/Si ratio and mechanical properties, with lower Ca/Si ratios generally resulting in higher compressive strengths. While the order of Ca/Si ratios did not perfectly align with the order of compressive strengths, the correlation was strong. Notably, the 10% RHB sample, exhibiting the lowest Ca/Si ratio, demonstrated the highest compressive strength, supporting the observed trend.
Fig. 13.

Comparison of EDX spectra for different concrete mixes.
Table 8.
EDX and density results for different concrete mixes.
| Element | Composition (wt.%) | |||||
|---|---|---|---|---|---|---|
| CO | 5RHB | 10RHB | 15RHB | 20RHB | 25RHB | |
| O K | 38.12 | 39.01 | 40.9 | 41.11 | 39.85 | 38.46 |
| Ca K | 41.36 | 38.92 | 34.99 | 35.11 | 35.91 | 37.25 |
| Si K | 6.95 | 6.84 | 7.23 | 7.18 | 7.03 | 6.65 |
| Al K | 1.46 | 1.47 | 1.72 | 1.46 | 1.31 | 1.22 |
| Fe K | 1.68 | 1.53 | 1.63 | 1.46 | 1.25 | 1.23 |
| Mg K | 0.33 | 0.29 | 0.31 | 0.33 | 0.3 | 0.25 |
| Na K | 1.97 | 1.66 | 1.79 | 1.37 | 1.15 | 1.17 |
| C K | 8.11 | 10.27 | 11.43 | 11.97 | 13.19 | 13.75 |
| Density (ρ, g/cm3) | 2.45 | 2.52 | 2.57 | 2.6 | 2.58 | 2.55 |
| Ca/Si | 5.95 | 5.69 | 4.84 | 4.89 | 5.11 | 5.6 |
Radiation shielding performance
Gamma ray attenuation results
The LAC by MCNP and Phy-X in the photon energy (γp) range of 0.015–15 MeV is shown in Table 9. With a maximum Δ of 2.814%, the values of simulated LAC were in decent agreement with the values determined by Phy-X. The LAC value of the X-RHB concrete samples under investigation decreases as the γ-energy rises. For X-RHB concrete samples, the simulated LAC values decline as follows: 38.657 to 0.057 cm−1 for CO sample, 35.675 to 0.058 cm−1 for 5RHB sample, 33.815 to 0.058 cm−1 for 10RHB sample, 33.960 to 0.058 cm−1 for 15RHB sample, 33.625 to 0.058 cm−1 for 20RHB sample, and 33.390 to 0.057 cm−1 25RHB sample at γp range from 0.015 to 15 MeV. Figure 14a shows an abrupt decrease in LAC for each of the X-RHB concrete samples under study because of the PEE interaction, which has changed the cross-section (σp) with γ -3: 584–86. We observe that when the values of γp energy increase from 0.015 to 0.2 MeV, σp decreases significantly, and the PEE interaction consequently decreases. For X-RHB concrete samples, there is a strong tendency to decrease from 38.657 to 0.311 cm−1 for CO sample, 35.675 to 0.319 cm−1 for 5RHB sample, 33.815 to 0.324 cm−1 for 10RHB sample, 33.960 to 0.328 cm−1 for 15RHB sample, 33.625 to 0.325 cm−1 for 20RHB sample, and 33.390 to 0.322 cm−1 for 25RHB sample. The expected LAC in the γp range from 0.300 to 15 MeV decreases exponentially when γp from 0.300 to 15 MeV is increased, as shown in Fig. 14b,c. The CM interaction and the σp changes brought on by γp−1 are responsible for the exponential decline87. This effect can be explained by the fact that because of its increased speed, a larger γp has a lower tendency to interact with the atoms of the material. Consequently, the probability of γp interaction decreases, and the likelihood of γp scattering increases as the energy level rises. A smooth decline in LAC values followed a gradual decrease in σp with fewer electron-γp interactions, which was linked to an increase in γp values. So, the LAC values gradually decrease from 0.262 to 0.57 cm−1 for the CO sample, 0.269 to 0.058 cm−1 for the 5RHB sample, 0.274 to 0.058 cm−1 for the 10RHB sample, 0.278 to 0.058 cm−1 for 15RHB sample, 0.276 to 0.058 cm−1 for 20RHB sample, and 0.273 to 0.057 cm−1 for 25RHB sample. We noted that the 15RHB sample has the highest LAC because of its high density, On the contrary, the 25RHB sample is a less valuable sample.
Table 9.
The linear attenuation (LAC), obtained using MCNP code and PhyX software for the prepared X-RHB Concrete samples.
| Energy, (MeV) | The linear attenuation (LAC, cm−1) | ||||||||
|---|---|---|---|---|---|---|---|---|---|
| CO | 5RHB | 10RHB | |||||||
| PhyX | MC | φ. (%) | PhyX | MC | φ. (%) | PhyX | MC | φ. (%) | |
| 0.015 | 38.745 | 38.657 | 0.225 | 35.754 | 35.675 | 0.222 | 33.887 | 33.815 | 0.213 |
| 0.03 | 5.467 | 5.445 | 0.408 | 5.080 | 5.060 | 0.404 | 4.840 | 4.822 | 0.388 |
| 0.05 | 1.512 | 1.492 | 1.339 | 1.437 | 1.418 | 1.326 | 1.391 | 1.373 | 1.273 |
| 0.08 | 0.653 | 0.636 | 2.655 | 0.643 | 0.626 | 2.629 | 0.637 | 0.621 | 2.526 |
| 0.1 | 0.505 | 0.490 | 2.814 | 0.504 | 0.490 | 2.787 | 0.505 | 0.491 | 2.677 |
| 0.2 | 0.319 | 0.311 | 2.444 | 0.326 | 0.319 | 2.420 | 0.331 | 0.324 | 2.325 |
| 0.3 | 0.267 | 0.262 | 1.712 | 0.274 | 0.269 | 1.695 | 0.279 | 0.274 | 1.628 |
| 0.4 | 0.236 | 0.233 | 1.289 | 0.243 | 0.240 | 1.277 | 0.247 | 0.244 | 1.226 |
| 0.5 | 0.215 | 0.212 | 1.059 | 0.221 | 0.218 | 1.049 | 0.225 | 0.223 | 1.007 |
| 0.6 | 0.198 | 0.196 | 0.958 | 0.204 | 0.202 | 0.948 | 0.208 | 0.206 | 0.910 |
| 0.8 | 0.174 | 0.172 | 0.725 | 0.179 | 0.177 | 0.717 | 0.182 | 0.181 | 0.689 |
| 1 | 0.156 | 0.155 | 0.694 | 0.160 | 0.159 | 0.688 | 0.163 | 0.162 | 0.660 |
| 2 | 0.110 | 0.109 | 0.580 | 0.113 | 0.112 | 0.574 | 0.115 | 0.114 | 0.551 |
| 3 | 0.090 | 0.090 | 0.482 | 0.092 | 0.092 | 0.477 | 0.094 | 0.094 | 0.458 |
| 4 | 0.079 | 0.079 | 0.304 | 0.081 | 0.081 | 0.301 | 0.082 | 0.082 | 0.289 |
| 5 | 0.073 | 0.072 | 0.279 | 0.074 | 0.074 | 0.277 | 0.075 | 0.075 | 0.266 |
| 6 | 0.068 | 0.068 | 0.255 | 0.069 | 0.069 | 0.252 | 0.070 | 0.070 | 0.242 |
| 8 | 0.063 | 0.063 | 0.225 | 0.064 | 0.064 | 0.223 | 0.064 | 0.064 | 0.214 |
| 10 | 0.060 | 0.060 | 0.295 | 0.061 | 0.061 | 0.292 | 0.061 | 0.061 | 0.281 |
| 15 | 0.058 | 0.057 | 0.092 | 0.058 | 0.058 | 0.092 | 0.058 | 0.058 | 0.088 |
| Energy, (MeV) | The linear attenuation (LAC, cm−1) | ||||||||
|---|---|---|---|---|---|---|---|---|---|
| 15RHB | 20RHB | 25RHB | |||||||
| PhyX | MC | φ. (%) | PhyX | MC | φ. (%) | PhyX | MC | φ. (%) | |
| 0.015 | 34.031 | 33.960 | 0.207 | 33.694 | 33.625 | 0.202 | 33.456 | 33.390 | 0.200 |
| 0.03 | 4.862 | 4.844 | 0.376 | 4.814 | 4.797 | 0.367 | 4.778 | 4.761 | 0.363 |
| 0.05 | 1.400 | 1.382 | 1.234 | 1.387 | 1.370 | 1.207 | 1.375 | 1.358 | 1.194 |
| 0.08 | 0.643 | 0.627 | 2.448 | 0.638 | 0.622 | 2.396 | 0.631 | 0.616 | 2.370 |
| 0.1 | 0.510 | 0.496 | 2.595 | 0.505 | 0.493 | 2.540 | 0.500 | 0.487 | 2.513 |
| 0.2 | 0.335 | 0.328 | 2.253 | 0.333 | 0.325 | 2.205 | 0.329 | 0.322 | 2.181 |
| 0.3 | 0.282 | 0.278 | 1.577 | 0.280 | 0.276 | 1.543 | 0.277 | 0.273 | 1.526 |
| 0.4 | 0.250 | 0.247 | 1.187 | 0.248 | 0.246 | 1.162 | 0.246 | 0.243 | 1.149 |
| 0.5 | 0.228 | 0.225 | 0.975 | 0.226 | 0.224 | 0.954 | 0.223 | 0.221 | 0.944 |
| 0.6 | 0.210 | 0.208 | 0.882 | 0.209 | 0.207 | 0.863 | 0.206 | 0.204 | 0.853 |
| 0.8 | 0.184 | 0.183 | 0.667 | 0.183 | 0.182 | 0.653 | 0.181 | 0.179 | 0.645 |
| 1 | 0.165 | 0.164 | 0.639 | 0.164 | 0.163 | 0.625 | 0.162 | 0.161 | 0.619 |
| 2 | 0.116 | 0.116 | 0.534 | 0.115 | 0.115 | 0.522 | 0.114 | 0.114 | 0.516 |
| 3 | 0.095 | 0.095 | 0.443 | 0.094 | 0.094 | 0.434 | 0.093 | 0.093 | 0.429 |
| 4 | 0.083 | 0.083 | 0.280 | 0.083 | 0.083 | 0.274 | 0.082 | 0.082 | 0.271 |
| 5 | 0.076 | 0.076 | 0.257 | 0.075 | 0.075 | 0.252 | 0.075 | 0.074 | 0.249 |
| 6 | 0.071 | 0.071 | 0.234 | 0.071 | 0.070 | 0.229 | 0.070 | 0.070 | 0.227 |
| 8 | 0.065 | 0.065 | 0.207 | 0.065 | 0.065 | 0.203 | 0.064 | 0.064 | 0.201 |
| 10 | 0.062 | 0.062 | 0.272 | 0.061 | 0.061 | 0.266 | 0.061 | 0.061 | 0.263 |
| 15 | 0.058 | 0.058 | 0.085 | 0.058 | 0.058 | 0.083 | 0.057 | 0.057 | 0.082 |
Fig. 14.

The linear attenuation (a) in the PEE region, (b,c) in the Compton region for the X-RHB concrete samples.
The density of the prepared concretes plays important role in their shielding capacity, where the higher density the more efficient shielding performance concretes. Figure 15 shows an increase in the LACs of prepared concretes as their densities increased. According to the data presented in Fig. 15, the prepared 15RHB concrete has the highest ρ value (2.6 g/cm3) and it has also the highest LAC (0.164 cm−1 at 1 MeV). Then, the reduction in the prepared density is associated by a reduction in the LACs, where the fabricated concretes has the order of 20RHB (ρ = 2.58 g/cm3 and LAC = 0.163 cm−1) > 10RHB (ρ = 2.57 g/cm3 and LAC = 0.162 cm−1) > 25RHB (ρ = 2.55 g/cm3 and LAC = 0.161 cm−1) > 5RHB (ρ = 2.52 g/cm3 and LAC = 0.159 cm−1) > CO (ρ = 2.45 g/cm3 and LAC = 0.155 cm−1).
Fig. 15.

A correlation between the density and LACs of the prepared concretes.
The LAC for the mixed concrete samples and previously published doped concrete samples are compared in Fig. 16. The samples of this study achieved results equal to those of the previously studied and published samples at 10 MeV, 0.5 MeV, and 5 MeV. It presents a comparison of the UHPC samples with commercial concrete (mixes of PbO bulk powder with cement, with substitution ratios ranging from 1 to 5% %. Additionally, five other mixtures of GD bulk powder with cement increased the substitution rates to 9% and one hybrid mix combining 5% PbO and 7% GD64), Bashtar concretes (S-magnetite, S-scrap, ilmenite, H-serpentine, I-limonite, and B-magnetite88), and marble (MD) and granite (GD) waste dust of cement at a replacement ratio of 6%. Furthermore, two additional mixes with the cement weight of nano-alumina (NAl)63. The prepared concrete mix containing 15%BPA (15RHB) were higher than those compared (Bashtar concretes, 1BL, NA1, and (1–5) BG) at 0.5 and 10 MeV. Also, it higher than 1BL, 2BL, 1-9BG, MD6%, GD6%, NA1, and GD6% + NA1) at 5 MeV.
Fig. 16.

Comparison between the LAC for the mixed concrete samples with two previously published doped concrete samples.
Three popular techniques are used to measure the efficacy of radiation shielding: the mean free path (MFP), the half-value layer thickness (HVT), and the tenth-value layer thickness (TVT). This illustrates both the shielding material’s thickness and radiation-blocking capabilities. For a given photon energy, the radiation shielding performance is enhanced by lowering either value. This is because when the value is reduced, radiation is attenuated through a smaller zone. The values of HVT and TVT have an inverse relationship with the LAC. As the LAC dropped, the synthesized concrete samples’ HVT rose from 0.018 to 12.061 cm for CO sample, 0.019 to 12.036 cm for 5RHB sample, 0.020 to 11.991 cm for 10RHB sample, 0.020 to 11.870 cm for 15RHB sample, 0.021 to 11.974 cm for 20RHB sample, and 0.021 to12.106 cm for 25RHB sample at γp range from 0.015 to 15 MeV. The 15RHB sample has the lowest HVT value because of its highest LAC value, whereas the 25RHB sample has the highest HVT value because of its low LAC value, as shown in Fig. 17a. HVT values show a pattern similar to that of HVT, as shown in Fig. 17b, X-RHB concrete has the best radiation shielding properties, and the addition of high-density compounds enhances the γ attenuation capabilities within the selected γe range from 0.015 to 15 MeV. TVT values increased for the CO sample by 0.060 to 40.066 cm, the 5RHB sample by 0.065 to 39.984 cm, the 10RHB sample by 0.068 to 39.432 cm, the 15RHB sample by 0.068 to 39.778 cm, the 20RHB sample by 0.068 to 39.778 cm, and the 25RHB sample by 0.021 to 12.106 cm. Because of its low LAC value, the 25RHB sample has the highest TVT value, whereas the 15RHB sample has the lowest TVT value because of its highest LAC value. Understanding how well various materials absorb or scatter gamma rays is made easier by studying the MFP. The more effectively a material reduces ray passage through it, the lower the mean free path. Therefore, in order to protect people and equipment from the effects of gamma radiation, it is crucial to study the main free path when choosing and designing the materials used as protective shields in nuclear and industrial applications89. From 0.026 to 17.400 cm for CO, from 0.028 to 17.365 cm for 5RHB, from 0.030 to 17.300 cm for 10RHB, from 0.029 to 17.125 cm for 15RHB, from 0.030 to 17.275 cm for 20RHB, and from 0.030 to 17.466 cm for 25RHB, the MFP values for the X-RHB concrete samples increase as γp energies increase from 0.015 to 15 MeV. MFP values are lowest in the 15RHB sample and highest in the 25RHB sample as shown in Fig. 17c and that is due to the inverse relationship between MFP and LAC90.
Fig. 17.

Displays the concrete samples’ HVT, TVT, and MFP in relation to γ-energy.
For the X-RHB concrete samples, Fig. 18 displays graphs of the adequate atomic number versus γ-energy ranging from 0.015 to 15 MeV. A higher Zef value indicates a greater interaction with radiation through mechanisms like PEE/Compton interactions. Materials with a higher Zef value may be better for protecting against high-energy91. As the γp rises for the materials under study, the Zef values fall. The concrete’s Zef ranged from 18.407 to 12.525 for CO, 18.078 to 11.751 for 5RHB, 17.833 to 11.358 for 10RHB, 17.806 to 11.298 for 15RHB, 17.806 to 11.241 for 20RHB, and 17.821 to 11.251 for 25RHB concrete sample, depending on the energy spectra specified in this study. Given this, it is feasible to conclude that the radiation shielding efficiency of materials varies with the radiation energy; that is, certain substances may be more effective at higher or lower energies than others. Due to its content of elements with a high atomic number and its high density compared to the other samples in this study, the 15RHB sample had the highest value of Zef.
Fig. 18.

The Zef for the concrete samples as a function of photon energy.
Neutron attenuation results
The radiation scattering ability of biochar has been explored in a limited number of studies92,93, which have demonstrated improved shielding, particularly for neutrons, with increased biochar content. The high carbon content of biochar can enhance the neutron radiation shielding efficiency of concrete, surpassing its effect on γ-radiation shielding. This enhanced neutron shielding results from interactions between carbon atoms and neutrons, influenced by neutron energy, carbon isotope, and scattering angle. Carbon’s neutron scattering properties are invaluable for radiation protection in applications such as nuclear reactors and shielding and play a crucial role in nuclear experiments studying neutron interactions. Further research is warranted in this area. In this study, the FCS, HVLFCS, and λFCS values for the X-RHB concrete samples are displayed in Fig. 19a. In contrast to the other samples in this study, the 15RHB sample had the highest value for FCS (0.090 cm−1) and the lowest values for HVLFCS (7.699 cm) and λFCS (11.107 cm), indicating its efficacy and capability as a neutron shield. The high density and concentration of light elements (carbon and oxygen) was the cause. These C, and O have the highest microscopic effective removal cross section for fast neutron 0.0502 cm2/g for C, and 0.0405 cm2/g for O. Therefore, the fabricated concretes with high content of C + O have also the highest microscopic effective removal cross section, among the prepared samples. Thus, the concretes 15RHB and 20RHB which have C + O content reach 53.2 wt.% and 53.1 wt.%, respectively, have FCS 0.0900 cm−1 and 0.0897 cm−1 which are higher than the FCS of 25RHB (0.0887 cm−1), which has C +) content reach 53 wt.%. Fig. 19b compares the samples of this study with samples of concrete composites that were published previously61,63,64 . From this comparison, it is clear that the RHB samples were higher than most of the compared concretes. The 15RHB sample was found higher than those compared except GD6% and 9BG samples.
Fig. 19.

(a) The mixed concrete’s fast neutron removal cross-section (FCS), half value layer (HVLFCS), and relaxation length (λFCS); (b) Comparison of the fast neutron removal cross-section (FCS) for the prepared X-RHB samples and previously published glass and concrete samples.
Conclusions and future studies
This study investigated the use of rice husk-derived biochar as a partial cement replacement at increasing substitution ratios up to 25% by cement weight. The biochar employed, characterized by a novel chemical composition, offers an environmentally friendly alternative. By reducing cement usage, which is associated with energy-intensive production and substantial CO₂ emissions, this biochar functions as a carbon sequestration medium. Its stable structure resists decomposition, effectively locking carbon within its matrix and thus mitigating greenhouse gas emissions. Prepared to contain high percentages of silicon and aluminum oxides to enhance pozzolanic activity, the biochar’s impact on various physical, mechanical, and microstructural properties of ordinary concrete was evaluated. Furthermore, the effect of different replacement ratios on the resulting concrete’s radiation shielding properties was examined using simulation code. The key findings of this study are summarized below:
The incorporation of rice husk biochar (RHB) had a marginal effect on the setting times of the concrete mixes. Specifically, final setting times experienced a slight reduction of 4.76% compared to the control mix at replacement ratios up to 15%. However, beyond this replacement level, a minor increase in final setting time was observed, peaking at a 7.14% increase compared to the control mix at a 25% replacement ratio.
In terms of standard consistency, the incorporation of RHB had a more pronounced effect. Increasing the cement replacement ratio with RHB resulted in a consistent increase in water demand to achieve standard consistency, reaching a maximum increase of 35.7% compared to the control mix at 25% cement replacement ratio. This heightened water demand can be attributed to biochar’s porous nature, which enhances its water absorption capacity, and its high specific surface area, which requires more water to wet the particles and achieve the desired workability.
Consistent with the increased water demand for standard consistency, the workability of concrete mixes containing varying RHB replacement ratios exhibited a steady decline, as evidenced by reduced slump values. The maximum reduction in slump, reaching 57.3%, occurred at 25% replacement ratio, highlighting the necessity of incorporating plasticizers in biochar-containing concrete to maintain adequate workability.
Optimal cement replacement with RHB powder resulted in moderate improvements in both compressive and tensile strength. The optimal replacement levels were 10% for compressive strength and 15% for tensile strength, achieving improvements of 13.74% and 9.48%, respectively. These enhancements can be attributed to the chemical composition and pozzolanic activity of the RHB. The interaction between RHB and calcium hydroxide promotes the formation of additional C-S–H gel, increasing bond strength. Furthermore, the fine RHB particles enhance concrete density by filling voids within the cement matrix, which refines the microstructure by reducing pore connectivity, thereby enhancing the overall mechanical performance of the concrete.
Gamma-ray attenuation tests demonstrated that the prepared 15RHB concrete has the highest LAC (0.164 cm−1 at 1 MeV) among the prepared concretes due to its high density which reach 2.60 g/cm3. Then, the reduction in the prepared density is associated by a reduction in the LACs, where the fabricated concretes has the order of 20RHB (0.163 cm−1) > 10RHB (0.162 cm−1) > 25RHB (0.161 cm−1) > 5RHB (LAC = 0.159 cm−1) > CO (0.155 cm−1).
The 15RHB sample had the highest value for fast neutron removal cross-Sect. (0.090 cm−1) and the lowest values for HVLFCS (7.699 cm) and λFCS (11.107 cm), indicating its efficacy and capability as a neutron shield.
These findings indicate that the biochar type examined in this study, owing to its unique chemical composition, is a viable and environmentally sound cement replacement material, consistent with sustainability goals. Its efficacy lies in its capacity to decrease cement consumption, mitigate CO₂ emissions, and facilitate carbon sequestration. Expanding on this research, several promising avenues for future investigation emerge. These include assessing the biochar’s impact on the structural performance of diverse concrete elements, such as beams, slabs, and columns. Additionally, it is crucial to investigate the performance of biochar-amended concrete under harsh environmental conditions, including exposure to elevated temperatures or chemical attack, alongside thorough durability assessments. Moreover, future research could profitably explore the integration of this RHB type into other specialized concrete types, such as high-strength, ultra-high-performance, lightweight, and heavyweight concretes.
Supplementary Information
Acknowledgements
The Researchers would like to thank the Deanship of Graduate Studies and Scientific Research at Qassim University for financial support (QU-APC-2025).
Author contributions
Formal analysis and software: I.M.N., K.A.M., I.N.F.; Methodology: I.N.F., S.M.E., M.A., H.A.D. Resources: S.F., I.M.N., M.E.E. Validation: A.A.M, H.A.D. Analysis review: I.M.N., A.A.M., M.A.A; Data curation: I.M.N., M.M.A., A.A.M. Supervision: A.A.E., I.M.N., H.A.D. Investigation: I.N.F., M.A.A, A.A.M. Conceptualization: K.A.M., M.A. Writing-original draft: I.M.N., M.A.A., I.N.F.; Writing-review and editing: M.A., S.F. All Authors have read and agreed to the published version of the manuscript.
Data availability
All data generated or analyzed during this study are included in this published article.
Competing interests
The authors declare no competing interests.
Footnotes
Publisher’s note
Springer Nature remains neutral with regard to jurisdictional claims in published maps and institutional affiliations.
Supplementary Information
The online version contains supplementary material available at 10.1038/s41598-025-11987-8.
References
- 1.Akhtar, A. & Sarmah, A. K. Novel biochar-concrete composites: Manufacturing, characterization and evaluation of the mechanical properties. Sci. Total Environ.616, 408–416 (2018). [DOI] [PubMed] [Google Scholar]
- 2.Zhang, Z. & Wang, B. Research on the life-cycle CO2 emission of China’s construction sector. Energy Build.112, 244–255 (2016). [Google Scholar]
- 3.Mahmoud, A.A., et al. Synergizing machine learning and experimental analysis to predict post‐heating compressive strength in waste concrete. Structural Concrete (2025).
- 4.Senadheera, S. S. et al. Application of biochar in concrete–A review. Cement Concr. Compos.2023, 105204 (2023). [Google Scholar]
- 5.Rubin, E. S., Davison, J. E. & Herzog, H. J. The cost of CO2 capture and storage. Int. J. Greenhouse Gas Control40, 378–400 (2015). [Google Scholar]
- 6.Shourideh, M. & Yasseri, S. Uncertainties and barriers to carbon capture and storage acceptance & implementation. Int. J. Coast. Offshore Environ. Eng.8(4), 18–30 (2023). [Google Scholar]
- 7.Yaashikaa, P. et al. A critical review on the biochar production techniques, characterization, stability and applications for circular bioeconomy. Biotechnology reports28, e00570 (2020). [DOI] [PMC free article] [PubMed] [Google Scholar]
- 8.Shaheen, S. M. et al. Wood-based biochar for the removal of potentially toxic elements in water and wastewater: A critical review. Int. Mater. Rev.64(4), 216–247 (2019). [Google Scholar]
- 9.Oladele, S., Adeyemo, A. & Awodun, M. Influence of rice husk biochar and inorganic fertilizer on soil nutrients availability and rain-fed rice yield in two contrasting soils. Geoderma336, 1–11 (2019). [Google Scholar]
- 10.Wakudkar, H. & Jain, S. A holistic overview on corn cob biochar: A mini-review. Waste Manage. Res.40(8), 1143–1155 (2022). [DOI] [PubMed] [Google Scholar]
- 11.Odega, C. A. et al. Potential application and regeneration of bamboo biochar for wastewater treatment: A review. Adv. Bamboo Sci.2, 100012 (2023). [Google Scholar]
- 12.Ajien, A. et al. Coconut shell and husk biochar: A review of production and activation technology, economic, financial aspect and application. Waste Manage. Res.41(1), 37–51 (2023). [DOI] [PMC free article] [PubMed] [Google Scholar]
- 13.Manikandan, S. et al. Comprehensive review on recent production trends and applications of biochar for greener environment. Biores. Technol.388, 129725 (2023). [DOI] [PubMed] [Google Scholar]
- 14.Maljaee, H. et al. Incorporation of biochar in cementitious materials: A roadmap of biochar selection. Constr. Build. Mater.283, 122757 (2021). [Google Scholar]
- 15.Barbhuiya, S., Das, B. B. & Kanavaris, F. Biochar-concrete: A comprehensive review of properties, production and sustainability. Case Stud. Constr. Mater.2024, e02859 (2024). [Google Scholar]
- 16.Sun, Y. et al. Effects of feedstock type, production method, and pyrolysis temperature on biochar and hydrochar properties. Chem. Eng. J.240, 574–578 (2014). [Google Scholar]
- 17.McBeath, A. V., Wurster, C. M. & Bird, M. I. Influence of feedstock properties and pyrolysis conditions on biochar carbon stability as determined by hydrogen pyrolysis. Biomass Bioenerg.73, 155–173 (2015). [Google Scholar]
- 18.Suliman, W. et al. Modification of biochar surface by air oxidation: Role of pyrolysis temperature. Biomass Bioenerg.85, 1–11 (2016). [Google Scholar]
- 19.Muthukrishnan, S., Gupta, S. & Kua, H. W. Application of rice husk biochar and thermally treated low silica rice husk ash to improve physical properties of cement mortar. Theoret. Appl. Fract. Mech.104, 102376 (2019). [Google Scholar]
- 20.Javed, M. H. et al. Effect of various biochars on physical, mechanical, and microstructural characteristics of cement pastes and mortars. J. Build. Eng.57, 104850 (2022). [Google Scholar]
- 21.Gupta, S., Kua, H. W. & Dai Pang, S. Effect of biochar on mechanical and permeability properties of concrete exposed to elevated temperature. Constr. Build. Mater.234, 117338 (2020). [Google Scholar]
- 22.Ahmad, M. R., Chen, B. & Duan, H. Improvement effect of pyrolyzed agro-food biochar on the properties of magnesium phosphate cement. Sci. Total Environ.718, 137422 (2020). [DOI] [PubMed] [Google Scholar]
- 23.Qin, Y. et al. Evaluation of pervious concrete performance with pulverized biochar as cement replacement. Cement Concr. Compos.119, 104022 (2021). [Google Scholar]
- 24.Sirico, A. et al. Effects of biochar addition on long-term behavior of concrete. Theoret. Appl. Fract. Mech.122, 103626 (2022). [Google Scholar]
- 25.Liu, W., Li, K. & Xu, S. Utilizing bamboo biochar in cement mortar as a bio-modifier to improve the compressive strength and crack-resistance fracture ability. Constr. Build. Mater.327, 126917 (2022). [Google Scholar]
- 26.Ling, Y. et al. Effect of biochar dosage and fineness on the mechanical properties and durability of concrete. Materials16(7), 2809 (2023). [DOI] [PMC free article] [PubMed] [Google Scholar]
- 27.Qing, L., Zhang, H. & Zhang, Z. Effect of biochar on compressive strength and fracture performance of concrete. J. Build. Eng.78, 107587 (2023). [Google Scholar]
- 28.Jia, Y. et al. Effect of biochar from municipal solid waste on mechanical and freeze–thaw properties of concrete. Constr. Build. Mater.368, 130374 (2023). [Google Scholar]
- 29.Pang, X. et al. Enhancing fire resistance: Investigating mechanical properties of biochar-infused concrete under elevated temperatures. Constr. Build. Mater.435, 136813 (2024). [Google Scholar]
- 30.Mekky, K. M. et al. Evaluating environmental and economic benefits of using biochar in concrete: A life cycle assessment and multi-criteria decision-making framework. Case Stud. Constr. Mater.21, e03712 (2024). [Google Scholar]
- 31.Hylton, J. et al. Relevant biochar characteristics influencing compressive strength of biochar-cement mortars. Biochar6(1), 1–27 (2024). [Google Scholar]
- 32.Wang, T. et al. Sustainable and mechanical properties of Engineered Cementitious Composites with biochar: Integrating micro-and macro-mechanical insight. Cement Concr. Compos.155, 105813 (2025). [Google Scholar]
- 33.ASTM, C., ASTM C150: Standard Specification for Portland Cement (American Society for Testing and Materials, 2001).
- 34.Standard, A., C188: Standard Test Method for Density of Hydraulic Cement. (Annual Book of ASTM Standards, 2009).
- 35.EN, T., 196–1. Methods of testing cement–Part 1: Determination of strength. (European Committee for standardization, 2005).
- 36.ASTM, A., C109/C109M-11: Standard Test Method for Compressive Strength of Hydraulic Cement Mortars (American Society for Testing and Materials International, 2011).
- 37.ASTM D75, Standard Practice for Sampling Aggregates, American Society for Testing and Materials (ASTM), 2009 [Google Scholar]
- 38.ASTM C. 136/C136 M-19. Standard Test Method for Sieve Analysis of Fine and Coarse Aggregates (ASTM, Easton, 1993).
- 39.Astm, C., Standard test method for sieve analysis of fine and coarse aggregates. ASTM C136–06 (2006).
- 40.Standard, B., BS 812–110: 1990 Testing Aggregates-Part 110: Methods for Determination of Aggregate Crushing Value (ACV) (BSI, 1990).
- 41.Standard, A., C128–12, Standard Test Method for Density, Relative Density (Specific Gravity), and Absorption of Fine Aggregate (ASTM International, 2012).
- 42.Astm, A. C29 Standard Test Method for Bulk Density (“Unit Weight”) and Voids in Aggregate (American Society for Testing and Materials, 2009). [Google Scholar]
- 43.ASTM, C., 142–97,“Standard Test Method for Clay Lumps and Friable Particles in Aggregates,”. United States Am. Soc. Test. Mater, 1998: 1–2.
- 44.ASTM International. ASTM C1602/C1602M-22; Standard Specification for Mixing Water Used in the Production of Hydraulic Cement Concrete. ASTM International: West Conshohocken, PA, USA (2022). [Google Scholar]
- 45.ASTM International. ASTM C494/C494M-17; Standard Specification for Chemical Admixtures for Concrete. ASTM International: West Conshohocken, PA, USA (2017).
- 46.Dehkhoda, A. M., Ellis, N. & Gyenge, E. Electrosorption on activated biochar: Effect of thermo-chemical activation treatment on the electric double layer capacitance. J. Appl. Electrochem.44, 141–157 (2014). [Google Scholar]
- 47.ACI. ACI 211.1–19: Standard Practice for Selecting Proportions for Normal, Heavyweight, and Mass Concrete (American Concrete Institute, 2019).
- 48.ASTM. ASTM C192/C192M-18: Standard Practice for Making and Curing Concrete Test Specimens in the Laboratory (ASTM International, 2019).
- 49.ASTM International. ASTM C191–21; Standard Test Methods for Time of Setting of Hydraulic Cement by Vicat Needle. ASTM International: West Conshohocken, PA, USA (2021). [Google Scholar]
- 50.ASTM International. Standard Test Method for Slump of Hydraulic-Cement Concrete (ASTM C143/C143M-12). ASTM International, West Conshohocken, PA (2012). [Google Scholar]
- 51.BSI, B., 12390–3 (2019): Testing Hardened Concrete Part 3: Compressive Strength of Test Specimens (British Standards Institution, 2019).
- 52.ASTM-International. Standard Test Method for Splitting Tensile Strength of Cylindrical Concrete Specimens (ASTM C496/C496M-17) (ASTM International, 2017).
- 53.Mahmoud, A. A. et al. Elevated temperature effects on the compressive strength and radiation shielding capability of waste granite and marble concrete. Eur. Phys. J. Plus140(4), 302 (2025). [Google Scholar]
- 54.ASTM, A.C. 1365–18, Standard Test Method for Determination of the Proportion of Phases in Portland Cement and Portland-Cement Clinker Using X-Ray Powder Diffraction Analysis (ASTM International, 2018).
- 55.Abouelnour, M. A. et al. Valorization of nano additives effects on the physical, mechanical and radiation shielding properties of high strength concrete. Sci. Rep.15(1), 14440 (2025). [DOI] [PMC free article] [PubMed] [Google Scholar]
- 56.E1508, A. ASTM E1508–12: Standard Guide for Quantitative Analysis by Energy-Dispersive Spectroscopy (ASTM International, 2019).
- 57.Fattouh, M. S. et al. Impact of modified aggregate gradation on the workability, mechanical, microstructural and radiation shielding properties of recycled aggregate concrete. Sci. Rep.15(1), 1–23 (2025). [DOI] [PMC free article] [PubMed] [Google Scholar]
- 58.Sayed, M. et al. Investigation of Attapulgite Clays@Biochars@Nickel Oxide as a sustainable nanocomposite with superior radiation shielding characteristics. Radiat. Phys. Chem.2025, 112917 (2025). [Google Scholar]
- 59.El-Samrah, M. G. et al. Microstructure and radiation shielding capabilities of Al-Cu and Al-Mn alloys. Sci. Rep.14(1), 26721 (2024). [DOI] [PMC free article] [PubMed] [Google Scholar]
- 60.Singh, V. et al. Determination of mass attenuation coefficient for some polymers using Monte Carlo simulation. Vacuum119, 284–288 (2015). [Google Scholar]
- 61.Al-Ghamdi, H. et al. Investigation of gamma-ray and neutron protection competence of oxyfluoride aluminosilicate glasses reinforced with TbF3: Comparative study. Radiat. Phys. Chem.2024, 112105 (2014). [Google Scholar]
- 62.Şakar, E. et al. Phy-X/PSD: Development of a user friendly online software for calculation of parameters relevant to radiation shielding and dosimetry. Radiat. Phys. Chem.166, 108496 (2020). [Google Scholar]
- 63.Mahmoud, A. A. et al. Influence of sustainable waste granite, marble and nano-alumina additives on ordinary concretes: A physical, structural, and radiological study. Sci. Rep.14(1), 22011 (2024). [DOI] [PMC free article] [PubMed] [Google Scholar]
- 64.Fathy, I. N. et al. Enhancing mechanical properties and radiation shielding of high-strength concrete with bulk lead oxide and granodiorite. Nucl. Eng. Des.429, 113626 (2024). [Google Scholar]
- 65.Fathy, I. N. et al. Upgrading the compressive strength and radiation shielding properties of high strength concrete supported with nano additives of lead monoxide and granodiorite. Prog. Nucl. Energy180, 105562 (2025). [Google Scholar]
- 66.Malkapur, S. M. et al. Waste-polymer incorporated concrete mixes for neutron and gamma radiation shielding. Prog. Nucl. Energy135, 103694 (2021). [Google Scholar]
- 67.Senadheera, S. S. et al. Application of biochar in concrete–a review. Cement Concr. Compos.143, 105204 (2023). [Google Scholar]
- 68.Gupta, S., Kua, H. W. & Low, C. Y. Use of biochar as carbon sequestering additive in cement mortar. Cement Concr. Compos.87, 110–129 (2018). [Google Scholar]
- 69.Akinyemi, B. A. & Adesina, A. Recent advancements in the use of biochar for cementitious applications: A review. J. Build. Eng.32, 101705 (2020). [Google Scholar]
- 70.Wang, L. et al. The roles of biochar as green admixture for sediment-based construction products. Cement Concr. Compos.104, 103348 (2019). [Google Scholar]
- 71.Murali, G. & Wong, L. S. A comprehensive review of biochar-modified concrete: Mechanical performance and microstructural insights. Constr. Build. Mater.425, 135986 (2024). [Google Scholar]
- 72.Gupta, S., Kua, H. W. & Dai Pang, S. Biochar-mortar composite: Manufacturing, evaluation of physical properties and economic viability. Constr. Build. Mater.167, 874–889 (2018). [Google Scholar]
- 73.Gomes, S. D. C. et al. Water treatment sludge conversion to biochar as cementitious material in cement composite. J. Environ. Manage.306, 114463 (2022). [DOI] [PubMed] [Google Scholar]
- 74.Yang, X. & Wang, X.-Y. Hydration-strength-durability-workability of biochar-cement binary blends. J. Build. Eng.42, 103064 (2021). [Google Scholar]
- 75.Zeidabadi, Z. A. et al. Synthesis, characterization and evaluation of biochar from agricultural waste biomass for use in building materials. Constr. Build. Mater.181, 301–308 (2018). [Google Scholar]
- 76.Sirico, A. et al. Biochar from wood waste as additive for structural concrete. Constr. Build. Mater.303, 124500 (2021). [Google Scholar]
- 77.Siddique, S., Shrivastava, S. & Chaudhary, S. Influence of ceramic waste as fine aggregate in concrete: Pozzolanic, XRD, FT-IR, and NMR investigations. J. Mater. Civ. Eng.30(9), 04018227 (2018). [Google Scholar]
- 78.Thomas, M. et al. Diagnosing delayed ettringite formation in concrete structures. Cem. Concr. Res.38(6), 841–847 (2008). [Google Scholar]
- 79.Kim, J. J., Foley, E. M. & Taha, M. M. R. Nano-mechanical characterization of synthetic calcium–silicate–hydrate (C–S–H) with varying CaO/SiO2 mixture ratios. Cement Concr. Compos.36, 65–70 (2013). [Google Scholar]
- 80.Choudhary, R. et al. Mechanical and abrasion resistance performance of silica fume, marble slurry powder, and fly ash amalgamated high strength self-consolidating concrete. Constr. Build. Mater.269, 121282 (2021). [Google Scholar]
- 81.Dadsetan, S. & Bai, J. Mechanical and microstructural properties of self-compacting concrete blended with metakaolin, ground granulated blast-furnace slag and fly ash. Constr. Build. Mater.146, 658–667 (2017). [Google Scholar]
- 82.Abouelnour, M. A. et al. Recycling of marble and granite waste in concrete by incorporating nano alumina. Constr. Build. Mater.411, 134456 (2024). [Google Scholar]
- 83.Fathy, I. N., Elfakharany, M. E. & El-Sayed, A. A. Recycling of Waste Granodiorite Powder as a partial cement replacement material in ordinary concrete. Adv. Mater. Sci.24(3), 56–88 (2024). [Google Scholar]
- 84.El-Samrah, M. et al. Radiation shielding properties of modified concrete mixes and their suitability in dry storage cask. Prog. Nucl. Energy148, 104195 (2022). [Google Scholar]
- 85.Kassem, S. M. et al. Optical and radiation shielding properties of PVC/BiVO4 nanocomposite. Sci. Rep.13(1), 10964 (2023). [DOI] [PMC free article] [PubMed] [Google Scholar]
- 86.Saleh, A. et al. The role of MoO3 on the physical, elasto-mechanical and nuclear shielding efficiency of barium-boro-bismuthate glass system: Comparative investigation. Mater. Chem. Phys.2024, 129574 (2014). [Google Scholar]
- 87.Ekinci, N. et al. Impacts of the colemanite on the enhancement of the radiation shielding capacity of polypropylene. J. Mater. Sci.: Mater. Electron.33(25), 20046–20055 (2022). [Google Scholar]
- 88.Bashter, I. Calculation of radiation attenuation coefficients for shielding concretes. Ann. Nucl. Energy24(17), 1389–1401 (1997). [Google Scholar]
- 89.Kaky, K. M. et al. Theoretical and experimental validation gamma shielding properties of B2O3–ZnO–MgO–Bi2O3 glass system. Mater. Chem. Phys.242, 122504 (2020). [Google Scholar]
- 90.Japari, S. et al. Effects of Na2O on optical and radiation shielding properties of xNa2O-(20–x) K2O–30V2O5-50TeO2 mixed alkali glasses. Results Phys.22, 103946 (2021). [Google Scholar]
- 91.Kiran, K. et al. Effective atomic number of selected construction materials using gamma backscattering technique. Ann. Nucl. Energy85, 1077–1084 (2015). [Google Scholar]
- 92.Martellucci, R. & Torsello, D. Potential of biochar reinforced concrete as neutron shielding material. Nucl. Eng. Technol.54(9), 3448–3451 (2022). [Google Scholar]
- 93.Yasir, M. et al. Shielding properties of cement composites filled with commercial biochar. Electronics9(5), 819 (2020). [Google Scholar]
Associated Data
This section collects any data citations, data availability statements, or supplementary materials included in this article.
Supplementary Materials
Data Availability Statement
All data generated or analyzed during this study are included in this published article.