

Abstract
Purpose
Sustainable hospital operations require efficient resource management to maintain high-quality patient care while adapting to future challenges. The proposed framework was intentionally designed with Sustainable Development Goals (SDGs) in mind, ensuring that scenario selection and evaluation directly support sustainability, equity, and resilience in healthcare planning. This study develops a scenario-driven, simulation-based optimization framework to enhance hospital resource planning, ensuring resilience and sustainability. By addressing critical healthcare scenarios—aging society, pandemic conditions, and referral acceptance enhancement—the framework aligns hospital operations with SDGs related to equitable healthcare access and sustainable communities.
Methods
The proposed framework integrates discrete event simulation (DES) and multi-objective optimization to analyze and optimize resource allocation in response to evolving healthcare demands. Real-world hospital data, scenario-specific patient flow models, and satisfaction metrics—such as length of stay (LOS) and physician assignment—were used to evaluate system performance. The framework was applied to a case study in a public hospital, generating insights into the necessary resource adjustments for each scenario.
Results
Simulation-optimization analysis revealed key resource allocation strategies tailored to different scenarios. In the aging society scenario, the model identified the optimal number of physicians and equipment required to accommodate growing elderly patient volumes while maintaining service quality. The pandemic scenario emphasized the need for adaptive resource allocation, including flexible staffing and additional triage processes to ensure patient safety and operational efficiency. The referral acceptance enhancement scenario demonstrated how strategic resource investment can increase referral case acceptance, reducing healthcare disparities and improving access to specialized care.
Conclusion
This study presents a comprehensive, adaptable framework that enables hospitals to proactively prepare for future uncertainties while optimizing patient satisfaction and operational costs. The findings highlight the importance of scenario-driven resource planning in enhancing resilience, efficiency, and equity in healthcare delivery. By aligning with SDG 3 (Good Health and Well-Being), SDG 10 (Reducing Inequalities), and SDG 11 (Sustainable Cities and Communities), the framework supports sustainable hospital management and provides decision-makers with actionable strategies to improve healthcare systems.
Keywords: Sustainable Healthcare, Resource Management, Discrete Event Simulation, Patient Satisfaction, Multi-Objective Optimization
Introduction
Hospitals today face a multitude of challenges, from increasing patient demands to resource constraints and operational disruptions [1, 2]. In addition to addressing these immediate pressures, hospitals must also prepare for future uncertainties to ensure their ability to deliver high-quality care. The healthcare sector, like many industries, is increasingly aligning with global trends that prioritize sustainability—not just as an environmental imperative but also as a cornerstone for long-term operational resilience and improved service delivery [3–5]. For public hospitals, this means striving not only to maintain service quality but also to enhance it in ways that support equitable healthcare access, operational efficiency, and community well-being [6, 7].
Sustainability in healthcare aligns closely with the United Nations Sustainable Development Goals (SDGs), which emphasize equitable access to quality healthcare, reduced inequalities, and the promotion of sustainable and inclusive systems. Public hospitals play a critical role in advancing these objectives, particularly for communities with limited access to medical resources [8, 9]. Ensuring their sustainability is essential to maintaining good health outcomes, supporting sustainable communities, and reducing disparities in healthcare delivery [10]. As healthcare systems evolve, hospitals are under increasing pressure to remain efficient and resilient in the face of unpredictable challenges [11]. Achieving this requires proactive resource management strategies that optimize resource utilization while preparing hospitals to handle diverse scenarios that could disrupt their operations [12].
In planning for sustainable healthcare systems, hospitals must anticipate various challenges that may impact their ability to deliver high-quality and equitable care over time. This study proposes a simulation-based decision support framework that was intentionally designed to align with key SDGs, specifically, SDG 3 (Good Health and Well-Being), SDG 8 (Decent Work and Economic Growth), and SDG 10 (Reduced Inequalities). To operationalize this alignment, three strategic scenarios were developed to reflect real-world challenges in outpatient resource management: (1) an aging society [13], representing increasing healthcare demand and chronic care needs (linked to SDG 3); (2) pandemic conditions [14], reflecting workforce and operational disruptions (linked to SDG 8); and (3) referral acceptance enhancement [15], which addresses equity in access for underserved populations (linked to SDG 10). These scenarios were integrated into the framework from the beginning to ensure that the model not only supports hospital-level decision-making but also contributes to broader sustainability and equity objectives in healthcare policy.
The aging society scenario addresses the projected growth in elderly patients, whose increasing need for specialized care will place greater demands on hospital resources [16, 17]. The scenario reflects the urgent need to prepare for a demographic change that will see an increase in elderly patients requiring specialized services [18]. Simulating the impact of this increase allows hospitals to determine the optimal number of physicians and equipment required to maintain high levels of patient satisfaction. The pandemic scenario focuses on managing disruptions such as reduced patient intake and unpredictable staff availability [19], emphasizing the importance of maintaining safe and efficient care during crises [20]. Hamouche [21] explored the challenges faced by human resource management during the pandemic. Modeling this scenario emphasizes the importance of flexible and adaptive resource planning that enables hospitals to maintain essential services under restrictive conditions. Finally, the referral acceptance enhancement scenario underscores the importance of equitable access to specialized care by optimizing resources to accommodate more referral cases from smaller hospitals with limited facilities [22–24]. By optimizing resource allocation to handle a higher rate of accepted referrals, hospitals can play a critical role in reducing healthcare inequalities [25]. Together, these scenarios reflect broader societal challenges while aligning with SDG 3 (Good Health and Well-Being), SDG 10 (Reducing Inequalities), and SDG 11 (Sustainable Cities and Communities). By proactively addressing these scenarios, hospitals can enhance their preparedness, improve service quality, and contribute to sustainable healthcare systems.
Despite advancements in healthcare resource management, significant gaps remain in addressing specific operational challenges faced by public hospitals. Existing studies often focus on general resource optimization or isolated objectives, such as minimizing patient length of stay, without considering scenario-specific planning for diverse future challenges [26, 27]. Additionally, many frameworks rely on either simulation or optimization techniques, limiting their ability to provide comprehensive solutions that balance patient satisfaction and operational efficiency [28, 29]. Few studies explicitly align their findings with global goals, such as the SDGs, leaving a gap in linking hospital resource management to broader societal impacts like reducing inequalities and promoting sustainable communities. Furthermore, there is a lack of tailored frameworks for specialized departments like ophthalmology, which face unique demands such as managing an aging population, handling emergency referrals, and ensuring equitable care access.
This study builds upon a previously developed framework for hospital resource management in the ophthalmology department [30], which applied simulation and optimization techniques to improve resource allocation and queue policy. The primary contribution of that earlier work was its focus on patient satisfaction, measured through length of stay (LOS) and physician assignment, and supported by structured data collection and satisfaction modeling. However, the prior framework concentrated solely on current-state operations, without addressing how hospitals could prepare for potential future disruptions or demand shifts.
To address this limitation, the present study introduces a scenario-driven extension of the original framework. It incorporates three forward-looking healthcare challenges: population aging, pandemic-related disruptions, and increasing referral demands. These scenarios are grounded in pressing global and national healthcare trends, such as staffing shortages [31], referral bottlenecks [32, 33], and facing aging society [34, 35]. Recognizing that healthcare planning requires long lead times [36, 37], especially in training physicians and nurses, this extended framework is designed to support strategic planning and capacity building.
Methodologically, the new study expands on the original approach by combining historical hospital data with statistically generated future scenario inputs, enabling a more comprehensive simulation of how patient volume, staffing levels, and resource constraints might evolve. While the department workflow and simulation structure remain consistent with the original model, the enhanced framework enables evaluation under plausible future conditions, aligning more directly with policy-relevant planning horizons, such as 3-year or 5-year strategic plans.
By integrating scenario modeling and aligning outcomes with Sustainable Development Goals (SDGs 3, 10, and 11), the extended framework goes beyond operational improvements to support the development of a resilient, equitable, and future-ready healthcare system. This contribution represents a shift from reactive optimization to proactive healthcare planning, equipping decision-makers with actionable insights for sustainable system strengthening.
The goal of this study is to develop a scenario-driven, simulation-based optimization framework that integrates real-world data and aligns with SDG priorities to deliver actionable, sustainable solutions for public hospital operations. The framework focuses on maintaining high levels of patient care and satisfaction, using key metrics such as LOS and physician assignment to guide efficient, patient-centered resource decisions. Designed to benefit hospitals of all sizes, this research provides the tools needed for healthcare facilities to navigate future uncertainties and improve outcomes across diverse operational contexts.
This study adopts a scenario-based deterministic modeling approach to explore structured variations in critical factors such as patient volume, staff availability, and service demand. While it does not employ formal stochastic programming or robust optimization methods, the framework serves as a practical decision-support tool, offering policy-relevant insights under plausible, data-informed future conditions—without requiring complex uncertainty modeling. In doing so, this study supports strategic, long-term resource planning by equipping hospitals with a proactive approach to prepare for emerging challenges. Although the model is not dynamic or real-time adaptive, it lays the groundwork for future advancement toward resilient healthcare operations and sustainable system readiness.
The following sections of this study provide a comprehensive exploration of the research. The next section, Literature review section, explores key areas including healthcare resource management, simulation and optimization techniques, and relevant studies on patient satisfaction and resource management. The Methodology section then outlines the framework’s structure and implementation. It starts with an overview of the framework, followed by explanations of data generation techniques and case study design. This section also describes the simulation and optimization processes used to model and analyze hospital operations, as well as the evaluation of results and recommendation process. Next, the Application of framework to case studies section presents the practical implementation of the framework across three scenarios: Aging Society, Pandemic Scenario, and Referral Acceptance Enhancement. Each case study includes a detailed analysis of the simulation-optimization results and a comparative analysis across the scenarios. Finally, the Discussion section synthesizes the findings. The paper concludes with a Conclusion section, summarizing the key insights and contributions of the study while offering recommendations for future research and practical applications.
Literature review
Healthcare resource management
The literature extensively explores the development of frameworks aimed at improving hospital systems, with a focus on strategies to enhance healthcare processes and patient satisfaction across various domains. These studies investigate the complex dynamics of healthcare delivery, seeking innovative methods to optimize resource allocation, streamline workflows, and elevate the overall patient experience. By employing comprehensive analyses and advanced methodologies, researchers have significantly contributed to simulation-optimization frameworks designed to address the multifaceted challenges of modern healthcare systems. However, while some studies touch on elements of patient experience, few adopt a holistic approach that integrates critical factors such as length of stay (LOS) and physician assignment satisfaction.
For instance, Cabrera et al. [38] applied an agent-based model to simulate operations in emergency departments (EDs), demonstrating that increasing ED staff within cost constraints reduced average patient LOS. However, the study focused exclusively on optimizing resource numbers without incorporating scenario analysis to explore performance improvements further. Similarly, Chang et al. [39] examined patient and family satisfaction in intensive care units (ICUs) by linking operational processes to survey responses. Their simulation model evaluated staff assignments under various scenarios, providing a structured approach to enhance satisfaction, yet it lacked optimization to determine the optimal number of nurses and associated costs. Meanwhile, Abo-Hamad et al. [40] emphasized the importance of optimizing resource utilization to address uncertainties in demand and declining patient satisfaction. Their framework integrated process modeling, simulation, and balanced scorecard methodologies, demonstrating effectiveness in improving ED resource utilization but neglecting cost considerations. Lastly, Norouzzadeh et al. [41] used discrete event simulation (DES) to analyze resource utilization in outpatient departments (OPDs), exploring scenarios such as resource allocation changes, patient rooming, prioritization, and volume management. While the study achieved significant improvements in resource utilization, it did not reach optimal resource allocation or clinic performance.
Recent studies have made significant strides in enhancing the resilience and efficiency of healthcare systems under crisis conditions. Ardakani et al. [42] introduced a robust location-allocation model to transform healthcare systems through the use of alternative resources, such as field hospitals and student nurses, aiming to improve resiliency during COVID-19 disruptions. Their model optimized the use of limited resources while balancing patient and nurse satisfaction. Similarly, Hosseini-Motlagh et al. [43] developed a resilient and socially oriented health service network to mitigate the effects of the COVID-19 outbreak. Their work emphasized minimizing disease spread through network design, focusing on critical factors like facility criticality and patient dissatisfaction levels under uncertainty. Yinusa and Faezipour [44] contributed a comprehensive optimization model that integrated staffing, patient assignment, and resource allocation, seeking to enhance care delivery by considering a variety of operational constraints.
While the existing literature demonstrates significant advancements in improving hospital systems—particularly in the areas of resource optimization, patient satisfaction, and operational efficiency—many of these studies lack a comprehensive, scenario-specific framework that integrates real-world constraints with long-term planning. Most prior models are grounded in current-state operations or generalized emergency responses, often focusing narrowly on throughput or resilience without addressing the broader context of sustainability and equity. Additionally, few incorporate multiple satisfaction objectives, such as LOS and physician assignment, or align with broader societal targets like the SDGs.
In contrast, the present study introduces a forward-looking, scenario-driven simulation-optimization framework tailored specifically for OPDs. This research shifts the focus toward patient-centered planning, using LOS and physician assignment as key satisfaction measures while integrating real-world data and policy-relevant scenarios—including population aging, pandemic disruptions, and referral system challenges. The framework incorporates data-driven satisfaction modeling, enabling precise, individualized predictions under varying resource configurations. By aligning operational decision-making with SDG objectives (notably SDG 3, 10, and 11), this study bridges the gap between tactical resource planning and global healthcare priorities, ensuring that public hospitals are not only more efficient, but also more equitable, sustainable, and resilient in the face of future challenges.
Simulation and optimization in hospital operations
In particular, the healthcare system poses unique challenges due to its continuous operations, limited resources, and high investment costs, making physical changes difficult to implement. To address these complexities, simulation modeling emerges as a valuable tool for imitating system dynamics, revealing internal processes, and identifying hidden issues [45]. Compared to altering the real system, improvements can be more easily implemented within a simulation model, allowing for iterative testing and refinement. Discrete Event Simulation (DES) has gained prominence in healthcare research over the past decades. Leemis and Park [46] define DES as a stochastic, dynamic, and discrete model, encapsulating the randomness, time dependency, and state changes that occur with each event. Bhattacharjee and Ray [47] study on patient modeling methods elucidates the conditions conducive to DES application, highlighting its effectiveness in analyzing complex patient flows, transient system performance, and various aspects of capacity planning, resource allocation, and scheduling. DES proves particularly useful in scenarios where patient flows exhibit complexity in terms of stages, classes, priorities, and routing probabilities, facilitating comprehensive analyses and informed decision-making processes within healthcare settings.
Numerous studies have employed DES to analyze patient flow across various hospital departments. DES model is built to represent patient flow through multiple departments by Kovalchuk et al. [48], emergency department by Andrews et al. [49], and OPD by Kim et al. [50] incorporating data mining techniques to derive input parameters. Their model successfully helped reduce patient time spent in the hospital. Similarly, Devapriya et al. [51] utilized electronic health record data in a DES model to evaluate bed allocation policies, enabling accurate forecasting of patient numbers, length of stay, and occupancy rates.
Queuing theory and queue management are critical considerations in healthcare, as excessive wait times can negatively impact patient experience, clinical outcomes, and operational efficiency. DES offers a powerful approach to analyzing and optimizing queuing systems within hospitals and clinics. By modeling the stochastic arrival patterns of patients, prioritization rules, resource availability, and service time distributions, DES allows researchers to identify bottlenecks, test alternative triage policies, and evaluate the impact of capacity changes on queue lengths and waiting times. For example, Luo et al. [52] utilized DES to improve patient prioritization and reduce wait times in a computed tomography scanning department with different patient priority levels. Their model implemented dynamic queue management strategies, leading to significantly reduced delays for lower-priority patients without compromising service for higher-priority cases. Similarly, DES has been applied to emergency departments [53], outpatient clinics, and diagnostic facilities to streamline patient flow, balance resource allocation, and minimize queuing-related inefficiencies, ultimately enhancing patient satisfaction and care quality. Regarding software choices, Arena and Simul8 have been identified as the most commonly used DES tools in healthcare studies.
The literature demonstrates the growing adoption of DES as a critical tool for addressing complex challenges in healthcare systems, such as optimizing patient flows, improving resource allocation, and enhancing queuing management. Studies have shown that DES provides a flexible and efficient approach to simulate system dynamics offering valuable insights for improving operational efficiency and patient satisfaction. By modeling stochastic elements such as patient arrival patterns, prioritization rules, and service times, DES has proven effective in diverse healthcare settings, from emergency departments to outpatient clinics and diagnostic facilities. However, despite its versatility, existing studies often focus on specific applications of DES without integrating scenario-driven approaches or aligning with broader objectives such as sustainable healthcare planning. Moreover, the potential to link DES applications to the SDGs, such as ensuring equitable healthcare access and reducing inequalities, remains underexplored.
Building on the strengths of existing literature, this study integrates DES with optimization techniques to develop a scenario-driven framework that addresses resource allocation challenges across three critical scenarios: aging society, pandemic conditions, and referral acceptance enhancement. By combining real-world data with scenario-specific projections, the framework offers actionable insights tailored to address evolving healthcare demands. Furthermore, this work bridges the gap between operational efficiency and sustainability by aligning its objectives with the SDGs, ensuring that resource management strategies not only improve hospital operations but also contribute to broader social goals.
Relevant studies on patient satisfaction and resource allocation
Patient satisfaction is profoundly influenced by the efficiency and equity of healthcare resource allocation, as highlighted in various studies. For instance, Zesheng et al. [54] demonstrated that redistributing resources from high-level to lower-level hospitals in Zhejiang, China, improved patient satisfaction by increasing access to quality care and reducing healthcare costs. Similarly, research by Sani and Xu [55] in Bauchi State, Nigeria, revealed that disparities in financial and staffing resources across healthcare facilities negatively affect patient outcomes and satisfaction, emphasizing the importance of equitable resource distribution. In addition to these regional studies, Coman et al. [56] presented a predictive framework integrating management systems to align resource use with patient needs, effectively balancing performance and costs. Building on this, Ritika et al. [57] explored data-driven optimization strategies that reduced waiting times and improved patient outcomes through predictive algorithms. Furthermore, Masroor et al. [58] showcased how fairness in patient scheduling, achieved through machine learning techniques, addressed wait times and enhanced resource accessibility, directly contributing to improved satisfaction across diverse patient groups. Collectively, these studies underscore the necessity of equitable resource allocation and the use of advanced predictive tools to enhance healthcare delivery and patient satisfaction.
Effective resource allocation in hospitals plays a crucial role in ensuring patient satisfaction by aligning facilities, personnel, and medical resources with patient needs. Timely access to care, reduced wait times, appropriate staffing levels, and the availability of essential medical equipment are all vital components of resource allocation that shape patient perceptions and experiences [59, 60]. For example, Ordu et al. [29] demonstrated that implementing predictive analytics and robust optimization models helps align resources with patient demand, reducing overcrowding and minimizing delays, leading to improved service delivery and higher satisfaction levels. Moreover, innovative systems like patient-to-physician communication platforms enhance personalized care, improving the quality of interactions and fostering trust and satisfaction [61]. These findings highlight the critical intersection of resource management and patient experience, reinforcing the importance of strategic resource planning and advanced technologies in modern healthcare systems.
Patient satisfaction is a multifaceted construct influenced by various interrelated aspects of healthcare delivery, which can be broadly categorized into service quality, provider interaction, treatment outcomes, operational efficiency, patient-centered care, and external factors [62], as shown in Fig. 1. Service quality plays a crucial role, with accessibility, a clean and comfortable facility environment, and adherence to safety protocols significantly shaping patient perceptions [63, 64]. The quality of provider interaction, including clear and empathetic communication, compassionate care, and continuity of care, fosters trust and loyalty [65]. Treatment outcomes, such as the effectiveness of care and pain management, are strong determinants of satisfaction, as they directly impact patient comfort and confidence [66]. Operational efficiency, encompassing shorter wait times and streamlined administrative processes, also enhances patient experiences by reducing unnecessary frustrations [67]. Additionally, patient-centered care, which involves active participation in decision-making and cultural sensitivity, has been shown to improve satisfaction by aligning care delivery with individual patient preferences [68]. Lastly, external factors, such as socioeconomic background, health literacy, and public reputation, shape patient expectations and perceptions of care quality [69]. Together, these dimensions highlight the complexity of patient satisfaction and underscore the need for holistic approaches that address both clinical and non-clinical aspects of healthcare delivery.
Fig. 1.

Aspect effecting patient satisfaction [62]
The literature highlights the critical role of equitable resource allocation and advanced technologies in addressing patient needs. Studies demonstrate that redistributing resources, leveraging predictive frameworks, and adopting smart systems can enhance operational efficiency, reduce waiting times, and ultimately improve patient satisfaction. However, while these studies provide valuable insights, they often lack a scenario-driven approach or comprehensive frameworks that integrate patient satisfaction metrics with strategic resource allocation. Building on these findings, this research aims to address these gaps by developing a simulation-based optimization framework tailored to specific healthcare scenarios. By combining real-world data with scenario-specific modeling, the framework aligns resource management strategies with patient satisfaction goals, ensuring operational efficiency and equitable healthcare delivery.
Methodology
Framework overview
This study applies a simulation-based multi-objective optimization framework to enhance resource management in ophthalmology departments. The framework integrates real data from hospital operations with simulated scenarios to predict and address future challenges, ensuring sustainable hospital practices.
The framework as shown in Fig. 2 revolves around three key scenarios. First is aging Society. Preparing for increased patient volume due to an aging population requiring frequent eye care. Second is pandemic condition. Managing disruptions such as staff shortages and reduced patient visits, drawing on lessons from COVID-19. Last is referral acceptance enhancement. Increasing the hospital’s capacity to accept referrals from smaller or rural hospitals with limited resources.
Fig. 2.

Scenario-driven resource optimization framework for sustainable hospital operations
The framework focuses on optimizing two key outcomes: patient satisfaction measured by metrics such as length of stay and physician assignment, and resource allocation by balancing staff and equipment levels with operational costs to achieve sustainable hospital operations.
The multi-objective optimization within this framework provides decision-makers with practical strategies to address both present and future challenges. By anticipating various scenarios, the framework ensures that hospitals remain resilient, efficient, and aligned with the SDGs, particularly SDG 3 (Good Health and Well-Being), SDG 10 (Reducing Inequalities), and SDG 11 (Sustainable Cities and Communities).
Data generation techniques and case study design
To capture the effects of external shifts, such as population aging, pandemic disruptions, and increased referral demands, this study defines a set of deterministic scenarios with structured adjustments to key parameters. These scenarios allow decision-makers to explore system performance under diverse but plausible operating conditions. However, it is important to note that random variation and probabilistic uncertainty are not explicitly modeled; instead, the focus is on providing practical, scenario-based insights to support strategic hospital planning.
The ophthalmology department was selected as the focus of this study due to its high patient demand and the complexity of its clinical workflow, which involves multiple diagnostic and pre-consultation procedures. As one of the most frequently visited specialties, particularly by elderly patients, ophthalmology presents significant challenges in terms of resource coordination, patient flow management, and service efficiency. These characteristics make it an ideal case for evaluating the effectiveness of resource planning strategies. Moreover, because of its structured yet intricate operational processes, the ophthalmology department serves as a representative benchmark for other OPDs offering insights that can be adapted to improve service delivery across various clinical specialties.
The data collection consists of two type of data. First is real or historical data including patient visits, physician schedules, and resource availability, is gathered from ophthalmology departments in public hospitals. This data provides a baseline for understanding current operations. Another is simulated data. Scenarios are generated to explore future challenges. The three key scenarios are: Aging Society (a growing elderly population increases demand for eye care services), Pandemic Scenario (disruptions such as staff shortages and reduced patient visits impact hospital capacity), and Referral Acceptance Enhancement (ensuring the hospital can accept more referrals from smaller or rural facilities despite resource constraints). This combination of real and simulated data ensures that the framework accounts for both present-day operations and potential future disruptions.
Scenario 1: aging society
In the aging society scenario, the focus is on modeling the anticipated increase in patients requiring healthcare services due to age-related conditions. As populations age, the demand for specialized care is expected to rise significantly. To make this framework adaptable to different environments, it is important to observe statistical trends in population growth over the next decade to assess changes in age demographics. This involves computing the percentage shift in population for various age ranges using demographic projections and historical data as shown in Fig. 3.
Fig. 3.

Resource planning framework for aging society scenario
The framework assumes that changes in the percentage of a specific age group within the population directly correlate with changes in the number of patients from that age group seeking healthcare services. For example, if the population aged 65 years and older constitutes 15.9% of the total population in 2025 and is projected to increase to 22.7% by 2035, the percentage shift in this age group is 6.8%. Under this assumption, the patient volume for this age group is also expected to increase by 6.8%. This percentage shift is then applied in the simulation model to adjust the incoming patient volume.
The goal of this scenario is to determine the optimal resource allocation needed to maintain high patient satisfaction, particularly concerning LOS and physician assignment, while minimizing the additional costs of hiring more physicians or purchasing equipment. Resource constraints are also set within the model to prevent over-hiring and maintain operational sustainability. By running the simulation with this projected patient increase, we can estimate the number of physicians and equipment required to deliver high-quality care to a growing elderly population while balancing costs.
Scenario 2: pandemic scenario
The pandemic scenario models the operational disruptions and adjustments required during a healthcare crisis, such as those experienced during the COVID-19 pandemic. This includes changes to patient flow, adjustments to resource availability, and the addition of patient triage processes to identify critical cases and manage infection risks. In this scenario, as shown in Fig. 4, the patient intake process is modified to include a triage step, which filters patients based on their condition. Patients requiring immediate medical attention are redirected to the emergency department rather than being admitted to regular outpatient services. This ensures that resources are allocated efficiently while minimizing exposure risks. Additionally, to comply with health and safety regulations—particularly social distancing guidelines—the number of available resources is deliberately reduced. This constraint helps enforce spacing between patients and prevents overcrowding in service areas, reflecting real-world restrictions implemented during pandemic periods.
Fig. 4.

Resource planning framework for pandemic scenario
During a pandemic, healthcare providers face unique challenges, particularly with physician availability. Some physicians may be directly affected by the pandemic, such as falling ill themselves, while others may be reassigned to support critical areas like the emergency department or community outreach teams. This creates a shortage of physicians in outpatient services, which must be accounted for in the resource constraints of the model. For instance, a 40% chance of unavailability means that on any given day, there is a 40% probability that a physician cannot work in the outpatient department due to illness or reassignment. This variability is incorporated into the model as an adjustable constraint to reflect the unpredictable nature of workforce disruptions during a crisis.
Additionally, the model accounts for the increased complexity of processes typically introduced during pandemics. The inclusion of additional triage steps, for example, ensures that patients are appropriately categorized based on the severity of their condition. By incorporating these adjustments, the framework use to identify the necessary resource levels—such as the number of triage stations, physicians, and support staff—needed to maintain service quality. The output provides actionable insights into balancing patient satisfaction, staff workload, and resource constraints under pandemic conditions, enabling hospitals to plan effectively for future crises.
Scenario 3: referral acceptance enhancement
The referral acceptance enhancement scenario focuses on addressing the challenge faced by large hospitals in urban areas that receive referral cases from smaller, rural hospitals with limited equipment and resources. These referral cases often involve patients who require specialized care or urgent medical attention that cannot be provided by their local healthcare facilities. The problem arises when large hospitals, due to resource constraints, are unable to accept a significant portion of these referrals, leading to delays in treatment and inequalities in healthcare access.
To address this issue as shown in Fig. 5, it is essential to first determine the hospital’s current referral acceptance rate and engage with decision-makers to establish a target acceptance rate that aligns with the hospital’s capacity and healthcare goals. For example, if the current acceptance rate is 20%, the hospital may aim to increase it to a more equitable and feasible level, such as 40% or 50%, depending on resource availability and patient demand. This target rate is then incorporated into the model as an adjustable parameter, allowing for scenario-specific analysis.
Fig. 5.

Resource planning framework for referral acceptance enhancement scenario
In the model, referral cases are assigned a higher priority to reflect their urgency and ensure they are addressed promptly upon arrival. The simulation explores the additional resources required—such as physicians, support staff, and equipment—to achieve the desired referral acceptance rate without compromising care for other patients. Constraints are applied to balance resource investments with operational efficiency, ensuring that the hospital can handle the increased volume of referrals sustainably. The resulting insights provide a strategic resource plan that enables the hospital to improve referral acceptance, thereby enhancing access to specialized care for underserved populations and contributing to the reduction of healthcare inequalities.
Satisfaction computation
The satisfaction survey used in this study is divided into three parts, designed to gather comprehensive data on patient demographics, satisfaction related to LOS, and preferences for physician assignment.
General Information: The first part collects basic demographic and usage information, including the patient’s age, gender, and frequency of hospital visits. This data provides context for understanding patient satisfaction across different population segments.
Satisfaction Related to LOS: The second part focuses on patient satisfaction with their time spent in the hospital. Patients are asked to rate their overall satisfaction on a scale from 1 (very unsatisfied) to 5 (very satisfied) for their most recent hospital visit. Additionally, they are asked to rate their satisfaction for specific LOS intervals: less than 1 hour, 1–2 hours, 2–3 hours, and more than 3 hours. This approach captures how satisfaction varies with the amount of time spent in the hospital, providing detailed insights into the impact of LOS on patient experience.
Satisfaction Related to Physician Assignment: The third part evaluates patient preferences and satisfaction regarding physician assignment. Patients indicate their preference for seeing a general physician or a specialist based on their symptoms. They also specify whether they have a strong preference for a particular physician type or if they are comfortable with any available physician. This data helps assess the alignment between patient expectations and the hospital’s ability to meet their needs.
This structured survey design allows for a detailed evaluation of factors influencing patient satisfaction and provides the foundation for computing satisfaction metrics used in the simulation and optimization framework.
Satisfaction related to LOS computation
This process involves generating a predictive function to estimate patient satisfaction scores related to LOS. The survey includes general information questions and satisfaction-related questions, where responses are either binary (for general information) or ordinal (for satisfaction with LOS).
To analyze this type of data, Ordinal Logistic Regression [70] is used as the statistical method to develop the predictive function for satisfaction scores based on influencing factors. All variables are incorporated into the ordinal logistic regression model using Minitab software. The resulting function estimates the cumulative probability of a patient assigning a satisfaction rating of j or lower, expressed as  , where S represents the satisfaction level on a scale from 1 to 5. The model includes n explanatory variables, denoted as
  , which influence patient satisfaction. The intercepts for each satisfaction level are represented by
  , while the regression coefficients for each explanatory variable are denoted as
  . The following Eq. (1) provides a structured method for assessing how different factors impact patient satisfaction with LOS.
 |
1 |
To compute patient satisfaction related to LOS in this study, an ordinal logistic regression model is applied to survey data collected from outpatient respondents. The dependent variable represents the expected satisfaction score, ranging from 1 (very unsatisfied) to 5 (very satisfied), based on the patient’s perceived satisfaction for a specific LOS interval. The independent variables, denoted as X1 to X6, are derived from responses to structured survey questions. X1 captures gender as a binary variable (male/female), while X2 represents age groups as categorical values (below 18, 18–24, 25–44, 45–64, and over 65). X3 and X4 are binary indicators reflecting the patient’s prior experience visiting the hospital and the department, respectively. X5 denotes whether the patient had an appointment (yes/no), and X6 represents the LOS interval, categorized as: less than 1 hour, 1–2 hours, 2–3 hours, and more than 3 hours. The model estimates the probability distribution of satisfaction scores based on these factors. An example of the prepared dataset used to train the logistic regression model is shown in Table 1, where each row corresponds to a patient and their respective factor values and satisfaction rating. Each patient provides their expected satisfaction score for each LOS interval, allowing the model to capture how satisfaction varies with different waiting times.
Table 1.
Example of prepared survey data for ordinal logistic regression model
| Satisfaction | Gender | Age | Hospital visit | Department visit | Appointment | LOS |
|---|---|---|---|---|---|---|
| X1 | X2 | X3 | X4 | X5 | X6 | |
| 4 | Male | Over 65 | Yes | Yes | Yes | Less than 1 hour |
| 4 | Male | Over 65 | Yes | Yes | Yes | 1-2 hours |
| 3 | Male | Over 65 | Yes | Yes | Yes | 2-3 hours |
| 2 | Male | Over 65 | Yes | Yes | Yes | More than 3 hours |
| 5 | Female | 45-64 | Yes | No | No | Less than 1 hour |
| 4 | Female | 45-64 | Yes | No | No | 1-2 hours |
| 4 | Female | 45-64 | Yes | No | No | 2-3 hours |
| 3 | Female | 45-64 | Yes | No | No | More than 3 hours |
After fitting the survey data into the ordinal logistic regression model, the analysis yields the intercept values () and regression coefficients ( ) corresponding to the factors influencing patient satisfaction. These coefficients quantify the impact of each explanatory variable on the satisfaction score related to LOS. To apply this model within the simulation, each patient is assigned specific values for the influencing factors, which are then input into the predictive Eq. 1 to calculate the probability distribution across five possible satisfaction levels. The model includes multiple predefined probability sets, each corresponding to different combinations of influencing factors—such as a patient who has visited the hospital but not the department, or one who has visited both. Each of these combinations results in a distinct satisfaction probability profile. Notably, the LOS value calculated dynamically from the simulation is also a key input in determining which probability set is used, ensuring that the predicted satisfaction reflects both the patient’s background and their experience in the system.
Once these probabilities are generated, the simulation model uses them to assign a satisfaction score to each patient. For every individual, the model draws a random number  between 0 and 1, and compares it to the cumulative distribution of the satisfaction probabilities. The patient’s final satisfaction score related to LOS, denoted as
  , is determined based on the interval into which the random number falls. This process ensures that satisfaction outcomes are both data-driven and dynamically responsive to each patient’s characteristics and experience. As a result, the simulation can reflect realistic variability in satisfaction across different scenarios, enhancing the robustness and applicability of the model. The full process of computing is illustrated as follows:
-
 ,
,if

-
 ,
,if

-
 ,
,if

-
 ,
,if

-
 ,
,if


Satisfaction related to physician assignment computation
This process involves developing a method to compute the expected satisfaction score related to physician selection. From survey, patients provide symptom names that can be overly specific or infrequent. To evaluate patient satisfaction related to physician assignment, it is essential to classify symptoms based on their severity and required level of medical expertise. In this study, symptoms reported by patients are grouped into three categories based on literature [71–74]: Easy, Varied, and Hard. This classification helps determine whether a general physician or a specialist is more appropriate for the patient’s condition, which in turn influences satisfaction expectations.
Easy symptoms refer to conditions that are mild, self-limiting, and typically do not require specialized treatment. These symptoms can be effectively managed by a general physician, and patients with such conditions generally do not expect or require specialist consultation. An example of an easy symptom is a stye, which often resolves on its own within two weeks and requires only basic care or observation [75].
Hard symptoms are conditions that are severe, chronic, or potentially sight-threatening, and typically require immediate attention from a specialist. Patients experiencing these symptoms expect to see a specialist physician due to the complexity and urgency of care needed. For instance, glaucoma is categorized as a hard symptom because it can lead to irreversible vision loss if not managed promptly by a specialist [75].
Varied symptoms are those that fall between easy and hard. Their severity depends on the underlying cause, and the treatment may or may not require specialist care. These conditions might be managed by a general physician in some cases, but may require referral to a specialist in others. An example of a varied symptom could be eye redness, which might result from simple irritation or be a sign of a more serious condition like uveitis [75].
This classification approach ensures that patient expectations for physician type are contextually appropriate, and allows the model to realistically assess satisfaction based on whether the patient was matched with their expected level of care. Patients also express their expectations regarding physician assignment based on their symptoms. These expectations fall into three categories: satisfaction with seeing a general physician, satisfaction only if seen by a specialist, or no preference for either physician type. Using the collected data, the probability of each symptom being associated with a specific physician expectation is computed.
Once the patient meets a physician, three possible outcomes determine their satisfaction score:
If the assigned physician matches the patient’s expectation, the satisfaction score is 2.
If the assigned physician differs from the patient’s expectation, the satisfaction score is 0.
If the patient has no physician preference, the satisfaction score is 1, regardless of the assigned physician.
This method is then applied in the simulation model, where the equation for patient satisfaction related to physician assignment for each patient p, denoted as  , is represented in (2). The expected physician for each patient is denoted as
  , while the actual assigned physician is represented as
  .
.
 |
2 |
, while  is a specific physician type from the set of all physician types
Simulation and optimization process
Simulation
The framework employs DES to model patient flow and resource utilization within hospitals. This approach captures the complexity of healthcare workflows, including appointment scheduling, patient consultations, and diagnostic procedures. By simulating these dynamics, the framework predicts operational outcomes under different scenarios, helping hospitals assess resource efficiency and patient care quality.
Patient satisfaction serves as the primary metric for evaluating the framework’s effectiveness, with two key indicators: LOS which is the total time a patient spends in the hospital and Physician Assignment Satisfaction which whether patients are assigned to their preferred or expected physician. The DES model analyzes how different resource allocation strategies impact these metrics, offering data-driven insights for hospital decision-making.
In this study, we focus on modeling the OPD process flow, beginning from the moment patients arrive at the hospital. Upon arrival, each patient is required to scan their appointment card or ID to receive a queue number, marking the start of their journey through the OPD system. Patients then proceed to wait for triage, where a nurse assesses their condition and directs them to the appropriate next steps. The triage process operates based on queue priority, with patients categorized into four types: Type A (appointments between 9:00–10:00 AM), Type B (10:00–11:00 AM), Type C (11:00–12:00 PM), and Type D (walk-in patients). Patients with earlier appointment times are given priority in the triage queue, while Type D (walk-in) patients are considered lowest priority. For the purpose of this simulation, it is assumed that emergency or urgent cases do not enter through the OPD.
To reflect realistic arrival behavior, the timing of patient arrivals is modeled using a time-dependent distribution derived from historical data. From the OPD’s opening at 7:00 AM until 9:30 AM, patient interarrival times follow a log-normal distribution with parameters LOGN(0.788, 0.447), capturing the peak arrival period. After 9:30 AM, the arrival pattern shifts to a Weibull distribution, defined as WEIB(4.89, 1.02), representing a gradual decline in patient inflow. All time units are expressed in minutes, and this dynamic modeling approach ensures that the simulation accurately mirrors real-world variability in patient arrival rates across the operating hours.
Following triage, patients wait to receive their personal medical file, which is handed out on a first-come, first-served (FCFS) basis according to the triage completion order. Once the file is received, the first mandatory pre-process for every patient is the Visual Acuity Test. After that, the necessity of further pre-processing steps is determined by the triage nurse. These optional tests include: Eye Tonometry Test, Auto-Refractometry Test, Dilation, Optical Coherence Tomography (OCT), Ophthalmic Imaging, Intraocular Measurement, and Visual Field Test, carried out in that specific sequence. Each of these stations also follows an FCFS queuing system, although not all patients are required to undergo every test. The processing time for each procedure is determined from empirical data collected at the hospital and follows a distinct statistical distribution specific to each station, ensuring the simulation reflects realistic variation in service durations.
Once pre-processing is complete, patients proceed to wait for consultation with a physician, which typically begins at 9:00 AM. The consultation queue operates under a priority-based policy according to the patient’s appointment type. Between 9:00 AM and 10:00 AM, Type A patients (with appointments in that hour) are given the highest priority. If time permits and no Type A patients are waiting, Type D (walk-in) patients may enter the queue. From 10:00 AM to 11:00 AM, Type A patients who arrive late still retain top priority, followed by Type B, and lastly Type D, again only if capacity remains. This priority queuing approach ensures that scheduled patients are seen in a timely manner while allowing flexibility to accommodate walk-ins when possible. The simulation is designed to reflect this full process on a weekly operational cycle, capturing patient flow, resource utilization, and potential bottlenecks across multiple working days. Figure 6 illustrates the simulation model developed using Arena, which replicates the OPD workflow of the ophthalmology unit. The simulation was implemented using Arena software, supported by a licensed version provided through Sirindhorn International Institute of Technology (SIIT), Thammasat University.
Fig. 6.

Simulation model layout in arena software
To ensure the accuracy and reliability of the simulated outpatient process described above, the next step involves a thorough verification and validation of the model. Model verification aims to confirm the correctness of the model’s logic, while model validation assesses the model’s accuracy in representing the real system. Verification involves testing the model under extreme conditions, such as when only one patient enters the system, with all processing times set to constant values. The LOS serves as a key performance indicator in this process. To verify the model, the LOS generated by the simulation is compared with a manually calculated LOS, which is the sum of all processing durations under the assumption of no queuing delays. In this study, the calculated LOS was 78 minutes, which matched exactly with the LOS produced by the simulation. This confirms that the simulation logic is implemented correctly and aligns with the underlying assumptions of the model.
For validation, the model’s output, which is patient satisfaction related to LOS, is compared against actual patient satisfaction data collected via a survey. An independent two-sample t-test was conducted to evaluate whether the mean satisfaction scores from the simulation and real-world survey data differed significantly. Prior to the test, the distribution shapes and variances of the two datasets were assessed and found to be reasonably similar (standard deviations: 0.865 for observed, 0.675 for simulated). When the ratio of standard deviations is less than 2, the assumption of equal variances is acceptable for a two-sample t-test [76], supporting the use of this method in our analysis. Both datasets comprised 300 samples. According to Van Voorhis and Morgan [77], a sample size of 30 or more per group is typically adequate to detect medium effect sizes with reasonable power in t-tests. The t-test yielded a p-value of 0.113, which is greater than the 0.05 threshold, indicating no statistically significant difference between the two groups. This result supports the validity of the simulation model in accurately reflecting real-world patient satisfaction trends. Together, the verification and validation processes demonstrate that the simulation model is both logically and realistically representative of the actual hospital system, making it suitable for further scenario analysis and decision support.
Optimization
To achieve optimal results, the framework integrates multi-objective optimization, specifically the TH approach, to balance competing goals: maximizing patient satisfaction with LOS, improving physician assignment satisfaction, and minimizing resource costs. Optimization tools such as OptQuest are used to identify effective resource allocation strategies while maintaining operational constraints. The framework also evaluates trade-offs between increasing staff or equipment and associated costs, providing adaptable solutions tailored to hospitals of varying capacities.
The optimization model is based on key assumptions to ensure practicality. It assumes that increasing resources (e.g., physicians and equipment) directly enhances patient satisfaction by reducing LOS and improving physician assignment alignment. Resource allocation is modeled within budget constraints, allowing for the exploration of different configurations. Additionally, a linear relationship between resource levels and costs is assumed to simplify real-world complexities and ensure computational efficiency. These assumptions enable the framework to balance trade-offs between patient satisfaction and cost-effectiveness, offering hospitals a structured approach to sustainable resource management.
The notation used in the following optimization model is summarized in Table 2. The length of stay for each patient ( ) is calculated using Eq. (3), which considers queuing delays based on current and additional physician and resource levels, as well as individual patient service and transfer times. This calculated LOS value is then used to derive the satisfaction score related to LOS () through an ordinal logistic regression in Eq. 1.
 |
3 |
Table 2.
List of notations and decision variables
| Sets | |
| i | Index of physician,
|
| j | Index of resource, 
|
| p | Index of patient number, 
|
| I | Physician types (i.e. specialist physician and general physician) |
| J | Resource types (e.g., diagnostic machines, nurse) |
| Parameters | |
| N | Number of patients in simulation |

|
Number of current physician type i |

|
The maximum number of additional physician type i |

|
Cost of hiring one additional physician type i |

|
Number of current resource type j |

|
The maximum number of resource type j |

|
Cost of adding one more resource type j |

|
Processing time of patient p in resource type j |

|
Processing time of patient p when meeting physician type i |
| Decision Variables | |

|
Number of additional physician type i |

|
Number of resource type j |
The decision variables in the optimization model include the number of additional physicians ( ) and the amount of each additional resource (
 ). The objective functions, derived from [30], are designed to achieve three key goals: maximizing patient satisfaction related to LOS (
 ), maximizing patient satisfaction with physician assignment (
 ), and minimizing investment costs (
 ). These objectives are explicitly defined in Eqs. (4)–(6).
The model incorporates constraints to ensure practical feasibility. Specifically, the number of additional physicians cannot exceed the maximum allowable limit, as defined in Eq. (7). Similarly, the allocation of additional resources must remain at or above the current levels while not exceeding the maximum allowable limit, as described in Eq. (8). By integrating these constraints, the optimization framework balances patient satisfaction and cost-effectiveness while adhering to real-world hospital capacity limitations.
Objective function:
 |
4 |
 |
5 |
 |
6 |
Subjected to:
| 7 |
| 8 |
The objectives of maximizing patient satisfaction related to LOS, maximizing satisfaction with physician assignment, and minimizing investment costs inherently conflict with one another. The three objectives in this study inherently conflict with one another. Maximizing patient satisfaction related to LOS (Eq. 4) often requires allocating additional physicians and resources, which increases overall operational cost (Eq. 6). Similarly, maximizing satisfaction with physician assignment (Eq. 5) may involve assigning specific physician types based on patient preferences, potentially increasing staffing needs or limiting scheduling flexibility. These trade-offs reflect the practical challenge in balancing service quality and financial constraints in outpatient department planning. To address this challenge, the multi-objective optimization framework balances these competing goals by incorporating fuzzy linear programming and weight sets, ensuring that decision-makers can evaluate trade-offs effectively. This structured approach leads to robust and adaptive solutions that align with real-world hospital constraints, promoting sustainable and efficient resource allocation.
Multi-objective optimization involves solving multiple objective functions simultaneously, with each assigned a level of importance using weight factors, denoted as  , for each objective o. However, based on in-depth interviews with hospital experts, it was determined that specific weight assignments could not be predefined, as all objectives were considered equally important. To maintain flexibility, the weight settings needed to be adjustable. Since expert-defined preferences were unavailable, a set of twenty-five weight configurations was adopted as recommended by [78]. Each configuration includes weight distributions for both patient satisfaction objectives and investment cost minimization, as detailed in Table 3. Utilizing multiple weight settings provides significant advantages in multi-objective optimization, allowing decision-makers to explore different prioritization scenarios. By evaluating various weight combinations, hospitals can assess a range of possible outcomes, ensuring that resource allocation aligns with their specific needs and situational constraints while maintaining a balanced approach to patient satisfaction and cost efficiency.
Table 3.
Weight settings of each objective
| Case |  |
 |
 |
Case | |
|
|
|---|---|---|---|---|---|---|---|
| 1 | 1 | 0 | 0 | 15 | 0 | 2/6 | 4/6 |
| 2 | 0 | 1 | 0 | 16 | 0 | 3/6 | 3/6 |
| 3 | 0 | 0 | 1 | 17 | 0 | 4/6 | 2/6 |
| 4 | 1/6 | 5/6 | 0 | 18 | 0 | 5/6 | 1/6 |
| 5 | 2/6 | 4/6 | 0 | 19 | 1/6 | 2/6 | 3/6 |
| 6 | 3/6 | 3/6 | 0 | 20 | 1/6 | 3/6 | 2/6 |
| 7 | 4/6 | 2/6 | 0 | 21 | 1/6 | 1/6 | 4/6 |
| 8 | 5/6 | 1/6 | 0 | 22 | 1/6 | 4/6 | 1/6 |
| 9 | 1/6 | 0 | 5/6 | 23 | 2/6 | 1/6 | 3/6 |
| 10 | 2/6 | 0 | 4/6 | 24 | 2/6 | 3/6 | 1/6 |
| 11 | 3/6 | 0 | 3/6 | 25 | 2/6 | 2/6 | 2/6 |
| 12 | 4/6 | 0 | 2/6 | 26 | 3/6 | 1/6 | 2/6 |
| 13 | 5/6 | 0 | 1/6 | 27 | 3/6 | 2/6 | 1/6 |
| 14 | 0 | 1/6 | 5/6 | 28 | 4/6 | 1/6 | 1/6 |
 Weight of satisfaction related to LOS objective,
  Weight of satisfaction related to physician assignment objective,
  Weight of cost objective
To perform multi-objective optimization, this study employs the Torabi-Hassini (TH) approach for fuzzy multi-objective optimization, as proposed by Torabi and Hassini [79]. This method is particularly well-suited for decision-making in uncertain environments, offering a flexible, robust, and interactive framework for balancing multiple competing objectives. Unlike traditional fuzzy optimization techniques, the TH approach integrates procurement, production, and distribution into a single model, allowing for compromise solutions that improve practicality for decision-makers seeking a fair trade-off between conflicting goals.
To solve the multi-objective optimization problem using the TH approach, the objective functions  for each objective o are first defined. Next, the positive ideal solution (PIS) and negative ideal solution (NIS) for each objective function are determined by solving the corresponding mixed-integer linear programming (MILP) model individually. The PIS for each objective o, denoted as
  , represents the best possible outcome, while the NIS, denoted as
  , represents the worst possible outcome. Once these values are established, a linear membership function is specified for each objective function as follow:
For Minimize Objective:
 |
9 |
For Maximize Objective:
 |
10 |
, where  represents the satisfaction degree of the oth objective function. The auxiliary multi-objective MILP model is then transformed into an equivalent single-objective MILP using the auxiliary crisp formulation given in Eq. 11.
Auxiliary MILP:
| 11 |
subjected to:
| 12 |
| 13 |
| 14 |
, where  represents the minimum satisfaction degree among all objectives. The parameter
  acts as a compensation coefficient, controlling the minimum satisfaction level of objectives and implicitly determining the degree of compromise among them. This value can be adjusted based on the desired balance between competing objectives. A higher leads to a more balanced compromise solution, ensuring that all objectives are fairly considered. Conversely, a lower prioritizes one objective with minimal regard for the others. In this study, is set to 0.4 to achieve a balanced trade-off among objectives. Finally, the auxiliary crisp model (11) is solved under the given constraints (12), (13), and (14).
The following algorithm outlines the multi-objective optimization procedure used in this study. The process iteratively evaluates combinations of decision variables, specifically the number of physicians and medical equipment, under varying weight sets for the three objectives: maximizing satisfaction related to LOS, maximizing satisfaction related to physician assignment, and minimizing cost. The algorithm first runs single-objective simulations to establish positive (PIS) and negative (NIS) points. It then performs optimization across 25 weight configurations using the Torabi-Hassini (TH) approach. For each weight set, the simulation model is executed, and the resulting objective values are normalized and aggregated to identify the optimal policy. Figure 7 serves to illustrate the structured flow of this optimization process.
Fig. 7.
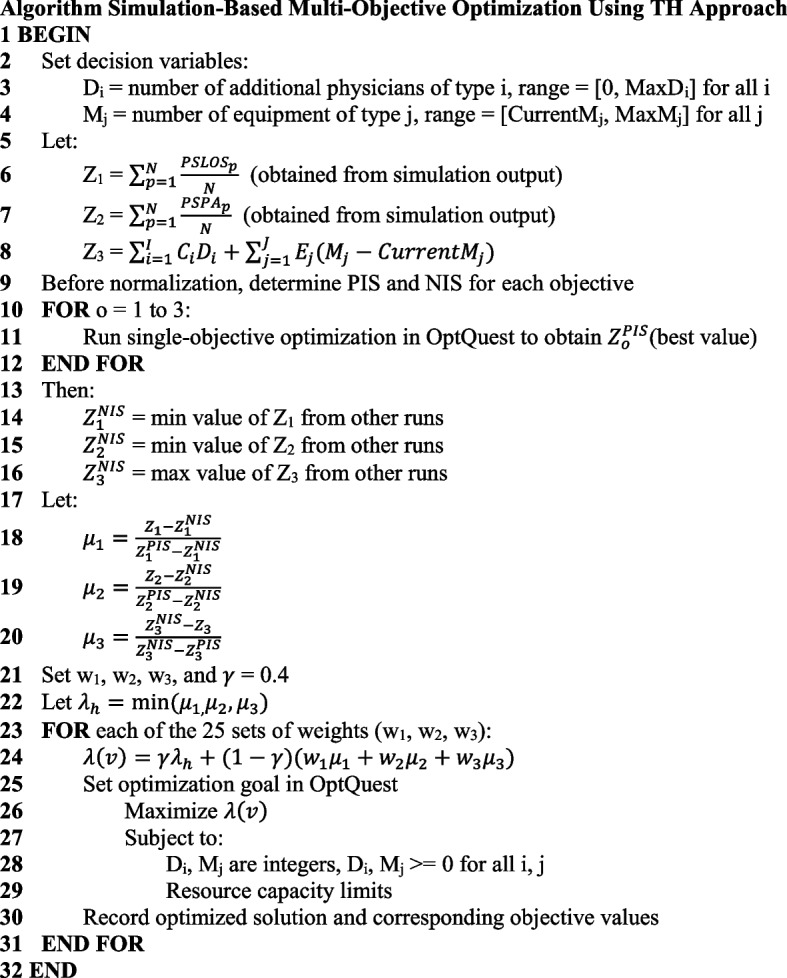
Simulation-based multi-objective optimization algorithm using Torabi-Hassini approach and OptQuest
Evaluation of results and recommendation process
After performing the optimization, the objective values of the optimized solutions are collected, including the average satisfaction scores related to LOS, physician assignment satisfaction, and cost. These values are then analyzed to determine whether significant differences exist across different optimization weight configurations. To evaluate these differences, Analysis of Variance (ANOVA) and Tukey’s test are applied. Each weight configuration is referred to as a case, with a total of 28 cases considered.
The analysis examines multiple factors, including cases and replications, with replications treated as a blocking factor. The responses measured include patient satisfaction scores for LOS and physician assignment, which are analyzed separately. Using ANOVA, the null hypothesis assumes that the average satisfaction scores across all cases are equal, while the alternative hypothesis suggests that differences exist. A 95% significance level is used, meaning that if the p-value is  0.05, the null hypothesis is rejected. The results confirm that satisfaction scores vary across cases, necessitating further analysis using Tukey’s test.
Tukey’s test is employed to reorganize the data and identify the highest satisfaction scores by comparing all pairs of means. It groups satisfaction scores that do not show statistically significant differences. All statistical analyses are conducted using Minitab 20.
Following the grouping process, the base case serves as a benchmark for comparison. Cases are categorized based on their satisfaction scores relative to the base case:
“Higher” – Case with significantly higher satisfaction scores than the base case.
“Unchanged” – Case within the same statistical group as the base case.
“Lower” – Case with significantly lower satisfaction scores than the base case.
This classification helps in identifying the most effective resource allocation strategies for improving patient satisfaction across different hospital scenarios.
The decision guideline logic is developed through a comprehensive evaluation of each event’s impact on patient satisfaction and investment costs, serving as a critical decision-support tool for hospital resource management. These guidelines are designed to help decision-makers identify and prioritize events that effectively enhance patient satisfaction while ensuring cost-effectiveness. The decision logic is structured as follows:
Case with Both Lower: If both satisfaction metrics (LOS and physician assignment) are labeled as “Lower”, the case is not recommended. This indicates that implementing the case would result in a decline in patient satisfaction for both factors, making it an unsuitable option.
Case with One Lower and One Unchanged: If one metric is “Lower” and the other is “Unchanged”, the case is not recommended. Without any improvement in either objective and a decline in one, adopting this case would not be beneficial.
Case with Both Unchanged: If both satisfaction metrics remain “Unchanged”, the case is not recommended. Since no improvements are observed, implementing such a case would not provide meaningful benefits to the hospital system.
Case with Both Higher: If both satisfaction metrics are labeled as “Higher”, the decision should consider investment cost. If the cost falls within an acceptable range set by hospital decision-makers, the case is recommended. However, if the cost exceeds the acceptable threshold, the case should be compared with other alternatives to ensure cost-effectiveness.
Case with One Higher and One Unchanged: When one satisfaction metric is labeled as “Higher” and the other as “Unchanged”, the investment cost becomes the deciding factor. The case with the lowest investment cost is recommended, as it provides an improvement in at least one objective while maintaining the other without unnecessary expenditure.
Case with One Higher and One Lower: If one metric is labeled as “Higher” and the other as “Lower”, the case is not recommended. A decline in one satisfaction factor outweighs any potential gains in the other, making this case an unsuitable choice.
This framework provides hospitals with a powerful tool to anticipate and manage resource needs proactively. It equips decision-makers with actionable insights into patient satisfaction, resource allocation, and operational efficiency, aligning with the SDGs to support sustainable healthcare development.
Application of framework to case studies
To explore the effectiveness of our resource management framework in a real-world context, we apply it to the ophthalmology department of Thammasat University Hospital. As one of Thailand’s prominent public hospitals, Thammasat University Hospital serves a large and diverse patient base, including walk-in patients, scheduled appointments, and referrals from smaller, rural hospitals. The ophthalmology department, in particular, is a high-demand unit, addressing a range of eye conditions and frequently managing elderly patients and emergency cases. Given the complex workflows and the department’s critical role in delivering specialized care, it provides an ideal setting to examine the impacts of different resource allocation strategies across varying scenarios.
Using historical data from the ophthalmology department and incorporating generated data specific to each case, we model three potential future scenarios: an aging society, a pandemic condition, and a referral acceptance enhancement. Each scenario is designed to simulate distinct challenges the department may face, including increased patient volumes, unpredictable resource availability, and the need to prioritize referrals. Through this case study application, the framework aims to deliver actionable insights that support both the department’s current goals and its preparedness for future demands.
Scenario 1: aging society
The ophthalmology department is among the most frequently visited units in hospitals, especially by elderly patients [80]. Age-related eye conditions, such as cataracts, glaucoma, and macular degeneration, are common health concerns that require frequent consultations, diagnostic procedures, and follow-up treatments. The demand for ophthalmology services is expected to rise sharply due to the increased occurrence of these conditions among older adults, particularly in nursing homes and assisted living facilities, where vision care is often insufficient [81].
Thailand is experiencing a significant demographic shift toward an aging society, with the proportion of individuals aged 60 and older currently at 22.6% of the population. By 2035, this figure is projected to rise to 30.2%, representing a 7.6% increase [82]. This trend poses critical challenges for the healthcare system, particularly outpatient departments (OPDs), which are expected to face a growing demand for medical care from elderly patients. In this study, the projected 7.6% population increase is used to estimate the corresponding rise in patient numbers based on historical data, enabling the model to evaluate the impact of aging on healthcare services and guide resource planning for sustainable hospital operations.
Scenario 2: pandemic scenario
The pandemic significantly affected ophthalmology departments worldwide, leading to a sharp decline in patient visits, elective surgeries, and routine eye care services [83]. Due to the close required for eye examinations, many ophthalmology clinics initially paused operations to prevent virus transmission [84]. This led to delays in the diagnosis and treatment of vision-threatening conditions such as glaucoma, diabetic retinopathy, and macular degeneration, which could result in irreversible vision loss if untreated.
In this case study, the OPD faces a simulated physician unavailability rate of 20%, reflecting the impact of staff being reassigned to critical areas, falling ill, or managing other crisis-related responsibilities [85]. Additionally, the number of available resources—such as diagnostic equipment and supporting staff—is reduced by half to comply with social distancing protocols and limit crowding within the facility. To address the unique demands of a pandemic, an additional triage process is introduced to screen patients for pandemic-related symptoms before the normal triage process. This adjustment ensures that patients requiring immediate care or isolation are appropriately prioritized. These modeled changes allow the framework to evaluate resource allocation strategies under pandemic conditions and identify ways to maintain operational efficiency and patient satisfaction.
Scenario 3: referral acceptance enhancement
As a large public hospital, the ophthalmology department not only serves walk-in patients and those with appointments but also receives referral requests from smaller hospitals, particularly from rural areas with limited healthcare resources. These referrals are critical for ensuring that patients from rural area receive the specialized care they need [86]. However, staff shortages pose a significant challenge, often limiting the hospital’s capacity to accept all incoming referral cases [87, 88].
In the current operation, the hospital’s outpatient department (OPD) accepts approximately 17-28% of referral cases due to resource constraints [89]. Following discussions with the OPD executives, a target acceptance rate of 50% was set to improve equitable access to specialized care. This scenario models the changes required to achieve this target, including adjustments in resource allocation such as additional physicians and support staff. By simulating these adjustments, the framework evaluates the resource requirements and operational strategies needed to enhance referral acceptance rates without compromising the quality of care for other patients.
Results
This section presents the optimization results for each of the three scenarios: aging society, pandemic disruption, and referral acceptance enhancement. For each scenario, the model identifies the optimal combination of resources—including the number of physicians and support equipment—that balances patient satisfaction with investment cost. The outcomes are interpreted through a decision guideline framework, providing clear, actionable recommendations tailored to different operating conditions. Results are further categorized by hospital size, enabling comparisons and scalable strategies for small, medium, and large facilities.
To evaluate patient satisfaction related to LOS, the model incorporates performance metrics derived from an ordinal logistic regression analysis. This analysis, based on patient survey data, identified LOS, prior hospital visit experience, and prior department visit experience as significant predictors of satisfaction. The reduced regression model, which uses only these key variables, serves as the basis for calculating satisfaction scores within the simulation. Full model results are provided in Appendix 1, with the reduced model summarized in Table 4.
Table 4.
Reduced ordinal logistic regression model for patient satisfaction related to LOS
| Predictor | Coef | SE Coef | Z | P | Odds Ratio | 95% Cl Lower | 95% Cl Upper |
|---|---|---|---|---|---|---|---|
| Const(1) | −7.40216 | 0.390816 | −18.94 | 0.000 | |||
| Const(2) | −5.71580 | 0.347107 | −16.47 | 0.000 | |||
| Const(3) | −3.67999 | 0.305481 | −12.05 | 0.000 | |||
| Const(4) | −0.899797 | 0.208605 | −4.31 | 0.000 | |||
| LOS | |||||||
| 1-2hr | 2.34805 | 0.296699 | 7.91 | 0.000 | 10.47 | 5.85 | 18.72 |
| 2-3hr | 4.70827 | 0.353625 | 13.31 | 0.000 | 110.86 | 55.43 | 221.71 |
| >3hr | 5.77029 | 0.373317 | 15.46 | 0.000 | 320.63 | 154.25 | 666.46 |
| Department visit | |||||||
| No | 0.458282 | 0.268032 | 1.71 | 0.087 | 1.58 | 0.94 | 2.67 |
| Hospital visit | |||||||
| No | −0.497662 | 0.332446 | −1.50 | 0.134 | 0.61 | 0.32 | 1.17 |
In this study, hospitals are categorized into three sizes [90, 91] —small, medium, and large—to reflect differences in capacity, resource availability, and operational complexity. Small-sized hospitals typically serve local communities, operating with around 5–10 physicians and having a bed capacity of fewer than 100. These facilities often face limited staff availability, fewer diagnostic machines, and tight budget constraints. Medium-sized hospitals, serving broader regional populations, generally have 10–30 physicians and 100–300 beds, along with more diversified services and moderate infrastructure. Large-sized hospitals function as major referral centers, equipped with over 30 physicians, more than 300 beds, and a wide array of specialized diagnostic and treatment capabilities. These hospitals are often capable of handling complex cases and serve as central hubs for patients referred from smaller institutions. By classifying hospitals in this way, the framework can offer scalable, tailored recommendations that align with the unique operational and financial realities of each hospital type.
The cost figures associated with each optimized policy were computed using unit cost data collected from hospital records, including physician hourly wages and equipment usage fees. The total investment cost was calculated by summing the cost of all allocated resources in each policy scenario, offering a practical financial assessment of each recommendation.
To evaluate how different priorities affect optimization outcomes, the study applies 25 distinct weight configurations in the objective function. These weights represent varying degrees of emphasis on satisfaction metrics (LOS and physician assignment) versus cost minimization, allowing the framework to function as a sensitivity analysis. By analyzing the results across this range of policy preferences, the study provides valuable insights into how trade-offs emerge and shift under different strategic emphases—equipping decision-makers with a robust understanding of the operational and budgetary implications of each scenario.
Scenario 1: aging society
Simulation and optimization results
With an 8% projected increase in elderly patients over the next decade, the simulation for the aging society scenario models the expected rise in patient volume and its impact on resource demand in the ophthalmology department. The simulation results indicate a significant increase in the average LOS and patient waiting times as patient volume increases. Compared to the baseline, the average LOS extended by 12%, with a noticeable increase in waiting times, especially during peak hours. Physician assignment satisfaction also dropped slightly, as the increased number of patients led to delays in meeting their preferred physicians.
The optimization process helps determine the optimal number of physicians and diagnostic equipment needed to efficiently manage the increased patient volume. By evaluating different resource allocation scenarios, the model identifies a configuration that balances patient satisfaction, LOS, and cost-effectiveness. This ensures that resources are neither underutilized nor excessive, allowing the hospital to maintain high service quality while preventing unnecessary expenditures. By proactively planning for future demands, the hospital can effectively manage patient flow, prevent overcrowding, and sustain efficient and equitable healthcare services in alignment with sustainability goals.
Key insights
Table 5 shows comparison results categorized the events into three distinct groups based on patient satisfaction outcomes: Higher-Higher, Higher-Unchanged, and Unchanged-Unchanged. These classifications serve as the basis for determining which events are recommended for implementation.
Table 5.
Comparison of recommended events for scenario 1: aging society
| Case | SatLOS | SatPA | Label SatLOS | Label SatPA | Cost (THB) |
|---|---|---|---|---|---|
| 17 | 4.0221 | 1.9325 | Higher | Higher | 250,800 |
| 23 | 4.0193 | 1.9325 | Higher | Higher | 491,250 |
| 15 | 4.0193 | 1.9284 | Higher | Higher | 144,000 |
| 5 | 4.0141 | 1.9201 | Higher | Higher | 453,500 |
| 16 | 4.0131 | 1.9289 | Higher | Higher | 157,000 |
| 2 | 4.0042 | 1.9534 | Unchanged | Higher | 490,050 |
| 18 | 4.0074 | 1.9446 | Unchanged | Higher | 274,200 |
| 19 | 4.0084 | 1.9342 | Unchanged | Higher | 508,200 |
| 20 | 4.0018 | 1.9198 | Unchanged | Higher | 429,600 |
| 4 | 4.0001 | 1.9310 | Unchanged | Higher | 132,250 |
| 13 | 4.0262 | 1.9141 | Higher | Unchanged | 409,500 |
| 8 | 4.0259 | 1.9006 | Higher | Unchanged | 149,500 |
| 28 | 4.0251 | 1.9059 | Higher | Unchanged | 501,450 |
| 12 | 4.0239 | 1.9152 | Higher | Unchanged | 300,200 |
| 6 | 4.0213 | 1.9141 | Higher | Unchanged | 128,450 |
| 7 | 4.0211 | 1.9078 | Higher | Unchanged | 167,450 |
| 26 | 4.0196 | 1.9160 | Higher | Unchanged | 476,200 |
| 27 | 4.0192 | 1.9017 | Higher | Unchanged | 135,200 |
| 25 | 4.0166 | 1.9152 | Higher | Unchanged | 261,200 |
| 11 | 4.0157 | 1.9176 | Higher | Unchanged | 287,200 |
| 22 | 4.0144 | 1.9107 | Higher | Unchanged | 139,750 |
| 10 | 4.0131 | 1.9182 | Higher | Unchanged | 116,700 |
| 24 | 4.0111 | 1.9162 | Higher | Unchanged | 171,250 |
| 1 | 4.0298 | 1.8801 | Higher | Lower | 650,700 |
| 21 | 4.0096 | 1.9176 | Unchanged | Unchanged | 305,700 |
| 9 | 4.0087 | 1.9149 | Unchanged | Unchanged | 49,500 |
| 14 | 4.0076 | 1.9151 | Unchanged | Unchanged | 65,950 |
| 3 | 3.9868 | 1.8957 | Unchanged | Unchanged | 0 (base case) |
The Unchanged-Unchanged group includes events where both satisfaction metrics—LOS satisfaction and physician assignment satisfaction—remain the same as the base case. This indicates that modifying the number of resources or adjusting the scenario does not result in any meaningful improvement in patient satisfaction. Consequently, events in this category are not considered beneficial and are eliminated from recommendation.
The Higher-Unchanged group consists of events where one satisfaction metric improves while the other remains unchanged. These events represent potential improvements without negatively impacting other satisfaction aspects. According to the framework, the final recommendation depends on hospital size and available budget, ensuring cost-effective decision-making.
The Higher-Higher group comprises events where both satisfaction metrics show improvement compared to the base case. These events present the most favorable outcomes and are prioritized for recommendation. However, as budget constraints vary by hospital size, the final selection is tailored accordingly:
For small-sized hospitals, decision-makers typically prioritize low-cost options due to financial limitations. If the budget is set at 200,000 THB per month, the recommended event comes from the Higher-Higher category that meets this constraint (case 15 and 16), ensuring optimal patient satisfaction at minimal additional cost. Case 15, which has the lowest cost, requires 3 specialist physicians and 2 nurses, while case 16 requires 4 specialist physicians, 1 visual acuity test machine, and 1 visual field machine.
For medium-sized hospitals, with a higher budget of around 400,000 THB per month, more options from the Higher-Higher category fall within budget (case 15,16, and 17). However, since cost minimization remains a priority, the recommended event is the same as that for small-sized hospitals, as it offers an effective balance between satisfaction improvement and affordability.
For large-sized hospitals, with a larger budget, all Higher-Higher events are feasible. Nonetheless, to maintain cost efficiency, the event recommended for small- and medium-sized hospitals remains the preferred choice, as it offers the best satisfaction gains at the lowest cost.
By categorizing the results and tailoring recommendations based on hospital size and budget constraints, the framework ensures that hospitals can enhance patient satisfaction while maintaining financial sustainability.
Scenario 2: pandemic scenario
Simulation and optimization results
This scenario introduces changes due to pandemic conditions, including a 50% reduction in appointed patients, no walk-in patients, and a 20% chance of physician unavailability. The aim is to evaluate the department’s resilience under these conditions. The simulation shows that the addition of a triage step for symptom screening increases overall LOS by 10%. The reduction in patient volume helps to offset some delays, but the intermittent physician availability results in longer waiting times for patients who need specialized care. Patient satisfaction with physician assignment declines due to the unpredictable availability of physicians.
The optimization process helps determine the optimal number of resources needed to effectively manage patient flow and maintain service quality during a pandemic. By evaluating different staffing configurations, the model identifies the necessary adjustments to triage capacity and physician availability to minimize the impact on LOS and patient satisfaction. This ensures that hospitals can maintain continuity of care and operational efficiency while adapting to pandemic-related disruptions.
Key insights
Table 6 shows comparison results for the pandemic scenario categorize the events into three groups: Higher-Higher, Higher-Unchanged, and Unchanged-Unchanged, guiding hospitals in selecting the most cost-effective resource allocation strategy.
Table 6.
Comparison of recommended events for scenario 2: pandemic scenario
| Case | SatLOS | SatPA | Label SatLOS | Label SatPA | Cost (THB) |
|---|---|---|---|---|---|
| 15 | 4.0193 | 1.9325 | Higher | Higher | 510,950 |
| 8 | 4.0487 | 1.8879 | Higher | Unchanged | 134,500 |
| 7 | 4.0445 | 1.8954 | Higher | Unchanged | 261,700 |
| 10 | 4.0434 | 1.8900 | Higher | Unchanged | 103,700 |
| 13 | 4.0431 | 1.8910 | Higher | Unchanged | 113,500 |
| 6 | 4.0369 | 1.8999 | Higher | Unchanged | 416,000 |
| 1 | 4.0344 | 1.9147 | Higher | Unchanged | 404,000 |
| 14 | 4.0262 | 1.9125 | Higher | Unchanged | 149,500 |
| 12 | 4.0259 | 1.9270 | Higher | Unchanged | 250,800 |
| 28 | 4.0259 | 1.9067 | Higher | Unchanged | 464,450 |
| 24 | 4.0220 | 1.9127 | Higher | Unchanged | 119,250 |
| 11 | 4.0213 | 1.8831 | Higher | Unchanged | 450,350 |
| 27 | 4.0196 | 1.9160 | Higher | Unchanged | 476,200 |
| 26 | 4.0192 | 1.9017 | Higher | Unchanged | 122,200 |
| 17 | 4.0191 | 1.9284 | Higher | Unchanged | 120,050 |
| 16 | 4.0131 | 1.9320 | Unchanged | Higher | 112,300 |
| 22 | 4.0084 | 1.9342 | Unchanged | Higher | 508,200 |
| 2 | 4.0051 | 1.9502 | Unchanged | Higher | 622,750 |
| 23 | 4.0166 | 1.9152 | Unchanged | Unchanged | 261,200 |
| 18 | 4.0157 | 1.9290 | Unchanged | Unchanged | 122,000 |
| 19 | 4.0144 | 1.9107 | Unchanged | Unchanged | 126,750 |
| 20 | 4.0109 | 1.9141 | Unchanged | Unchanged | 136,050 |
| 5 | 4.0103 | 1.9031 | Unchanged | Unchanged | 410,050 |
| 9 | 4.0097 | 1.9024 | Unchanged | Unchanged | 240,750 |
| 25 | 4.0073 | 1.9289 | Unchanged | Unchanged | 396,000 |
| 4 | 4.0022 | 1.9312 | Unchanged | Unchanged | 315,600 |
| 21 | 4.0018 | 1.9198 | Unchanged | Unchanged | 429,600 |
| 3 | 3.9936 | 1.8928 | Unchanged | Unchanged | 0 (base case) |
The Unchanged-Unchanged group represents cases where neither satisfaction metric improves compared to the base case. Since these events do not offer meaningful benefits, they are not considered for recommendation.
The Higher-Higher group includes events where both LOS satisfaction and physician assignment satisfaction improve, making them the most desirable choices. However, in this scenario, only one case falls into this category (case 15), with a high cost of 510,950 THB per month. This case requires 9 specialist physicians, 4 general physicians, 3 nurses, 2 visual field test machines, and 1 OCT machine. Due to its significant financial requirement, this option is best suited for large hospitals with sufficient budgets to invest in maximizing patient satisfaction across both metrics.
For small- and medium-sized hospitals, where budget constraints are a concern, the Higher-Unchanged group provides more feasible alternatives. If LOS satisfaction is the priority, case 10 offers the lowest cost solution at 103,700 THB per month. It requires 3 specialist physicians and 1 visual acuity test machine. If physician assignment satisfaction is prioritized, case 16 is the most cost-effective option at 112,300 THB per month. It requires 2 specialist physicians and 2 nurses.
By structuring recommendations based on hospital size and financial limitations, the framework ensures that large hospitals can invest in comprehensive improvements, while smaller hospitals can implement targeted enhancements to maintain service quality in a cost-effective manner during a pandemic.
Scenario 3: referral acceptance enhancement
Simulation and optimization results
In this scenario, the goal is to increase the hospital’s referral acceptance rate from 17-28% to 50%, thereby supporting underserved patients from smaller hospitals who need specialized ophthalmology care. The simulation indicates that increasing referral acceptance rates to 50% creates a significant rise in emergency patient volume, resulting in longer wait times for both referred and existing patients. LOS increases by 15% without additional resources, and emergency patients experience delays in treatment priority, impacting their satisfaction.
To achieve the target referral acceptance rate, an appropriate resource allocation strategy is essential to manage the increased workload effectively. Ensuring sufficient staffing levels helps reduce LOS and allows emergency referral cases to be prioritized without causing delays in service. Without proper resource adjustments, an increase in referral cases could lead to longer wait times and a decline in patient satisfaction. By enhancing the hospital’s capacity to accept and manage referred cases, the department can improve healthcare accessibility, particularly for patients from rural hospitals. This approach supports SDG 10 (Reducing Inequalities) by ensuring equitable access to specialized medical care.
Key insights
Table 7 shows comparison results for the referral acceptance scenario categorize the events into three groups: Higher-Higher, Higher-Unchanged, and Unchanged-Unchanged, providing a structured approach for determining the most suitable resource allocation strategy.
Table 7.
Comparison of recommended events for scenario 3: referral acceptance enhancement
| Case | SatLOS | SatPA | Label SatLOS | Label SatPA | Cost (THB) |
|---|---|---|---|---|---|
| 2 | 4.0344 | 1.9554 | Higher | Higher | 416,000 |
| 1 | 4.0673 | 1.9198 | Higher | Unchanged | 576,200 |
| 13 | 4.0487 | 1.8900 | Higher | Unchanged | 116,700 |
| 8 | 4.0449 | 1.8879 | Higher | Unchanged | 134,500 |
| 12 | 4.0445 | 1.9227 | Higher | Unchanged | 250,800 |
| 11 | 4.0369 | 1.8831 | Higher | Unchanged | 145,350 |
| 7 | 4.0305 | 1.8954 | Higher | Unchanged | 261,700 |
| 14 | 4.0262 | 1.9125 | Higher | Unchanged | 156,500 |
| 28 | 4.0259 | 1.9067 | Higher | Unchanged | 464,450 |
| 25 | 4.0220 | 1.9127 | Higher | Unchanged | 119,250 |
| 15 | 4.0193 | 1.9325 | Unchanged | Higher | 265,950 |
| 16 | 4.0131 | 1.9320 | Unchanged | Higher | 115,350 |
| 22 | 4.0084 | 1.9342 | Unchanged | Higher | 508,200 |
| 4 | 4.0049 | 1.9312 | Unchanged | Higher | 315,600 |
| 27 | 4.0196 | 1.9160 | Unchanged | Unchanged | 476,200 |
| 26 | 4.0192 | 1.9017 | Unchanged | Unchanged | 122,200 |
| 17 | 4.0191 | 1.9284 | Unchanged | Unchanged | 120,050 |
| 6 | 4.0188 | 1.8999 | Unchanged | Unchanged | 416,000 |
| 23 | 4.0166 | 1.9152 | Unchanged | Unchanged | 261,200 |
| 18 | 4.0157 | 1.9290 | Unchanged | Unchanged | 122,000 |
| 21 | 4.0144 | 1.9107 | Unchanged | Unchanged | 126,750 |
| 19 | 4.0109 | 1.9141 | Unchanged | Unchanged | 136,050 |
| 10 | 4.0103 | 1.8900 | Unchanged | Unchanged | 132,250 |
| 5 | 4.0075 | 1.9031 | Unchanged | Unchanged | 410,050 |
| 24 | 4.0073 | 1.9289 | Unchanged | Unchanged | 396,000 |
| 9 | 4.0022 | 1.9024 | Unchanged | Unchanged | 124,750 |
| 20 | 4.0018 | 1.9198 | Unchanged | Unchanged | 429,600 |
| 3 | 4.0007 | 1.8902 | Unchanged | Unchanged | 0 (base case) |
The Higher-Higher group consists of events where both LOS satisfaction and physician assignment satisfaction improve, making them the most favorable options. Unlike other scenarios, hospitals that accept referral cases are typically large-sized hospitals with better facilities and more resources to manage patient influx. Given their capacity, these hospitals can consider case 2, which falls under the Higher-Higher category, with an associated cost of 416,000 THB per month. This case requires 6 specialist physicians, 3 general physicians, 3 nurses, 2 visual field test machines, 1 OCT, and 2 visual acuity test machines. This option ensures the hospital can increase referral acceptance rates while maintaining high service quality and patient satisfaction.
For hospitals seeking lower-cost alternatives, the Higher-Unchanged group offers viable options. If LOS satisfaction is prioritized, the most cost-effective choice is case 13, at 116,700 THB per month. It requires 3 specialist physicians and 1 visual field test machine. If physician assignment satisfaction is the priority, case 16 provides the best balance at 115,350 THB per month. It requires 2 specialist physicians, 1 general physician, 1 nurse, and 1 scan queue machine. These options allow hospitals to improve patient satisfaction in at least one key metric while managing operational costs.
The Unchanged-Unchanged group includes cases where neither satisfaction metric improves compared to the base case. Since these events do not provide meaningful benefits, they are not recommended for implementation.
By structuring recommendations based on hospital capabilities and budget considerations, the framework ensures that large referral hospitals can make strategic investments to improve patient care, while also providing alternative solutions for hospitals with cost constraints.
Table 8 summarizes the number of additional resources and associated cost increases for selected cases that significantly improve patient satisfaction. The table compiles recommended results across all three scenario types—aging society, pandemic disruption, and referral acceptance enhancement—to provide a comprehensive view of effective resource configurations. It includes case showing improvement in both satisfaction metrics (LOS and physician assignment) and others that demonstrate improvement in only one of the two. To evaluate financial feasibility, the table also presents the percentage cost increase relative to the hospital’s reported annual outpatient operations budget [92], approximately 10,000,000 THB. This reported budget reflects a large-sized hospital; for small- and medium-sized facilities, the cost threshold can be adjusted proportionally based on available financial capacity. The percentage increase is calculated by dividing the additional monthly cost by the monthly equivalent of the annual budget (833,333 THB), offering a clear perspective on the financial impact of each proposed case.
Table 8.
Recommended resource configurations and cost impact for selected cases improving patient satisfaction across all scenarios
| Scenario | Referral rate | Satisfaction increase | Additional specialist physicians | Additional general physicians | Additional nurses | Additional equipment | Added cost (THB per month) | % Cost increase |
|---|---|---|---|---|---|---|---|---|
| Base case | 17% | - | - | - | - | - | - | - |
| Aging 1 | 17% | PSLOS, PSPA | 3 | - | 2 | - | 144,000 | 17.28% |
| Aging 2 | 17% | PSLOS, PSPA | 4 | - | - | 1 | 157,000 | 18.84% |
| Pandemic 1 | 17% | PSLOS, PSPA | 9 | 4 | 3 | 3 | 510,950 | 61.32% |
| Pandemic 2 | 17% | PSLOS | 3 | - | - | 1 | 103,700 | 12.44% |
| Pandemic 3 | 17% | PSPA | 2 | - | 2 | - | 112,300 | 13.48% |
| Referral 1 | 50% | PSLOS, PSPA | 6 | 3 | 3 | 5 | 416,000 | 49.92% |
| Referral 2 | 50% | PSLOS | 3 | - | - | 1 | 116,700 | 14.01% |
| Referral 3 | 50% | PSPA | 2 | 1 | 1 | 1 | 115,350 | 13.84% |
Discussion
Practical implications for hospital management
The developed framework addresses the complex and dynamic challenges of hospital resource management by integrating simulation and optimization techniques. This comprehensive approach enables hospitals to evaluate and plan resource allocation under diverse scenarios, providing actionable insights tailored to specific operational contexts. Unlike previous studies, which often focus on isolated objectives or lack practical applicability, this framework incorporates real-world data and scenario-based projections to deliver robust, adaptable solutions that align with both hospital and societal goals.
A key strength of the framework lies in its scenario-driven approach, which prepares hospitals to navigate varying future challenges. In the aging society scenario, the framework identifies resource requirements to accommodate the growing number of elderly patients, ensuring timely and effective care. The pandemic scenario highlights the framework’s ability to model operational disruptions, such as reduced staff availability and altered patient flows, and optimize resource allocation to maintain service quality during crises. The referral acceptance enhancement scenario demonstrates the framework’s capacity to improve equitable access to specialized care by determining the resources needed to increase referral acceptance rates, particularly for underserved populations.
The framework’s focus on optimizing key metrics—such as LOS, physician assignment satisfaction, and operational costs—ensures that resource allocation strategies are both patient-centered and economically viable. This dual focus on operational efficiency and patient satisfaction sets the framework apart from existing models. Additionally, by aligning with SDG 3 (Good Health and Well-Being), SDG 10 (Reducing Inequalities), and SDG 11 (Sustainable Cities and Communities), the framework extends its impact beyond hospital operations, contributing to global healthcare sustainability goals. Through its ability to address multidimensional objectives, the framework equips hospitals with a strategic tool to navigate future uncertainties while promoting sustainable and resilient healthcare systems.
This framework not only fills critical gaps in existing literature but also equips hospitals with practical tools to adapt and thrive in evolving healthcare environments. The Table 9 compares the objectives, achievements, challenges, and contributions of existing studies in healthcare resource management with the current research. While previous studies provide valuable insights into specific aspects of hospital operations, they face limitations in scope, applicability, or methodological integration. Cabrera et al. [38] focused on minimizing patient LOS through simulation and optimization but overlooked broader objectives such as cost-efficiency and patient satisfaction. Similarly, Chang et al. [39] developed a satisfaction simulation model for ICU activities but lacked optimization approaches, limiting its practical applicability to resource allocation.
Table 9.
Comparison of existing literature and this research highlighting unique contributions and practical applications
| Aspect | Cabrera [38] | Chang [39] | Fan [93] | Tanantong [94] | This Research |
|---|---|---|---|---|---|
| Focus Area | Enhance simulation and optimization for operations | Link ICU processes to patient and family demands | Analyze patient preferences and behavior patterns | Optimize resource allocation for patient satisfaction | Ophthalmology-specific resource management tailored to real-world scenarios |
| Scenario Considered | General operations; no specific scenarios | Focus on ICU activities | Outpatient service optimization | Current scenario of hospital | Aging society, pandemic condition, referral acceptance enhancement |
| Methodology | Simulation and optimization of LOS | Satisfaction simulation; lacks optimization | Simulation model with patient behavior patterns | Simulation and optimization with patient satisfaction metrics | Combines simulation, optimization, and real-world data with scenario projections |
| Key Metrics | LOS minimization | Patient and family satisfaction | Patient preferences and behavioral patterns | Patient satisfaction (LOS), cost-efficiency | Patient satisfaction (LOS, physician assignment), cost-efficiency |
| SDGs | None explicitly addressed | None explicitly addressed | None explicitly addressed | None explicitly addressed | Direct alignment with SDG 3, SDG 8, and SDG 10 |
| Practical Applicability | Limited focus on broader hospital contexts | Lacks optimization for actionable outcomes | Narrow focus on behavioral patterns | Limited generalizability | Actionable, scenario-specific recommendations tailored for sustainable hospital operations |
| Key Contribution | Highlights operational factors affecting LOS | Satisfaction linked to ICU activities; no broader scope | Predicts patient preferences; lacks service-level optimization | Optimizes satisfaction toward LOS and cost | Provides comprehensive, actionable insights for sustainable ophthalmology operations under diverse future scenarios |
In contrast, this research addresses critical gaps by combining simulation and optimization techniques with real-world data and scenario-based projections. It focuses on ophthalmology departments—a vital yet underexplored area in hospital resource planning—and integrates three distinct scenarios: aging society, pandemic conditions, and referral acceptance enhancement. Unlike Fan et al. [93], whose work focused narrowly on patient behavior patterns, this study evaluates patient satisfaction through measurable outcomes such as LOS and physician assignment, providing actionable insights for decision-makers. Additionally, Tanantong et al. [94] examined current hospital operations but had limited generalizability, as their model focused solely on one aspect of satisfaction—LOS—without considering broader resource allocation challenges. This research extends beyond these limitations by offering a comprehensive, scenario-driven approach that balances multiple satisfaction factors and operational efficiency, making it more adaptable to real-world hospital settings.
Furthermore, this research explicitly aligns with the Sustainable Development Goals (SDGs), addressing Goal 3 (Good Health and Well-Being), Goal 10 (Reducing Inequalities), and SDG 11 (Sustainable Cities and Communities). This alignment ensures that resource allocation strategies are not only operationally effective but also contribute to broader societal objectives. By offering scenario-specific recommendations, this research provides a more holistic and practical framework for hospitals, filling the gaps identified in the literature and enabling sustainable healthcare planning.
Implications for sustainable healthcare planning
The findings from this study underscore the importance of adaptive resource management in public hospitals, particularly within departments like ophthalmology, which face diverse demands and patient needs. By applying simulation-based optimization across three scenarios—an aging society, pandemic scenario, and referral enhancement—this research provides insights into the resources required to maintain high-quality care under varying constraints. Each scenario presents unique challenges, from increased patient volumes to staff shortages and the prioritization of referral cases. Recognizing and planning for these specific demands is critical for hospitals aiming to achieve sustainability in their operations, ensuring that they can provide consistent and equitable care despite future uncertainties.
A key implication for sustainable healthcare planning is the need for flexibility and scalability in resource allocation. The pandemic scenario demonstrated the importance of adaptable staffing strategies, such as maintaining a reserve of physicians or support staff, to counteract unpredictable availability and operational disruptions. By incorporating flexibility into staffing plans, hospitals can avoid overextending their resources while still being prepared for emergency conditions. This adaptable approach aligns with SDG 3 (Good Health and Well-Being), as it ensures that essential health services can be maintained even during crises, safeguarding patient satisfaction and continuity of care.
Equitable healthcare access is a core focus of this study, particularly illustrated in the referral acceptance enhancement scenario, which models how public hospitals can prepare to accommodate a greater volume of referred patients, often originating from rural or under-resourced facilities. As large hospitals face increasing demand for specialized care, proactive planning is essential to ensure that capacity limitations do not become a barrier to equity.By increasing the referral acceptance rate in the model from 17% to 50%, this scenario demonstrates a substantial improvement in access for patients from underserved regions, directly supporting SDG 10 (Reducing Inequalities). To achieve this increase, hospitals would need to invest in additional resources, resulting in a system cost rise of 49.92% for the case that improves both satisfaction metrics—LOS and physician assignment. Alternatively, hospitals with limited budgets could pursue less costly strategies that improve only one satisfaction dimension: a 14.01% cost increase for LOS-related satisfaction or a 13.84% increase for physician assignment satisfaction. These options, along with the corresponding resource requirements and cost implications, are summarized in Table 8. Beyond immediate operational recommendations, the framework provides strategic value for mid- and long-term planning, such as developing 3-year or 5-year staffing and resource investment plans. Since the training and onboarding of new physicians and nurses require considerable lead time, having data-informed forecasts on future staffing needs enables hospitals to align human resource development with projected healthcare demands. This model supports evidence-based policy formulation, giving hospital administrators a forward-looking tool to plan workforce expansion, equipment procurement, and budget allocation. As Thailand moves toward an aging society and growing referral dependence, such strategic foresight is critical to building a resilient and equitable healthcare system. While further research could enhance subgroup-level equity analysis, this study lays the foundation for institutional planning that prioritizes fairness and preparedness.
Lastly, sustainable healthcare planning requires an emphasis on cost-effective and adaptable resource use to support resilient hospital systems within sustainable communities. The aging society scenario revealed that a balanced increase in resources can meet future patient demand while maintaining operational efficiency. Hospitals must carefully evaluate the benefits of additional resources against budget constraints, ensuring optimal allocation to maximize patient satisfaction without overextending financial or environmental resources. Sustainable planning involves making informed decisions that enhance the quality of care while fostering long-term resilience and accessibility in healthcare systems, aligning with SDG 11 (Sustainable Cities and Communities) by promoting inclusive and sustainable infrastructure that strengthens healthcare services within communities.
Conclusion
Hospitals today face increasing challenges in maintaining high-quality care while preparing for future uncertainties. This study aims to equip hospitals with tools to proactively plan for evolving demands and ensure sustainable operations. To achieve this, we developed a scenario-driven simulation-based optimization framework that analyzes resource allocation strategies under three critical scenarios: aging society, pandemic conditions, and referral acceptance enhancement. The framework focuses on balancing patient satisfaction, cost efficiency, and operational sustainability, providing hospitals with actionable recommendations tailored to each scenario.
Through this analysis, the study delivers a clear resource plan for hospitals under different circumstances. In the aging society scenario, the results identify the number of physicians and equipment required to serve the growing elderly population across various hospital sizes. For the pandemic scenario, the findings demonstrate how environmental changes, such as reduced physician availability and increased triage complexity, affect resource requirements, allowing hospitals to maintain efficient and effective care during crises. Lastly, for the referral acceptance enhancement scenario, the framework outlines the resources needed to achieve higher referral acceptance rates, meeting hospital goals while ensuring equitable access to specialized care for underserved populations.
The recommendations provided by this framework enable hospitals to prepare for future challenges, ensuring sustainable and resilient healthcare delivery. It also supports long-term strategic planning by providing insight into future staffing and resource needs. By aligning with SDG 3 (Good Health and Well-Being), SDG 10 (Reducing Inequalities), and SDG 11 (Sustainable Cities and Communities), this research not only improves hospital operations but also supports broader societal objectives. The scenario-driven approach ensures that hospitals are well-equipped to adapt to diverse situations, making this framework an essential tool for advancing sustainable healthcare systems.
The limitation of this research is that it focuses on three predefined scenarios: aging society, pandemic conditions, and referral acceptance enhancement. Although these scenarios address plausible and critical challenges in hospital resource management, they are specifically tailored to the operational context of the ophthalmology department. Other potential scenarios, such as advances in healthcare technology, sudden policy changes, or unexpected changes in patient demographics, were not considered. This specificity may limit the framework’s applicability to broader or unforeseen challenges, suggesting a need for future studies to explore additional scenarios or develop a more generalizable model. Another limitation of the current framework is its static, single-period design, which models decision-making at a fixed point in time and does not yet account for how conditions might evolve across extended periods of disruption or recovery. While this approach offers valuable insights for strategic planning, it does not currently incorporate adaptive or time-dependent mechanisms, which could further strengthen responses to long-term challenges. Future research could enhance this work by extending it into a dynamic, multi-period modeling framework that captures evolving patterns in demand, staffing, and operational constraints. Such an extension would support more comprehensive resilience planning, enabling hospitals to proactively adjust strategies over time in response to unfolding real-world events.
The framework is designed for the ophthalmology department, using its unique characteristics, such as patient flow, specialized equipment, and physician-patient interactions. While the results provide valuable insights for this department, applying the model to other hospital departments or healthcare systems with different workflows, such as emergency rooms or intensive care units, may require significant adjustments. Factors such as patient acuity, resource utilization patterns, and departmental priorities vary widely and could require a re-calibration of the framework to maintain accuracy and relevance in diverse settings.
Patient satisfaction in this research is measured using two quantitative factors: LOS and physician assignment. Although these metrics are critical for understanding patient experiences in ophthalmology, they may not fully capture the multidimensional nature of satisfaction. Important qualitative factors, such as patient feedback on the quality of care, communication, or staff attentiveness, were not included. This limited scope introduces the potential for bias, as the framework may overemphasize operational efficiency at the expense of other satisfaction determinants. Expanding the metrics to include broader dimensions of patient experiences would enhance the framework’s ability to holistically address patient satisfaction.
Acknowledgements
This research was supported by the Thammasat University Research Unit in Data Innovation and Artificial Intelligence. The first author acknowledges the dual doctoral degree scholarship awarded by the Sirindhorn International Institute of Technology (SIIT) Thammasat University, National Science and Technology Development Agency (NSTDA), and Japan Advanced Institute of Science and Technology (JAIST). The authors wish to express their gratitude to Associate Professor Pharuhat Tor-Udom (M.D.), former Director of Thammasat University Hospital, for his support in the development of this research and for granting permission to access the data during his tenure. The authors also extend their appreciation to Jatupong Juntong (M.D.), former Assistant Director of the Information Technology Department at Thammasat University Hospital, for his valuable advice and support throughout the data collection process. The authors also wish to thank all the nursing staff of the ophthalmology department at Thammasat University Hospital for providing insightful information to support data collection and analysis. Lastly, the authors wish to thank all ophthalmology department staff at Thammasat University Hospital for their excellent cooperation and support.
Materials availability
Not applicable.
Abbreviations
- ANOVA
Analysis of variance
- DES
Discrete event simulation
- ED
Emergency department
- ICU
Intensive care unit
- LOS
Lenght of stay
- OPD
Out patient department
- SDG
Sustainable development goals
Appendix 1
Table 10 presents the full ordinal logistic regression model used to analyze the factors influencing patient satisfaction related to LOS. Coefficient estimates, standard errors, and p-values for each factor are reported below.
Table 10.
Full Factor Table for Ordinal Logistic Regression Analysis
| Predictor | Coef | SE Coef | Z | P | Odds Ratio | 95% Cl Lower | 95% Cl Upper |
|---|---|---|---|---|---|---|---|
| Const(1) | -7.25136 | 0.818807 | -8.86 | 0.000 | |||
| Const(2) | -5.52026 | 0.798820 | -6.91 | 0.000 | |||
| Const(3) | -3.44020 | 0.782176 | -4.40 | 0.000 | |||
| Const(4) | -0.610074 | 0.750927 | -0.81 | 0.000 | |||
| LOS | |||||||
| 1-2hr | 2.39118 | 0.266042 | 8.00 | 0.000 | 10.93 | 6.08 | 19.63 |
| 2-3hr | 4.80260 | 0.358458 | 13.40 | 0.000 | 121.83 | 60.34 | 245.96 |
| >3hr | 5.89143 | 0.379425 | 15.53 | 0.000 | 361.92 | 172.05 | 761.35 |
| Age | |||||||
| 18-24 | -0.639138 | 0.7767392 | -0.83 | 0.405 | 0.53 | 0.12 | 2.37 |
| 25-44 | -0.110935 | 0.711966 | -0.16 | 0.876 | 0.89 | 0.22 | 3.61 |
| 45-64 | -0.661788 | 0.709848 | -0.93 | 0.351 | 0.52 | 0.13 | 2.07 |
| >65 | -0.263091 | 0.732513 | -0.36 | 0.719 | 0.77 | 0.18 | 3.23 |
| Gender | |||||||
| Female | 0.174750 | 0.195666 | 0.89 | 0.372 | 1.19 | 0.81 | 1.75 |
| Department visit | |||||||
| No | 0.697572 | 0.351071 | 1.99 | 0.047 | 2.01 | 1.01 | 4.00 |
| Hospital visit | |||||||
| No | -0.540363 | 0.346463 | -1.56 | 0.119 | 0.58 | 0.30 | 1.15 |
| Appointment | |||||||
| No | -0.283282 | 0.340569 | -0.83 | 0.406 | 0.75 | 0.39 | 1.47 |
Authors’ contributions
N.C.: Problem conceptualization, validation, data curation, modelling and analysis, and writing. W.P.: Problem conceptualization, validation, data curation, modelling and analysis, and writing. T.T.: Problem conceptualization, validation, data curation, result analysis, writing, and corresponding author. V.N.: Problem conceptualization, validation, and result analysis. J.K.: Validation, data curation, result analysis.
Funding
This research did not receive any specific grant from funding agencies in the public, commercial, or not-for-profit sectors.
Data availability
The data supporting the findings of this study are sourced from Thammasat University Hospital and are subject to access restrictions. These data were used under license for this study and are not publicly available. Data are however available from the authors upon reasonable request and with permission of Thammasat University Hospital.
Declarations
Ethics approval and consent to participate
It is not applicable. The authors declare that this study does not report on or involve the use of any animal or human data or tissue. All data are from computer simulation, expert consultation, and overview statistics which are not sensitive personal data from individuals. The data access was granted by the former Director of Thammasat University Hospital (Associate Professor Pharuhat Tor-Udom, M.D.) under the research agreement.
Consent for publication
It is not applicable. The authors declare that this study does not contain data from any individual person.
Competing interests
The authors declare no competing interests.
Footnotes
Publisher’s Note
Springer Nature remains neutral with regard to jurisdictional claims in published maps and institutional affiliations.
References
- 1.Moons K, Waeyenbergh G, Pintelon L. Measuring the logistics performance of internal hospital supply chains-a literature study. Omega. 2019;82:205–17. [Google Scholar]
- 2.Heath C, Sommerfield A, von Ungern-Sternberg BS. Resilience strategies to manage psychological distress among healthcare workers during the COVID-19 pandemic: a narrative review. Anaesthesia. 2020;75(10):1364–71. [DOI] [PMC free article] [PubMed] [Google Scholar]
- 3.Sherman JD, Thiel C, MacNeill A, Eckelman MJ, Dubrow R, Hopf H, et al. The green print: advancement of environmental sustainability in healthcare. Resour Conserv Recycl. 2020;161:104882. [Google Scholar]
- 4.Mehra R, Sharma MK. Measures of sustainability in healthcare. Sustain Analytics Model. 2021;1:100001. [Google Scholar]
- 5.Dion H, Evans M. Strategic frameworks for sustainability and corporate governance in healthcare facilities; approaches to energy-efficient hospital management. Benchmark Int J. 2024;31(2):353–90. [Google Scholar]
- 6.Zaidi SAH, Shahbaz M, Hou F, Abbas Q. Sustainability challenges in public health sector procurement: an application of interpretative structural modelling. Socio-Econ Plan Sci. 2021;77:101028. [Google Scholar]
- 7.Sun S, Xie Z, Yu K, Jiang B, Zheng S, Pan X. COVID-19 and healthcare system in China: challenges and progression for a sustainable future. Glob Health. 2021;17:1–8. [DOI] [PMC free article] [PubMed] [Google Scholar]
- 8.Al-Worafi YM. Healthcare facilities in developing countries: infrastructure. In: Handbook of medical and health sciences in developing countries: Education, practice, and research. Heidelberg, Germany: Springer; 2023. pp. 1–21.
- 9.Zhang T, Xu Y, Ren J, Sun L, Liu C. Inequality in the distribution of health resources and health services in China: hospitals versus primary care institutions. Int J Equity Health. 2017;16:1–8. [DOI] [PMC free article] [PubMed] [Google Scholar]
- 10.Basu S, Andrews J, Kishore S, Panjabi R, Stuckler D. Comparative performance of private and public healthcare systems in low-and middle-income countries: a systematic review. PLoS Med. 2012;9(6):e1001244. [DOI] [PMC free article] [PubMed] [Google Scholar]
- 11.Weigl M, Müller A, Zupanc A, Glaser J, Angerer P. Hospital doctors’ workflow interruptions and activities: an observation study. BMJ Qual Saf. 2011;20(6):491–7. [DOI] [PubMed] [Google Scholar]
- 12.Sternberg E. Planning for resilience in hospital internal disaster. Prehospital Disaster Med. 2003;18(4):291–9. [DOI] [PubMed] [Google Scholar]
- 13.Lim WS, Liang CK, Assantachai P, Auyeung TW, Kang L, Lee WJ, et al. COVID-19 and older people in Asia: Asian Working Group for Sarcopenia calls to action. Geriatr Gerontol Int. 2020;20(6):547–58. [DOI] [PMC free article] [PubMed] [Google Scholar]
- 14.Hodgins M, Van Leeuwen D, Braithwaite J, Hanefeld J, Wolfe I, Lau C, et al. The COVID-19 system shock framework: capturing health system innovation during the COVID-19 pandemic. Int J Health Policy Manag. 2021;11(10):2155. [DOI] [PMC free article] [PubMed] [Google Scholar]
- 15.Hopp WJ, Lovejoy WS. Hospital operations: Principles of high efficiency health care. FT Press; 2012.
- 16.Chiou ST, Chen LK. Towards age-friendly hospitals and health services. Arch Gerontol Geriatr. 2009;49:S3–6. [DOI] [PubMed] [Google Scholar]
- 17.Gardellini A, Nardi R, Arienti V, Panuccio D, Bernardi R, Pedone V. Aging, patient-bed management and overcrowding in the medical departments. Ital J Med. 2009;3(1):35–43. [Google Scholar]
- 18.Strunk BC, Ginsburg PB, Banker MI. The Effect Of Population Aging On Future Hospital Demand: A simulation of future spending finds that aging will not be the strongest influence on inpatient hospital use. Health Affairs. 2006;25(Suppl1):W141–9. [DOI] [PubMed] [Google Scholar]
- 19.Laksana MAC, Habibie PH, Wardhana MP, Gumilar KE, Yusuf M, Rahmadhany P, et al. Situation report: maternal health management during COVID-19 pandemic at soetomo general hospital and universitas airlangga academic hospital, surabaya indonesia. Syst Rev Pharm. 2020;11(8):467–71. [Google Scholar]
- 20.Azizi MR, Atlasi R, Ziapour A, Abbas J, Naemi R. Innovative human resource management strategies during the COVID-19 pandemic: A systematic narrative review approach. Heliyon. 2021;7(6):1–9. [DOI] [PMC free article] [PubMed]
- 21.Hamouche S. Human resource management and the COVID-19 crisis: Implications, challenges, opportunities, and future organizational directions. J Manag Organ. 2023;29(5):799–814. [Google Scholar]
- 22.Arora M. Reduced burden on urban hospitals by strengthening rural health facilities: Perspective from India. J Fam Med Primary Care. 2024;13(4):1178–82. [DOI] [PMC free article] [PubMed] [Google Scholar]
- 23.Skinner L, Wong S, Colla C. Rethinking rurality: using hospital referral regions to investigate rural-urban health outcomes. BMC Health Serv Res. 2022;22(1):1312. [DOI] [PMC free article] [PubMed] [Google Scholar]
- 24.Akbari A, Mayhew A, Al-Alawi MA, Grimshaw J, Winkens R, Glidewell E, et al. Interventions to improve outpatient referrals from primary care to secondary care. Cochrane Database Syst Rev. 1996;2011(1):1–58. [DOI] [PMC free article] [PubMed]
- 25.Cathcart J, Cowan N, Tully V. Referral finder: saving time and improving the quality of in-hospital referrals. BMJ Open Qual. 2016;5(1):u209356-w3951. [DOI] [PMC free article] [PubMed] [Google Scholar]
- 26.Scala A, Ponsiglione AM, Loperto I, Della Vecchia A, Borrelli A, Russo G, et al. Lean six sigma approach for reducing length of hospital stay for patients with femur fracture in a university hospital. Int J Environ Res Public Health. 2021;18(6):2843. [DOI] [PMC free article] [PubMed] [Google Scholar]
- 27.Asuquo D, Umoren I, Osang F, Attai K. A machine learning framework for length of stay minimization in healthcare emergency department. Stud Eng Technol. 2023;10(1):117. [Google Scholar]
- 28.Abdalkareem ZA, Amir A, Al-Betar MA, Ekhan P, Hammouri AI. Healthcare scheduling in optimization context: a review. Health Technol. 2021;11:445–69. [DOI] [PMC free article] [PubMed] [Google Scholar]
- 29.Ordu M, Demir E, Tofallis C, Gunal MM. A novel healthcare resource allocation decision support tool: A forecasting-simulation-optimization approach. J Oper Res Soc. 2021;72(3):485–500. [Google Scholar]
- 30.Chemkomnerd N, Pannakkong W, Tanantong T, Huynh VN, Karnjana J. A Simulation-Based Multi-Objective Optimization Framework to Enhance Patient Satisfaction: A Case Study of Ophthalmology Department Management. IEEE Access. 2024;12:93197–220.
- 31.Amado V, Couto MT, Filipe M, Möller J, Wallis L, Laflamme L. Assessment of critical resource gaps in pediatric injury care in Mozambique’s four largest Hospitals. PLoS One. 2023;18(6):e0286288. [DOI] [PMC free article] [PubMed] [Google Scholar]
- 32.Patel MP, Schettini P, O’Leary CP, Bosworth HB, Anderson JB, Shah KP. Closing the referral loop: an analysis of primary care referrals to specialists in a large health system. J Gen Intern Med. 2018;33:715–21. [DOI] [PMC free article] [PubMed] [Google Scholar]
- 33.Sagayam MS, Sengupta A, Mazundar S. Healthcare Referral, Market Imperfection and Health Policies in India: A Populist Argument. J Health Manag. 2025;0(0):09720634251326492.
- 34.Sommer AC, Blumenthal EZ. Telemedicine in ophthalmology in view of the emerging COVID-19 outbreak. Graefes Arch Clin Exp Ophthalmol. 2020;258:2341–52. [DOI] [PMC free article] [PubMed] [Google Scholar]
- 35.Kespichayawattana J, Jitapunkul S. Health and health care system for older persons. Ageing Int. 2008;33:28–49. [Google Scholar]
- 36.Martinez-Gonzalez NA, Rosemann T, Djalali S, Huber-Geismann F, Tandjung R. Task-shifting from physicians to nurses in primary care and its impact on resource utilization: a systematic review and meta-analysis of randomized controlled trials. Med Care Res Rev. 2015;72(4):395–418. [DOI] [PubMed] [Google Scholar]
- 37.Boehm LM, Stolldorf DP, Jeffery AD. Implementation science training and resources for nurses and nurse scientists. J Nurs Sch. 2020;52(1):47–54. [DOI] [PMC free article] [PubMed] [Google Scholar]
- 38.Cabrera E, Taboada M, Iglesias ML, Epelde F, Luque E. Simulation optimization for healthcare emergency departments. Procedia Comput Sci. 2012;9:1464–73. [Google Scholar]
- 39.Chang HT, Jen HY, Dahlgaard-Park SM. Using service simulation to analyse the satisfaction with the processes of intensive care unit in the hospital: the perspective of the patient and the family. Total Qual Manag Bus Excell. 2013;24(7–8):869–85. [Google Scholar]
- 40.Abo-Hamad W, Arisha A. Simulation-based framework to improve patient experience in an emergency department. Eur J Oper Res. 2013;224(1):154–66. [Google Scholar]
- 41.Norouzzadeh S, Riebling N, Carter L, Conigliaro J, Doerfler ME. Simulation modeling to optimize healthcare delivery in an outpatient clinic. In: 2015 Winter Simulation Conference (WSC). Huntington Beach, CA: IEEE; 2015. pp. 1355–66.
- 42.Ardakani ES, Larimi NG, Nejad MO, Hosseini MM, Zargoush M. A resilient, robust transformation of healthcare systems to cope with COVID-19 through alternative resources. Omega. 2023;114:102750. [DOI] [PMC free article] [PubMed] [Google Scholar]
- 43.Hosseini-Motlagh SM, Samani MRG, Karimi B. Resilient and social health service network design to reduce the effect of COVID-19 outbreak. Ann Oper Res. 2023;328(1):903–75. [DOI] [PMC free article] [PubMed] [Google Scholar]
- 44.Yinusa A, Faezipour M. Optimizing healthcare delivery: a model for staffing, patient assignment, and resource allocation. Appl Syst Innov. 2023;6(5):78. [Google Scholar]
- 45.Yin C, McKay A. Introduction to modeling and simulation techniques. In: Proceedings of ISCIIA 2018 and ITCA 2018. Tengzhou, China: Leeds; 2018.
- 46.Leemis LM, Park SK. Discrete-event simulation: A first course. Pearson Prentice Hall Upper Saddle River; 2006.
- 47.Bhattacharjee P, Ray PK. Patient flow modelling and performance analysis of healthcare delivery processes in hospitals: A review and reflections. Comput Ind Eng. 2014;78:299–312.
- 48.Kovalchuk SV, Funkner AA, Metsker OG, Yakovlev AN. Simulation of patient flow in multiple healthcare units using process and data mining techniques for model identification. J Biomed Inform. 2018;82:128–42. [DOI] [PubMed] [Google Scholar]
- 49.Andrews R, Suriadi S, Wynn M, ter Hofstede AH, Rothwell S. Improving patient flows at St. Andrew’s War Memorial Hospital’s emergency department through process mining. Bus Process Manag Cases Digit Innov Bus Transform Pract. 2018;311–33.
- 50.Kim E, Kim S, Song M, Kim S, Yoo D, Hwang H, et al. Discovery of outpatient care process of a tertiary university hospital using process mining. Healthc Inform Res. 2013;19(1):42. [DOI] [PMC free article] [PubMed] [Google Scholar]
- 51.Devapriya P, Strömblad CT, Bailey MD, Frazier S, Bulger J, Kemberling ST, et al. StratBAM: a discrete-event simulation model to support strategic hospital bed capacity decisions. J Med Syst. 2015;39:1–13. [DOI] [PubMed] [Google Scholar]
- 52.Luo L, Liu H, Liao H, Tang S, Shi Y, Guo H. Discrete event simulation models for CT examination queuing in West China Hospital. Comput Math Methods Med. 2016;2016:2731675–85. [DOI] [PMC free article] [PubMed] [Google Scholar]
- 53.Gul M, Guneri AF. A comprehensive review of emergency department simulation applications for normal and disaster conditions. Comput Ind Eng. 2015;83:327–44. [Google Scholar]
- 54.Sun Z, Wang S, Zhao H, Yu H. Does Descending Resources Reform Improve Patient Satisfaction and Reshape Choice of Care Providers? A Cross-Sectional Study in Zhejiang, China. Inquiry J Med Care Organ Provision Financing. 2020;57:46958020956899. 10.1177/0046958020956899. [DOI] [PMC free article] [PubMed] [Google Scholar]
- 55.Affa SM, Xinglong X. Evaluating resource allocation management to hospitals in bauchi state: a case study of federal medical centre azare and primary healthcare centre azare. EPRA Int J Multidiscip Res. 2024. 10.36713/epra17907.
- 56.Coman G, Mocanu Ş, Dobrescu R. A Predictive Framework for Efficient Resources Allocation in Healthcare Organisations. In: 2023 24th International Conference on Control Systems and Computer Science (CSCS). Bucharest, Romania: IEEE; 2023. pp. 249–52.
- 57.Goel R, Karn T, Kushwaha R, Mehta A. Healthcare Resource Allocation Optimization. Int J Adv Res Sci Commun Technol. 2024. 10.48175/ijarsct-17569.
- 58.Masroor F, Gopalakrishnan A, Goveas N. Machine Learning-Driven Patient Scheduling in Healthcare: A Fairness-Centric Approach for Optimized Resource Allocation. In: 2024 IEEE Wireless Communications and Networking Conference (WCNC). Dubai, United Arab Emirates: IEEE; 2024. pp. 01–06.
- 59.Marley KA, Collier DA, Meyer Goldstein S. The role of clinical and process quality in achieving patient satisfaction in hospitals. Decis Sci. 2004;35(3):349–69. [Google Scholar]
- 60.Bhati D, Deogade MS, Kanyal D. Improving patient outcomes through effective hospital administration: a comprehensive review. Cureus. 2023;15(10):1–12. [DOI] [PMC free article] [PubMed]
- 61.Alelaiwi A. Resource allocation management in patient-to-physician communications based on deep reinforcement learning in smart healthcare services. In: 2020 IEEE international conference on multimedia & expo workshops (ICMEW). Los Alamitos, CA: IEEE; 2020. pp. 1–5.
- 62.Batbaatar E, Dorjdagva J, Luvsannyam A, Savino MM, Amenta P. Determinants of patient satisfaction: a systematic review. Perspect Public Health. 2017;137(2):89–101. [DOI] [PubMed] [Google Scholar]
- 63.Andaleeb SS. Service quality perceptions and patient satisfaction: a study of hospitals in a developing country. Soc Sci Med. 2001;52(9):1359–70. [DOI] [PubMed] [Google Scholar]
- 64.Cleary PD, Edgman-Levitan S. Health care quality: incorporating consumer perspectives. Jama. 1997;278(19):1608–12. [PubMed] [Google Scholar]
- 65.Stewart M. Reflections on the doctor-patient relationship: from evidence and experience. Br J Gen Pract. 2005;55(519):793–801. [PMC free article] [PubMed] [Google Scholar]
- 66.Long C, Tsay EL, Jacobo SA, Popat R, Singh K, Chang RT. Factors associated with patient Press Ganey satisfaction scores for ophthalmology patients. Ophthalmology. 2016;123(2):242–7. [DOI] [PubMed] [Google Scholar]
- 67.Farley H, Enguidanos ER, Coletti CM, Honigman L, Mazzeo A, Pinson TB, et al. Patient satisfaction surveys and quality of care: an information paper. Ann Emerg Med. 2014;64(4):351–7. [DOI] [PubMed] [Google Scholar]
- 68.Epstein RM, Street RL. The values and value of patient-centered care. Ann Fam Med. 2011;9(2):100–103. [DOI] [PMC free article] [PubMed]
- 69.Parasuraman A, Zeithaml VA, Berry LL. Servqual: A multiple-item scale for measuring consumer perc. J Retail. 1988;64(1):12. [Google Scholar]
- 70.Menard S. Applied logistic regression analysis. Sage; 2002.
- 71.Kraiphibul P. Eye disease. Thailand: Amarin Corp. PLC; 2013.
- 72.Given B, Given CW, Sikorskii A, Jeon S, McCorkle R, Champion V, et al. Establishing mild, moderate, and severe scores for cancer-related symptoms: how consistent and clinically meaningful are interference-based severity cut-points? J Pain Symptom Manag. 2008;35(2):126–35. [DOI] [PMC free article] [PubMed]
- 73.Selby D, Cascella A, Gardiner K, Do R, Moravan V, Myers J, et al. A single set of numerical cutpoints to define moderate and severe symptoms for the Edmonton Symptom Assessment System. J Pain Symptom Manag. 2010;39(2):241–9. [DOI] [PubMed] [Google Scholar]
- 74.Colice GL, Burgt JV, Song J, Stampone P, Thompson PJ. Categorizing asthma severity. Am J Respir Crit Care Med. 1999;160(6):1962–7. [DOI] [PubMed] [Google Scholar]
- 75.Gupta P. Eye Infections: A Review. Ophthalmol Vis Care. 2021;1(2):1–5.
- 76.Ott R, Longnecker M. An introduction to statistical methods and data analysis. Cengage Learning Inc.; 2010.
- 77.VanVoorhis CW, Morgan BL, et al. Understanding power and rules of thumb for determining sample sizes. Tutorials Quant Methods Psychol. 2007;3(2):43–50.
- 78.Yahia Z, Pradhan A. Multi-objective optimization of household appliance scheduling problem considering consumer preference and peak load reduction. Sustain Cities Soc. 2020;55:102058.
- 79.Torabi SA, Hassini E. An interactive possibilistic programming approach for multiple objective supply chain master planning. Fuzzy Sets Syst. 2008;159(2):193–214.
- 80.Kim S, Wang PR, Lopez R, Valentim CC, Muste J, Russell M, et al. Characterization of ophthalmic presentations to emergency departments in the United States: 2010–2018. Am J Emerg Med. 2022;54:279–86. [DOI] [PubMed] [Google Scholar]
- 81.Leat SJ, Gurwood AS, Kergoat H, Pesudovs K, Eperjesi F. Geriatric Vision Care: a New Look at the Old. J Optom. 2009;2(3):101–2. 10.3921/JOPTOM.2009.101. [Google Scholar]
- 82.Statista. Forecast of Aging Population in Thailand 2017-2050. 2025. https://www.statista.com/statistics/713667/thailand-forecast-aging-population/. Accessed 17 Jan 2025.
- 83.Newman-Casey PA, De Lott L, Cho J, Ballouz D, Azzouz L, Saleh S, et al. Telehealth-based eye care during the COVID-19 pandemic: utilization, safety, and the patient experience. Am J Ophthalmol. 2021;230:234–42. [DOI] [PMC free article] [PubMed] [Google Scholar]
- 84.Bonilla-Escobar F, Sánchez-Cano D, Lasave A, Soria J, Franco-Cárdenas V, Reviglio V, et al. Early-Phase Perceptions of COVID-19’s Impact on Ophthalmology Practice Patterns: A Survey from the Pan-American Association of Ophthalmology. Clin Ophthalmol. 2023;17:3249–59. 10.2147/opth.s434776. [DOI] [PMC free article] [PubMed] [Google Scholar]
- 85.Sharma M, Creutzfeldt CJ, Lewis A, Patel PV, Hartog C, Jannotta GE, et al. Health-care professionals’ perceptions of critical care resource availability and factors associated with mental well-being during coronavirus disease 2019 (COVID-19): results from a US survey. Clin Infect Dis. 2021;72(10):e566–76. [DOI] [PMC free article] [PubMed] [Google Scholar]
- 86.Ferrer RL, Hambidge SJ, Maly RC. The essential role of generalists in health care systems. Ann Intern Med. 2005;142(8):691–9. [DOI] [PubMed] [Google Scholar]
- 87.Thorsen O, Hartveit M, Baerheim A. General practitioners’ reflections on referring: An asymmetric or non-dialogical process? Scand J Prim Health Care. 2012;30(4):241–6. [DOI] [PMC free article] [PubMed] [Google Scholar]
- 88.Thorsen O, Hartveit M, Baerheim A. The consultants’ role in the referring process with general practitioners: partners or adjudicators? a qualitative study. BMC Fam Pract. 2013;14:1–5. [DOI] [PMC free article] [PubMed] [Google Scholar]
- 89.Hospital TU. About Thammasat University Hospital. 2025. https://www.tham-c.com/en/about/. Accessed 17 Jan 2025.
- 90.Ravaghi H, Alidoost S, Mannion R, Bélorgeot VD. Models and methods for determining the optimal number of beds in hospitals and regions: a systematic scoping review. BMC Health Serv Res. 2020;20:1–13. [DOI] [PMC free article] [PubMed] [Google Scholar]
- 91.Elmer D, Endrei D, Németh N, Horváth L, Pónusz R, Kívés Z, et al. Changes in the number of physicians and hospital bed capacity in Europe. Value Health Reg Issues. 2022;32:102–8. [DOI] [PubMed] [Google Scholar]
- 92.Thammasat University Hospital. Annual Budget Reports. 2024. https://www.hospital.tu.ac.th/page/reportyears/. Accessed 01 July 2025.
- 93.Fan X, Tang J, Yan C, Guo H, Cao Z. Outpatient appointment scheduling problem considering patient selection behavior: data modeling and simulation optimization. J Comb Optim. 2021;42:677–99. [Google Scholar]
- 94.Tanantong T, Pannakkong W, Chemkomnerd N. Resource management framework using simulation modeling and multi-objective optimization: a case study of a front-end department of a public hospital in Thailand. BMC Med Inform Decis Making. 2022;22(1):1–21. [DOI] [PMC free article] [PubMed] [Google Scholar]
Associated Data
This section collects any data citations, data availability statements, or supplementary materials included in this article.
Data Availability Statement
The data supporting the findings of this study are sourced from Thammasat University Hospital and are subject to access restrictions. These data were used under license for this study and are not publicly available. Data are however available from the authors upon reasonable request and with permission of Thammasat University Hospital.