Abstract
The crystal structure of a conserved hypothetical protein, Aq1575, from Aquifex aeolicus has been determined by using x-ray crystallography. The protein belongs to the domain of unknown function DUF28 in the Pfam and PALI databases for which there was no structural information available until now. A structural homology search with the DALI algorithm indicates that this protein has a new fold with no obvious similarity to those of other proteins of known three-dimensional structure. The protein reveals a monomer consisting of three domains arranged along a pseudo threefold symmetry axis. There is a large cleft with approximate dimensions of 10 Å × 10 Å × 20 Å in the center of the three domains along the symmetry axis. Two possible active sites are suggested based on the structure and multiple sequence alignment. There are several highly conserved residues in these putative active sites. The structure based molecular properties and thermostability of the protein are discussed.
Keywords: structural genomics|new fold|DUF28|hyperthermophile| thermostability
A large amount of genomic sequence information has been provided by completed and ongoing large-scale genome sequencing projects (http://www.tigr.org/tdb/mdb/mdb.html; http://www.mcs.anl.gov/home/gaasterl/genomes.html). In many cases, the function of the encoded gene products can be deduced from comparative sequence analysis (1). However, for a large fraction of the predicted gene products, no functions can be inferred because of the absence of reliable sequence similarity to proteins with known function (2). Other methods, using information such as phylogenetic profiles, domain fusions, and gene localization, can sometimes provide information about cellular function (3) with less reliability.
Because the three-dimensional structure of a protein is tightly coupled to its molecular (biochemical and biophysical) function, the structure of a protein with an unknown (based on sequence information alone) function may infer its molecular function. A number of recent publications have demonstrated the validity of this approach (4–6), although in some cases it is more difficult to infer molecular function when the structure has a previously uncharacterized fold (7–9).
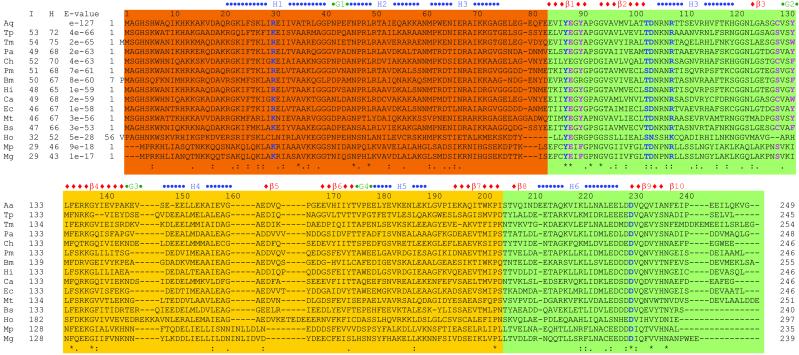
An ORF of Aquifex aeolicus codes for a hypothetical protein, Aq1575, with a molecular mass of 27.9 kDa (10). A PSI-blast search with this sequence revealed 79 sequences with full-length homology, sequence identity ranging from 28% to 53% and an E value below 2E-12 (Fig. 1). Most of the homologous sequences are annotated as hypothetical proteins. In Escherichia coli, the closest hypothetical protein to Aq1575 is yebC (11). In the Pfam (12) and PALI (13) databases, this domain of unknown function is named DUF28, and is equivalent to COG0217 in the National Center for Biotechnology Information database of Clusters of Orthologous Groups (14). This domain is found in bacterial and yeast proteins. It compromises the entire length or central region of most of the proteins in the family, all of which are hypothetical with no known function. The average length of this domain is approximately 230 aa. Residues 131 to 246 have low sequence homology with the V-type ATPase 116-kDa subunit family in the Pfam database. We have determined the three-dimensional structure of Aq1575 by x-ray crystallography and discuss structural characteristics of this family.
Figure 1.
Sequence comparison between Aq1575 and its homologs. Aq, A. aeolicus; Tp, Treponema pallidum; Tm, Thermotoga maritima; Pa, Pseudomonas aeruginosa; Ch, Clostridium histolyticum; Pm, Pasteurella multocida; Bm, Brucella melitensis; Hi, Haemophilus influenzae; Ca, Clostridium acetobutylicum; Ec, E. coli; Mt, Mycobacterium tuberculosis; Bs, Bacillus subtilis; Ho, Homo sapiens; Mp, Mycoplasma pneumoniae; Mg, Mycoplasma genitalium. “I” represents % identity, “H” represents % homology, and E values are from the result of PSI-blast. The domains are represented as follows: scarlet for domain 1; green for domain 2; and yellow for domain 3. Blue characters represent the residues at putative active site 1 (PAS1), and pink residues at PAS2 (see text). The “−”s represent gaps; “*” for conserved residues; “:” for homologous residues having hydrophobic side chain; and “.” for homologue residues having polar side chains.
Materials and Methods
Cloning of Aq1575.
Primers (Invitrogen) for PCR amplification from genomic DNA contained an NdeI restriction site in the forward primer (5′-CATATGTTAAGGATAGCGGTTGATGC-3′) and a BamHI site in the reverse primer (5′-AGATCTTTAGCCAACCTTCTGAAGTATTTCTTCG-3′). PCR was performed by using Deep Vent DNA Polymerase (New England Biolabs) and A. aeolicus genomic DNA. The PCR product was cloned into the pCR-BluntII-TOPO vector (Invitrogen) and the Aq1575 (gi_2983942) gene insert was confirmed by DNA sequencing. The amplified TOPO vector was restricted with NdeI and BamHI, and the gene insert was purified by agarose gel electrophoresis extraction. This insert was ligated into pET21a (Novagen) and transformed into DH5α. Plasmid DNA was purified, confirmed to contain the gene insert, and then transformed into BL21(DE3)pSJS1244 (15).
Protein Expression, Purification, and Crystallization.
A selenomethionine derivative of the protein was expressed in a methionine auxotroph, E. coli strain B834(DE3)/pSJS1244 (15, 16), and grown in M9 medium supplied with selenomethionine. In the purification process, the cell lysate was subjected to heating (80°C for 30 min). After heating, anion exchange chromatography on a HiTrap-Q column (Amersham Pharmacia) was performed twice. The protein was eluted in 50 mM Tris⋅HCl, pH 6.8/220 mM NaCl. The SDS/PAGE showed one band around 28 kDa corresponding to the molecular mass of Aq1575 and dynamic light scattering confirmed this by showing a monodisperse peak of the monomer size. The initial crystallization conditions were screened by the sparse matrix method by using the Hampton Research kits (Laguna Niguel, CA ) (17) and by in-house developed screening methods (unpublished data) at 22°C (±0.5°C). In the optimized crystallization conditions, 1 μl of the protein (30 mg/ml) in 50 mM Tris⋅HCl, pH 6.8/220 mM NaCl, was mixed with 1 μl of 20% PEG3350/0.2 M ammonium nitrate/10 mM nicotinamide adenine dinucleotide (NAD)/3% PEG400. The hanging drop was equilibrated with 0.5 ml of 20% PEG3350/0.2 M ammonium nitrate. Thick plate-shaped crystals grew in 1 month to approximate dimensions of 0.1 mm × 0.1 mm × 0.05 mm.
Data Collection and Reduction.
The crystals were soaked in a drop of cryo-protectant solution of 30% PEG3350/0.2 M ammonium nitrate/10% propylene glycol (about 10 μl) for about 1 min before being flash-frozen in liquid nitrogen and exposed to X-rays. X-ray diffraction data were collected to 1.7 Å at one wavelength corresponding to the selenium peak at the Macromolecular Crystallography Facility beamline 5.0.2 of the Advanced Light Source at Lawrence Berkeley National Laboratory by using an Area Detector Systems Co. (Poway, CA) Quantum 4 charge coupled device detector placed 150 mm from the sample. The oscillation range per image was 1.0° with no overlap between two contiguous images. X-ray diffraction data were processed and scaled by using denzo and scalepack from the HKL program suite (18). Data statistics are summarized in Table 1. The crystal belongs to the primitive orthorhombic space group P212121, with unit-cell parameters of a = 43.79 Å, b = 65.35 Å, and c = 73.78 Å.
Table 1.
Statistics of X-ray diffraction data and structure refinement
| Data set | Peak |
|---|---|
| Statistics of the peak wavelength SAD data set | |
| Wavelength (Å) | 0.97864 |
| Resolution (Å) | 36.2–1.71 |
| Redundancy | 7.5 (5.0)* |
| Unique reflections | 42,899 (1,081) |
| Completeness (%) | 96.0 (48.2) |
| I/σ | 10.2 (3.8) |
| Rsym† (%) | 5.1 (20.7) |
| Crystal parameters and refinement statistics | |
| Space group | P212121 |
| Cell dimensions | a = 43.79 Å; b = 65.35 Å; c = 73.78 Å |
| Volume fraction of protein | 35.1% |
| Vm (Å3/Dalton) | 1.89 |
| Total number of residues | 243 |
| Total non-H atoms | 1,926 |
| Number of water molecules | 349 |
| Average temperature factors | |
| Protein | 35.2 Å2 |
| Solvent | 37.1 Å2 |
| Resolution range of reflections used | 20.0–1.71 Å |
| Amplitude cutoff | 2.0 σ |
| R-factor | 22.8% |
| Free R-factor | 29.4% |
| Stereochemical ideality | |
| Bond | 0.011 Å |
| Angle | 1.56° |
| Improper | 0.98° |
| Dihedral | 22.99° |
Numbers in parenthesis refer to the highest resolution shell, which is 1.73–1.71 Å for all wavelength data.
Rsym = ∑hkl∑i|Ihkl,i − 〈I〉hkl|/∑|〈I〉hkl|.
Structure Determination and Refinement.
The program solve (19) was used to locate the selenium sites in the crystal and to calculate initial phases. The initial single-wavelength anomalous dispersion phases were further improved by a solvent flattening protocol integrated in SHARP/autoSHARP (20). The map calculated by using the improved phases was good enough to trace most of the main chains and side chains of the protein. Model building was performed by using the program o (21). A model containing 243 residues was derived from progressive improvement of the electron density map using rounds of phase combination and manual building.
The program cns was used for all refinement calculations (22). The reflections in the peak data set between 20.0 Å and 1.7 Å were included throughout the refinement calculations. Ten percent of the data were randomly chosen for free R-factor cross validation. The refinement statistics are shown in Table 1. Isotropic B-factors for individual atoms were initially fixed to 20 Å2 and were refined in the last stages. The 2Fo − Fc and Fo − Fc maps were used for the manual rebuilding between refinement cycles and for the location of solvent molecules. When the refined B factor of a solvent molecule exceeded 70 Å2, it was removed. Atomic coordinates have been deposited in the Protein Data Bank (PDB ID code 1LFP).
Results
Quality of the Model.
The majority (243 of 249) residues are defined by the electron density for the refined models of Aq1575. The final model has been refined at 1.71-Å resolution to a crystallographic R-factor of 22.8%. The root-mean-square (rms) deviations from ideal stereochemistry are 0.011 Å for bond lengths, 1.56° for bond angles, and 0.98° for improper angles. The averaged Bfactors for main chain atoms and side chain atoms are 32.1 Å2 and 38.2 Å2, respectively. The N-terminal four residues and C-terminal two residues of the protein model are undefined in the electron density map. The residues showing higher B factors are located around these regions: the N-terminal loop (residues 5–17; 83.4 Å2) and the C-terminal loop (residues 243–247; 81.2 Å2). The significant portion of residues that fall into poorly outlined, unstructured N-terminal regions may be an explanation for the high free R-factor, which converged at around 29%. Table 1 summarizes the refinement statistics as well as model quality parameters. The mean positional error in atomic coordinates for the refined model is estimated to be within 0.22 Å by the Luzzati plot (23). All residues lie in the allowed region of the Ramachandran plot produced with procheck (24).
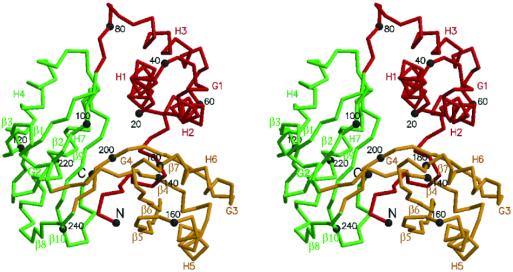
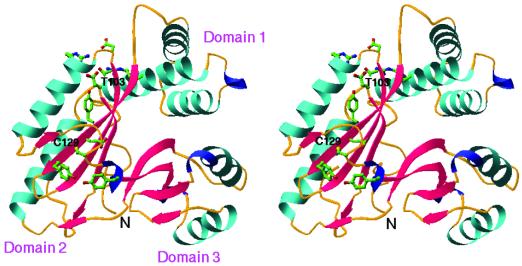
The Cα trace of the atomic model of Aq1575 is shown in Fig. 2. The monomer has approximate dimensions of 50 Å × 45 Å × 35 Å with a triangular bowl shape. The first domain is composed of three helices forming a helical bundle (Fig. 3). The second and third domains belong to the mixed α–β structure composed of the 2-layer (αβ)-sandwich in the CATH classification (25). The central β-sheets are made of four β-strands and are adjacent to two parallel helices (Fig. 3).
Figure 2.
A stereo drawing of a Cα trace of Aq1575. Domain 1 (scarlet), domain 2 (green), and domain 3 (yellow) of Aq1575 are represented by a thick line. Every twentieth residue is numbered and represented by a dot. The N (residue Ser-5) and C termini (residue Lys-247) and the secondary elements are labeled. The figure was generated by molscript (38).
Figure 3.
A ribbon diagram of Aq1575. The figure was generated by using the program ribbons (39). α-helices are colored in cyan, β-strands are colored red, and 310-helix are colored blue. The highly conserved residues around putative active site are represented by a ball-and-stick model (blue for nitrogen atoms, red for oxygen, yellow for sulfur, and green for carbon). Each domain, N termini, Thr-103 (located at the center of the first putative active site, PAS1) and Cys-129 (the second putative active site, PAS2) are labeled.
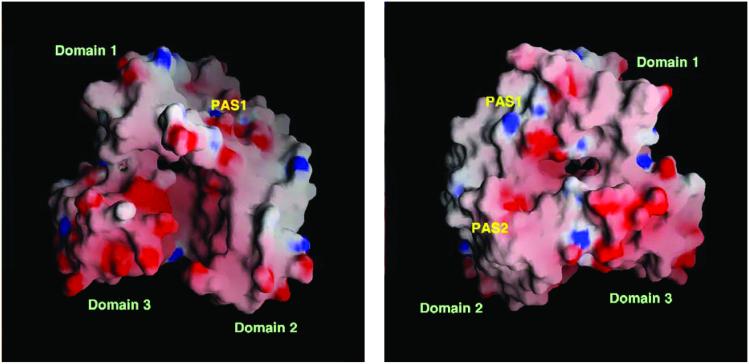
The crystal structure shows a pseudo threefold symmetry shape forming a cleft in the middle of the three domains with approximate dimensions of 10 Å × 10 Å × 20 Å (Fig. 4). The top of the cleft is covered by the flexible N-terminal loop. Each domain is stabilized by hydrophobic interactions. Almost the same averaged B-factors of each domain (≈30 Å2) support the similar rigidity of the domains. The interactions between domains are hydrophilic and relatively loose.
Figure 4.
The electrostatic surface potential of Aq1575. (Left) A molecular surface is created by the program GRASP (red, negative; blue, positive; white, uncharged) (40). The residues, 5–17 and 243–247, covering a cleft were deleted to show a clear view of the inside of the protein in both Left and Right. The putative active site (PAS1) is indicated. (Right) The figure was drawn after 180° rotation of Left versus y axis. The putative active sites (PAS1 and PAS2) are indicated.
Discussion
Folding Topology.
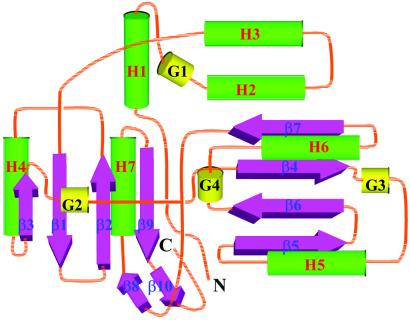
The Aq1575 protein has a previously uncharacterized overall fold not found in the PDB. The central β-sheet of domain 2 has a topology of −2, +1, +2 (26) or topology 3↑1↓2↑4↓ (27) and domain 3 has a topology of +1, +2, +3 or topology 2↓3↑1↓4↑ (Fig. 5). The structural classification databases CATH (25) and DALI/FSSP (28) were used for comparative analysis of the Aq1575 structure. The fold of Aq1575 resembles many others with the 2-layer (αβ)-sandwich form, a fold in a α+β class. We searched for its structural homologs in the PDB with the program dali. No significant match was obtained during whole domain and pairwise domain (domain 1 + 2, 2 + 3, 3 + 1) searches and most of these results were from matches with individual domains, so dali was run again with each domain.
Figure 5.
A topology diagram of Aq1575. α-helices are represented by green cylinders, β-strands by pink thick arrows, and 310-helices by gold cylinders. Secondary structure elements of helices and strands are labeled.
As expected from the simple helical bundle structure of domain 1, the dali search revealed 269 candidates that show a z score above 2.0 (82 for z above 3.0, 10 for z above 4.0, 1 for z above 6.0). Good structural similarity was observed from 11 homologs despite weak sequence similarity (<13% identity). The rms deviations are from 2.0 (for 41 pairs of aligned Cα atoms for IFN-induced guanylate-binding protein 1 fragment; 1dg3-A; z = 4.7) to 7.5 (for 49 Cα atoms for 50S ribosomal protein L19; 1ffk-M; z = 4.1). In the CATH classification of protein structures, the above 11 structures found in the dali search are classified as an α solenoid architecture (25).
The dali search with the mixed α and β structure of domain 2 revealed 63 candidates that show a z score above 2.0 (16 for z above 3.0, 4 for z above 4.0, 1 for z above 5.0). Good structural similarity was observed from 5 homologs despite weak sequence similarity (<18% identity). The rms deviations are 2.2 (for 60 pairs of aligned Cα atoms for ribosomal protein s6; 1ris; z = 5.5), 2.1 (for 56 Cα atoms for d-3-phosphoglycerate dehydrogenase; 1psd-A; z = 4.3), 3.3 (for 61 Cα atoms for proteinase A inhibitor 1; 1itp-A; z = 4.2), 3.6 (for 64 Cα atoms for transcriptional regulator; 1rpa; z = 4.2), and 3.3 (for 66 Cα atoms for carboxypeptidase g2 biological unit; 1cg2-A; z = 4.1). In the CATH classification of protein structures, the above 5 structures found in the dali search can be considered as having the 2-layer (αβ) sandwich architecture similar to that of domain 2. However, the topology of the central β-sheet of the five homologs is 2↓3↑1↓4↑ unlike the topology 3↑1↓2↑4↓ found in domain 2 (Fig. 5). Actually, topology 3↑1↓2↑4↓ is not found in other known structures and is predicted to be more complex to form compared with other β-sheet motifs (27). Therefore, domain 2 is the first example of this kind of topology, though it is not formed from a continuous single chain.
Domain 3 is also a simple mixed α and β structure. The dali search revealed 162 candidates that show a z score above 2.0 (39 for z above 3.0, 28 for z above 4.0, 15 for z above 5.0, and 4 for z above 6.0). Good structural similarity was observed from 4 homologs despite weak sequence similarity (<14% identity). The rms deviations are 3.3 (for 61 pairs of aligned Cα atoms for metallochaperone atx1; 1cc8-A; z = 6.6), 3.4 (for 73 Cα atoms for procarboxypeptidase a2; 1aye; z = 6.2), 3.2 (for 72 Cα atoms for 3-hydroxy-3-methylglutaryl-CoA reductase biological fragment; 1qax-A; z = 6.0), and 3.4 (for 70 Cα atoms for elongation factor 1-β; 1b64; z = 6.0). In the CATH classification of protein structures, the above 4 structures found in the dali search can be considered as having the 2-layer (αβ)-sandwich architecture. All of the above structures have the same topology as domain 3, the central β-sheet (topology 2↓3↑1↓4↑) and two helices with a βαββαβ order (Fig. 5). Actually, the topology 2↓3↑1↓4↑ is one of the most populated four-stranded β-sheet motifs in protein structures (27).
In summary, a structural homology search indicates that this protein consists of two known folds (domain 1 and domain 3) and one new fold (domain 2), all of which form a unique structure with no obvious similarity to other proteins with known three-dimensional structures.
Database Search for Possible Molecular Functions.
The Aq1575 structure does not reveal a clear deep cleft or a pocket, a common feature of an active site, except the central hole formed by the three domains (Fig. 4A). To identify the possible active site in Aq1575, two structural databases containing known structures and functions were queried for a similar residue constellation in Aq1575. None of the active site templates in the PROCAT database (29) of functional groups in enzyme active sites matches any constellation of residues in the Aq1575 structure. However, a database search for the presence of a known protein motif by rigor (30) gave 38 motifs that are found in the Aq1575 structure. Nine of them match the clusters of hydrophobic residues of known protein structures. Other motifs are related to the binding of substrates or metal ions, such as chloride ion, sulfate ion, acetate ion, calcium ion, magnesium ion, ethylene glycol, 1-amino-1-carbonyl pentane, 6-deoxyerythronolide B, NAD, and various carbohydrate moieties. However, we found no indication of bound substrates or metal ions in the electron density maps. The residues predicted to be involved in binding are not highly conserved in the Aq1575 family (Fig. 1). As 10 mM NAD improved the crystal quality and size during crystallization, we expected to observe the binding of NAD to Aq1575. RIGOR search also gave one possible NAD binding site (Gly-22, Ser-26, Ile-32; 1eny). But, we failed to find any density for NAD in the electron density map.
No obvious active site could be located by inspection of the structure. Based on the sequence alignment and structural surveying, two sites look like possible candidates (Figs. 1 and 3). One is around Thr-103, where highly conserved residues Arg-30, Tyr-87, Asp-104, Arg-108, and Asp-230 are located. The second location is around Cys-129, where highly conserved residues Glu-88, Tyr-90, and Tyr-132 are located and neighboring backbone amides surround the sulfur atom of Cys-129. However, neither of these possible active sites gives any clue to a possible function of Aq1575.
The electrostatic surface potential of Aq1575 shows an evenly charged distribution except for domain 3 and the nearby region (Fig. 4). A total of 17 (1 aspartate and 16 glutamate) of 71 residues are negatively charged in domain 3 of the sequence homologs. The sequence alignment also shows highly negatively charged residues located in domain 3 (Fig. 1). Therefore, this domain may have a special role for the function of Aq1575.
Thermostability of Aq1575.
A. aeolicus is one of the most thermophilic bacteria known. Although this organism is able to grow at a remarkable 96°C, only a few specific indications of heat-resistance are evident from the genome (10). Most hyperthermophiles that have been isolated so far belong to the kingdom of archaea, whereas only two families, Thermotoga and Aquifex, belong to the kingdom of bacteria (31). Considerable effort has been made during recent years to understand the structural features that determine the extraordinary thermal stability of proteins from hyperthermophiles.
Because no mesophilic homologue of the Aq1575 structure is available, it is not possible to draw any firm conclusions about the origins of its thermostability through structural comparisons. However, some characteristics provide clues to explain its thermostability.
Salt bridges are one of the major factors for thermostability (32). Hyperthermophilic enzymes in general possess a much higher number of ion pairs per residue. This number is 0.040 in normal enzymes, but is 0.085 in the hyperthermophilic tungstoprotein enzyme, aldehyde ferredoxin oxidoreductase from Pyrococcus furious (32). The Aq1575 structure reveals 11 salt bridges, and 0.044 ion pairs per residue, just above the average value. However, there are three ion pair networks that are usually observed in hyperthermophilic enzymes (33). The first network (Glu-31, Arg-48, and Glu-84) is located in a borderline between domain 1 and domain 2, the second (Glu-54, Lys-184, and Glu-188) is located between domain 1 and domain 3, and the third (Asp-104, Arg-108, Glu-112, and Asp-230) is located in domain 2 to stabilize the divided chains. Therefore, the three ion pair networks contribute to the stabilization of the whole tertiary structure. All of these ion pair networks and 2 salt bridges (Glu-135–Lys-137 and Arg-136–Glu-178) form tertiary salt bridges known to increase thermostability by stabilizing the helix dipole (34). Therefore, although their ratio per residue of salt bridges is not high, they still play an important role in stabilizing the whole tertiary structure through formation of ion pair networks or tertiary salt bridges.
Shorter loops and proline residues occurring with high frequency in the loop regions were assumed to be responsible for enhanced thermostability (35). The content of proline residues in thermolabile Bacillus cereus oligo-1,6-glucosidase and thermostable oligo-1,6-glucosidase from Bacillus thermoglucosidasius KP1006 are 19 of 558 (3.4%) and 33 of 562 (5.9%), respectively (35). In Aq1575, it is 11 of 249 (4.4%), but in E. coli, it is 5 of 246 (2.0%). Except Pro-47 (in H2) and Pro-177 (in G4), nine prolines are located within or close to loop regions (Fig. 1). In case of E. coli, only Pro-92 is located in a loop. Hence, a high number of proline residues located in loops or close to loops could be a key factor for thermostability of Aq1575.
Deamidation was found to be one of the processes leading to heat inactivation (36). The formation of the major product of deamidation, isoaspartate, occurs frequently at Asn–Gly, Asn–Ser, or Asp–Gly sequences when they lie in regions of a polypeptide that are highly flexible (37). Aq1575 does not have any of these sequences, in contrast to the homologous E. coli protein, which has three sequences located around flexible regions according to the structure of Aq1575 (Fig. 1).
Another factor is a reduced surface area and optimized packing of the atoms in the core of the structure. A simple indicator for evaluating the efficiency of packing is given by the fraction of atoms in a protein with zero accessible surface area. For the hyperthermophilic aldehyde ferredoxin oxidoreductase, the fraction (≈0.55) is significantly higher than the average (≈0.5) (32). For Aq1575, this fraction is 0.47, below the average. This finding is expected from a triangular bowl shape (Fig. 3). Therefore, this factor does not contribute to the thermostability of Aq1575. However, each domain forms a very tight hydrophobic core in the interface of secondary structural elements. The similar averaged B-factors near 30.0 Å2 of each domain support the rigidity.
In summary, the high-resolution structure of Aq1575 provides a first view of a member of the DUF28 family of hypothetical proteins. Even though a molecular function for the protein is not immediately evident, the structure provides a framework to deduce and assay molecular function based on clustered conserved residues or general fold characters. We also provide some of the structural properties that help explain the thermostability of Aq1575.
Acknowledgments
We thank Dr. David King for mass spectrometric analysis of the protein and Dr. Thomas Earnest and Dr. Gerry McDermott (Advanced Light Source, Lawrence Berkeley National Laboratory) for assistance during data collection. The work described here was supported by National Institutes of Health Grant GM 62412.
Abbreviation
- NAD
nicotinamide adenine dinucleotide
Footnotes
Data deposition: The atomic coordinates have been deposited in the Protein Data Bank, www.rcsb.org (PDB ID code 1LFP).
References
- 1.Altschul S F, Madden T L, Schaffer A A, Zhang J, Zhang Z, Miller W, Lipman D J. Nucleic Acids Res. 1997;25:3389–3402. doi: 10.1093/nar/25.17.3389. [DOI] [PMC free article] [PubMed] [Google Scholar]
- 2.Murzin A G, Patty L. Curr Opin Struct Biol. 1999;9:359–361. [Google Scholar]
- 3.Marcotte E M, Pellegrini M, Thompson M J, Yeates T O, Eisenberg D. Nature (London) 1999;402:83–86. doi: 10.1038/47048. [DOI] [PubMed] [Google Scholar]
- 4.Zarembinski T I, Hung L-W, Mueller-Dieckmann H -J, Kim K-K, Yokota H, Kim R, Kim S-H. Proc Natl Acad Sci USA. 1998;95:15189–15193. doi: 10.1073/pnas.95.26.15189. [DOI] [PMC free article] [PubMed] [Google Scholar]
- 5.Hwang K Y, Chung J H, Kim S-H, Han Y S, Cho Y. Nat Struct Biol. 1999;6:691–696. doi: 10.1038/10745. [DOI] [PubMed] [Google Scholar]
- 6.Teplova M, Tereshko V, Sanishvili R, Joachimiak A, Bushueva T, Anderson W F, Egli M. Protein Sci. 2000;9:2557–2566. doi: 10.1110/ps.9.12.2557. [DOI] [PMC free article] [PubMed] [Google Scholar]
- 7.Yang F, Gustafson K R, Boyd M R, Wlodawer A. Nat Struct Biol. 1998;5:763–764. doi: 10.1038/1796. [DOI] [PubMed] [Google Scholar]
- 8.Colovos C, Cascio D, Yeates T O. Structure Fold Des. 1998;6:1329–1337. doi: 10.1016/s0969-2126(98)00132-4. [DOI] [PubMed] [Google Scholar]
- 9.Shin D H, Yokota H, Kim R, Kim S-H. J Struct Funct Genomics. 2002;2:53–66. doi: 10.1023/a:1014450817696. [DOI] [PubMed] [Google Scholar]
- 10.Deckert G, Warren P V, Gaasterland T, Young W G, Lenox A L, Graham D E, Overbeek R, Snead M A, Keller M, Aujay M, et al. Nature (London) 1998;392:353–358. doi: 10.1038/32831. [DOI] [PubMed] [Google Scholar]
- 11.Blattner F R, Plunkett G, III, Bloch C A, Perna N T, Burland V, Riley M, Collado-Vides J, Glasner J D, Rode C K, Mayhew G F, et al. Science. 1997;277:1453–1474. doi: 10.1126/science.277.5331.1453. [DOI] [PubMed] [Google Scholar]
- 12.Bateman A, Birney E, Durbin R, Eddy S R, Howe K L, Sonnhammer E L L. Nucleic Acids Res. 2000;30:276–280. doi: 10.1093/nar/28.1.263. [DOI] [PMC free article] [PubMed] [Google Scholar]
- 13.Balaji S, Sujatha S, Kumar S S C, Srinivasan N. Nucleic Acids Res. 2001;29:61–65. doi: 10.1093/nar/29.1.61. [DOI] [PMC free article] [PubMed] [Google Scholar]
- 14.Tatusov R L, Natale D A, Garkavtsev I V, Tatusova T A, Shankavaram U T, Rao B S, Kiryutin B, Galperin M Y, Fedorova N D, Koonin E V. Nucleic Acids Res. 2001;29:22–28. doi: 10.1093/nar/29.1.22. [DOI] [PMC free article] [PubMed] [Google Scholar]
- 15.Kim R, Sandler S J, Goldman S, Yokota H, Clark A J, Kim S-H. Biotech Lett. 1998;20:207–210. [Google Scholar]
- 16.Leahy D J, Hendrickson W A, Aukhil I, Erickson H P. Science. 1992;258:987–991. doi: 10.1126/science.1279805. [DOI] [PubMed] [Google Scholar]
- 17.Jancarik J, Kim S-H. J Appl Crystallogr. 1991;24:409–411. [Google Scholar]
- 18.Otwinowski Z, Minor W. Methods Enzymol. 1997;276:307–326. doi: 10.1016/S0076-6879(97)76066-X. [DOI] [PubMed] [Google Scholar]
- 19.Terwilliger T C, Berendzen J. Acta Crystallogr D. 1999;55:849–861. doi: 10.1107/S0907444999000839. [DOI] [PMC free article] [PubMed] [Google Scholar]
- 20.Abrahams J P, Leslie A G W. Acta Crystallogr D. 1996;52:30–42. doi: 10.1107/S0907444995008754. [DOI] [PubMed] [Google Scholar]
- 21.Jones A, Kleywegt G. Methods Enzymol. 1997;277:173–208. doi: 10.1016/s0076-6879(97)77012-5. [DOI] [PubMed] [Google Scholar]
- 22.Brunger A T, Adams P D, Clore G M, DeLano W L, Gros P, Grosse-Kunstleve R W, Jiang J S, Kuszewski J, Nilges M, Pannu N S, et al. Acta Crystallogr D. 1998;54:905–921. doi: 10.1107/s0907444998003254. [DOI] [PubMed] [Google Scholar]
- 23.Luzzati V. Acta Crystallogr. 1952;5:802–810. [Google Scholar]
- 24.Laskowski R A, MacArthur M W, Moss D S, Thornton J M. Appl Crystallogr. 1993;26:283–291. [Google Scholar]
- 25.Orengo C A, Michie A D, Jones S, Jones D T, Swindells M B, Thornton J M. Structure Fold Des. 1997;5:1093–1108. doi: 10.1016/s0969-2126(97)00260-8. [DOI] [PubMed] [Google Scholar]
- 26.Richardson J S. Adv Protein Chem. 1981;34:167–339. doi: 10.1016/s0065-3233(08)60520-3. [DOI] [PubMed] [Google Scholar]
- 27.Zhang C, Kim S-H. J Mol Biol. 2000;299:1075–1089. doi: 10.1006/jmbi.2000.3678. [DOI] [PubMed] [Google Scholar]
- 28.Holm L, Sander C. Nucleic Acids Res. 1997;25:231–234. doi: 10.1093/nar/25.1.231. [DOI] [PMC free article] [PubMed] [Google Scholar]
- 29.Wallace A C, Borkakoti N, Thornton J M. Protein Sci. 1997;6:2308–2323. doi: 10.1002/pro.5560061104. [DOI] [PMC free article] [PubMed] [Google Scholar]
- 30.Kleywegt G J. J Mol Biol. 1999;285:1887–1897. doi: 10.1006/jmbi.1998.2393. [DOI] [PubMed] [Google Scholar]
- 31.Nesbo C L, L'Haridon S, Stetter K O, Doolittle W F. Mol Biol Evol. 2001;18:362–375. doi: 10.1093/oxfordjournals.molbev.a003812. [DOI] [PubMed] [Google Scholar]
- 32.Chan M K, Mukund S, Kletzin A, Adams M W W, Rees D C. Science. 1995;267:1463–1469. doi: 10.1126/science.7878465. [DOI] [PubMed] [Google Scholar]
- 33.Yip K S, Stillman T J, Britton K L, Artymiuk P J, Baker P J, Sedelnikova S E, Engel P C, Pasquo A, Chiaraluce R, Consalvi V. Structure (London) 1995;3:1147–1158. doi: 10.1016/s0969-2126(01)00251-9. [DOI] [PubMed] [Google Scholar]
- 34.Das R, Gerstein M. Funct Integr Genomics. 2000;1:76–88. doi: 10.1007/s101420000003. [DOI] [PubMed] [Google Scholar]
- 35.Watanabe K, Chishiro K, Kitamura K, Suzuki Y. J Biol Chem. 1991;266:24287–24294. [PubMed] [Google Scholar]
- 36.Ahern T J, Klibanov A M. Science. 1985;228:1280–1284. doi: 10.1126/science.4001942. [DOI] [PubMed] [Google Scholar]
- 37.Aswad D W. Ann NY Acad Sci. 1990;613:26–36. doi: 10.1111/j.1749-6632.1990.tb18145.x. [DOI] [PubMed] [Google Scholar]
- 38.Kraulis P J. J Appl Crystallogr. 1991;24:946–950. [Google Scholar]
- 39.Carson M. J Appl Crystallogr. 1991;24:958–961. [Google Scholar]
- 40.Nicholls A. Proteins. 1991;11:281–296. doi: 10.1002/prot.340110407. [DOI] [PubMed] [Google Scholar]


