

Abstract
Prenatal inorganic arsenic (iAs) exposure influences the expression of critical genes and proteins associated with adverse outcomes in newborns, in part through epigenetic mediators. The doses at which these genomic and epigenomic changes occur have yet to be evaluated in the context of dose-response modeling. The goal of the present study was to estimate iAs doses that correspond to changes in transcriptomic, proteomic, epigenomic, and integrated multi-omic signatures in human cord blood through benchmark dose (BMD) modeling. Genome-wide DNA methylation, microRNA expression, mRNA expression, and protein expression levels in cord blood were modeled against total urinary arsenic (U-tAs) levels from pregnant women exposed to varying levels of iAs. Dose-response relationships were modeled in BMDExpress, and BMDs representing 10% response levels were estimated. Overall, DNA methylation changes were estimated to occur at lower exposure concentrations in comparison to other molecular endpoints. Multi-omic module eigengenes were derived through weighted gene co-expression network analysis, representing co-modulated signatures across transcriptomic, proteomic, and epigenomic profiles. One module eigengene was associated with decreased gestational age occurring alongside increased iAs exposure. Genes/proteins within this module eigengene showed enrichment for organismal development, including potassium voltage-gated channel subfamily Q member 1 (KCNQ1), an imprinted gene showing differential methylation and expression in response to iAs. Modeling of this prioritized multi-omic module eigengene resulted in a BMD(BMDL) of 58(45) μg/L U-tAs, which was estimated to correspond to drinking water arsenic concentrations of 51(40) μg/L. Results are in line with epidemiological evidence supporting effects of prenatal iAs occurring at levels <100 μg As/L urine. Together, findings present a variety of BMD measures to estimate doses at which prenatal iAs exposure influences neonatal outcome-relevant transcriptomic, proteomic and epigenomic profiles.
Keywords: arsenic, dose-response modeling, DNA methylation, microRNA, multi-omics, epigenome, transcriptome, proteome, in utero
Graphical Abstract

INTRODUCTION
Research on genomic and epigenomic mechanisms mediating environmental exposure-induced disease is rapidly growing.1–4 Concurrently, human health assessments and toxicity-testing programs are undergoing an effort to decrease reliance upon traditional animal testing and increase the use of mechanistic data and newer technologies, including toxicogenomics, high-throughput screening, and computational toxicology.5, 6 Strategies to incorporate these methods and related datasets into human health assessments and regulatory decisions are current topics of growing interest.7–10 However, there is a paucity of studies providing examples of how –omic datasets, particularly epigenomic data, may be used to inform doses at which adverse molecular changes occur, an important step in the setting of chemical regulations.
There are several potential advantages to utilizing transcriptomic, proteomic, and epigenomic endpoints as critical effects in the evaluation of chemical toxicity. For instance, transcriptomic, proteomic, and epigenomic evaluations are inherently based on genome-wide, non-targeted technologies that result in a more global scan of possible toxicant responses.5, 6 These methods allow for unbiased identification of responses that may be missed when using more traditional approaches that often evaluate select endpoints in any given study/experiment. Epigenomic data are particularly important to consider in chemical safety assessments, as they provide insight into potential multi- and transgenerational effects.1 Transcriptomic, proteomic, and epigenomic data are also amenable to dose-response modeling, a quantitative method that is commonly used in risk assessment to determine the relationship between an exposure and apical/frank outcomes. Such dose-response modeling strategies are often used to derive benchmark doses (BMDs) or benchmark dose lower bounds (BMDLs), which are subsequently adjusted by uncertainty factors to derive safety criteria.11
Transcriptomic data have previously been investigated in the context of BMD modeling. In 2007, BMDExpress was released as a BMD modeling software fitted to analyze transcriptomic data using modeling algorithms similar to that of the U.S. Environmental Protection Agency’s (U.S. EPA) Benchmark Dose Software (BMDS) program.12 Since then, several studies have estimated BMD(L)s based on transcriptomic responses to environmental toxicant exposures using BMDExpress and related findings to apical responses observed in animal models.10, 13, 14 Interest in these types of assessments is increasing alongside efforts to transform toxicity testing, as evidenced by several recent publications involving BMD modeling of transcriptomic data.10, 15–17 Related aspects that remain understudied, however, include how these strategies can be applied to data derived from human population studies and how other –omics profiles can be evaluated using similar methodologies. The specific inclusion of epigenomic endpoints in BMD modeling, such as genome-wide cytosine-phosphate-guanine (CpG) DNA methylation and microRNA (miRNA) expression, has not yet been evaluated.
The goal of the present study was to use BMD modeling to examine dose-response relationships for transcriptomic, proteomic, and epigenomic profiles in relation to prenatal inorganic arsenic (iAs) exposure in a pregnancy cohort, and relate these exposure-induced changes to disease-relevant biological signaling. An additional multiple -omic parameter that included hundreds of highly correlated molecules (i.e., mRNAs, miRNAs, proteins, and methylated CpGs) associated with birth outcome data was also modeled to provide a robust indicator of responses across multi–omic signatures. Network analysis of these co-modulated molecules was carried out to understand the biological relevance of the modelled parameter. This approach was used as an example to evaluate the doses at which important molecular changes occur in response to prenatal iAs exposure.
METHODS
This study combined and analyzed data from the Biomarkers of Exposure to ARsenic (BEAR) cohort that have been previously published separately. These published data include general study cohort and birth outcome data,18 genome-wide mRNA and miRNA expression signatures,19 genome-wide CpG methylation signatures,20 and proteomic signatures21 in infant cord blood samples. The current investigation made use of the previously identified lists of molecules associated with total urinary arsenic (U-tAs), and used these lists to carry out dose-response modeling, estimate BMD(L)s, evaluate statistical relationships to birth outcomes, and understand pathway alterations associated with these multi-omic responses. Descriptions of the original experiments are summarized below.
Study Cohort
This study was approved by the Institutional Review Boards at the University of North Carolina at Chapel Hill (#10–1583) and the Universidad Juárez del Estado de Durango. Participants in the current study represent a subset of the larger BEAR prospective pregnancy cohort, comprising 200 pregnant women residing in Gómez Palacio, State of Durango, Mexico. Details describing this cohort are published.18 Briefly, requirements for study participation included a 1-year minimum residence in the Gómez Palacio region, and participants were required to have good overall health status (e.g., no signs of chronic or acute disease). Participants were also required to have a singleton, intrauterine pregnancy without complications. Each participant completed questionnaires to collect information on time at residence, socioeconomic factors, coexposure factors (e.g., alcohol consumption and smoking status), and information on other potential sources of arsenic exposure, including sources of water used for drinking and cooking. Participants provided written, informed consent to participate and provided urine samples, drinking water samples, and donated umbilical cord blood at delivery.
DNA methylation, miRNA expression, mRNA expression, and protein expression profiles were assessed using samples from 48, 40, 38, and 50 mother-newborn pairs, respectively, with samples from 31 mother-newborn pairs assessed across all four -omic endpoints. Collectively, these samples represent 59 unique subjects from the larger cohort (n=200). This subcohort was selected to include subjects exposed to varying levels of arsenic as determined by total arsenic in material urine (U-tAs) and inorganic arsenic in drinking water (DW-iAs).
Determination of DW-iAs and U-tAs
DW-iAs concentrations were determined from water samples collected from the participants’ stated primary source of drinking water within four weeks of newborn delivery. Samples were collected from bottled water or municipally supplied kitchen tap water. Concentrations of DW-iAs were measured using hydride generation-atomic absorption spectrometry (HG-AAS) with a limit of detection (LOD) of 0.456 μg/L. U-tAs levels were measured from maternal spot urine samples that were collected at the time of delivery and stored in liquid nitrogen. The specific gravity (SG) of each urine sample was measured using a refractometer (Reichert TX 400 #13740000; Reichert Inc., Depew, NY). The major arsenical species, specifically iAs and its monomethylated and dimethylated metabolites (MMAs and DMAs), were measured using HG-AAS with cryotrapping. The LOD for urinary iAs, MMAs, and DMAs were 0.2, 0.1, and 0.1 ng/mL, respectively. U-tAs was defined as the SG-adjusted sum of iAs, MMAs (trivalent + pentavalent monomethylated arsenicals), and DMAs (trivalent + pentavalent dimethylated arsenicals). SG-adjustment was carried out using the overall mean SG (1.014 g/mL) of the larger cohort in following formula: (mean measured SG-1)/(individual measured SG-1). Levels of arsenic that were below the LOD in drinking water and urine were converted to the LOD divided by √2. DW-iAs and U-tAs levels were correlated using the Spearman rank correlation test and also fitted to a linear regression model to estimate how U-tAs levels reflect DW-iAs levels (GraphPad Prism v6.0).
Sample Collection, Preparation, and Genome-wide Evaluations
Cord blood samples were collected immediately following newborn delivery. For the DNA methylation analysis, samples were collected using Paxgene Blood DNA tubes and extracted using the PaxGene Blood DNA kit (Qiagen, Valencia, CA) as per the manufacturer’s specifications. Isolated DNA was bisulfite-converted and hybridized to the Illumina HumanMethylation450 BeadChip (Illumina, Inc, San Diego, DA). This method assessed the methylation levels, including 5-methylcytosine and 5-hydroxymethylcytosine, across 486,428 individual probes, each assessing single CpG sites throughout the genome including transcriptional start sites, gene bodies, 3’ and 5’ untranslated regions, and exons. Methylation levels were calculated and expressed as ß values, with ß = M / (U + M + 100), where M represents the intensity of the methylated allele and U is the intensity of the unmethylated allele. Probes were first filtered to remove those with poor detection (detection p-value<0.01). Subsequently, data were normalized using beta-mixture quantile (BMIQ) normalization and probes representing single nucleotide polymorphisms (SNPs) were removed from analysis, leaving a total of 424,935 probes (representing 18,761 unique genes) available for analyses.
For the miRNA and mRNA expression analysis, samples were collected using PreAnalytix PaxGene RNA tubes and extracted using the PAXgene RNA Kit (Qiagen, Valencia, CA). RNA quality was verified using a 2100 Bioanalyzer (Agilent Technologies, Santa Clara, CA). RNA samples were amplified, labeled, and hybridized to the Agilent Human miRNA Microarray (based off miRBase v16.0) and the Affymetrix GeneChip® Human Gene 2.0 ST array. For the miRNA microarray data, signal intensities were averaged across probes for each miRNA and data were normalized by quantiles. For the mRNA microarray data, signal intensities were normalized by robust multi-chip average. A total of 1347 miRNAs and 25,412 mRNAs (represented by 53,617 probesets) were analyzed. Microarray data have been submitted to National Center for Biotechnology Information (NCBI) Gene Expression Omnibus repository22 and are available under series GSE48355.23
For the protein analysis, cord blood samples were collected with BD Vacutainer tubes with clot activators (Becton, Dickinson and Company, Franklin Lakes, NJ). After clot formation, each tube was centrifuged and the supernatant was used for proteomic analysis. The relative expression levels of 507 proteins in the cord serum samples were measured with the Biotin Label-based Human Antibody Array I, L series 507 (RayBiotech, Norcross, GA). This array assessed proteins involved in various aspects of cellular signaling and included angiogenic factors, cytokines, chemokines, growth factors, soluble receptors, and soluble adhesion molecules. Protein labeling, hybridization, and array scanning were carried out according to the manufacturer’s instructions.
Statistical Evaluation of Genomic/Epigenomic/Proteomic Changes Associated with U-tAs
Genome-wide CpG site DNA methylation, miRNA expression, mRNA expression, and protein expression profiles were evaluated using multivariable regression models. These models used U-tAs (log-transformed) as the independent variable and the specific –omic profile under evaluation as the dependent variable. The regression models included covariates that were correlated with exposure and/or were plausibly related to –omic profiles, including mother’s age (continuous variable), mother’s smoking status (categorical variable), newborn sex (binary variable), and either birth weight or a ratio of newborn weight/gestational age (continuous variable). Because different platforms were used to assess the different –omic profile endpoints, which inherently generate different signal intensities that span across different distributions, numbers of data points, and variance structures, the exact statistical filters used to identify significant changes were tailored for each previously published analysis. Specifically, a false discovery rate corrected q-value≤0.05 was used for the CpG methylation analysis; a p-value<0.01, fold change≥± 1.5 (high exposed quartile/lowest exposed quintile), and additional permutation-based analysis generating multivariable deviation scores were used for the miRNA and mRNA analyses; and a q-value<0.10 was used for the protein analysis. CpG sites, miRNAs, mRNAs, and proteins meeting these statistical criteria were identified as significantly associated with U-tAs, consistent with the previously published lists of molecules associated with U-tAs.19–21
Dose-Response Modeling of U-tAs-Associated Molecules
Dose-response modeling of the CpG methylation, miRNA expression, mRNA expression, and protein expression for molecules showing significant association to U-tAs was carried out with BMDExpress v2.0.24 Analyses were carried out using the lists of molecular endpoints (represented by their respective probes when applicable) and their methylation/expression levels against U-tAs levels (μg/L). To carry out dose-response modeling on these continuous measures, data from the 59 subjects were grouped into exposure quintiles according to U-tAs levels. Exposure grouping strategies have been implemented previously by the U.S. EPA (e.g. benzene assessment25). Quintiles were selected for the current analysis because they allowed data points to span across the majority of the iAs dose range, while still providing adequate replicates to model at each discrete dose (modeled as median U-tAs levels across the quintile). Furthermore, the lowest exposed group showed the same median U-tAs levels as measured in U.S. populations,26 indicating that the lowest exposed group could be modeled as an estimate of a “background” exposed population. To evaluate the potential impacts of this grouping strategy, an additional analysis was carried out using quartiles.
Curve fitting of the dose-response relationships between U-tAs and the CpG sites, miRNAs, mRNAs, and proteins was carried out using methods similar to those previously used for transcriptomic-based analyses.12, 16 Models were run without assuming constant variance for the CpG methylation, miRNA expression, and protein expression analyses. Other aspects remained similar, which included fitting the dose-response curves to four models: Hill, power, linear, and 2° polynomial. A benchmark response (BMR) factor of 1.349 standard deviations was used, representing the number of standard deviations required to shift the mean -omic response 10% over the assumed background rate of response, defining the benchmark dose (BMD). Models with the best fit were selected as those that (1) described the data with the least complexity, (2) had a nested likelihood ratio test p<0.05, and (3) had the lowest Akaike information criterion (AIC). The Hill model was considered only when the k parameter was >1/3 the lowest dose tested, in order to avoid artificial minimization of BMDs. Other parameters included setting the maximum iterations to 250 and the confidence level to 0.95. Probes were removed if they showed either BMD >the highest dose, BMD/BMDL (BMD lower confidence limit) ratios >20, and/or BMD <the lowest dose in order to avoid model extrapolation. The model curves were required to have goodness-of-fit p>0.1 (likelihood ratio test) to be selected as adequately describing dose-response trends in methylation/expression.12, 16 Molecules that met these statistical criteria were identified as showing dose-dependent changes associated with U-tAs, in addition to their previous statistical association to U-tAs via multivariate linear regression modeling. A Spearman Rank correlation testwas used to analyze the potential relationship between the number of dose-dependent molecular endpoints and median BMD estimates.
Statistical Evaluation of Molecules in Association with Birth Outcomes
All molecules associated with U-tAs level were also evaluated for statistical association with birth outcomes using multivariable regression models similar to those described above. The evaluated birth outcomes included newborn weight, gestational age, weight/gestational age ratio, height, head circumference, and placental weight. These models used the specific –omic profile under evaluation as the dependent variable with each birth outcome of interest (run separately) as the independent variable, while adjusting for mother’s age (continuous variable), mother’s smoking status (categorical variable), alcohol consumption (binary variable), and U-tAs (continuous variable). Statistical analyses were carried out using R (v3.2.4) using the fit linear models (lm) and adjust p-values for multiple comparisons (p.adjust) functions. Molecules with a false discovery rate less than 5% (q-value<0.05) were considered to be significantly associated with a birth outcome.
Weighted Gene Co-Expression Analysis to Model Multi-Omic Responses
To carry out an additional BMD modeling effort using a robust measure informed by multiple –omic profiles, weighted gene co-expression analysis (WGCNA) was employed to calculate integrated measures from co-modulated molecules (i.e. module eigengenes, as defined below). WGCNA represents a systems biology method for describing the correlation patterns among different types of genetic and proteomic molecules (among others, potentially), historically across microarray samples.27 This method has been used previously for various systems biology analyses, including in the integration of metabolomics and transcriptomics data to identify signaling involved in pancreatic cancer28, and for the comparison of chemical-specific modes of action identified through RNA sequencing versus microarray technologies.29 WGCNA was used in the present study to identify clusters (modules) of highly interconnected molecules across multiple –omic endpoints, all correlated with each other, and thus considered co-modulated. The steps involved in WGCNA have been summarized elsewhere.27, 30 In brief, Pearson correlation coefficients were first calculated for all pairwise comparisons of molecules. The resulting Pearson correlation matrix was transformed into an adjacency matrix resulting in a weighted network describing connection strengths between molecules. An unsigned network was used here, such that molecules with both negative and positive correlations were grouped together. Correlation values within the adjacency matrix were raised to a power of 16, based on soft thresholding associated with a scale-free topology model fit R2 >0.80. This resulted in the construct of a co-expression network that was weighted, emphasizing high correlations and de-emphasizing low correlations between molecules. Modules were then identified as groups of densely interconnected molecules in the weighted network analysis with high topological overlap, measured based on an average linkage hierarchical clustering with a dynamic tree-cutting algorithm. Simply put, the resulting modules represented clusters of highly interconnected molecules with high positive or negative correlations. With these defined modules, module eigengenes were then calculated as the first principal component of a given module27.
In the current analysis, all molecules that were identified as significantly associated with U-tAs that also were annotated to known genes/proteins (total number of molecules=3762) were analyzed collectively using the WGCNA R package.30 Data from 31 subjects were used here, as these represented the subset of subjects with all four –omics endpoints evaluated. WGCNA resulted in the identification of module eigengenes, which were ultimately utilized for the purposes of BMD modeling. Because module eigengenes are defined as the first principal component of a given module, in the current analysis, module eigengenes represented the collective methylation and/or expression levels of hundreds-to-thousands of molecules that are co-modulated in response to iAs. Resulting module eigengenes were analyzed through BMDExpress using the aforementioned methods, and correlated against arsenic measures and birth outcome data using Pearson correlation tests (WGCNA R package).
Network Analysis of Molecules within Prioritized Module Eigengene
Network analysis was carried out to understand systems-level responses that occur within a co-modulated set of multi-omic molecules identified through WGCNA. For this analysis, iAs-associated genes and proteins from a prioritized module eigengene were overlaid onto a global molecular interaction network based on published molecular interactions, and networks were algorithmically constructed based on connectivity, as enabled through Ingenuity Pathway Analysis (Ingenuity Systems®). Sets of genes/proteins corresponding to biological functions and disease signatures within the constructed networks were then identified using a right-tailed Fisher’s Exact test and corrected for multiple testing using the Benjamini Hochberg procedure, as performed previously.17, 19
RESULTS
Characteristics of Study Cohort
This study focused on a subcohort of 59 mother-newborn pairs that had DNA/RNA blood samples collected and analyzed from the larger BEAR pregnancy cohort. The levels of U-tAs ranged between 6.2 and 319.7, with none of the U-tAs levels <LOD (Table 1). The DW-iAs levels ranged between <LOD and 235.6 μg/L, where approximately 60% (n=35) of the samples were obtained from infants born to women drinking DW-iAs levels exceeding the World Health Organization (WHO) guidance value of 10 μg/L. Thirteen of the 59 samples were obtained from infants born to women drinking DW-iAs levels <LOD (Table 1). The levels of DW-iAs and U-tAs were significantly correlated (p<0.001). It is important to note that, in addition to drinking water, other sources of arsenic exposure were possible (e.g. seafood consumption and other dietary sources); although reported seafood consumption was minimal for this cohort.18
Table 1.
Characteristics of the study cohort.
| na (%) or mean, median [range] | |
|---|---|
| Exposure Measures | |
| DW iAs (ug As/L) | 49.9, 30.5 [<LODb-235.6] |
| UtAs, SG adj (ug/L) | 56.6, 28.1 [6.2–319.7] |
| Subject Characteristics | |
| Maternal age at delivery (years) | 24, 23 [18–40] |
| Alcohol: No Consumption | 48 (81%) |
| Alcohol: Some Consumption | 11 (19%) |
| Smoking Status: Nonsmokers | 56 (97%) |
| Smoking Status: Current smokers | 2 (3%) |
| Newborn Characteristics | |
| Newborn Sex: Male | 25 (42%) |
| Newborn Sex: Female | 34 (58%) |
| Gestational Age (weeks) | 39, 39 [34–41] |
| Birth Weight (g) | 3320, 3300 [1800–5120] |
| APGAR score | 9, 9 [8–10] |
| Placental Weight (g) | 657, 640 [410–1000] |
| Length (cm) | 50, 50 [40–58] |
| Head Circumference (cm) | 35, 35 [32–37] |
Differences in n based on missing demographic data
LOD for DW-iAs = 0.456 μg As/L
Prenatal iAs Exposure is Associated with -Omic Changes
All –omic profiles were analyzed for statistical association to U-tAs through multivariate linear regression analyses, consistent with the previously published molecular findings.19–21 Similar statistical models were used to analyze –omic profiles, with statistical criteria adapted for each analysis to suit the different platforms, signal distributions, and variance structures. Thus, the number of genes/proteins identified as significantly associated with U-tAs are not directly comparable across molecular endpoints. With this in mind, the following were significantly associated with U-tAs: 3493 CpG methylation sites (representing 2919 differentially methylated genes), 12 miRNAs, 315 mRNAs, and 111 proteins (Table 2). The microarray analysis results were confirmed using a subset of genes validated through real-time reverse transcriptase polymerase chain reaction (qRT-PCR), as previously described.19
Table 2.
Summary of sample counts, quintile groupings used for multi-omic BMD modeling, and number of molecules meeting statistical criteriaa.
| All Molecular Endpoints | CpG site DNA Methylation | miRNA Expression | mRNA Expression | Protein Expression | Multi-omic Profiles through WGCNA | ||
|---|---|---|---|---|---|---|---|
| Number of Cord Blood Samples Evaluated | 59 | 48 | 40 | 38 | 50 | 31 | |
| Number of Molecules Evaluated for Significant Association to U-tAs | ‐ | 424,935 | 1,347 | 25,412 | 507 | ‐ | |
| Number of Molecules Significantly Associated with U-tAs and analyzed through BMD modeling | ‐ | 3,493b | 12c | 315d | 111e | 5 MEs | |
| Median U-tAs (ug/L) used for BMD modeling [number of subjects] | |||||||
| Quintile #1 | 8.5 [12] | 8.5 [10] | 8.4 [11] | 8.4 [9] | 8.5 [10] | 8.4 [7] | |
| Quintile #2 | 15.3 [12] | 15.3 [10] | 15 [8] | 15 [8] | 15.1 [9] | 15 [6] | |
| Quintile #3 | 28.1 [11] | 29.4 [8] | 32.6 [5] | 32.6 [5] | 28.1 [9] | 32.6 [3] | |
| Quintile #4 | 40.2 [12] | 40.2 [8] | 82.1 [5] | 82.1 [5] | 41.2 [11] | 82.1 [5] | |
| Quintile #5 | 161.4 [12] | 161.4 [12] | 157.8 [11] | 157.8 [11] | 164.9 [11] | 161.4 [10] | |
| Number of Molecules Significantly Associated with U-tAs and Showing Dose-Dependent Changes through BMD Modeling | ‐ | 1,629 | 12 | 96 | 14 | 4 MEs | |
Statistical criteria were adapted for each analysis to suite the differing platforms and value distributions, thus making the number of genes/proteins identified as significantly associated with U-tAs not directly comparable across molecular endpoints
CpG sites were previously identified by Rojas et al. (2015), and filtered here to include those annotated to known genes
miRNAs were previously identified by Rager et al. (2014)
mRNAs were previously identified by Rager et al. (2014), and filtered here to includemRNAs annotated to known genes. These 315 mRNAs were represented by 364 probeset IDs.
Proteins were previously identified by Bailey et al. (2014). These 111 proteins were represented by 114 array probes.
Analyses have previously been carried out to identify whether individual iAs-responsive molecules showed correlation to other iAs-responsive molecules for these -omic endpoints. For instance, significant correlations (p<0.05) were observed between a subset of mRNA expression and CpG methylation levels associated with iAs, including changes in the following genes: cyclin G associated kinase (GAK), histone deacetylase 4 (HDAC4), and potassium voltage-gated channel subfamily Q member 1 (KCNQ1), among others.20 In addition, significant correlations were observed between a subset of mRNA and miRNA expression levels associated with iAs, particularly between pairs of mRNAs that were computationally predicted to be regulated by certain miRNAs, including the expression levels of dynamin 2 (DNM2) and miR-454, DNM2 and miR-20b, kinesin family member 21B (KIF21B) and miR-26b, and thyroid hormone receptor alpha (THRA) and miR-20b, among others.19
BMD Modeling of U-tAs-Associated Molecules
Dose-response modeling was carried out on the lists of CpG methylation sites, miRNAs, mRNAs, and proteins identified as associated with U-tAs. The BMD results were consistent across different grouping strategies, with data grouped by quartiles (data not shown) producing similar results to those produced with data grouped by quintiles, the grouping strategy used in this reported analysis. There was a median of 10 subjects per group, and the median U-tAs levels for dose-response modeling ranged from 8.4 to 164.9 μg As/L (Table 2).
A total of 1629 CpG sites were identified by BMD analysis: 12 miRNAs, 96 mRNAs, and 14 proteins with dose-dependent changes that significantly (p<0.1) fit curve models associated with U-tAs (Supporting Information, Table S1). The majority of the best curve fit models represented 2º polynomial fits. Linear curve fits were also commonly observed, whereas Hill and power models were only identified to fit the dose-response data for a small portion of CpG sites and mRNAs (Figure 1A). In general, the BMD estimates were the lowest for CpG sites (median BMD= 33 μg As/L, median BMDL= 15 μg As/L), followed by miRNAs (median BMD= 42, median BMDL= 18), proteins (median BMD= 45, median BMDL= 12), and mRNAs (median BMD= 64, median BMDL= 30) (Figure 1B, 1C). Of note, median BMD(L) estimates were not significantly correlated with the number of molecules showing dose-dependent changes (p>0.9), suggesting that the general trends observed for BMD values were indicative of biological response sensitivity to dose rather than merely the number of times an endpoint was assessed.
Figure 1. BMD model distributions of (A) best curve fit models for each -omic endpoint category, (B) BMD estimates, and (C) BMDL estimates.
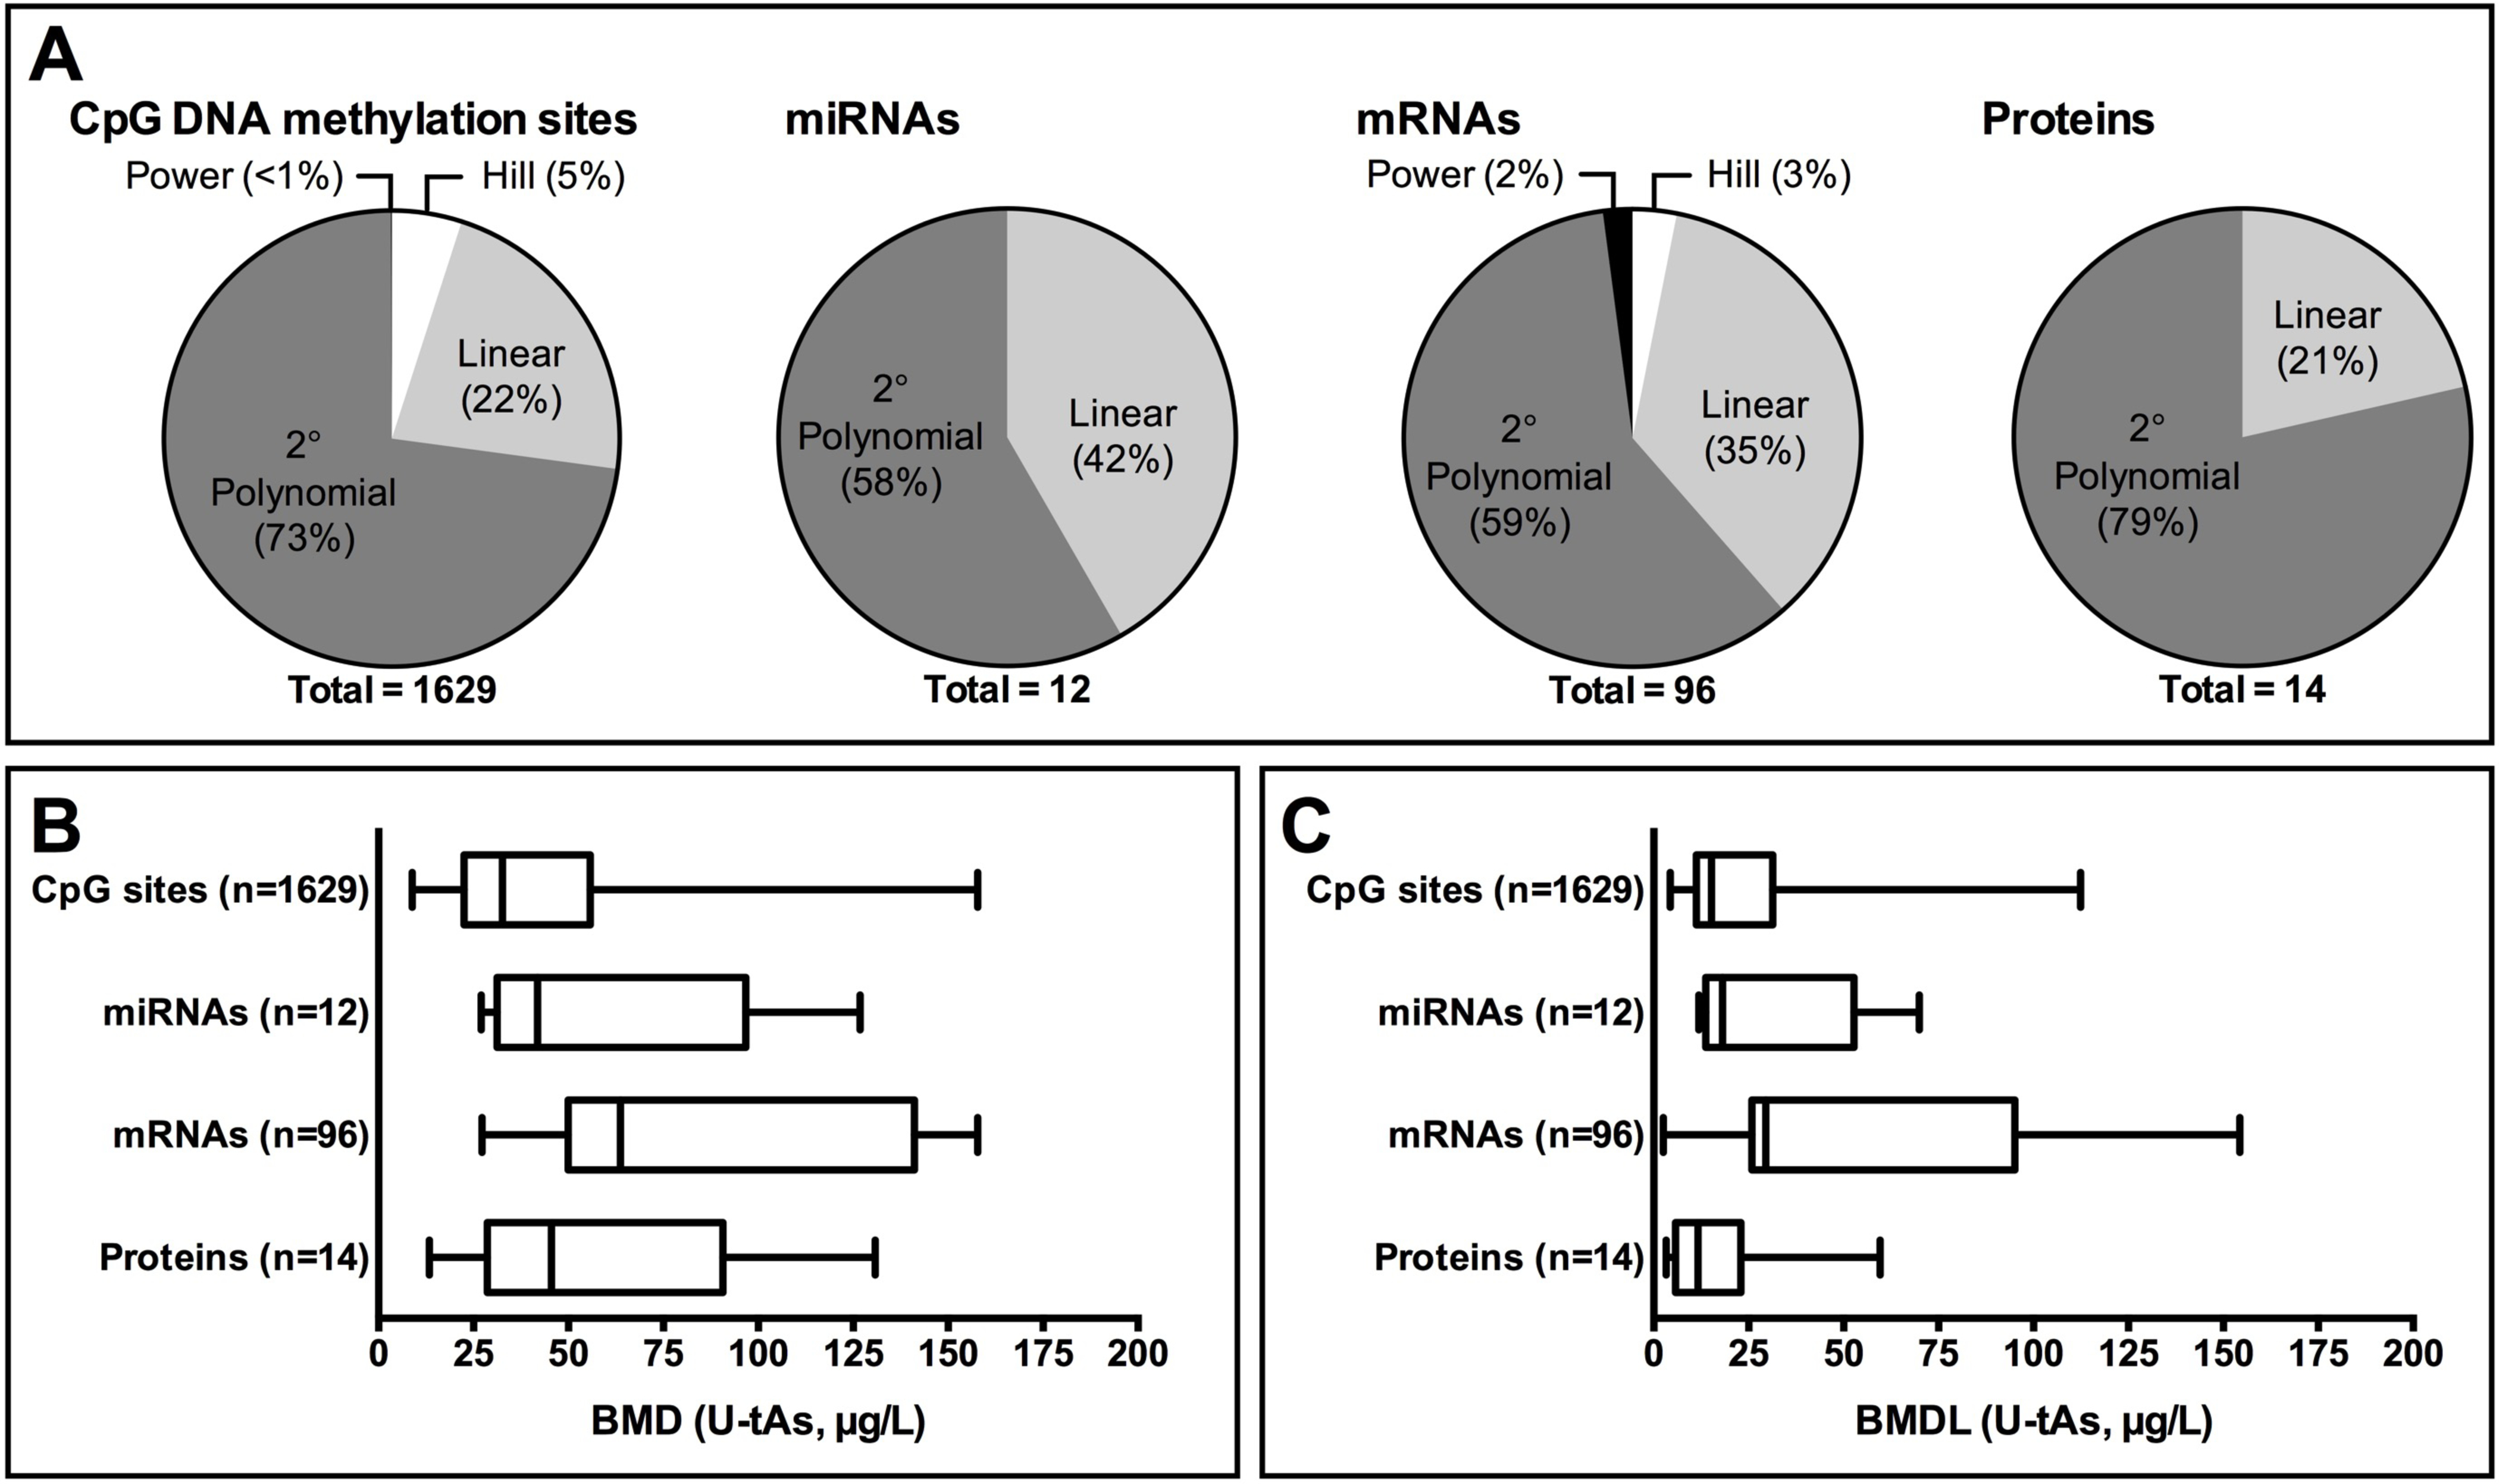
BMD values represent estimated doses causing a 10% shift over the background rate of response.
BMD Modeling of Multi-Omic Parameters through WGCNA
Five module eigengenes were identified through WGCNA (Figure 2A), representing the collective methylation and/or expression levels of hundreds-to-thousands of molecules that are co-modulated in response to iAs. Four of these module eigengenes showed dose-response curves that met our statistical criteria (Supporting Information, Table S1). One module eigengene (“MEgrey”) was significantly correlated with gestational age (p=0.005), while the other module eigengenes (“MEblue”, “MEyellow”, “MEbrown”, and “MEturquoise”) were not significantly associated with any birth outcomes (p≥0.05) (Figure 2A). Importantly, gestational age is a birth outcome measure that was previously identified to be significantly associated with prenatal iAs exposure in the BEAR cohort.18 The MEgrey module eigengene of interest was, thus, prioritized for further analysis, and was estimated to have a BMD(BMDL) of 58(45) μg/L U-tAs (Figure 2B). The co-modulation of 984 molecules was identified in this module, including 514 CpG methylation sites, 12 miRNAs, 344 mRNAs, and 114 proteins (Supporting Information, Table S2). Notably, this module contained KCNQ1methylation and mRNA expression co-modulations, as well as other example genes of interest identified through network analysis as involved in organismal growth signaling that were co-modulated in response to iAs (Figure 3A,B).
Figure 2. Module eigengenes representing co-modulated molecules associated with U-tAs across multi-omic signatures.

(A) A correlation matrix shows that module eigengenes (MEs) were highly correlated with several measures of arsenic exposure, including U-tAs (left half). Module eigengene correlations to birth outcomes are also shown (right half). (B) A BMD curve fit for the prioritized module eigengene (“MEgrey”) displays the eigengene data points grouped by quintiles (red squares) with the best fitting curve plotted as a blue line. BMD estimates are represented by the black vertical lines closest to the right, and BMDL estimates by the black vertical lines closest to the left.
Figure 3. Example molecules of interest showing concerted responses to prenatal iAs exposure, grouped within the prioritized module eigengene (“MEgrey”).

Example molecules are shown that had methylation and/or expression levels that were (A) positively or (B) negatively correlated to MEgrey, a collective measure of methylation and/or expression levels of 984 co-regulated molecules. Methylation and expression levels are Z-score normalized.
Network Analysis of Multi-Omic Responses in Prioritized Module Eigengene
Network analysis of the molecules within the prioritized module eigengene (MEgrey) generated multiple significant networks containing known interactions between proteins encoded by differentially methylated/expression genes, miRNAs, and other molecules (Supporting Information, Table S3). One of the most highly enriched diseases/functions associated with these network-level responses was organismal development (Benjamini-Hochberg p<1.6×10⁻¹⁰) (Supporting Information, Table S4). A highly significant network related to organismal development was amongst those that were constructed based on known molecular interactions (Figure 4), and contained 15 molecules related to this functional category. Of these organismal development-related molecules, KCNQ1 had CpG island methylation levels also showing a significant association with several birth outcomes, including gestational age (Supporting Information, Table S1). Other molecules related to organismal development and associated with iAs exposure included neuronal differentiation 1 (NEUROD1), a protein with increased expression; histone deacetylase 5 (HDAC5), a gene with decreased cytosine methylation; and HDAC4, a gene with both increased cytosine methylation and decreased mRNA expression. HDAC4 and HDAC5 methylation were also associated with gestational age (Supporting Information, Table S1).
Figure 4. A network showing organismal development signaling associated with molecules within the prioritized multi-omic module eigengene (“MEgrey”).

Molecules with iAs-associated changes are colored, and molecules with associated signaling are white.
Estimating Drinking Water Levels associated with BMD Results
The BMD analysis was carried out by modeling molecular endpoints against U-tAs, as U-tAs is recognized as the most reliable indicator of human arsenic exposure occurring within the last several days.31 The amount of iAs in drinking water that correlates with the U-tAs BMD estimates for the prioritized gene of interest was estimated using a linear regression model relating measured U-tAs versus DW-iAs levels. Evaluating overall exposure-associated changes in –omic profiles, median BMD(BMDL) estimates for CpG site methylation, miRNA expression, mRNA expression, and protein expression changes were estimated to occur at drinking water arsenic levels of 31(16), 38(18), 56(28), and 40(14) μg As/L water, respectively. The prioritized multi-omic module eigengene was estimated to have a BMD(BMDL) of 58(45) μg/L U-tAs, which was estimated to correspond to DW-iAs concentrations of 51(40) μg/L.
DISCUSSION
This study evaluated dose-response relationships for transcriptomic, proteomic, and epigenomic responses to prenatal iAs exposure in newborn cord blood from a pregnancy cohort in Gómez Palacio, Mexico, with the goal of estimating the exposure doses at which important molecular changes occur. A multi-omic parameter (i.e. module eigengene) was also modelled that included measures from >900 highly correlated genes/proteins. Analyses resulted in the estimation of BMD(BMDL) values for individual iAs-responsive molecules as well as trends in overall –omic changes. A variety of BMD estimates were provided to serve as a starting point for estimating doses at which prenatal iAs exposure may influence important neonatal transcriptomic, proteomic and epigenomic signatures.
The BMD modeling results showed that, together, CpG methylation changes were estimated to occur at a median BMD(BMDL) of 33(15) μg As/L urine; miRNA expression at 42(18) μg As/L urine; mRNA expression at 64(30) μg As/L urine; and protein expression at 45(12) μg As/L urine. The multi-omic module eigengene that was prioritized for its correlation to gestational age was estimated to have a BMD(BMDL) of 58(45) μg/L U-tAs. These BMD(BMDL) values were estimated to relate to DW-iAs at the following levels: CpG methylation changes at 31(16) μg As/L; miRNA expression changes at 38(18) μg As/L, mRNA expression changes at 56(28) μg As/L; protein expression changes at 40(14) μg As/L; multi-omic module eigengene at 51(40) μg/L water. To compare these BMD(BMDL) estimates to existing recommendations, the current WHO recommended limit and U.S. EPA limit for arsenic in drinking water is 10 μg/L32, 33, and the current U.S. EPA oral reference dose (RfD) is 0.3 μg As/kg-day, based on a no observed adverse effect level (NOAEL) of 9 μg As/L water for hyperpigmentation, keratosis, and possible vascular complications (last revised in 1991).34 These exposure limits were largely based on health effects observed in adults, and the U.S. EPA arsenic regulations are in the process of being updated,35 making the results of the current analysis on the effects of arsenic exposure in newborns of timely importance.
BMD modeling findings are in line with previous epidemiological evidence supporting adverse health effects associated with prenatal exposure to arsenic starting at exposures as low as 50 μg iAs/L drinking water. For example, an investigation of a cohort in Bangladesh that included >29,000 pregnancies found that significantly increased risks of fetal loss and infant death occurred at concentrations >50 μg iAs/L water,36 and reported a dose-dependent relationship between iAs exposure and infant death.36 Another study evaluated 1,578 mother-infant pairs from Bangladesh, and related birth outcomes to U-tAs.37 At a low level of iAs exposure (<100 μg As/L urine), a significant inverse relationship between dose and effects was identified for birth weight and head and chest circumferences. Although the authors did not provide an exact level at which birth outcome changes occurred, it was detailed that in the dose range of <100 μg As/L urine, each 1 μg As/L increase was associated with a 1.68-g reduction in birth weight, a 0.05 mm reduction in head circumference, and a 0.14 mm reduction in chest circumference.37 A recent U.S. study found significant relationships between maternal U-tAs levels, ranging between 0.45 and 58.3 μg As/L urine (median=3.7 μg As/L), and increased risk of infant infections.38 The median BMD(BMDL) estimates from the current molecular analysis were between 33 and 64 μg As/L urine (12 and 30 μg As/L urine) across each molecular endpoint, corroborating the evidence for effects of prenatal iAs occurring at levels <100 μg As/L urine.
Network analysis of the genes and proteins within the prioritized module eigengene showed an enrichment for signaling related to organismal development. Molecules involved in organismal development included KCNQ1, showing increased CpG island methylation and decreased mRNA expression associated with iAs exposure. KCNQ1 is a genetically imprinted gene that plays an important role in embryonic development39 and was also highlighted in our previous investigation assessing CpG methylation changes using similar samples.20 Specific in vivo evidence using transgenic Kcnq1-/- mice supports the role of KCNQ1 in morphological development and cardiac repolarizing defects.40 In relation to prenatal toxicant exposure, abnormal expression of Kcnq1 has also been observed in spinal cord tissues of retinoic acid-induced neural tube defects in mice.41 A related gene that is located in an intron of KCNQ1, KCNQ1OT1 (KCNQ1 opposite strand/antisense transcript 1 (non-protein coding)), has specifically been reported to be hypermethylated in children born small for gestational age.42 HDAC4 and HDAC5 alterations have known implications in a variety of diseases including developmental abnormalities,43 with both containing differentially methylated regions of DNA in the current study (and related changes in mRNA in the case of HDAC4). Together, this network analysis of multi-omic, co-regulated signatures provides evidence for disease-relevant molecules showing concerted responses to prenatal iAs exposure at the transcriptomic, proteomic, and epigenomic levels.
There were advantages and disadvantages to using the current study’s cohort data in the context of BMD modeling. Advantages included that the experiment provided quantitative measures of arsenic exposure spanning 6.2–319.7 μg As/L urine and subjects exposed for at least have 1 year (the minimum residency requirement for study participation). Disadvantages included the relatively limited number of samples (59) used for –omics profiling. In addition, the dose-response modeling algorithms currently implemented in the BMD software platforms, BMDS and BMDExpress, do not take into account potential covariates. Recognizing this as a limitation, we specifically filtered the –omics profiles prior to BMD modeling to include only molecules showing significant association to U-tAs through multivariate regression models that considered potential confounders. Additionally, all potential sources of arsenic exposure were not explicitly collected and measured. Although seafood consumption was reported as minimal, other dietary exposures could be influencing the total amount of arsenic exposure. Because of this limitation, we used U-tAs as the dose metric to evaluate related molecular responses, and provided estimates of how these related to collected DW-iAs levels. We also note that additional studies are needed in order to further evaluate potential correlations between epigenetic modifications and phenotypic outcomes. As we continue to follow-up on the study cohort, further information will be collected related to newborn and childhood development, and it will be informative to carry out BMD modeling on these future data points.
CONCLUSIONS
This study employs an integrative strategy to evaluate transcriptomic, epigenomic, and proteomic responses to an environmental exposure through BMD modeling, with the aim of estimating doses at which important molecular endpoints are altered by prenatal iAs exposure. Results show that –omic endpoints are amenable to BMD analyses, and that BMD(L) estimates of molecular changes are consistent with current epidemiological evidence showing relationships between prenatal iAs exposure and adverse birth outcomes. Such an approach could potentially be used to better leverage the application of mechanistic/biomarker data and computational toxicology approaches during dose-response evaluations in human health risk assessments.
Supplementary Material
The Supporting Information is available free of charge on the ACS Publications website at DOI:Table S1-S4.
Funding Sources
This research was supported in part by grants from the National Institute of Environmental Health Sciences (P42ES005948, R01ES019315, and T32ES007018).
Abbreviations
- AIC
Akaike information criteria
- BMD
benchmark dose
- BMDL
benchmark dose lower bound
- BMIQ
beta-mixture quantile
- BMR
benchmark response
- CpG
cytosine-phosphate-guanine
- DMA
dimethylated arsenicals
- DNM2
dynamin 2
- DW-iAs
drinking water inorganic arsenic
- GAK
cyclin G associated kinase
- HDAC4
histone deacetylase 4
- HDAC5
histone deacetylase 5
- HG-AAS
hydride generation-atomic absorption spectrometry
- iAs
inorganic arsenic
- KCNQ1
potassium voltage-gated channel subfamily Q member 1
- KCNQ1OT1
KCNQ1 opposite strand/antisense transcript 1 (non-protein coding)
- KIF21B
kinesin family member 21B
- LOD
limit of detection
- ME
module eigengene
- miRNA
microRNA
- MMA
monomethylated arsenicals
- NCBI
National Center for Biotechnology Information
- NOAEL
no observed adverse effect level
- qRT-PCR
real-time reverse transcriptase polymerase chain reaction
- RfD
reference dose
- SG
specific gravity
- SNP
single nucleotide polymorphism
- THRA
thyroid hormone receptor alpha
- U.S. EPA
United States Environmental Protection Agency
- U-tAs
urinary total arsenic
- WHO
World Health Organization
- WGCNA
weighted gene co-expression analysis
Footnotes
The authors declare they have no competing financial interests.
REFERENCES
- (1).Guerrero-Bosagna C, and Skinner MK (2012) Environmentally induced epigenetic transgenerational inheritance of phenotype and disease. Mol. Cell. Endocrinol. 354, 3–8. [DOI] [PMC free article] [PubMed] [Google Scholar]
- (2).Vrijens K, Bollati V, and Nawrot TS (2015) MicroRNAs as potential signatures of environmental exposure or effect: a systematic review. Environ. Health Perspect. 123, 399–411. [DOI] [PMC free article] [PubMed] [Google Scholar]
- (3).Chappell G, Pogribny IP, Guyton KZ, and Rusyn I (2016) Epigenetic alterations induced by genotoxic occupational and environmental human chemical carcinogens: A systematic literature review. Mutat. Res. Rev. Mutat. Res. 768, 27–45. [DOI] [PMC free article] [PubMed] [Google Scholar]
- (4).Chappell GA, and Rager JE (2017) Epigenetics in chemical-induced genotoxic carcinogenesis. Current Opinion in Toxicology 6, 10–17. [Google Scholar]
- (5).NAS. (2017) Using 21st Century Science to Improve Risk-Related Evaluations, Committee on Incorporating 21st Century Science into Risk-Based Evaluations; ISBN 978–0-309–45348-6. Washington, DC. [Google Scholar]
- (6).NAS. (2007) Toxicity Testing in the 21st Century: A Vision and A Strategy, Committee on Toxicity Testing and Assessment of Environmental Agents, National Research Council; ISBN 978–0-309–10992-5. Washington, DC. [Google Scholar]
- (7).Bourdon-Lacombe JA, Moffat ID, Deveau M, Husain M, Auerbach S, Krewski D, Thomas RS, Bushel PR, Williams A, and Yauk CL (2015) Technical guide for applications of gene expression profiling in human health risk assessment of environmental chemicals. Regul. Toxicol. Pharmacol. 72, 292–309. [DOI] [PMC free article] [PubMed] [Google Scholar]
- (8).Richard AM, Judson RS, Houck KA, Grulke CM, Volarath P, Thillainadarajah I, Yang C, Rathman J, Martin MT, Wambaugh JF, Knudsen TB, Kancherla J, Mansouri K, Patlewicz G, Williams AJ, Little SB, Crofton KM, and Thomas RS (2016) ToxCast Chemical Landscape: Paving the Road to 21st Century Toxicology. Chem. Res. Toxicol. 29, 1225–1251. [DOI] [PubMed] [Google Scholar]
- (9).Ray PD, Yosim A, and Fry RC (2014) Incorporating epigenetic data into the risk assessment process for the toxic metals arsenic, cadmium, chromium, lead, and mercury: strategies and challenges. Front. Genet. 5, 201. [DOI] [PMC free article] [PubMed] [Google Scholar]
- (10).Farmahin R, Williams A, Kuo B, Chepelev NL, Thomas RS, Barton-Maclaren TS, Curran IH, Nong A, Wade MG, and Yauk CL (2017) Recommended approaches in the application of toxicogenomics to derive points of departure for chemical risk assessment. Arch. Toxicol. 91, 2045–2065. [DOI] [PMC free article] [PubMed] [Google Scholar]
- (11).EPA, U. S. (2012) Benchmark Dose Technical Guidance, Risk Assessment Forum. EPA/100/R-12/001. Washington, DC. [Google Scholar]
- (12).Yang L, Allen BC, and Thomas RS (2007) BMDExpress: a software tool for the benchmark dose analyses of genomic data. BMC Genomics 8, 387. [DOI] [PMC free article] [PubMed] [Google Scholar]
- (13).Thomas RS, Allen BC, Nong A, Yang L, Bermudez E, Clewell HJ 3rd, and Andersen ME (2007) A method to integrate benchmark dose estimates with genomic data to assess the functional effects of chemical exposure. Toxicol. Sci. 98, 240–248. [DOI] [PubMed] [Google Scholar]
- (14).Thomas RS, Clewell HJ 3rd, Allen BC, Yang L, Healy E, and Andersen ME (2012) Integrating pathway-based transcriptomic data into quantitative chemical risk assessment: a five chemical case study. Mutat. Res. 746, 135–143. [DOI] [PubMed] [Google Scholar]
- (15).Thompson CM, Rager JE, Suh M, Ring CL, Proctor DM, Haws LC, Fry RC, and Harris MA (2016) Transcriptomic responses in the oral cavity of F344 rats and B6C3F1 mice following exposure to Cr(VI): Implications for risk assessment. Environ. Mol. Mutagen. 57, 706–716. [DOI] [PMC free article] [PubMed] [Google Scholar]
- (16).Moffat I, Chepelev NL, Labib S, Bourdon-Lacombe J, Kuo B, Buick JK, Lemieux F, Williams A, Halappanavar S, Malik AI, Luijten M, Aubrecht J, Hyduke DR, Fornace AJ Jr., Swartz CD, Recio L, and Yauk CL (2015) Comparison of toxicogenomics and traditional approaches to inform mode of action and points of departure in human health risk assessment of benzo[a]pyrene in drinking water. Crit. Rev. Toxicol. 45, 1–43. [DOI] [PMC free article] [PubMed] [Google Scholar]
- (17).Rager JE, Ring CL, Fry RC, Suh M, Proctor DM, Haws LC, Harris MA, and Thompson CM (2017) High-Throughput Screening Data Interpretation in the Context of In Vivo Transcriptomic Responses to Oral Cr(VI) Exposure. Toxicol. Sci. 158, 199–212. [DOI] [PMC free article] [PubMed] [Google Scholar]
- (18).Laine JE, Bailey KA, Rubio-Andrade M, Olshan AF, Smeester L, Drobna Z, Herring AH, Styblo M, Garcia-Vargas GG, and Fry RC (2015) Maternal arsenic exposure, arsenic methylation efficiency, and birth outcomes in the Biomarkers of Exposure to ARsenic (BEAR) pregnancy cohort in Mexico. Environ. Health Perspect. 123, 186–192. [DOI] [PMC free article] [PubMed] [Google Scholar]
- (19).Rager JE, Bailey KA, Smeester L, Miller SK, Parker JS, Laine JE, Drobna Z, Currier J, Douillet C, Olshan AF, Rubio-Andrade M, Styblo M, Garcia-Vargas G, and Fry RC (2014) Prenatal arsenic exposure and the epigenome: altered microRNAs associated with innate and adaptive immune signaling in newborn cord blood. Environ. Mol. Mutagen. 55, 196–208. [DOI] [PMC free article] [PubMed] [Google Scholar]
- (20).Rojas D, Rager JE, Smeester L, Bailey KA, Drobna Z, Rubio-Andrade M, Styblo M, Garcia-Vargas G, and Fry RC (2015) Prenatal arsenic exposure and the epigenome: identifying sites of 5-methylcytosine alterations that predict functional changes in gene expression in newborn cord blood and subsequent birth outcomes. Toxicol. Sci. 143, 97–106. [DOI] [PMC free article] [PubMed] [Google Scholar]
- (21).Bailey KA, Laine J, Rager JE, Sebastian E, Olshan A, Smeester L, Drobna Z, Styblo M, Rubio-Andrade M, Garcia-Vargas G, and Fry RC (2014) Prenatal arsenic exposure and shifts in the newborn proteome: interindividual differences in tumor necrosis factor (TNF)-responsive signaling. Toxicol. Sci. 139, 328–337. [DOI] [PMC free article] [PubMed] [Google Scholar]
- (22).Edgar R, Domrachev M, and Lash AE (2002) Gene Expression Omnibus: NCBI gene expression and hybridization array data repository. Nucleic Acids Res. 30, 207–210. [DOI] [PMC free article] [PubMed] [Google Scholar]
- (23).NCBI. (2017). Gene Expression Omnibus. Accessed on: Jan 1 2017. Available at: https://www.ncbi.nlm.nih.gov/geo/.
- (24).Auerbach S (2017). BMDExpress 2.0: First Release. Accessed on: Aug 3 2017. Available at: https://github.com/auerbachs/BMDExpress-2.0/releases.
- (25).EPA, U. S. (2002) Toxicological Review of Benzene (Noncancer Effects). EPA/635/R-02/001F. Washington, DC. [Google Scholar]
- (26).Caldwell KL, Jones RL, Verdon CP, Jarrett JM, Caudill SP, and Osterloh JD (2009) Levels of urinary total and speciated arsenic in the US population: National Health and Nutrition Examination Survey 2003–2004. J. Expo. Sci. Environ. Epidemiol. 19, 59–68. [DOI] [PubMed] [Google Scholar]
- (27).Langfelder P, and Horvath S (2008) WGCNA: an R package for weighted correlation network analysis. BMC Bioinformatics 9, 559. [DOI] [PMC free article] [PubMed] [Google Scholar]
- (28).Zhang G, He P, Tan H, Budhu A, Gaedcke J, Ghadimi BM, Ried T, Yfantis HG, Lee DH, Maitra A, Hanna N, Alexander HR, and Hussain SP (2013) Integration of metabolomics and transcriptomics revealed a fatty acid network exerting growth inhibitory effects in human pancreatic cancer. Clin. Cancer Res. 19, 4983–4993. [DOI] [PMC free article] [PubMed] [Google Scholar]
- (29).Wang C, Gong B, Bushel PR, Thierry-Mieg J, Thierry-Mieg D, Xu J, Fang H, Hong H, Shen J, Su Z, Meehan J, Li X, Yang L, Li H, Labaj PP, Kreil DP, Megherbi D, Gaj S, Caiment F, van Delft J, Kleinjans J, Scherer A, Devanarayan V, Wang J, Yang Y, Qian HR, Lancashire LJ, Bessarabova M, Nikolsky Y, Furlanello C, Chierici M, Albanese D, Jurman G, Riccadonna S, Filosi M, Visintainer R, Zhang KK, Li J, Hsieh JH, Svoboda DL, Fuscoe JC, Deng Y, Shi L, Paules RS, Auerbach SS, and Tong W (2014) The concordance between RNA-seq and microarray data depends on chemical treatment and transcript abundance. Nat. Biotechnol. 32, 926–932. [DOI] [PMC free article] [PubMed] [Google Scholar]
- (30).Langfelder P, and Horvath S (2017). WGCNA: an R package for weighted correlation network analysis. Accessed on: Jun 3 2017. Available at: https://labs.genetics.ucla.edu/horvath/CoexpressionNetwork/Rpackages/WGCNA/. [DOI] [PMC free article] [PubMed]
- (31).ATSDR. (2007) Toxicological Profile for Arsenic. CAS#: 7440–38-2, Agency for Toxic Substances and Disease Registry. pp i–500. [PubMed] [Google Scholar]
- (32).WHO. (2011) Guidelines for drinking water quality, fourth edition. Geneva, Switzerland: WHO Press. Accessed on: Jun 3 2017. Available at: http://www.who.int/water_sanitation_health/publications/dwq_chapters/en/. [Google Scholar]
- (33).EPA, U. S. (2001). Drinking Water Standard for Arsenic. EPA 815-F-00–015. Accessed on: Dec 28 2016. Available at: https://nepis.epa.gov/Exe/ZyPdf.cgi?Dockey=20001XXC.txt.
- (34).EPA, U. S. (2002). Arsenic, inorganic; CASRN 7440–38-2; Chemical Assessment Summary. Integrated Risk Information System (IRIS). Accessed on: Dec 28 2016. Available at: https://cfpub.epa.gov/ncea/iris/iris_documents/documents/subst/0278_summary.pdf.
- (35).EPA US (2010) DRAFT Toxicological Review of Inorganic Arsenic, Integrated Risk Information System (IRIS). EPA/635/R-10/001. Washington, DC. [Google Scholar]
- (36).Rahman A, Vahter M, Ekstrom EC, Rahman M, Golam Mustafa AH, Wahed MA, Yunus M, and Persson LA (2007) Association of arsenic exposure during pregnancy with fetal loss and infant death: a cohort study in Bangladesh. Am. J. Epidemiol. 165, 1389–1396. [DOI] [PubMed] [Google Scholar]
- (37).Rahman A, Vahter M, Smith AH, Nermell B, Yunus M, El Arifeen S, Persson LA, and Ekstrom EC (2009) Arsenic exposure during pregnancy and size at birth: a prospective cohort study in Bangladesh. Am. J. Epidemiol. 169, 304–312. [DOI] [PubMed] [Google Scholar]
- (38).Farzan SF, Korrick S, Li Z, Enelow R, Gandolfi AJ, Madan J, Nadeau K, and Karagas MR (2013) In utero arsenic exposure and infant infection in a United States cohort: a prospective study. Environ. Res. 126, 24–30. [DOI] [PMC free article] [PubMed] [Google Scholar]
- (39).Frost JM, and Moore GE (2010) The importance of imprinting in the human placenta. PLoS Genet. 6, e1001015. [DOI] [PMC free article] [PubMed] [Google Scholar]
- (40).Casimiro MC, Knollmann BC, Ebert SN, Vary JC Jr., Greene AE, Franz MR, Grinberg A, Huang SP, and Pfeifer K (2001) Targeted disruption of the Kcnq1 gene produces a mouse model of Jervell and Lange-Nielsen Syndrome. Proc. Natl. Acad. Sci. U S A 98, 2526–2531. [DOI] [PMC free article] [PubMed] [Google Scholar]
- (41).Bai B, Zhang Q, Liu X, Miao C, Shangguan S, Bao Y, Guo J, Wang L, Zhang T, and Li H (2014) Different epigenetic alterations are associated with abnormal IGF2/Igf2 upregulation in neural tube defects. PLoS One 9, e113308. [DOI] [PMC free article] [PubMed] [Google Scholar]
- (42).Kanber D, Buiting K, Zeschnigk M, Ludwig M, and Horsthemke B (2009) Low frequency of imprinting defects in ICSI children born small for gestational age. Eur. J. Hum. Genet. 17, 22–29. [DOI] [PMC free article] [PubMed] [Google Scholar]
- (43).Wise LD, Turner KJ, and Kerr JS (2007) Assessment of developmental toxicity of vorinostat, a histone deacetylase inhibitor, in Sprague-Dawley rats and Dutch Belted rabbits. Birth Defects Res. B. Dev. Reprod. Toxicol. 80, 57–68. [DOI] [PubMed] [Google Scholar]
Associated Data
This section collects any data citations, data availability statements, or supplementary materials included in this article.