

SUMMARY
The hypothalamus and prethalamus regulate diverse physiological and behavioral processes, yet the gene regulatory networks guiding their development remain poorly defined. Using single-cell RNA and ATAC sequencing, we profile over 660,000 cells in the developing mouse hypothalamus and prethalamus between embryonic day 11 and postnatal day 8. This resource maps key transcriptional and chromatin dynamics underlying regionalization, neurogenesis, and neuronal subtype differentiation. We identify distinct neurogenic progenitor populations and uncover gene regulatory networks controlling their spatial and temporal identity. Integration with genome-wide association study data reveals that transcription factors active in supramammillary and prethalamic lineages are associated with metabolic and neuropsychiatric traits. Cross-repressive interactions among regional transcription factors reinforce hypothalamic boundaries. Functional analysis of Dlx1/2 shows that their loss disrupts GABAergic neuron specification, leading to impaired thalamic inhibition and hyperactivity. This study provides a foundational atlas of hypothalamic and prethalamic development and highlights the importance of early gene regulatory programs in health and disease.
Graphical Abstract

In brief
Kim et al. map gene regulatory networks of the developing mouse hypothalamus and prethalamus using single-cell multiomics, identifying regulators of regionalization and neurogenesis. They further show that disruption of Dlx1/2 alters inhibitory circuit development, linking specification of regional identity with postnatal thalamic dysfunction and behavioral phenotypes relevant to neurodevelopmental disorders.
INTRODUCTION
In the embryonic forebrain, the anterior diencephalon gives rise to the hypothalamus and prethalamus, both essential for a range of neurophysiological functions.1–4 The hypothalamus, which contains hundreds of molecularly distinct neuronal subtypes,5 regulates a broad range of homeostatic physiological processes and innate behaviors, including circadian rhythms, the sleep/wake cycle, food intake, reproduction, and response to stress.6,7 In contrast, the prethalamus generates the zona incerta (ZI) and thalamic reticular nucleus (TRN), which almost entirely consist of GABAergic neurons.8,9 These neurons are key regulators of sensory gating,10–12 inhibiting targets in the cerebral cortex and sensory thalamus.1–4 The ZI also regulates behaviors traditionally ascribed to the hypothalamus, such as feeding, sleep, and novelty seeking, underscoring the developmental and functional links between these regions.13–16 Despite the central role of these structures in behavioral regulation, the mechanisms governing hypothalamic and prethalamic development, particularly the specification of their diverse cell types, remain poorly understood. Given the emerging role of the ZI and TRN in sensory and arousal-related behaviors, including those that are disrupted in neurodevelopmental disorders, understanding their development may have direct translational relevance.
Single-cell RNA sequencing (scRNA-seq) has been used to characterize the adult hypothalamus,17–20 and more recently has been used to characterize the developing hypothalamus and prethalamus in chick, mouse, and human models.21–26 These studies offer insight into the identity and differentiation trajectories of individual cell types, but the gene regulatory networks (GRNs) that guide regionalization, neurogenesis, and differentiation remain largely unresolved. A major obstacle here is our limited knowledge of how key developmental genes are regulated in hypothalamic and prethalamic formation. However, the combination of scRNA-seq with single-cell ATAC sequencing (scATAC-seq) now allows direct linkage of changes in gene expression with chromatin accessibility and regulatory activity during development.27,28 Coupled with spatial transcriptomics, these technologies allow detailed dissection of regulatory mechanisms controlling neural development.
Here, we present an integrated scRNA-seq and scATAC-seq analysis of the developing mouse hypothalamus and prethalamus, identifying key transcription factors (TFs) and GRNs that control regionalization, neurogenesis, and cell fate specification. We used this integrative approach to investigate the mechanisms of action of several TFs with broad and complex developmental expression patterns in both structures, including Lhx1, Isl1, Nkx2–2, and Dlx1/2. Disrupting these genes leads to a loss of prethalamic identity and ectopic induction of genes specific to the supramammillary hypothalamus. In postnatal animals, loss of Dlx1/2 in prethalamic and hypothalamic neuroepithelium results in defects in terminal differentiation of GABAergic neurons in the TRN and ZI, disrupting inhibition of excitatory thalamic neurons, and resulting in hyperactivity and sensory hypersensitivity in juvenile mice resembling those seen in autism spectrum disorders. These findings provide new insights into the regulatory architecture of the developing hypothalamus and highlight how disruptions in GRN function can alter neuronal circuitry and behavior.
RESULTS
Developmental dynamics of hypothalamic and prethalamic cell populations
To investigate the developmental trajectories and GRNs controlling hypothalamic and prethalamic patterning, neurogenesis, and cell fate specification, we generated integrated scRNA-seq and scATAC-seq datasets from the mouse hypothalamus and prethalamus at multiple developmental ages. In this study, we define the hypothalamus as the ventral diencephalic region encompassing the tuberal, mammillary, and paraventricular domains, and the prethalamus as the dorsal anterior diencephalic region that gives rise to the ZI and TRN. Samples were collected from embryonic day 11 (E11) to postnatal day 8 (P8). Samples analyzed during the “patterning and neurogenesis phase” (E11-E14) included whole hypothalamus and prethalamus, while later stages (E15-P8), excluding the preoptic area, were designated the “differentiation phase” (Figure 1A). We profiled 340,000 cells with scRNA-seq and 220,000 with scATAC-seq (Table S1).
Figure 1. Single-cell atlas of mouse hypothalamic and prethalamic development using scRNA-seq and scATAC-seq (additional data in Figures S1 and S2).

(A) Schematic overview of hypothalamic and prethalamic development from embryonic day 11 (E11) to postnatal day 8 (P8). The timeline is divided into two developmental windows: patterning and neurogenesis (E11-E14) and differentiation (E15-P8). scRNA-seq and scATAC-seq were performed across these stages to capture transcriptional and chromatin accessibility profiles for 340,000 and 220,000 cells, respectively.
(B) UMAP projection of cell populations during the patterning and neurogenesis phase. Left: scRNA-seq data showing clusters of neural progenitors and differentiating neuronal precursor cell types. Right: scATAC-seq UMAP, highlighting chromatin accessibility states that correspond with transcriptional profiles observed in scRNA-seq data.
(C) UMAP projection of cell populations during the differentiation phase. Left: scRNA-seq data showing the emergence of mature cell types, including astrocytes, tanycytes, oligodendrocytes, and specific neuronal subtypes. Right: scATAC-seq UMAP, highlighting chromatin accessibility states that correspond with cell type differentiation of hypothalamic neurons and glial cells.
(D) Pseudotime analysis to reconstruct differentiation trajectories from neural progenitor cells into distinct hypothalamic lineages at E11-E14. Heatmap showing smoothed expression of dynamically regulated genes, ordered by directionality of change along pseudotime.
During the E11–14 patterning and neurogenesis phase, both datasets revealed similar distributions of neural progenitor cells (NPCs) and immature neurons. G2/M-phase NPCs were distinguishable from G1/S-phase progenitors (Figure 1B; Tables S2). A subset of NPCs expressing glial markers (Slc1a3, Aldh1l1) likely represents fate-restricted gliogenic progenitors or quiescent radial glia. Ascl1-expressing neuronal progenitors (Neuronal Pro (Ascl1+)) give rise to neurons in the prethalamus, intrahypothalamic diagonal (ID), tuberal region, and premammillary hypothalamus (PMN) (Figure 1B). In contrast, Neurog2-expressing neuronal progenitors (Neuronal Pro (Neurog2+)), predominantly gave rise to neurons of the supramammillary nucleus (SMN), medial mammillary nucleus (MMN), and paraventricular nucleus of the hypothalamus (PVH)/supraoptic nucleus (SON) (Figures 1B and S1A), A subset of Neurog2-expressing tuberal progenitors was also observed (Figures 1B and S1A), corresponding to neurogenic progenitors in the ventromedial hypothalamus.29 These two differentiation streams parallel findings from early hypothalamic development in chicks, where prethalamic-like and floorplate-like hypothalamic progenitors respectively give rise to GABAergic/tuberal and mammillary/supramammillary/paraventricular hypothalamic neurons.23 Region-specific expression of TFs and motif accessibility marked spatially distinct domains at this stage (Figure S1A).
Some discrepancies between clusters identified by scRNA- and ATAC-seq were noted. A well-defined cluster that selectively expresses markers (Shh/Hes1) of the zona limitans intrathalamica, a transient structure separating the prethalamus from the sensory thalamus,30 was evident in scRNA-seq but not scATAC-seq. Conversely, region-specific subtypes of Neurog2+ progenitors were more distinguishable in scATAC-seq data, where region-specific neurogenic progenitor subtypes corresponding to SMN, MMN, and PVH were readily identified (Figure 1B).
During the E15-P8 differentiation phase, transcriptional and chromatin landscapes more closely reflected mature cell identities (Figure 1C). A small Neurog2-expressing progenitor population persisted; Ascl1-expressing progenitors were absent. Glial lineages and committed neurons, including GABAergic suprachiasmatic nucleus (SCN) and ZI neurons, were well resolved (Figure 1C; Tables S2). GABAergic neuronal populations derived from precursors in the ID and prethalamus, including those in the SCN and the ZI, were also observed (Figure 1C; Tables S2). In addition, we reconstructed developmental trajectories of E11-E14 using pseudotime analysis31 across distinct hypothalamic and diencephalic regions and identified branch-specific gene modules showing dynamic expression across pseudotime (Figure 1D; Table S2). Several modules displayed coherent monotonic trends, identifying coordinated transcriptional programs driving cell fate decisions (Figure 1D).
Reculstering scRNA-seq datasets at higher resolution revealed distinct neuronal subpopulations corresponding to major hypothalamic neuronal subtypes defined by neurotransmitter and neuropeptide profiles (Figure S1B). Subtypes selectively expressing Pomc and Agrp/Npy+ in ARC, Avp and Oxt in PVH/SON, and Hcrt and Pmch in LH were distinct at early stages (Figure S1B), suggesting earlier differentiation of these neurons compared with other hypothalamic cell types. Less well-characterized populations expressing Npw,32,33 Grp/Cck,34,35 and Npvf36 in the dorsomedial hypothalamus (DMH) were well resolved, as were distinct subpopulations of SMN neurons (Tac1, Calb2) and MMN neurons (Nts/Tac1/Cck, Npy/Cck, Cck) were observed (Figure S1B; Table S2). The ZI was defined by Slc30a3 expression, consistent with previously reported in situ hybridization data (Figure S1B).
Re-analysis of E11-E14 data with higher clustering resolution identified region-specific Ascl1- and Neurog2-positive progenitor subtypes marked by TFs such as Bsx in PVH/SON, Sp9 in prethalamus, and Sp8 in ID/AntID (Figures S2A–S2C). In situ hybridization data from the Allen Brain Atlas confirmed that Bsx expression co-localized with the putative SON at E13.5, distinguishing the developing PVH and SON (Figure S2B). Neuropeptides such as Cartpt and Ghrh are localized to specific neuronal populations in the developing prethalamus and PVH/SON (Figure S2C). Similarly, Pmch, Hcrt, Npvf, and Pnoc already displayed restricted expression patterns at this stage (Figure S2C), indicating early maturation of these neuronal subtypes. Npy and Sst were also highly expressed in subsets of prethalamic neurons at this age, while Gal and Prdm12 showed broad expression (Figure S2C).
GRNs driving hypothalamic and prethalamic progenitor differentiation
To identify GRNs controlling hypothalamic regionalization and neurogenesis, we applied SCENIC+ analysis,27 which integrates gene expression and chromatin accessibility to infer patterns of TF activity. Using scRNA-seq and scATAC-seq datasets from E11-E14 (Figures 2A and S3; Table S3), we reconstructed GRNs delineating hypothalamic regions and identified networks specific to mitotic neuronal progenitors and postmitotic neuronal precursors (Figures 2B, 2C, and S2A). We define neuronal progenitors as mitotic cells that give rise to neurons, and neuronal precursors as immature neurons that have exited the cell cycle but not yet fully differentiated.
Figure 2. GRNs controlling hypothalamic and prethalamic regionalization and temporal patterning (additional data in Figures S3 and S4).

(A) Top: schematic of SCENIC+ analysis applied to scRNA-seq and scATAC-seq data from hypothalamic cells collected between E11 and E14. This analysis identifies GRNs composed of transcription factors (TFs) that act as activators (blue arrows) or repressors (red arrows). Bottom: schematic illustration of the embryonic brain in the sagittal plane, with color-coded regions highlighting the major hypothalamic areas.
(B) GRNs of neuronal progenitors in major hypothalamic regions (Figure S2A), including the tuberal (Tub), mammillary (MMN), premammillary (PMN), and supramammillary (SMN). Key TFs regulating each region are shown, with arrows indicating activation (blue) or repression (red).
(C) GRNs of neuronal precursors in major hypothalamic regions (Figure S2A), including the Tub, MMN, PMN, SMN, prethalamic/intrahypothalamic diagonal (PreThal/ID), and paraventricular/supraoptic (PVH/SON) nuclei. Key TFs regulating each region are shown, with arrows indicating activation (blue) or repression (red).
(D) Heatmap illustrating differential expression of key TFs across early (E11-E12) and late (E13-E14) neural progenitor populations. Color intensity represents Z scores of gene expression, with red indicating high expression levels and blue indicating low expression levels.
Within each region-specific GRN, TFs exhibited extensive cross-activation, reinforcing their own expression and that of co-regulated TFs. These feedback loops stabilized cell identity and supported robust region-specific expression programs (Figures 2B and 2C; Table S3). In parallel, most TFs repressed those from GRNs associated with other hypothalamic regions. For instance, prethalamus/ID TFs inhibited TFs active in SMN and tuberal regions, and vice versa (Figure 2C).
These reciprocal inhibitory interactions sharply demarcated hypothalamic regions and ensured progenitor commitment to defined regional identities. Such regulatory relationships, which closely resemble those seen during earlier developmental stages in chick,23 likely preserve spatial and functional distinctions from early development through the end of neurogenesis at E14.
Interestingly, SMN and MMN progenitor networks exhibited frequent cross-activation during early development, a pattern that was absent in prethalamus/ID, tuberal, or PMN regions. In later neuronal precursors, we observed extensive cross-inhibition among SMN, MMN, and PVH/SON networks, implying a maturation-dependent tightening (Figure 2C). In contrast, tuberal and PMN networks showed minimal cross-inhibition. Instances of common TFs between GRNs controlling specification of non-contiguous regions, such as the PVH/SON and PMN, or the prethalamus/ID and MMN (Figure S3), suggest common regulatory elements influencing their development despite their spatial separation.
In all regions of the central nervous system (CNS), progenitors exhibit temporal patterning, where both the timing of neurogenesis and the competence to generate specific cell fates change dynamically over time.37,38 This analysis identified candidate regulators of temporal identity within hypothalamic progenitors. We identified TFs that showed differential activity between early (E11-E12) and late (E13-E14) progenitors, in both primary NPCs and neurogenic Neurog2- and Ascl1-expressing NPCs (Figure 2D; Table S3). TFs active in early-stage NPCs included Hmga1, Lin28a, Cited1, and Gbx2, while late-stage NPCs showed elevated activity of Tcf4, Npas3, Nfia/b/x, Zbtb20, and Tox3 (Figure 2D). Many of these TFs are implicated in temporal patterning across other CNS regions, such as the cerebral cortex, retina, and spinal cord.28,39–42
Most stage-specific TFs were selectively active only in particular progenitor classes. For example, early-stage primary NPCs showed higher activity of Zic4, Zic5, Fgf15, Rspo3, and Nr0b1, while Six6, Onecut3, and Rax were more prominently active in late-stage NPCs (Figure 2D). In neurogenic progenitors, Neurog2+ progenitors exhibited early-stage activation of SMN-specific factors such as Lmx1a, Foxa1/2, and Irx3/5, while early-stage Ascl1+ progenitors showed enrichment of activity of prethalamus-specific TFs, including Dlx1/2/6, Sp8/9, and Arx (Figure 2D).
We also observed significant temporal differences in the activity of Notch pathway genes. Hes1 was strongly enriched in early-stage NPCs and Neurog2+ progenitors, while Notch1 expression increased in late-stage progenitors (Figure 2D). Ascl1+ progenitors showed low and relatively stable Notch pathway activity. Similarly, NFI family TFs, which define late-stage temporal identity in the retina,28,39 were selectively active in late-stage NPCs and Neurog2+ progenitors, but absent in Ascl1+ progenitors at E14.
A widespread role for TFs controlling SMN development in susceptibility to metabolic and neuropsychiatric disease
To explore potential links between hypothalamic and prethalamic development and disease-related genetic traits, we integrated GRN analysis with genome-wide association study (GWAS) data from the EMBL-EBI database.43 This connected TF activity in NPC and precursor populations to genetic variants associated with complex traits and diseases, revealing how early transcriptional regulation may shape disease susceptibility (Figure S4).
We observed several associations. First, TFs broadly active in progenitor cell populations, such as NSC/NPC and Neurog2+ progenitors, were linked to neurological and metabolic traits, including kidney disease, headache, and diabetes. Second, TFs broadly active in postmitotic hypothalamic neural precursor cells were linked to Alzheimer’s disease and hypertension. Third, TFs selectively active in tuberal and PMN progenitors were associated with traits including response to antidepressants and Lewy body disease, implying neuropsychiatric relevance.44–46 Fourth, TFs that were broadly active across multiple SMN progenitor subtypes, but not in other hypothalamic neuronal precursor subtypes, were linked to metabolic traits such as body mass, fat distribution, and TSH levels, as well as to behavioral traits such as alcohol consumption, smoking, and depression. Notably, TFs uniquely active in SMN progenitors were also associated with bipolar disorder, schizophrenia, cognition, IQ, and smoking initiation, suggesting an underappreciated role for SMN in metabolic and psychiatric regulation.47,48 Finally, TFs linked to the development of prethalamic GABAergic neurons, including cells of the TRN and ZI,49–51 were significantly enriched for genetic variants associated with neurodevelopmental traits such as ASD, ADHD, and altered sensory processing, based on the SFARI gene list52 (Figure S4). TTFs defining early hypothalamic progenitor identity, particularly in the SMN and prethalamus, may influence later susceptibility to metabolic, cognitive, and neuropsychiatric disorders.53,54
GRNs controlling hypothalamic neurotransmitter and neuropeptide expression
Each hypothalamic region contains numerous molecularly and functionally distinct neuronal cell types, often defined by selective expression of neurotransmitters and neuropeptides.20,24,26 To investigate GRNs controlling these identities, we applied SCENIC+ analysis to scRNA-seq and scATAC-seq data from neurons collected between E15 and P8 (Figures 3A and S5; Table S3). This enabled identification of TFs regulating key markers of mature neuronal identity, providing insights into how TFs controlling hypothalamic regionalization influence neurotransmitter and neuropeptide expression.
Figure 3. GRNs controlling hypothalamic and prethalamic neurotransmitter and neuropeptide expression (additional data in Figure S5).

(A) Schematic of SCENIC+ analysis applied to the differentiation phase (E15-P8), using scRNA-seq and scATAC-seq data to construct GRNs. Transcription factors (TFs) act as activators (blue arrows) or repressors (red arrows) to regulate neuropeptide and neurotransmitter genes.
(B) GRN highlighting transcription factor interactions and neuropeptide/neurotransmitter-encoding genes across hypothalamic regions. Activating (blue) and repressing (red) interactions are shown between TFs (purple) and neuropeptide/neurotransmitter genes (yellow).
(C) Left: regional GRNs specific to the supramammillary nucleus (SMN) and mammillary nucleus (MMN), showing key TFs and neuropeptides/neurotransmitters. Right: validation images from the Allen Brain Atlas55 (right panels) display in situ hybridization images for Tac1, Cck, Pnoc, Npy, Nts, and Cartpt, highlighting their expression in SMN and MMN, as well as MERFISH data from the Allen Brain Atlas revealing distinct adult spatial localization of SMN and MMN lineage marker genes.
Many TFs involved in the early regionalization continue to regulate neurotransmitter-related genes in a feedforward manner. For example, prethalamic/ID TFs (Dlx1/2/5/6, Arx, Sp8, Meis2) directly activate genes involved in GABAergic neurotransmission, such as Slc32a1 (Figure 3B). However, these same GABAergic genes are directly repressed by TFs such as Barhl2 in Neurog2+ glutamatergic neurons. Conversely, glutamatergic markers such as the vesicular glutamate transporter Slc17a6 are activated by both Neurog2-specific TFs (Barhl1, Nhlh2, Nr4a2, Lmx1a, Neurod1) and tuberal progenitor-specific factors (Nkx2–1, Sox14). These glutamatergic genes are, in turn, repressed by prethalamic-specific TFs (Figure 3B). Not all activators of GABAergic genes are confined to prethalamic regions, however. TFs such as Hmx2/3 and Isl1, expressed across the tuberal, premammillary, and prethalamic regions (Figure 3B), also activate GABAergic gene expression.56,57
Neuropeptides and monoamines exhibit more complex patterns of regulation by TFs that specify regional identity. Several known regulatory relationships were validated by this analysis (Figure 3B). For instance, consistent with previous studies, Otp activates Sst expression, while Npy expression is activated by Isl1 and repressed by Dlx1/2.56,58 We also uncovered novel, region-specific antagonisms, especially between SMN and MMN.
In the SMN, Tac1 is selectively expressed in specific subpopulations of neurons but is absent in the MMN (Figure 3C). Cck was expressed by both SMN and MMN neurons. Other neuropeptides (Pnoc, Npy, Nts, Cartpt) were restricted to MMN neurons (Figure 3C). GRN analysis revealed that Tac1 is directly activated by SMN-specific TFs (Lmx1a/b, Foxa2, Barhl1/2, and Ebf2), and repressed by the MMN-specific factor Nkx2–4 (Figure 3C). In contrast, Cck is activated by TFs from both SMN and MMN, such as Nkx2–4 and Uncx. Conversely, MMN-specific neuropeptides (Pnoc, Npy, Nts, Cartpt) are activated by MMN-specific TFs (Lhx1/5, Uncx, and Nhlh2) but directly repressed by SMN-specific TFs, reinforcing reciprocal antagonism between these GRNs (Figure 3C). Non-overlapping expression patterns of these SMN and MM-specific TFs are already visible by E13.5 (Figure S6A).
Identification of dopaminergic neurons in the hypothalamus and their regulatory networks
Hypothalamic dopamine signaling regulates diverse physiological processes, including reward, feeding, reproductive behavior, and neuroendocrine regulation.59 To define the transcriptional programs underlying dopaminergic neuron differentiation, we analyzed Th-expressing clusters across the hypothalamus. These included populations in the prethalamus (likely A13 subtype in the ZI), PMN/tuberal regions, PVH/SON, and SMN, corresponding to presumptive A12, A15, and A11 subtypes of dopaminergic neurons, respectively.
GRN analysis revealed distinct TF modules driving Th expression in each neuronal subtype. A13 precursors expressed Dlx1/2/5/6, and Meis2, TFs also implicated in specifying prethalamic and GABAergic identity (Figure S6C). In A12 neurons, Th was activated both by PMN-enriched TFs (Hmx2/3) and PMN-enriched TFs, such as directly activating Th along with more broadly expressed TFs (Isl1, Pbx3, Mef2c) (Figure S6C). In contrast, MMN-enriched TFs Emx2 and Nkx2–4 directly repressed Th expression, suggesting that they restrict A11/A12 dopaminergic fate (Figure S6C).
Different Th-expressing clusters of neuropeptides, receptors, and TFs suggest further functional diversity (Figure S6D). For example, the GABAergic marker Arx60,61 and the estrogen receptor Esr162,63 were selectively expressed in presumptive A13 and A12 clusters, respectively. Neuropeptides such as Trh and Tac1 were selectively expressed in distinct Th-expressing clusters, underscoring the heterogeneity among hypothalamic dopaminergic populations (Figure S6D).
Genetic analysis reveals that the LIM homeodomain factors Lhx1 and Isl1 control regional identity in developing hypothalamus and prethalamus
GRN analysis identified pivotal roles for LIM homeodomain TFs that are expressed in complex, overlapping patterns during early hypothalamic development. One such TF is Lhx1, which is expressed in the prethalamus and ID, as well as the developing mammillary region, encompassing both Ascl1-expressing prethalamic and Neurog2-expressing mammillary progenitors.24,30 Isl1, another LIM-HD factor, is expressed in both neurogenic progenitors and postmitotic precursors across a contiguous domain extending ventrally from the prethalamus, through the ID, and into the tuberal and PMN regions, which does not correspond to any known anatomical domains.30 We selectively disrupted Lhx1 and Isl1 in early hypothalamic and prethalamic neuroepithelial cells from E9.5 onward using the Foxd1-Cre transgenic line.64 Homozygous mutants and controls at E12.5 were profiled using scRNA-seq, with scATAC-seq also performed for Isl1 mutants.
GRN analysis predicted that Lhx1 activated a subset of TFs specific to the prethalamus, ID, and MMN while repressing TFs specific to the PMN and SMN (Figure 4A). Lhx1 mutants showed modest loss of MMN markers and upregulation of PMN-enriched genes such as Lhx2 and Tcf7l2 (Figure 4B). These findings indicate that, while Lhx1 is essential for the full specification of MMN identity, its disruption does not eliminate MMN progenitors. Notably, Lhx1 mutant-specific cell populations were detected, which coexpressed both SMN/MMN markers and GABAergic genes such as Gad1, indicating mixed identity in the absence of Lhx1 (Figures 4C, 4D, and S7; Table S4).
Figure 4. Disruption of hypothalamic and prethalamic GRNs in Lhx1 and Isl1 mutant mice (additional data in Figures S7 and S8).

(A) GRNs regulated by Lhx1 (shown with in situ hybridization) in hypothalamic cells using SCENIC+ analysis.
(B) Heatmap showing transcriptional changes in Lhx1 mutant at E12, with color intensity indicating differential gene expression levels.
(C) UMAP plots comparing control and Lhx1 mutant hypothalamus. Brighter colors represent higher cell density. Numerical values summarize cell frequencies reported in Table S4.
(D) Expression of Ebf2 and Gad1 in control versus Lhx1 mutant hypothalamus.
(E) GRNs regulated by Isl1 (shown with in situ hybridization) in hypothalamic cells using SCENIC+ analysis.
(F) Heatmap showing transcriptional changes across multiple hypothalamic progenitor populations in Isl1 mutant, with color intensity indicating differential gene expression levels.
(G) UMAP plots comparing cell populations in control and Isl1 mutant hypothalamus. Brighter colors represent higher cell density. Numerical values summarize cell frequencies reported in Table S4.
(H) Expression of Tbr1 and Slc17a6 in control versus Isl1 mutant hypothalamus.
Isl1 was predicted to activate TFs in the prethalamus, ID, PMN, and tuberal regions, while repressing those in the SMN, MMN, and EmThal (Figures 4E, 4F, and S8; Table S4). In Isl1 mutants, prethalamus and PMN cell populations were significantly reduced (Figure 4G; Table S4). A mutant-specific cluster emerged, co-expressing EmThal-like markers (Tbr1, Slc17a6) and SMN/MMN genes (Figures 4H and S8A), consistent with Isl1’s role in maintaining prethalamic and PMN identity while repressing alternate regional fates.
Isl1 was predicted to activate TFs in the prethalamus, ID, PMN, and tuberal regions, while repressing those in the SMN, MMN, and thalamic eminence (EmThal) (Figures 4E, 4F, and S8; Table S4). The EmThal, which is located in the anterior prethalamus, predominantly gives rise to excitatory neurons.65,66 In Isl1 mutants, prethalamus and PMN cell populations were significantly reduced (Figure 4G; Table S4). A mutant-specific cluster also emerged, co-expressing both EmThal-like (Tbr1, Slc17a6)67 along with SMN and MMN markers (Figures 4H and S8A).
Nkx2.2 promotes prethalamic specification and represses SMN and MMN identity
Previous studies in chick hypothalamus revealed that inhibitory signaling between prethalamic and floorplate-like neuroepithelial cells initiates hypothalamic regionalization.23 Prethalamic-like cells subsequently generate Ascl1-expressing prethalamic and tuberal progenitors, while floorplate-like cells give rise to Neurog2-expressing SMN and MMN progenitors.23,24 GRN analysis suggests that these relationships are conserved in mammals, and that TFs promoting prethalamic and tuberal specification repress SMN/MMN differentiation and vice versa.
Building on our analysis of Isl1 and Lhx1 mutants, we investigated Nkx2–2, a Shh-responsive TF68 that is expressed in dorsal tuberal, ventral prethalamus, and ID, which demarcates alarbasal hypothalamic boundaries.30 GRN analysis of Nkx2–2 mutants at E12.5 predicted that Nkx2–2 directly activates TFs specific to the tuberal hypothalamus and prethalamus/ID while repressing SMN-specific TFs (Figure 5A). This implies that Nkx2–2 maintains regional boundaries by promoting prethalamic and tuberal fates while repressing caudal hypothalamic regions, such as the SMN. scRNA-seq of homozygous Nkx2–2 mutants at E12.5 shows reduced numbers of prethalamus/ID and increased numbers of SMN cells (Figure 5B; Table S5). A mutant-specific cell cluster was observed that co-expressed markers from both the prethalamus and SMN/MMN regions (Figures 5C, 5D, and S9; Table S5). Fluorescent in situ hybridization confirmed the presence of these mixed-identity cells in the posterior prethalamic region, which co-expressed the prethalamic markers Sp9 with Pitx2 (Figure 5E and 5F) and Meis2 with Irx5 (Figure 5F). These results indicate Nkx2–2 maintains regional boundaries by repressing SMN/MMN identity within prethalamic/ID progenitors (Figure 5G).
Figure 5. Disruption of Nkx2.2 leads to the generation of cells with mixed prethalamic and SMN identity (additional data in Figure S9).

(A) GRNs showing Nkx2.2 (shown with in situ hybridization) as a repressor of supramammillary nucleus (SMN)-promoting transcription factors and an activator of prethalamic (PreThal) identity.
(B) UMAP projections of control and Nkx2.2 mutant hypothalamus at E12, showing a reduction in prethalamus populations and the expansion of SMN-like cells in the mutant. Brighter colors represent higher cell density.
(C) Feature plots of key PreThal genes (Dlx1, Sp8, Meis2) in control and Nkx2.2 mutant hypothalamus, showing reduced expression in mutant animals.
(D) Feature plots of SMN-specific genes (Foxb1, Pitx2, Irx5) in control and Nkx2.2 mutant hypothalamus, showing ectopic expression in the prethalamic region of mutant animals.
(E) In situ hybridization in Nkx2.2 mutant hypothalamus showing overlapping expression of Sp8 and Pitx2 in the prethalamic region, whereas Sp8 is typically restricted to the prethalamus and Pitx2 to the SMN in controls. Scale bar, 400 μm.
(F) In situ hybridization in Nkx2.2 mutant hypothalamus showing co-expression of Irx5 (SMN marker) and Meis2 (prethalamus marker) in the prethalamus of Nkx2.2-mutant hypothalamus, validating the mixing of neuronal identities.
(G) Schematic summarizing the disruption of prethalamic identity and the resulting generation of cells with mixed prethalamic and SMN identity in Nkx2.2 mutants.
Dlx1/2 promote prethalamic identity and GABAergic differentiation while repressing SMN identity
Finally, we extended our analysis to Dlx1/2, key regulators of telencephalic GABAergic neuronal differentiation.69,70 GRN analysis indicates that, in the hypothalamus, Dlx1/2 activate both Ascl1 and multiple specifying prethalamus, ID, and PMN identities, while repressing Neurog2 and genes driving SMN, MMN, and some tuberal cell types (Figure 6A). GRN analysis predicts Dlx1/2 to be central regulators of hypothalamic and prethalamic regionalization and regulators of the balance of GABAergic and glutamatergic neuronal subtypes (Figure 3B). To test this, we generated conditional mutants for Dlx1/2 using the Foxd1-Cre transgenic line and performed scRNA-seq and scATAC-seq analyses to assess changes in transcriptional and chromatin landscapes (Figures 6B and S10; Table S5).
Figure 6. Disruption of Dlx1/2 leads to loss of prethalamic identity and expansion of SMN markers (additional data in Figures S10 and S11).
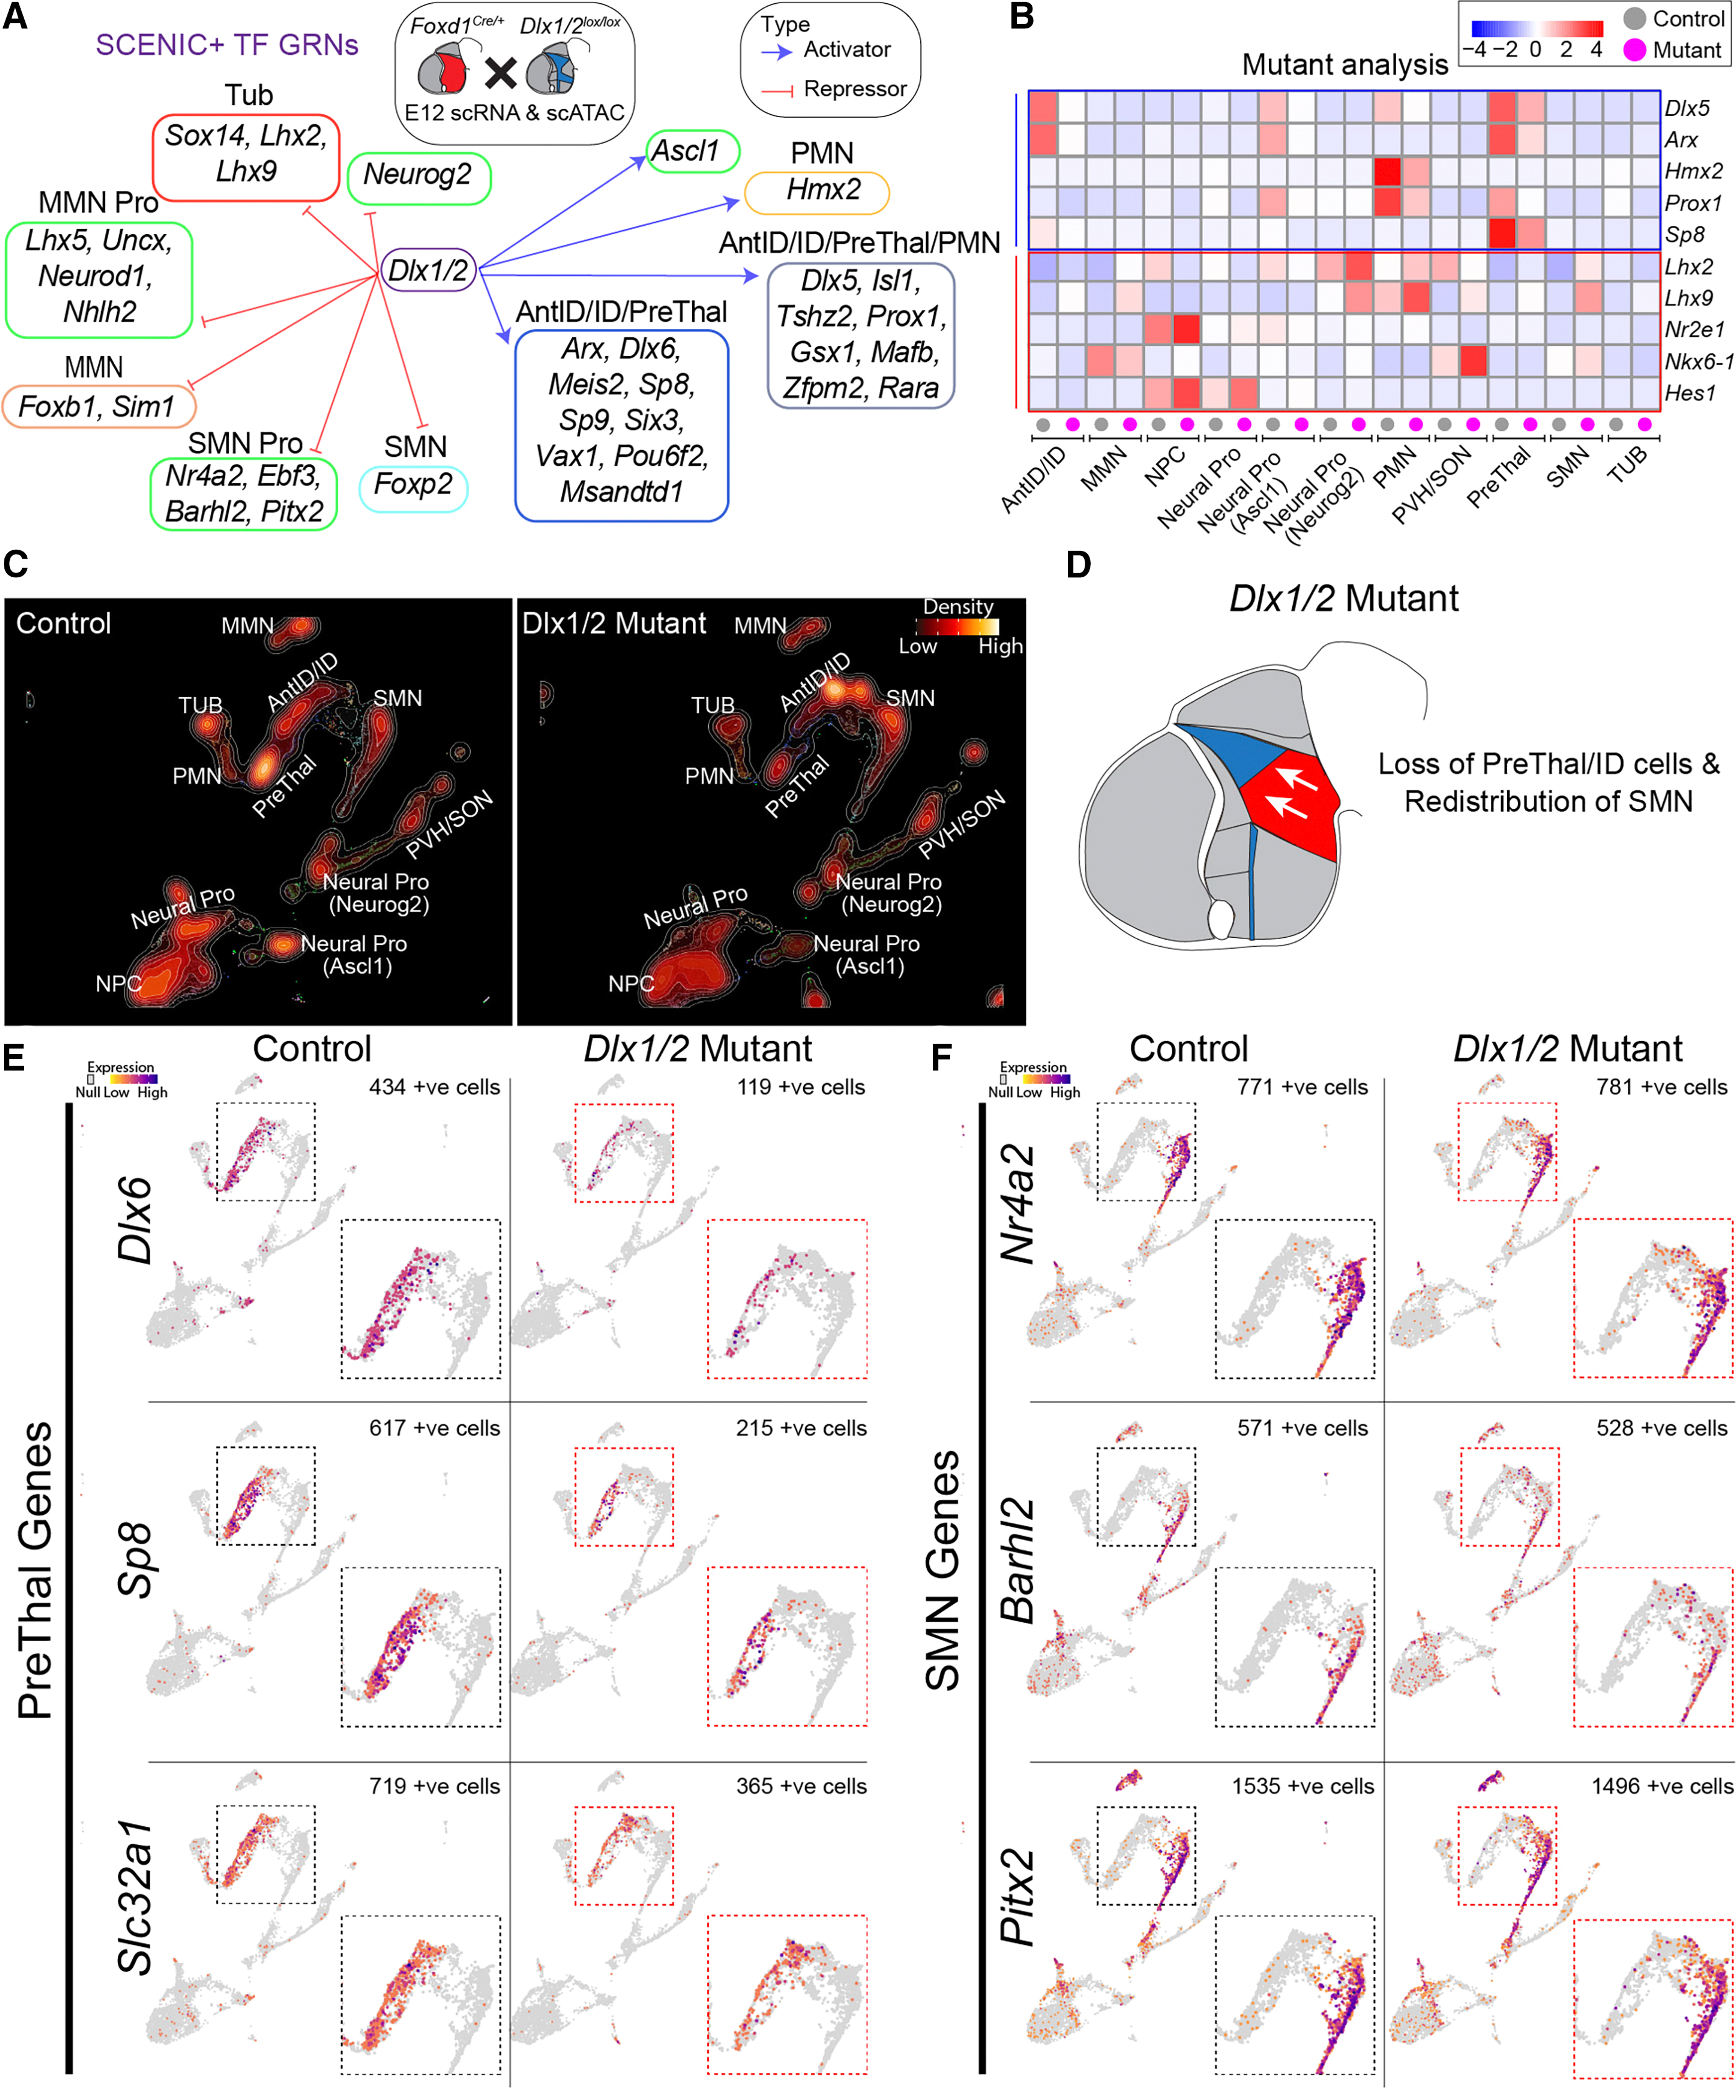
(A) GRNs showing Dlx1/2 as activators of prethalamic (PreThal) transcription factors and repressors of SMN markers.
(B) Heatmap showing transcriptional changes in Dlx1/2 mutants compared with controls at E12, with color intensity indicating differential gene expression.
(C) UMAP projections comparing control and Dlx1/2 mutant hypothalamus, displaying reduced prethalamus and intrahypothalamic diagonal (ID) populations in Dlx1/2 mutants, along with an expansion of SMN neurons. Brighter colors represent higher cell density.
(D) Schematic summarizing the loss of prethalamus and ID identity and the redistribution of SMN-like cells in Dlx1/2 mutants.
(E) Feature plots of key prethalamic genes (Dlx6, Sp8, Slc32a1) in control and Dlx1/2 mutants, showing downregulation of these genes in mutants.
(F) Feature plots of SMN-specific genes (Nr4a2, Barhl2, Pitx2) in control and Dlx1/2 mutants, showing ectopic upregulation of these genes in the mutant prethalamus and ID.
Dlx1/2 mutants exhibited a marked reduction in Ascl1-expressing NPCs and loss of prethalamus/ID and PMN neural precursors (Figures 6B–6D; Table S5). GABAergic markers such as Slc32a1 were also downregulated (Figure 6E). Conversely, SMN-like cells expanded, with ectopic expression of Nr4a2 and Barhl2 in regions typically producing prethalamic neurons (Figure 6F). Histological analysis of Dlx1/2 mutants at E13.5 confirmed reduced prethalamic/ID expression of Dlx2, Dlx5, Isl1, Arx, Hmx2, Pax6, Meis2, Sp8, Sp9, and Gad2 along with a dorsal expansion of the SMN markers Foxa1 and Pitx2 (Figure S11). These results imply that in the absence of Dlx1/2, prethalamic/ID progenitors express SMN-specific markers.
To assess the postnatal consequences of Dlx1/2 disruption, we profiled P8 hypothalamus and ZI/TRN using scRNA-seq (Figure S12A). Persistent changes in the prethalamic marker expression that resembled those seen at E12.5 were observed (Table S6). We also noted a substantial reduction in multiple GABAergic hypothalamic neuronal subtypes, such as Agrp- and Ghrh-expressing neurons in the ARC, consistent with previous reports.58 We also observed reduced numbers of Sst-, Th-, and Pnoc-expressing hypothalamic neurons, as predicted by earlier developmental studies (Figure 3B; Table S6). Interestingly, we also observed a dramatic downregulation of Npw (Figure S12B), which is transiently expressed during development33 and co-expressed with Th in the postnatal DMH (Figure S6D).
Despite the severity of the early developmental phenotype (Figure 6), Foxd1-Cre;Dlx1/2lox/lox mice (Dlx1/2 mutants) are viable and born at expected Mendelian ratios, but display significant reductions in body weight and body length (Figure S12C; Table S6), consistent with previous findings in tuberal hypothalamus-specific Dlx1/2 mutants.58 These growth deficits likely relate to disruptions in Ghrh-expressing neurons and an altered balance of Agrp-expressing neurons in the ARC.58 Dlx1/2 mutants showed poor growth on a standard chow diet, with nearly all individuals dying within the first post-weaning week (Figure S12D; Table S6). However, survival significantly improved with gel-based food (Figure S12D; Table S6). The mechanism underlying the failure to thrive on standard chow remains unclear.
Given the substantial embryonic loss of prethalamic neurons, we specifically focused on the TRN and ZI in P21 Dlx1/2 mutants, profiling changes in gene expression using both snRNA-seq and Xenium spatial transcriptomics (Figures 7A, S13A, and S13B; Table S7). Both methods revealed fewer Pvalb/Meis2- and Sst/Penk-expressing neurons (Figures 7B and S13C; Tables S7 and S8). Sst/Penk-positive cells aberrantly expressed the adipogenesis factor Arxes171 (Table S7). Excitatory thalamic neurons, which are not derived from Foxd1-expressing diencephalic cells,72 showed increased Galanin expression (Figures S12E, S12F, S13B, and S13D). Additionally, glutamatergic neuronal markers Slc17a6 and Slc17a7 were elevated, particularly in the ZI (Figure 7B). A >3-fold increase in non-neuronal cells—primarily GFAP+ astrocytes—was observed in TRN and ZI, with no change in oligodendrocytes or microglia (Figures S13E and S13F).
Figure 7. Dlx1/2 mediate transcriptional regulation of postnatal development and function of the thalamic reticular nucleus (TRN) and zona incerta (ZI) (additional data in Figures S12–S14).

(A) Reduced neuronal density in the TRN of Dlx1/2 mutants. Left: immunostaining for DAPI, HuC/D, and NeuN (neuronal marker), in the anterior and posterior portion of the TRN and ZI. Dashed lines demarcate the boundaries of the TRN and ZI. Scale bar, 250 μm. Right: quantification of HuC/D+ and NeuN+ neurons per mm2 in the TRN. *p < 0.05, unpaired t tests.
(B) Spatial transcriptomics reveal disrupted gene expression in TRN and ZI: high-resolution Xenium spatial transcriptomics of controls and Dlx1/2 mutants from anterior through posterior TRN regions. Differential expression is observed for markers such as Meis2, Pvalb, Gad1, Gad2, Sst, Penk, Slc17a6, and Slc17a7. Additional markers Spp1 and Pnoc highlight changes in cellular composition across regions.
(C) Miniature inhibitory postsynaptic current (mIPSC) recordings from the medial geniculate nucleus (MGN), ventral posteromedial nucleus (VPM), and lateral geniculate nucleus (LGN) of control and Dlx1/2 mutant mice. Left: schematic of recording site and representative mIPSC traces from control and mutant. Right: quantification of mIPSC parameters: average frequency, average amplitude, and average decay time across three brain regions (top row) or pooled analysis (bottom row) from control (blue) and mutant (red). Data are presented as mean ± SEM, with individual data points shown. *p < 0.05, **p < 0.01.
Consistent with predictions from GRN analysis (Figure S13A), Sst/Penk-expressing cells upregulated the adipogenesis-promoting factor Arxes171 (Table S7). Excitatory thalamic neurons, which are not derived from Foxd1-expressing diencephalic cells,72 showed increased Galanin expression (Figures S12E, S12F, S13B, and S13D). Additionally, glutamatergic neuronal markers Slc17a6 and Slc17a7 were elevated, particularly in the ZI (Figure 7B). Finally, a more than 3-fold increase in non-neuronal cells—primarily Gfap-positive astrocytes—was observed in the ZI and TRN (Figures S13E and S13F). Together, these data show that Dlx1/2 are essential for GABAergic specification in the ZI and TRN. Their loss disrupts inhibitory neuron development in regions linked to thalamocortical inhibition and implicated in ASD and sensory hypersensitivity,10–12 potentially contributing to neurodevelopmental phenotypes.
Loss of Dlx1/2 in the hypothalamus leads to hyperactivity, sensory deficits, and impaired inhibitory inputs in the thalamus
To investigate the consequences of Dlx1/2 loss of function, we evaluated the behavioral phenotypes of gel-fed Foxd1-Cre; Dlx1/2lox/lox mutant mice versus Foxd1-Cre;Dlx1/2lox/+ controls. Mutants exhibited significant hyperactivity, as measured by DeepLabCut73 (Figure S14A; Table S9) and spent less time at the open-field periphery, indicating reduced anxiety-like behavior (Figure S14B; Table S10). Sensory tests revealed heightened cold sensitivity, with reduced response latency on the cold plate, but no difference in hot plate responses (Figure S14C; Table S10). Rotorod performance was comparable between groups, suggesting intact motor coordination and learning (Figure S14D; Table S10).
These behavioral findings raised the hypothesis that Dlx1/2 loss may impair ZI/TRN-mediated inhibitory circuits, resulting in impaired postsynaptic inhibition in the thalamus. To test this, we conducted whole-cell patch-clamp recordings in slice preparations from the medial geniculate, ventral posteromedial, and lateral geniculate nuclei (LGN) (Figures 7C and S13G; Tables S11). Excitatory synaptic activity (mEPSCs) was unchanged in frequency, amplitude, and decay (Figure S13G), but inhibitory synaptic activity (miniature inhibitory postsynaptic currents) was significantly reduced in frequency, particularly in the LGN, with slightly increased decay time (Figure 7C). These deficits align with transcriptomic evidence of inhibitory neuron loss, particularly of parvalbumin-positive TRN neurons, and suggest that impaired inhibitory circuitry contributes to hyperactivity and sensory dysfunction in Dlx1/2 mutants.
DISCUSSION
This study integrates scRNA-seq and scATAC-seq to map GRNs that govern mouse hypothalamic and prethalamic development. Our approach goes beyond previous scRNA-seq analysis24,26 by providing a higher-resolution atlas and revealing mechanisms that control neuronal subtype specification through the interplay of transcriptional and chromatin states. Profiling across developmental stages enabled the identification of dynamic transcriptional states and active regulatory elements. Chromatin accessibility data further delineated the regulatory logic underlying regional patterning and cell fate.
While our analysis primarily focused on spatially defined progenitor populations, our findings suggest that Ascl1- and Neurog2-expressing neurogenic progenitors are fate-restricted secondary progenitors, analogous to intermediate progenitor cells in other CNS regions. In contrast, Slc1a3- and Hes1-positive radial glia likely represent multipotent primary progenitors.74,75 These distinctions provide further insight into the lineage relationships and differentiation hierarchies that guide hypothalamic development. Our results support and expand the cascade diversification model proposed by Zhang et al.,76 in which radial glia produce distinct Ascl1+ and Neurog2+ progenitors that sequentially generate hypothalamic subtypes. In our dataset, Ascl1- and Neurog2-expressing neurogenic progenitors also exhibit distinct spatial distributions and lineage trajectories, with Neurog2-expressing progenitors contributing to PvN/SMN/MMN neurons and Ascl1-expressing progenitors contributing to GABAergic neurons in both the prethalamus and ID, as well as the majority of neurons in the tuberal and premammillary regions. This supports the idea that these populations represent fate-restricted secondary progenitors, aligning with a stepwise lineage restriction model.
Many TFs identified in this study appear to exhibit dual roles, acting first to broadly pattern the hypothalamus and later to refine specific neuronal identities (Figure 3). This temporal shift in function is often accompanied by a spatial restriction of the expression domain, with TFs initially expressed in multiple progenitor zones becoming restricted to more selective postmitotic populations. These transitions likely reflect changes in regulatory context and co-factor availability, highlighting the importance of developmental timing in shaping cell fate decisions. Future studies may clarify how these dynamic shifts in expression and function contribute to neuronal subtype specification.
In addition to increasing the resolution of progenitor cell populations, we identified cross-repressive interactions among different classes of hypothalamic and prethalamic progenitors. TFs that promote prethalamic and tuberal identity repress those that promote floorplate-like supramammillary/mammillary identity, and vice versa, reinforcing regional boundaries. Loss-of-function mutants of Isl1, Nkx2–2, and Dlx1/2 validated these predictions, showing loss of prethalamic identity and ectopic SMN/MMN marker expression. These findings extend prior chick studies of early hypothalamic development23 into later stages of mammalian hypothalamic development and emphasize conserved mechanisms of forebrain regionalization. The unexpected finding that genetic variants in TFs that promote supramammillary identity are associated with a broad range of metabolic and behavioral traits highlights the importance of this relatively understudied hypothalamic region.
Our findings demonstrate that TFs that delineate regional identities and boundaries are not only structural but actively contribute to neuronal specification by regulating neuropeptide and neurotransmitter expression, therefore acting as “terminal selector genes.”77,78 Dlx1/2 were essential for GABAergic and dopaminergic differentiation and directly activated Slc32a1 and Th. Importantly, many of these neuronal subtypes are specified before birth, suggesting that early gene regulatory programs have long-lasting effects on hypothalamic and prethalamic function. These early gene regulatory programs also provide a bridge between GWAS findings on neurodevelopmental disorders and both prethalamic and hypothalamic differentiation. The enrichment of multiple GWAS-implicated genes in NPCs of both the prethalamus and hypothalamus suggests that early disruptions in GRNs may underlie the pathology of neurodevelopmental disorders. For instance, genes linked to ASD, such as Dlx1/2 and Arx, are critical for GABAergic neuron differentiation in the ZI and TRN.49–51
Analysis of the postnatal phenotypes of conditional Dlx1/2 mutants highlights the importance of these factors in specifying GABAergic neurons in the ZI and TRN. Loss of Dlx1/2 results in loss of GABAergic neurons and a corresponding reduction in postsynaptic inhibition in dorsal thalamic neurons. This is accompanied by an increase in GFAP+ astrocytes in the ZI/TRN, likely reflecting a compensatory gliogenic response triggered by disrupted neurogenesis in these regions. This is associated with both hyperactivity and enhanced cold sensitivity in mutant mice, suggesting that the disrupted development of inhibitory neurons in ZI/TRN may contribute to hyperactivity observed in ASD or ADHD.79,80 Sensory hypersensitivity in ASD has been linked to impaired inhibitory mechanisms in thalamic circuits.81 ASD-related hyperactivity may also arise from thalamic dysfunction, resulting from an imbalance of excitatory-inhibitory regulation that disrupts normal motor and cognitive control.79,82,83 The reduced GABAergic inhibition in Dlx1/2 mutants parallels findings in other ASD models, where alterations in inhibitory signaling lead to increased thalamic and cortical excitability.
Arx, another ASD-related TF,84–86 which we identify as a direct target of Dlx1/2, also plays an essential role in prethalamic development.87,88 This confirms that multiple TFs act in combination to regulate the excitatory-inhibitory balance in the ZI and TRN, which in turn regulate thalamic function. Dysregulation of these networks likely contributes to neurodevelopmental disorders by impairing GABAergic neuron differentiation and disrupting thalamic excitatory-inhibitory homeostasis. This study highlights the potential relevance of defects in prethalamic patterning and neurogenesis to common neuropsychiatric disorders.
The observed behavioral phenotypes, including hyperactivity and sensory hypersensitivity, are consistent with disrupted thalamic inhibitory processing, likely resulting from the loss of GABAergic neurons in the ZI/TRN and reduced postsynaptic inhibition in thalamic relay neurons. Importantly, this functional disruption aligns with our findings that TFs expressed in SMN and prethalamic progenitors are enriched for GWAS variants associated with neuropsychiatric and behavioral traits such as ADHD, depression, and sensory processing disorders (Figure S5). These data collectively support a model in which altered GRNs during development perturb inhibitory circuit formation and alter long-term behavior.
Consistent with our findings, a recent study demonstrates that hyperexcitability of the TRN contributes directly to core ASD-related phenotypes, including hyperactivity, seizures, and social deficits through altered thalamocortical inhibition.89 Cntnap2 mutant mice also displayed enhanced TRN excitability and network oscillations, which could be rescued by suppressing TRN activity. Together with our results, this highlights a convergent mechanism by which impaired specification or function of prethalamic GABAergic neurons, including those of the TRN and ZI, can disrupt thalamocortical inhibitory balance and contribute to ASD-related behaviors. These data underscore the developmental origins of circuit-level abnormalities in neurodevelopmental disorders and point to the TRN and ZI as critical hubs of selective vulnerability.
Limitations of the study
Although GRN analysis revealed robust regulatory relationships, several limitations should be noted. First, single-cell data, although powerful, may not fully capture gene interactions without experimental validation of knockout or knockdown approaches. Second, while this analysis ranked genes within GRNs, lower-ranked genes may still have functional contributions that were not fully explored. Third, repressive interactions were generally not as well defined as their activating counterparts. Employing single-cell CUT&TAG to identify targets of repressive factors may ultimately be essential for uncovering additional layers of regulatory complexity during hypothalamic development. Finally, we note that chromatin accessibility and TF co-expression do not necessarily imply direct regulatory relationships, and GRN predictions should be interpreted as putative until functionally validated.
RESOURCE AVAILABILITY
Lead contact
Further information and requests for resources and reagents should be directed to and will be fulfilled by the lead contact, Seth Blackshaw (sblack@jhmi.edu).
Materials availability
All unique/stable reagents generated in this study are available from the lead contact upon request.
Data and code availability
Data: all raw sequencing data, including scRNA-seq and scATAC-seq datasets, have been deposited in the NCBI Gene Expression Omnibus (GEO) under accession number GSE284492.
Code: this paper does not report original code. Complete analysis code and workflows are available at https://github.com/dkim195/HyDD2.
Other: processed Seurat objects and annotated datasets are hosted on Zenodo (https://doi.org/10.5281/zenodo.14292830).
STAR★METHODS
Detailed methods are provided in the online version of this paper and include the following:
EXPERIMENTAL MODEL AND STUDY PARTICIPANT DETAILS
Time-mated wild-type (WT) CD1 mice were obtained from Charles River Laboratories. Transgenic mouse lines were maintained on a mixed C67BL/6 and CD1 background. The following transgenic mouse lines were used in the study.
Foxd1-Cre (B6; 129S4-Foxd1tm1(GFP/cre)Amc/J, JAX#01246391),
Isl1lox/lox (gift from Dr. Lin Gan90),
Lhx1lox/lox (gift from Dr. Richard R Behringer92),
Nkx2.2-Cre (B6.129S6(Cg)-Nkx2–2tm4.1(cre/EGFP)Suss/J, JAX#02688093),
Dlx1/2lox/lox (gift from Dr. Jay Lee58).
Animals were housed in a temperature-controlled facility with a 14-h dark/10-h light cycle and had ad libitum access to food and water. All animal procedures followed the National Institutes of Health Guide for the Care and Use of Laboratory Animals and were approved by the Johns Hopkins University Animal Care and Use Committee.
METHOD DETAILS
Tissue collection and dissections
Dissection of wildtype mice:
Tissues were collected from wildtype mice representing a random but equal mix of males and females across postnatal ages. For each embryonic stage analyzed, 10–30 embryos were harvested from 3 to 4 pregnant dams, depending on the gestational age. Brain dissections followed previously established protocols.24 Meninges were removed, and dissections were completed in cold HBSS (#14170112, ThermoFisher Scientific) within 30 min for each age group.
Dissection of mutant mice:
Embryos from mutant mice were collected from a minimum of five pregnant dams. Hypothalamic and prethalamic regions were dissected, and the remaining tissues of embryos were used for rapid genotyping (#4359187, ThermoFisher Scientific), and grouped by genotype for further analysis. Dissected hypothalamic and prethalamic tissues were stored in HABG buffer (Hibernate-E (#A1247601, Thermo Fisher Scientific) for embryos or Hibernate-A (#A1247501, Thermo Fisher Scientific) for postnatal stages, both supplemented with 2% B-27 Supplement (#17504044, ThermoFisher Scientific), and 0.5 mM GlutaMAX Supplement (#35050061, ThermoFisher Scientific) until cell dissociation.
Preparations of cells and nuclei
Cell dissociation for scRNA-Seq:
To prepare samples for scRNA-Seq, tissues were dissociated in Hibernate medium (Hibernate-E Minus Calcium (#HECA500, BrainBits) for embryos or Hibernate-A Minus Calcium (#HACA500, BrainBits) for postnatal stages), supplemented with 2 mg/mL papain (#LS003119, Worthington Biochemical) and 0.5 mM Glutamax. The enzyme mixture was pre-incubated for 15 min, then added to tissues for 5–30 min with 0.1 U/μl RNase inhibitor (N2615, Promega). Toward the end of digestion, 100 μg/mL final DNase I (#4716728001, Sigma-Aldrich) was added. Cells were subsequently centrifuged, resuspended in HABG buffer, filtered through a 40 μm cell strainer (BAH136800040-50EA, Sigma-Aldrich), and resuspended in HABG buffer containing RNase inhibitor (0.5 U/μl). Cell viability and counts were assessed with Trypan Blue staining (#15250061, Thermo Fisher Scientific) and a hemocytometer.
Nuclei preparation for scATAC-Seq:
Nuclei for scATAC-Seq were extracted following post-cell dissociation and purified following a 10x Genomics protocol. Nuclei count and yield were verified with Trypan Blue staining and a hemocytometer.
Nuclei preparation for snRNA-Seq:
For snRNA-Seq, adult mouse brains were rapidly dissected, and 100 μm coronal sections were prepared using a mouse brain matrix. Regions spanning the ZI, TRN, and thalamus were microdissected under a dissection microscope. Nuclei were extracted following a 10x Genomics protocol.
Sequencing library preparation and data processing
Sc/snRNA-Seq:
Libraries for scRNA-Seq and snRNA-Seq were prepared using the 10x Genomics Chromium. Single Cell 3′ v3.0 and v3.1 platforms (Table S1), following the manufacturer’s protocols. Sequencing was conducted on an Illumina NovaSeq 6000, targeting a depth of 500 million reads per sample. Raw data were processed with the 10x Genomics Cell Ranger Software (v5) and aligned to the mm10 mouse genome reference (refdata-gex-mm10-2020-A).
scATAC-Seq:
scATAC-Seq libraries were prepared using the 10x Genomics Chromium Single Cell ATAC v1.1 platform (Table S1), with one-hour tagmentation and 9–10 cycles of PCR. Libraries were sequenced on Illumina NovaSeq 6000, at a target depth of 600 million reads per sample. Raw data were processed with Cell Ranger ATAC (v2) and aligned to the mm10 mouse genome reference (refdata-cellranger-arc-mm10-2020-A-2.0.0).
In situ hybridization
DIG in situ hybridization:
DIG-labeled probes were used for Dlx2, Lhx1, Isl1, Nkx2–2, Arx, Foxb1, Dlx5, Foxa1, Gad1, and Hmx2 mRNA detection, with colorimetric detection using NBT/BCIP substrates, using standard experimental protocols.24,30
Single-molecule fluorescent in situ (smfISH) hybridization:
Mouse embryos were immersion-fixed, and adult mouse brains were perfusion-fixed with 4% paraformaldehyde (PFA). Adult mouse brains were post-fixed in PFA for an additional 24 h at 4°C. After fixation, tissues were cryoprotected in 30% sucrose solution and embedded in an Optimal Cutting Temperature (OCT) compound. Brains were sectioned coronally at a thickness of 20 μm using a cryostat and mounted onto Superfrost Plus glass slides (#12-550-15, ThermoFisher Scientific). The tissue sections were stored at −80°C until further processing.
RNAscope (Advanced Cell Diagnostics, ACD) was used for smfISH, with the RNAscope V2 Assay standard protocol as provided by the manufacturer. The following target-specific RNAscope probes were used: Sp8 (Mm-Sp8-C3, #547521-C3), Sp9 (Mm-Sp9-C1, #564531), Pitx2 (Mm-Pitx2-C2, #412841-C2), Irx5 (Mm-Irx5-C1, #513871), Meis2 (Mm-Meis2-C2, #512841-C2), Npw (Mm-Npw-C1, #495671), Pnoc (Mm-Pnoc-C2, #437881-C2), Slc32a1 (Mm-Slc32a1-C2, #319191-C2), Slc17a6 (Mm-Slc17a6-C3, #319171-C3), and Gal (Mm-Gal-C1, #400961).
Wholemount in situ hybridization was performed on E13.5 mouse brains using hybridization chain reaction (HCR v3, Molecular Instruments Inc.) according to the manufacturer’s protocol. Mouse embryo heads were immersion fixed overnight in 4% PFA, dehydrated in graded methanol, and stored at −20°C. They were then rehydrated in PBS and hemisected with a midline cut, and the head and face tissue were partially removed. Proteinase K was applied for 20 min at room temperature, followed by a 15-min postfix in PFA. They were transferred to SSC and the manufacturer’s protocol was followed, using probes at 1:100 and amplifiers at 1:50. Custom probes were designed by Molecular Instruments Inc. for Nkx2–1 (NM_009385.4), Foxa1 (NM_008259.4) and Foxb1 (NM_022378.3).
Sections were stained with DAPI, coverslipped using ProLong Gold Antifade Mountant (#P36934, Thermo Fisher Scientific), and stored at 4°C in the dark until imaging. Fluorescent images were acquired using a Zeiss LSM 780 confocal microscope and a Nikon W1 spinning disc. Multiple regions of interest were imaged per section, capturing different regions in embryos and adult brains.
Immunostaining
Brains were prepared as described above. Immunostaining was performed following the previous protocol,94 using primary antibodies for Pvalb (Rabbit polyclonal, Swant PV-25, 1:400) and Pax6 (Rabbit polyclonal, ab2237, 1:200). Sections were incubated with primary antibodies overnight at 4°C, followed by a one-hour secondary antibody incubation.
Xenium in situ spatial transcriptomics
P21 Foxd1Cre/+;Dlx1/2flox/+ and Foxd1Cre/+;Dlx1/2flox/flox mice were anesthetized with 1 mL of tribromoethanol/Avertin and perfused transcardially with 1xPBS to clear blood from brain tissue. Fresh Frozen samples were prepared by flash-freezing dissected brains in an OCT embedding compound, following the 10x Genomics Xenium Fresh Frozen Tissue preparation protocol (CG000579, 10x Genomics). Four 12 μm coronal brain sections, spaced 300 μm apart, were taken from regions spanning from the preoptic area to the mammillary region and positioned on Xenium slides. Hybridization, ligation, and amplification were performed according to the 10x Genomics Xenium In Situ protocol (CG000582) with a panel of 100 custom gene probes and a mouse brain gene panel containing 247 probes (Table S8).
Post-Xenium Immunohistochemistry:
Following Xenium imaging, slides were washed twice in 1xPBS, and incubated in a blocking buffer (0.4% Triton X-100, 10% Horse Serum in 1x PBS) for 2 h at room temperature. Primary antibodies for HuC/D (mouse monoclonal, A-21271, 1:100) and NeuN (mouse monoclonal, MAB377, 1:100) in blocking buffer were added, and slides were incubated overnight at 4°C. Following primary antibody incubation, slides were washed twice in 1xPBS and incubated with a Goat anti-Mouse Alexa Fluor 647 (ab150115, 1:1000) in a blocking buffer for 1 h at room temperature. Slides were then washed twice in 1x PBS and incubated with DAPI (1:1000) in 1xPBS for 5 min at room temperature. Sections were mounted using Aqua-Poly/Mount (#18606-20, Fisher Scientific) and coverslipped. Imaging was conducted on a Zeiss Axio Observer with an Apotome III Microscope (20x objective lens, 0.8 NA). Images were analyzed using QuPath and Xenium Explorer (v3).
Mouse monitoring
Video Monitoring in the Mouse Home-cage:
Foxd1Cre/+;Dlx1/2flox/+ and Foxd1Cre/+;Dlx1/2flox/flox mice activities were monitored with a high-definition video camera positioned above the cage, capturing detailed movements. The camera was set to record at 60 frames per second in a quiet environment with a consistent lighting environment. Each mouse was recorded for one hour, and the footage was analyzed using DeepLabCut for behavior quantification.
Survival Curve Monitoring and Analysis:
Two experimental groups, Foxd1Cre/+;Dlx1/2flox/+ and Foxd1Cre/+;Dlx1/2flox/flox mice, were housed in groups of 3–5 animals per cage, with ad libitum access to standard food pellets and water. Additionally, an experimental subset of Foxd1Cre/+;Dlx1/2flox/flox mice received only liquid gel food and hydration diets, as this genotype exhibited significantly reduced size compared to the Foxd1Cre/+;Dlx1/2flox/+ mice. Survival was monitored twice weekly starting from P21. Survival data, including survival rates, dates of death, and other relevant parameters, were recorded to evaluate the effects of genotype and dietary conditions on survival outcomes.
Behavior assays
Behavior assays were conducted between 10 a.m. and 2 p.m. over four days, using both male and female Foxd1Cre/+;Dlx1/2flox/+ and Foxd1Cre/+;Dlx1/2flox/flox mice of the P21-P25 for each test. Day 1: Hot/Cold Plate assay was conducted, and the Rotarod test was initiated. In the Rotarod test, each mouse was given three trials per day with a 2-min inter-trial interval, continuing over three consecutive days. Day 4: An Open Field Test was conducted.
Data analysis and graphing were performed using GraphPad Prism 10. The Open Field Test and Hot/cold Plate test results were analyzed with an unpaired T Test, while one-way ANOVA with multiple comparisons was used for Rotarod Data.
Open Field Test:
To assess locomotor activity and anxiety-like behavior, mice were placed in a 40 × 40 cm activity chamber equipped with infrared beams (San Diego Instruments Inc.). Total activity and time spent in the center of the chamber were automatically recorded with ‘Photobeam Activity System - Open Field (San Diego Instruments Inc.) over 30 min.
Rotarod Test:
Motor coordination and learning were assessed using an accelerating rotarod (Columbus Instruments), starting at 4 RPM and accelerating at 7.2 RPM/minute. The latency and speed at which each mouse fell were recorded for each trial.
Hot/Cold Plate Test:
Thermal sensitivity was measured using the hot/cold plate test. Mice were placed on a 16.5 × 16.5 cm metal plate (Bioseb, FL, USA) heated to 54°C for the hot plate test or cooled to 4°C for the cold plate test. The latency to hindlimb withdrawal was recorded, with a 30-s cut-off if no response occurred. Mice were immediately returned to their home cage following the test.
Slice electrophysiology
Preparation of brain slices:
Foxd1Cre/+;Dlx1/2flox/+ and Foxd1Cre/+;Dlx1/2flox/flox mice were deeply anesthetized with isoflurane prior to decapitation. The brain was quickly removed and submerged in an ice-cold dissection solution containing (in mM): 212.7 sucrose, 2.6 KCl, 1.23 NaH2PO4, 26 NaHCO3, 10 glucose, 3 MgCl2.6H2O, and 1 CaCl2.2H2O (pH 7.35–7.4, equilibrated with 95% O2–5% CO2). The brain was blocked and sliced coronally using a slicing microtome (Leica VT1200) in the ice-cold dissection solution. Coronal slices (400 μm thickness) containing either the medial geniculate nucleus (MGN), lateral geniculate nucleus (LGN), or ventral posteromedial nucleus (VPM) were obtained. Slices were then incubated in oxygenated artificial cerebrospinal fluid (ACSF, in mM): 130 NaCl, 3 KCl, 1.25 NaH2PO4, 20 NaHCO3, 10 glucose, 1.3 MgSO4.7H2O, and 2.5 CaCl2.2H2O (pH 7.35–7.4, equilibrated with 95% O2–5% CO2) for 50 min at 30°C. After incubation, the slices were maintained at room temperature until recording.
Electrophysiological recording:
Slices were placed in a recording chamber on a fixed-stage microscope (Olympus BX51) and superfused with oxygenated ACSF at 2–4 mL/min at room temperature. Tetrodotoxin (TTX, 1 μM) was added to the recording solution to block the generation and propagation of action potentials. Whole-cell recordings were performed using recording pipettes with an input resistance of 4–12 MΩ filled with a cesium-based internal solution containing (in mM): 115 cesium methanesulfonate (CsCH3SO3), 5 NaF, 10 EGTA, 10 HEPES, 15 CsCl, 3.5 MgATP, and 3 QX-314 (pH 7.25; 300 mOsm). The membrane potential was clamped at −70 mV and 0 mV to record miniature excitatory and inhibitory postsynaptic currents (mEPSCs and mIPSCs), respectively. After a stable whole-cell recording was established, recordings were performed for 10 min at each holding potential. Voltages were corrected for an estimated junction potential of 10 mV. All recordings were performed using a patch clamp amplifier (MultiClamp 700B, Molecular Devices), digitized using a DAQ board (NI PCI-6259, National Instruments), and acquired using the Wavesurfer software (HHMI Janelia Farms, https://wavesurfer.janelia.org).
Data analysis
All codes used in this work are publicly available at github.com/dkim195/HyDD2, and sample details are available in Table S1. Below, we briefly describe the methodologies employed for the analyses presented in this study.
Single-cell sequencing
ScRNA-Seq:
scRNA-Seq data were processed using Seurat v3.2.3. Cells with fewer than 1,000 detected genes, fewer than 2,000 unique molecular identifiers (UMIs), or more than 50% mitochondrial transcript content were excluded. Additionally, cells with over 25% ribosomal transcript content were removed. To minimize the impact of technical artifacts, doublets were identified and excluded based on prior analysis of matched datasets.24
The dataset was normalized using SCTransform, regressing out the effects of the number of genes (nFeature_RNA) and UMIs (nCount_RNA). Dimensionality reduction was performed using principal component analysis (PCA). To visualize clustering results, uniform manifold approximation and projection (UMAP) embeddings were computed using the top 20–30 principal components. Clustering was performed using the Louvain algorithm implemented in Seurat’s FindClusters() function, with the resolution parameter optimized for biological relevance.
Clusters were annotated through an iterative process. In the first pass, clusters were assigned based on cell-type-specific markers, and contaminant populations such as immune cells, endothelial cells, and meningeal cells were removed. Subsequently, datasets from each developmental stage were merged, and clusters were rechecked and refined to ensure consistency. After integrating data from multiple developmental stages, ambiguous clusters such as those containing mixed progenitor and immune cell populations were labeled as “check” clusters for further examination. Batch effects arising from technical and biological sources were addressed using Harmony,95 which corrected for variability associated with sample origin (orig.ident) and sex-linked gene expression (e.g., Xist and Ddx3x). This integrated dataset allowed seamless comparisons across developmental stages and genotypes.
Cluster-specific marker genes were identified using the Wilcoxon rank-sum test implemented in the FindMarkers() function. Differential gene expression (DEG) analysis was performed with a minimum log2 fold change threshold of 0.5 and a minimum fraction of 20% of cells expressing the gene. Enrichment analysis of the resulting DEG lists was used to identify transcription factors driving lineage-specific programs.
ScATAC-Seq:
scATAC-Seq data underwent similar quality control measures to scRNA-Seq data. In general, nuclei with fewer than 1,000 detected peaks or 2,000 fragments were excluded from the analysis (Table S1). Chromatin accessibility data were normalized using SCTransform, and dimensionality reduction was performed using PCA. UMAP embeddings were computed after correcting for batch effects using Harmony, with corrections applied to account for sample origin (orig.ident).
Clusters were identified using the Louvain algorithm and annotated through an iterative refinement process. Initial low-quality clusters, such as those with high mitochondrial content, were excluded. Following this, data from multiple developmental stages were merged, and cluster annotations were refined to ensure consistency across samples. To better understand lineage-specific chromatin accessibility, differential accessibility analysis was performed using the FindMarkers() function, with a log2 fold change threshold of 0.5 and a requirement that peaks be accessible in at least 20% of cells. Motif enrichment analysis was used to identify transcription factors associated with differentially accessible regions.
Integration of scRNA-Seq and scATAC-Seq Data:
Integration of scRNA-Seq and scATAC-Seq datasets was performed to annotate scATAC-Seq cell types based on transcriptional profiles. To achieve this, cell-type labels from scRNA-Seq data were transferred to matching scATAC-Seq datasets using Seurat’s Transfer Anchor workflow. Annotation was guided by known cell-type-specific marker genes and chromatin accessibility profiles at their respective loci. This approach enabled the alignment of transcriptomic and epigenomic data, facilitating a comprehensive analysis of cell-type-specific gene regulation.
Developmental Progression and Mutant Atlas:
For developmental progression analyses, scRNA-Seq and scATAC-Seq datasets were used to identify changes in cell-type composition, transcriptional programs, and chromatin accessibility across different developmental stages. Specific attention was paid to early patterning, neurogenesis, gliogenesis, and neural specification.
To explore mutant phenotypes, an atlas was generated using scRNA-Seq and scATAC-Seq datasets from E12.5 wild-type and mutant samples. scATAC-Seq data were aligned to their scRNA-Seq counterparts, enabling the transfer of cell-type annotations. To ensure consistency, scATAC-Seq datasets were downsampled to match the number and quality of cells in the scRNA-Seq datasets. Differential analysis between wild-type and mutant datasets was performed to identify mutant-specific changes in gene expression and chromatin accessibility.
Trajectory inference and gene module analysis
To investigate lineage progression and gene expression dynamics across hypothalamic development, we employed Monocle 331 for trajectory inference and pseudotime analysis. A subset of cells representing neural progenitors and emerging neuronal lineages was extracted from a Seurat object and converted into a Monocle 3 using the SeuratWrappersas.cell_data_set() function.
Dimensionality reduction and clustering were performed within Monocle 3. The developmental trajectory was learned using learn_graph without partitioning to preserve continuity across fate decisions. Pseudotime values were assigned using order_cells, with root cells anchored on neural progenitor populations.
Lineage branches were selected interactively using choose_cells and analyzed separately. For each branch, genes exhibiting dynamic expression were identified using the graph_test function, which assesses association with the learned principal graph. Significantly variable genes (q-value <0.05) were clustered into co-expression modules using find_gene_modules with a resolution parameter of 1e-2.
For each module, we computed aggregated expression across annotated cell groups using aggregate_gene_expression and visualized module-level trends with heatmaps. To characterize individual gene expression trends along pseudotime, generalized additive models were fitted using fit_models with pseudotime as a continuous predictor. Genes significantly associated with pseudotime (q < 0.0001) were selected for further analysis.
Expression values for these genes were averaged across pseudotime bins (100 intervals) and smoothed using loess regression. We ranked genes based on the monotonicity of their expression (Spearman correlation between expression and pseudotime bin number). Genes with consistent up- or downregulation (|ρ| ≥ 0.6) were visualized, with pseudotime bins annotated by dominant cell identities to contextualize transitions.
SCENIC+ gene regulatory network analysis
Preparation of scRNA-Seq Data for SCENIC+:
Single-cell RNA sequencing (scRNA-Seq) data were processed and converted for SCENIC+ analysis27 using Seurat (v4.3.0)96 and Scanpy (v1.9.1).97 For each dataset, cell clusters annotated through earlier steps were retained, while cells identified as doublets or those from non-relevant clusters (e.g., high mitochondrial content or non-neuronal clusters) were excluded. The Seurat objects for different datasets—patterning, neurogenesis, and mutant samples were converted to AnnData format using the MuDataSeurat::WriteH5AD function.
Metadata, including sample origin, counts, features, cluster identity (Cluster_Pass2), and genotype, were preserved. UMAP was exported as CSV files and integrated into AnnData objects using Scanpy. Raw counts were stored in a separate layer to retain unnormalized data for downstream SCENIC+ processing. Gene expression data were normalized to a total count of 10,000 and log-transformed prior to SCENIC+ processing. The prepared AnnData objects were saved in the h5ad format for subsequent integration with scATAC-Seq data.
Preparation of scATAC-Seq Data for SCENIC+:
scATAC-Seq data were processed using Signac (v1.9.0) and PycisTopic. Initial quality control steps included the removal of low-quality cells, cells identified as doublets, and those originating from non-brain regions. Clusters annotated as "NPC (Glia)" were downsampled to 10% of their original size to balance representation in the dataset.
Peak count matrices were converted to the Feather format using the arrow package. Metadata, including cluster annotations (Cluster_Pass2) and UMAP embeddings, were exported alongside the count matrices. A PycisTopic object was created, integrating count matrices, cell annotations, and fragment file paths for each sample. MALLET-based topic modeling was performed using 50 topics with 500 iterations, employing alpha and eta hyperparameters for Dirichlet distributions. The resulting topic models were evaluated to identify the most optimal model based on log likelihood scores. UMAP embeddings were generated from the PycisTopic object and aligned with RNA-based UMAP embeddings.
Integration of scRNA-Seq and scATAC-Seq Data in SCENIC+:
For SCENIC+ analysis, scRNA and scATAC datasets were integrated using the SCENIC+ Snakemake pipeline. AnnData objects containing RNA expression data were paired with cisTopic objects containing scATAC-Seq accessibility data. Regions-to-genes associations were inferred using proximity rules and co-accessibility relationships. Direct and extended regulatory regions were defined based on motif annotations and overlap with chromatin accessibility peaks.
For motif enrichment, we used the v10nr_clust motif collection, with annotations specific to Mus musculus. Differential motif enrichment analysis was conducted using adjusted p-values <0.05 and log2FC thresholds ≥1.0 to identify transcription factors (TFs) enriched within cell-type-specific accessible regions. To evaluate TF-to-gene relationships, GEX data were modeled using the Gradient Boosting Machine algorithm. Regulatory modules (eRegulons) were identified and scored using AUCell, with both direct and extended annotations.
To identify differentially accessible regions, pseudobulk peak calling was performed for each cluster. Barcode-to-fragment mappings were generated for each cell, and pseudobulk peaks were called using MACS2 with parameters optimized for scATAC-Seq data (e.g., shift = 73 bp, extension = 146 bp). Consensus peaks were determined by merging narrow peaks across samples and filtering against the mm10 blacklist. The resulting peaks were annotated using Ensembl genome annotations.
The SCENIC+ pipeline was implemented using a Snakemake workflow. Configurations included genome annotation, chromsizes, and motif annotation files. The integrated SCENIC+ pipeline generated eRegulons for each cluster, which were used to infer cell-type-specific regulatory landscapes and to identify key transcriptional regulators of neurogenesis and patterning. Final outputs included inferred regulatory networks, motif enrichment results, and direct/extended eRegulons, which were stored in H5Mu and TSV formats for downstream interpretation.
Identification and Annotation of eRegulons:
GRNs were constructed using the SCENIC+ pipeline by integrating single-cell RNA-Seq and ATAC-Seq data. To identify eRegulons, the extended regulatory regions were analyzed for transcriptional activation and repression motifs. The SCENIC+ pipeline inferred TF-to-gene regulatory interactions through motif enrichment analyses, evaluating the importance of TF-to-gene relationships. Extended eRegulons were filtered for significant activator (extended +/+) or repressor (extended −/+) motifs, and genes with high TF-to-gene importance scores and ranks were retained for downstream analyses.
Gene sets representing distinct hypothalamic domains and developmental stages were curated based on prior knowledge. These included genes for the supramammillary nucleus (SMN), medial mammillary nucleus (MMN), paraventricular and supraoptic nuclei (PVH_SON), tuberal regions (Tub), premammillary nucleus (PMN), and prethalamus (PreThal), as well as progenitor-specific markers. Genes were grouped into activator or repressor types, based on motif enrichment within eRegulons, and cross-referenced with experimentally validated transcription factors (TFs) obtained from public databases. Only TFs with significant eRegulon associations and non-conflicting annotations were included in further analysis.
To identify feedback regulatory interactions, custom R functions were implemented to detect pairs of TFs and target genes that formed reciprocal or overlapping regulatory relationships within eRegulons. Positive feedback loops were defined as activator-activator interactions, while negative feedback loops consisted of activator-repressor or repressor-repressor pairs. Each regulatory relationship was labeled with its origin cluster and type of feedback (activator or repressor). Feedback regulatory networks were constructed for specific clusters, such as SMN, MMN, and progenitor domains, and later integrated into a combined network across clusters. The filtered GRN included only high-confidence TF-target relationships, which were grouped by hypothalamic domains or cell types.
Gene regulatory networks were visualized using the igraph and ggraph R packages, which were refined further using Cytoscape (v3.10.3). Regulatory relationships were plotted as directed graphs, where nodes represented TFs or target genes and edges denoted activation or repression interactions. Feedback loops and cross-cluster regulatory connections were highlighted. Edge thickness was scaled by the TF-to-gene importance score, while edge color represented activator (blue) or repressor (red) interactions. Nodes were annotated with their respective clusters or domains, and network layouts were optimized using force-directed algorithms.
To further analyze interactions between hypothalamic regions, regulatory relationships were aggregated by their source (TF origin cluster) and target (regulated cluster). Region-level interaction networks were visualized with directional edges representing activation or repression between clusters. Specific subnetworks were extracted to examine interconnectivity between progenitor domains and terminally differentiated cell types, such as SMN and MMN.
Xenium Spatial Transcriptomics analysis
Data Acquisition and Preprocessing:
Raw Xenium data were imported into the SpatialData framework via the spatialdata_io module, ensuring compatibility with downstream analyses. Raw spatial datasets were converted to .zarr format and processed further using Scanpy and Squidpy.
Cellular quality metrics, including total transcripts, unique transcripts, segmented cell areas, and nucleus-to-cell area ratios, were calculated for each region using scanpy.pp.calculate_qc_metrics. Cells with low transcript counts or other aberrant quality metrics were flagged for potential exclusion. Negative control DNA probe counts and decoding counts were assessed to ensure data integrity.
Data Normalization and Dimension Reduction:
For each region, raw transcript count matrices were normalized using total count normalization (scanpy.pp.normalize_total) and subsequently log-transformed (scanpy.pp.log1p). Highly variable genes were identified (scanpy.pp.highly_variable_genes) for downstream clustering and differential expression analysis. PCA was performed to reduce dimensionality, retaining components that captured the majority of variance.
Clustering and Neighborhood Analysis:
Spatially resolved clusters were identified using the Leiden clustering algorithm (scanpy.tl.leiden) applied to PCA-derived neighbors. To assess spatial relationships among clusters, spatial neighbors and neighborhood enrichment were calculated (squidpy.gr.spatial_neighbors and squidpy.gr.nhood_enrichment, respectively). Enrichment matrices were visualized to explore cluster co-occurrence patterns.
Visualization of Spatial Gene Expression:
Clusters and individual gene expression levels were visualized in a spatial context using squidpy.pl.spatial_scatter.
Behavioral analysis using DeepLabCut
A DeepLabCut (DLC)73 project was created for the automated tracking of movement in behavioral videos. The project, titled "Dlx", was initialized using the deeplabcut.create_new_project function, specifying the experimenter, video file paths, and project settings. The system was configured for single-animal tracking with anatomical landmarks, including Head, Neck, and Tail, as determined via the graphical user interface. Additional videos were imported as required during the project life cycle.
Key frames were automatically extracted from the videos using the k-means clustering algorithm via deeplabcut.extract_frames (mode = "automatic"). Extracted frames were manually labeled for the specified landmarks to ensure accurate identification.
A training dataset was generated using the labeled frames and augmented automatically by DLC to improve model robustness. This step included splitting datasets into training and validation subsets via the GUI.
The neural network was trained using the labeled data. Model training included the optimization of parameters to achieve accurate landmark detection. Post-training, the network’s performance was evaluated with validation datasets using deeplabcut.evaluate_network. Performance metrics and visualized results were generated, providing insight into the model’s accuracy.
Trained models were deployed to analyze new videos using deeplabcut.analyze_videos. Key options such as saving results as CSV files, filtering predictions, and visualizing trajectories were configured to enhance tracking reliability. For analysis of specific videos, paths, and settings were programmatically defined, enabling automated processing.
To improve tracking precision, trajectory data were post-processed using DLC’s tracking and refinement tools. The detected movement was converted into tracklets with the deeplabcut.convert_detections2tracklets function. Tracklets were further stitched (deeplabcut.stitch_tracklets) to produce continuous trajectories, filtered (deeplabcut.filterpredictions) for noise reduction, and visualized (deeplabcut.plot_trajectories).
Labeled videos with trajectories were generated for quality control and presentation using deeplabcut.create_labeled_video. Visualizations included color-coded markers, skeleton overlays, and trailing trajectories, highlighting tracked movements.
When necessary, outlier frames were extracted and manually refined via the GUI. Updated labels were merged back into the dataset (deeplabcut.merge_datasets), followed by retraining the model (deeplabcut.train_network) with a new shuffle index to incorporate refined annotations.
Analysis of the output was conducted following github.com/ETHZ-INS/DLCAnalyzer.
Electrophysiological recording analysis
Electrophysiological data were analyzed using the MATLAB-based data analysis software ‘minis’.98 Recording traces were initially band-pass filtered at 50 Hz and smoothed using a 1.5-millisecond Gaussian window to remove high-frequency noise. Events were identified in the smoothed trace, and each event was evaluated using an amplitude threshold of 3 pA and a maximum time-to-peak of 5 milliseconds. All data were plotted with means ± standard error of the mean (SEM). Data normality was assessed using the Shapiro-Wilk (SW) test, and comparisons were made using either a Student t-test or a rank-sum test, as appropriate.
QUANTIFICATION AND STATISTICAL ANALYSIS
Statistical analyses were conducted using GraphPad Prism 10, R, or MATLAB, depending on the dataset. All analysis scripts, including those for single-cell workflows and behavioral quantification (DeepLabCut), are available at https://github.com/dkim195/HyDD2 Processed data and associated metadata are described in Table S1 and the Supplemental Figures and Tables.
Data are presented as mean ± SEM unless otherwise indicated. A p-value <0.05 was considered statistically significant. Specific statistical tests and parameters are described in the corresponding sections of the Methods.
Supplementary Material
SUPPLEMENTAL INFORMATION
Supplemental information can be found online at https://doi.org/10.1016/j.celrep.2025.115858.
KEY RESOURCES TABLE.
| REAGENT or RESOURCE | SOURCE | IDENTIFIER |
|---|---|---|
|
| ||
| Antibodies | ||
|
| ||
| Anti-Pvalb | Swant | PV-25 |
| Anti-Pax6 | Abcam | ab2237 |
| Anti-HuC/D | Invitrogen | A-21271 |
| Anti-NeuN | Millipore | MAB377 |
| Goat anti-Mouse Alexa Fluor 647 | Abcam | ab150115 |
|
| ||
| Experimental Models | ||
|
| ||
| Foxd1-Cre | C67BL6/CD1 | JAX#012463 |
| Isl1-flox | C67BL6/CD1 | Pan et al.90 |
| Lhx1-flox | C67BL6/CD1 | - |
| Nkx2.2-Cre | C67BL6/CD1 | JAX#026880 |
| Dlx1/2-flox | C67BL6/CD1 | - |
| CD1 Wild type mice | CD1 | Charles River Laboratories |
|
| ||
| Chemicals, peptides, and recombinant proteins | ||
|
| ||
| Hibernate-E | Thermo Fisher Scientific | Cat# A1247601 |
| Hibernate-A | Thermo Fisher Scientific | Cat# A1247501 |
| B-27 Supplement | Thermo Fisher Scientific | Cat# 17504044 |
| GlutaMAX Supplement | Thermo Fisher Scientific | Cat# 35050061 |
| Hibernate-E Minus Calcium | BrainBits | Cat# HECA500 |
| Hibernate-A Minus Calcium | BrainBits | Cat# HACA500 |
| RNase inhibitor | Promega | Cat# N2615 |
| DNase I | Sigma-Aldrich | Cat# 4716728001 |
| Trypan Blue | Thermo Fisher Scientific | Cat# 15250061 |
| ProLong Gold Antifade Mountant | Thermo Fisher Scientific | Cat# P36934 |
| Aqua-Poly/Mount | Fisher Scientific | Cat# 18606-20 |
|
| ||
| Critical commercial assays | ||
|
| ||
| Chromium Single Cell 3' Library and Gel Bead Kit v3 | 10x Genomics | Cat# 1000075 |
| Chromium Single Cell 3' Library and Gel Bead Kit v3.1 | 10x Genomics | Cat# 1000268 |
| 10x Genomics Chromium Single Cell ATAC v1.1 | 10x Genomics | Cat# 1000175 |
| 10x Genomics Xenium | 10x Genomics | Cat# 1000462 + Custom Genes |
|
| ||
| Deposited data | ||
|
| ||
| ScRNA-Seq and scATAC-Seq Raw | This paper | GSE28449 |
| ScRNA-Seq and scATAC-Seq Processed | This paper | 10.5281/zenodo.14292830 |
| Xenium Processed | This paper | 10.5281/zenodo.14292830 |
|
| ||
| Oligonucleotides | ||
|
| ||
| Mm-Sp8-C3 | ACDBio | #547521-C3 |
| Mm-Sp9-C1 | ACDBio | #564531 |
| Mm-Pitx2-C2 | ACDBio | #412841-C2 |
| Mm-Irx5-C1 | ACDBio | #513871 |
| Mm-Meis2-C2 | ACDBio | #512841-C2 |
| Mm-Npw-C1 | ACDBio | #495671 |
| Mm-Pnoc-C2 | ACDBio | #437881-C2 |
| Mm-Slc32a1-C2 | ACDBio | #319191-C2 |
| Mm-Slc17a6-C3 | ACDBio | #319171-C3 |
| Mm-Gal-C1 | ACDBio | #400961 |
|
| ||
| Software and algorithms | ||
|
| ||
| CellRanger v5 | 10x Genomics | http://10xgenomics.com |
| Cell Ranger ATAC (v2) | 10x Genomics | http://10xgenomics.com |
| Cytoscape (v3.10.3) | https://cytoscape.org/ | |
| DeepLabCut (v2.3.4) | https://github.com/DeepLabCut/DeepLabCut | |
| All R and Python codes | https://github.com/dkim195/HyDD2 | |
Highlights.
ScRNA/ATAC-seq identifies mechanisms controlling prethalamus and hypothalamus development
Transcriptional autoactivation and cross-inhibition pattern these structures
Dlx1/2 controls GABAergic neuron fate in prethalamus and hypothalamus
Disrupted GABAergic development causes thalamic hyperexcitability and behavioral changes
ACKNOWLEDGMENTS
This work was supported by the NIH (R01MH126676) to S.B.; F31DK132944 from the National Institute of Diabetes and Digestive and Kidney Diseases (NIDDK) and F99-NS135816 from the National Institute of Neurological Disorders and Stroke (NINDS) to L.H.D.; RO1DC009607 from the National Institute on Deafness and Other Communication Disorders (NIDCD) to P.O.K.; the Lundbeckfonden grant (R361-2020-2654), the Novo Nordisk Foundation grant (NNF24OC0089408), and the Parkinsonforeningen (R63-A1583-B890) to D.W. K.; and the Biotechnology and Biological Sciences Research Council (BBSRC2020 Alert B/V019368/1) to Sheffield University Light Microscope Facility. We thank Transcriptomics and Deep Sequencing Core (Johns Hopkins) for sequencing of scRNA-seq, scATAC-seq, and Xenium libraries; Micfac Microscope Facility for providing infrastructure to perform imaging (Johns Hopkins); Behavioral Core for providing infrastructure to perform mouse behavior tests (Johns Hopkins); MARCC (Johns Hopkins) and GenomeDK (Aarhus University) for providing infrastructure to perform data analysis. Isl1lox/lox mice were a gift from Dr. Lin Gan, Lhx1lox/lox mice were a gift from Dr. Richard R. Behringer, and Dlx1/2lox/lox were a gift from Dr. Jay Lee.
Footnotes
DECLARATION OF INTERESTS
S.B. receives research support from Genentech and is a co-founder and shareholder in CDI Labs, LLC.
REFERENCES
- 1.Crabtree JW (2018). Functional Diversity of Thalamic Reticular Subnetworks. Front. Syst. Neurosci. 12, 41. [DOI] [PMC free article] [PubMed] [Google Scholar]
- 2.Çavdar S, Onat F, Çakmak YÖ, Saka E, Yananli HR, and Aker R (2006). Connections of the zona incerta to the reticular nucleus of the thalamus in the rat. J. Anat. 209, 251. [DOI] [PMC free article] [PubMed] [Google Scholar]
- 3.Chou X-L, Wang X, Zhang Z-G, Shen L, Zingg B, Huang J, Zhong W, Mesik L, Zhang LI, and Tao HW (2018). Inhibitory gain modulation of defense behaviors by zona incerta. Nat. Commun. 9, 1151. [DOI] [PMC free article] [PubMed] [Google Scholar]
- 4.Watson GDR, Smith JB, and Alloway KD (2015). The Zona Incerta Regulates Communication between the Superior Colliculus and the Posteromedial Thalamus: Implications for Thalamic Interactions with the Dorsolateral Striatum. J. Neurosci. 35, 9463–9476. [DOI] [PMC free article] [PubMed] [Google Scholar]
- 5.Zhang M, Pan X, Jung W, Halpern AR, Eichhorn SW, Lei Z, Cohen L, Smith KA, Tasic B, Yao Z, et al. (2023). Molecularly defined and spatially resolved cell atlas of the whole mouse brain. Nature 624, 343–354. [DOI] [PMC free article] [PubMed] [Google Scholar]
- 6.Tessmar-Raible K, Raible F, Christodoulou F, Guy K, Rembold M, Hausen H, and Arendt D (2007). Conserved sensory-neurosecretory cell types in annelid and fish forebrain: insights into hypothalamus evolution. Cell 129, 1389–1400. [DOI] [PubMed] [Google Scholar]
- 7.Fong H, Zheng J, and Kurrasch D (2023). The structural and functional complexity of the integrative hypothalamus. Sci. Technol. Humanit. 382, 388–394. [DOI] [PubMed] [Google Scholar]
- 8.Inamura N, Ono K, Takebayashi H, Zalc B, and Ikenaka K (2011). Olig2 lineage cells generate GABAergic neurons in the prethalamic nuclei, including the zona incerta, ventral lateral geniculate nucleus and reticular thalamic nucleus. Dev. Neurosci. 33, 118–129. [DOI] [PubMed] [Google Scholar]
- 9.Vue TY, Aaker J, Taniguchi A, Kazemzadeh C, Skidmore JM, Martin DM, Martin JF, Treier M, and Nakagawa Y (2007). Characterization of progenitor domains in the developing mouse thalamus. J. Comp. Neurol. 505, 73–91. [DOI] [PubMed] [Google Scholar]
- 10.Magnin M, Rey M, Bastuji H, Guillemant P, Mauguière F, and Garcia-Larrea L (2010). Thalamic deactivation at sleep onset precedes that of the cerebral cortex in humans. Proc. Natl. Acad. Sci. USA 107, 3829–3833. [DOI] [PMC free article] [PubMed] [Google Scholar]
- 11.Halassa MM, Chen Z, Wimmer RD, Brunetti PM, Zhao S, Zikopoulos B, Wang F, Brown EN, and Wilson MA (2014). State-dependent architecture of thalamic reticular subnetworks. Cell 158, 808–821. [DOI] [PMC free article] [PubMed] [Google Scholar]
- 12.Blanco-Centurion C, Luo S, Vidal-Ortiz A, Swank C, and Shiromani PJ (2021). Activity of a subset of vesicular GABA-transporter neurons in the ventral zona incerta anticipate sleep onset. Sleep 44, zsaa268. 10.1093/sleep/zsaa268. [DOI] [PMC free article] [PubMed] [Google Scholar]
- 13.Ye Q, Nunez J, and Zhang X (2023). Zona incerta dopamine neurons encode motivational vigor in food seeking. Sci. Adv. 9, eadi5326. [DOI] [PMC free article] [PubMed] [Google Scholar]
- 14.Liu K, Kim J, Kim DW, Stephanie Zhang Y, Bao H, Denaxa M, Lim S-A, Kim E, Liu C, Wickersham IR, et al. (2017). Corrigendum: Lhx6-positive GABA-releasing neurons of the zona incerta promote sleep. Nature 550, 548. [DOI] [PMC free article] [PubMed] [Google Scholar]
- 15.Zhang X, and van den Pol AN (2017). Rapid binge-like eating and body weight gain driven by zona incerta GABA neuron activation. Sci. Technol. Humanit. 356, 853–859. [DOI] [PMC free article] [PubMed] [Google Scholar]
- 16.Ahmadlou M, Houba JHW, van Vierbergen JFM, Giannouli M, Gimenez G-A, van Weeghel C, Darbanfouladi M, Shirazi MY, Dziubek J, Kacem M, et al. (2021). A cell type-specific cortico-subcortical brain circuit for investigatory and novelty-seeking behavior. Sci. Technol. Humanit. 372, eabe9681. 10.1126/science.abe9681. [DOI] [PubMed] [Google Scholar]
- 17.Moffitt JR, Bambah-Mukku D, Eichhorn SW, Vaughn E, Shekhar K, Perez JD, Rubinstein ND, Hao J, Regev A, Dulac C, and Zhuang X (2018). Molecular, spatial, and functional single-cell profiling of the hypothalamic preoptic region. Sci. Technol. Humanit. 362, eaau5324. 10.1126/science.aau5324. [DOI] [PMC free article] [PubMed] [Google Scholar]
- 18.Mickelsen LE, Bolisetty M, Chimileski BR, Fujita A, Beltrami EJ, Costanzo JT, Naparstek JR, Robson P, and Jackson AC (2019). Single-cell transcriptomic analysis of the lateral hypothalamic area reveals molecularly distinct populations of inhibitory and excitatory neurons. Nat. Neurosci. 22, 642–656. [DOI] [PMC free article] [PubMed] [Google Scholar]
- 19.Kim D-W, Yao Z, Graybuck LT, Kim TK, Nguyen TN, Smith KA, Fong O, Yi L, Koulena N, Pierson N, et al. (2019). Multimodal Analysis of Cell Types in a Hypothalamic Node Controlling Social Behavior. Cell 179, 713–728.e17. [DOI] [PMC free article] [PubMed] [Google Scholar]
- 20.Steuernagel L, Lam BYH, Klemm P, Dowsett GKC, Bauder CA, Tadross JA, Hitschfeld TS, Del Rio Martin A, Chen W, de Solis AJ, et al. (2022). HypoMap-a unified single-cell gene expression atlas of the murine hypothalamus. Nat. Metab. 4, 1402–1419. [DOI] [PMC free article] [PubMed] [Google Scholar]
- 21.Zhou X, Lu Y, Zhao F, Dong J, Ma W, Zhong S, Wang M, Wang B, Zhao Y, Shi Y, et al. (2022). Deciphering the spatial-temporal transcriptional landscape of human hypothalamus development. Cell Stem Cell 29, 328–343.e5. [DOI] [PubMed] [Google Scholar]
- 22.Huang W-K, Wong SZH, Pather SR, Nguyen PTT, Zhang F, Zhang DY, Zhang Z, Lu L, Fang W, Chen L, et al. (2021). Generation of hypothalamic arcuate organoids from human induced pluripotent stem cells. Cell Stem Cell 28, 1657–1670.e10. [DOI] [PMC free article] [PubMed] [Google Scholar]
- 23.Kim DW, Place E, Chinnaiya K, Manning E, Sun C, Dai W, Groves I, Ohyama K, Burbridge S, Placzek M, and Blackshaw S (2022). Single-cell analysis of early chick hypothalamic development reveals that hypothalamic cells are induced from prethalamic-like progenitors. Cell Rep. 38, 110251. [DOI] [PMC free article] [PubMed] [Google Scholar]
- 24.Kim DW, Washington PW, Wang ZQ, Lin SH, Sun C, Ismail BT, Wang H, Jiang L, and Blackshaw S (2020). The cellular and molecular landscape of hypothalamic patterning and differentiation from embryonic to late postnatal development. Nat. Commun. 11, 4360. [DOI] [PMC free article] [PubMed] [Google Scholar]
- 25.Zhou X, Zhong S, Peng H, Liu J, Ding W, Sun L, Ma Q, Liu Z, Chen R, Wu Q, and Wang X (2020). Cellular and molecular properties of neural progenitors in the developing mammalian hypothalamus. Nat. Commun. 11, 4063. [DOI] [PMC free article] [PubMed] [Google Scholar]
- 26.Romanov RA, Tretiakov EO, Kastriti ME, Zupancic M, Häring M, Korchynska S, Popadin K, Benevento M, Rebernik P, Lallemend F, et al. (2020). Molecular design of hypothalamus development. Nature 582, 246–252. [DOI] [PMC free article] [PubMed] [Google Scholar]
- 27.Bravo González-Blas C, De Winter S, Hulselmans G, Hecker N, Matetovici I, Christiaens V, Poovathingal S, Wouters J, Aibar S, and Aerts S (2023). SCENIC+: single-cell multiomic inference of enhancers and gene regulatory networks. Nat. Methods 20, 1355–1367. [DOI] [PMC free article] [PubMed] [Google Scholar]
- 28.Lyu P, Hoang T, Santiago CP, Thomas ED, Timms AE, Appel H, Gimmen M, Le N, Jiang L, Kim DW, et al. (2021). Gene regulatory networks controlling temporal patterning, neurogenesis, and cell-fate specification in mammalian retina. Cell Rep. 37, 109994. [DOI] [PMC free article] [PubMed] [Google Scholar]
- 29.Aslanpour S, Han S, Schuurmans C, and Kurrasch DM (2020). Acts as a Classical Proneural Gene in the Ventromedial Hypothalamus and Is Required for the Early Phase of Neurogenesis. J. Neurosci. 40, 3549–3563. [DOI] [PMC free article] [PubMed] [Google Scholar]
- 30.Shimogori T, Lee DA, Miranda-Angulo A, Yang Y, Wang H, Jiang L, Yoshida AC, Kataoka A, Mashiko H, Avetisyan M, et al. (2010). A genomic atlas of mouse hypothalamic development. Nat. Neurosci. 13, 767–775. [DOI] [PMC free article] [PubMed] [Google Scholar]
- 31.Cao J, Spielmann M, Qiu X, Huang X, Ibrahim DM, Hill AJ, Zhang F, Mundlos S, Christiansen L, Steemers FJ, et al. (2019). The single-cell transcriptional landscape of mammalian organogenesis. Nature 566, 496–502. [DOI] [PMC free article] [PubMed] [Google Scholar]
- 32.Niimi M, and Murao K (2005). Neuropeptide W as a stress mediator in the hypothalamus. Endocrine 27, 51–54. [DOI] [PubMed] [Google Scholar]
- 33.Motoike T, Skach AG, Godwin JK, Sinton CM, Yamazaki M, Abe M, Natsume R, Sakimura K, and Yanagisawa M (2015). Transient expression of neuropeptide W in postnatal mouse hypothalamus–a putative regulator of energy homeostasis. Neuroscience 301, 323–337. [DOI] [PubMed] [Google Scholar]
- 34.Ladenheim EE, Behles RR, Bi S, and Moran TH (2009). Gastrin-releasing peptide messenger ribonucleic acid expression in the hypothalamic paraventricular nucleus is altered by melanocortin receptor stimulation and food deprivation. Endocrinology 150, 672–678. [DOI] [PMC free article] [PubMed] [Google Scholar]
- 35.Beinfeld MC, Meyer DK, Eskay RL, Jensen RT, and Brownstein MJ (1981). The distribution of cholecystokinin immunoreactivity in the central nervous system of the rat as determined by radioimmunoassay. Brain Res. 212, 51–57. [DOI] [PubMed] [Google Scholar]
- 36.Lee DA, Oikonomou G, Cammidge T, Andreev A, Hong Y, Hurley H, and Prober DA (2020). Neuropeptide VF neurons promote sleep via the serotonergic raphe. eLife 9, e54491. 10.7554/eLife.54491. [DOI] [PMC free article] [PubMed] [Google Scholar]
- 37.Oberst P, Agirman G, and Jabaudon D (2019). Principles of progenitor temporal patterning in the developing invertebrate and vertebrate nervous system. Curr. Opin. Neurobiol. 56, 185–193. [DOI] [PubMed] [Google Scholar]
- 38.Chen Y-C, and Konstantinides N (2022). Integration of Spatial and Temporal Patterning in the Invertebrate and Vertebrate Nervous System. Front. Neurosci. 16, 854422. [DOI] [PMC free article] [PubMed] [Google Scholar]
- 39.Clark BS, Stein-O’Brien GL, Shiau F, Cannon GH, Davis-Marcisak E, Sherman T, Santiago CP, Hoang TV, Rajaii F, James-Esposito RE, et al. (2019). Single-Cell RNA-Seq Analysis of Retinal Development Identifies NFI Factors as Regulating Mitotic Exit and Late-Born Cell Specification. Neuron (Camb., Mass.) 102, 1111–1126.e5. [DOI] [PMC free article] [PubMed] [Google Scholar]
- 40.Zhang I, Boezio GL, Cornwall-Scoones J, Frith T, Jiang M, Howell M, Lovell-Badge R, Sagner A, Briscoe J, and Delás MJ (2024). The cis-regulatory logic integrating spatial and temporal patterning in the vertebrate neural tube. Preprint at: bioRxiv. 10.1101/2024.04.17.589864 [DOI] [PubMed] [Google Scholar]
- 41.Sagner A, Zhang I, Watson T, Lazaro J, Melchionda M, and Briscoe J (2021). A shared transcriptional code orchestrates temporal patterning of the central nervous system. PLoS Biol. 19, e3001450. [DOI] [PMC free article] [PubMed] [Google Scholar]
- 42.Telley L, Agirman G, Prados J, Amberg N, Fièvre S, Oberst P, Bartolini G, Vitali I, Cadilhac C, Hippenmeyer S, et al. (2019). Temporal patterning of apical progenitors and their daughter neurons in the developing neocortex. Sci. Technol. Humanit. 364, eaav2522. 10.1126/science.aav2522. [DOI] [PubMed] [Google Scholar]
- 43.Sollis E, Mosaku A, Abid A, Buniello A, Cerezo M, Gil L, Groza T, Güneş O, Hall P, Hayhurst J, et al. (2023). The NHGRI-EBI GWAS Catalog: knowledgebase and deposition resource. Nucleic Acids Res. 51, D977–D985. [DOI] [PMC free article] [PubMed] [Google Scholar]
- 44.Kremer HP (1992). The hypothalamic lateral tuberal nucleus: normal anatomy and changes in neurological diseases. Prog. Brain Res. 93, 249–261. [DOI] [PubMed] [Google Scholar]
- 45.Corbet Burcher G, Liang H, Lancaster R, Cross JH, Tisdall M, Varadkar S, Spoudeas HA, Caredda E, Bennett S, and Heyman I (2019). Neuropsychiatric profile of paediatric hypothalamic hamartoma: systematic review and case series. Dev. Med. Child Neurol. 61, 1377–1385. [DOI] [PubMed] [Google Scholar]
- 46.Ruggeri A, Nerland S, Mørch-Johnsen L, Jørgensen KN, Barth C, Wortinger LA, Andreou D, Andreassen OA, and Agartz I (2024). Hypothalamic Subunit Volumes in Schizophrenia and Bipolar Spectrum Disorders. Schizophr. Bull. 50, 533–544. [DOI] [PMC free article] [PubMed] [Google Scholar]
- 47.Zhang Y, Stoelzel C, Ezrokhi M, Tsai T-H, and Cincotta AH (2021). Activation State of the Supramammillary Nucleus Regulates Body Composition and Peripheral Fuel Metabolism. Neuroscience 466, 125–147. [DOI] [PubMed] [Google Scholar]
- 48.López-Ferreras L, Eerola K, Mishra D, Shevchouk OT, Richard JE, Nilsson FH, Hayes MR, and Skibicka KP (2019). GLP-1 modulates the supramammillary nucleus-lateral hypothalamic neurocircuit to control ingestive and motivated behavior in a sex divergent manner. Mol. Metab. 20, 178–193. [DOI] [PMC free article] [PubMed] [Google Scholar]
- 49.Douglas G, Cho MT, Telegrafi A, Winter S, Carmichael J, Zackai EH, Deardorff MA, Harr M, Williams L, Psychogios A, et al. (2018). De novo missense variants in MEIS2 recapitulate the microdeletion phenotype of cardiac and palate abnormalities, developmental delay, intellectual disability and dysmorphic features. Am. J. Med. Genet. 176, 1845–1851. [DOI] [PubMed] [Google Scholar]
- 50.Davis LK, Meyer KJ, Rudd DS, Librant AL, Epping EA, Sheffield VC, and Wassink TH (2008). Pax6 3’ deletion results in aniridia, autism and mental retardation. Hum. Genet. 123, 371–378. [DOI] [PMC free article] [PubMed] [Google Scholar]
- 51.Liu X, Novosedlik N, Wang A, Hudson ML, Cohen IL, Chudley AE, Forster-Gibson CJ, Lewis SME, and Holden JJA (2009). The DLX1and DLX2 genes and susceptibility to autism spectrum disorders. Eur. J. Hum. Genet. 17, 228–235. [DOI] [PMC free article] [PubMed] [Google Scholar]
- 52.Abrahams BS, Arking DE, Campbell DB, Mefford HC, Morrow EM, Weiss LA, Menashe I, Wadkins T, Banerjee-Basu S, and Packer A (2013). SFARI Gene 2.0: a community-driven knowledgebase for the autism spectrum disorders (ASDs). Mol. Autism 4, 36. [DOI] [PMC free article] [PubMed] [Google Scholar]
- 53.Kesner AJ, Mozaffarilegha M, Thirtamara Rajamani K, Arima Y, Harony-Nicolas H, Hashimotodani Y, Ito HT, Song J, and Ikemoto S (2023). Hypothalamic Supramammillary Control of Cognition and Motivation. J. Neurosci. 43, 7538–7546. [DOI] [PMC free article] [PubMed] [Google Scholar]
- 54.Li Y-D, Luo Y-J, Chen Z-K, Quintanilla L, Cherasse Y, Zhang L, Lazarus M, Huang Z-L, and Song J (2022). Hypothalamic modulation of adult hippocampal neurogenesis in mice confers activity-dependent regulation of memory and anxiety-like behavior. Nat. Neurosci. 25, 630–645. [DOI] [PMC free article] [PubMed] [Google Scholar]
- 55.Lein ES, Hawrylycz MJ, Ao N, Ayres M, Bensinger A, Bernard A, Boe AF, Boguski MS, Brockway KS, Byrnes EJ, et al. (2007). Genome-wide atlas of gene expression in the adult mouse brain. Nature 445, 168–176. [DOI] [PubMed] [Google Scholar]
- 56.Lee B, Lee S, Lee S-K, and Lee JW (2016). The LIM-homeobox transcription factor Isl1 plays crucial roles in the development of multiple arcuate nucleus neurons. Development 143, 3763–3773. [DOI] [PMC free article] [PubMed] [Google Scholar]
- 57.Niquille M, Limoni G, Markopoulos F, Cadilhac C, Prados J, Holtmaat A, and Dayer A (2018). Neurogliaform cortical interneurons derive from cells in the preoptic area. eLife 7, e32017. 10.7554/eLife.32017. [DOI] [PMC free article] [PubMed] [Google Scholar]
- 58.Lee B, Kim J, An T, Kim S, Patel EM, Raber J, Lee S-K, Lee S, and Lee JW (2018). Dlx1/2 and Otp coordinate the production of hypothalamic GHRH- and AgRP-neurons. Nat. Commun. 9, 2026. [DOI] [PMC free article] [PubMed] [Google Scholar]
- 59.Romanov RA, Zeisel A, Bakker J, Girach F, Hellysaz A, Tomer R, Alpár A, Mulder J, Clotman F, Keimpema E, et al. (2017). Molecular interrogation of hypothalamic organization reveals distinct dopamine neuronal subtypes. Nat. Neurosci. 20, 176–188. [DOI] [PMC free article] [PubMed] [Google Scholar]
- 60.Colasante G, Collombat P, Raimondi V, Bonanomi D, Ferrai C, Maira M, Yoshikawa K, Mansouri A, Valtorta F, Rubenstein JLR, and Broccoli V (2008). Arx is a direct target of Dlx2 and thereby contributes to the tangential migration of GABAergic interneurons. J. Neurosci. 28, 10674–10686. [DOI] [PMC free article] [PubMed] [Google Scholar]
- 61.Nakamura JP, Schroeder A, Hudson M, Jones N, Gillespie B, Du X, Notaras M, Swaminathan V, Reay WR, Atkins JR, et al. (2019). The maternal immune activation model uncovers a role for the Arx gene in GABAergic dysfunction in schizophrenia. Brain Behav. Immun. 81, 161–171. [DOI] [PubMed] [Google Scholar]
- 62.Frank A, Brown LM, and Clegg DJ (2014). The role of hypothalamic estrogen receptors in metabolic regulation. Front. Neuroendocrinol. 35, 550–557. [DOI] [PMC free article] [PubMed] [Google Scholar]
- 63.Cheong RY, Czieselsky K, Porteous R, and Herbison AE (2015). Expression of ESR1 in Glutamatergic and GABAergic Neurons Is Essential for Normal Puberty Onset, Estrogen Feedback, and Fertility in Female Mice. J. Neurosci. 35, 14533–14543. [DOI] [PMC free article] [PubMed] [Google Scholar]
- 64.Newman EA, Kim DW, Wan J, Wang J, Qian J, and Blackshaw S (2018). Foxd1 is required for terminal differentiation of anterior hypothalamic neuronal subtypes. Dev. Biol. 439, 102–111. [DOI] [PMC free article] [PubMed] [Google Scholar]
- 65.Roy A, de Melo J, Chaturvedi D, Thein T, Cabrera-Socorro A, Houart C, Meyer G, Blackshaw S, and Tole S (2013). LHX2 is necessary for the maintenance of optic identity and for the progression of optic morphogenesis. J. Neurosci. 33, 6877–6884. [DOI] [PMC free article] [PubMed] [Google Scholar]
- 66.Govek KW, Chen S, Sgourdou P, Yao Y, Woodhouse S, Chen T, Fuccillo MV, Epstein DJ, and Camara PG (2022). Developmental trajectories of thalamic progenitors revealed by single-cell transcriptome profiling and Shh perturbation. Cell Rep. 41, 111768. [DOI] [PMC free article] [PubMed] [Google Scholar]
- 67.Nguyen Q-H, Tran H-N, and Jeong Y (2024). Regulation of neuronal fate specification and connectivity of the thalamic reticular nucleus by the Ascl1-Isl1 transcriptional cascade. Cell. Mol. Life Sci. 81, 478. [DOI] [PMC free article] [PubMed] [Google Scholar]
- 68.Briscoe J, Sussel L, Serup P, Hartigan-O’Connor D, Jessell TM, Rubenstein JL, and Ericson J (1999). Homeobox gene Nkx2.2 and specification of neuronal identity by graded Sonic hedgehog signalling. Nature 398, 622–627. [DOI] [PubMed] [Google Scholar]
- 69.Pla R, Stanco A, Howard MA, Rubin AN, Vogt D, Mortimer N, Cobos I, Potter GB, Lindtner S, Price JD, et al. (2018). Dlx1 and Dlx2 Promote Interneuron GABA Synthesis, Synaptogenesis, and Dendritogenesis. Cereb. Cortex 28, 3797–3815. [DOI] [PMC free article] [PubMed] [Google Scholar]
- 70.Lindtner S, Catta-Preta R, Tian H, Su-Feher L, Price JD, Dickel DE, Greiner V, Silberberg SN, McKinsey GL, McManus MT, et al. (2019). Genomic Resolution of DLX-Orchestrated Transcriptional Circuits Driving Development of Forebrain GABAergic Neurons. Cell Rep. 28, 2048–2063.e8. [DOI] [PMC free article] [PubMed] [Google Scholar]
- 71.Prokesch A, Bogner-Strauss JG, Hackl H, Rieder D, Neuhold C, Walenta E, Krogsdam A, Scheideler M, Papak C, Wong W-C, et al. (2011). Arxes: retrotransposed genes required for adipogenesis. Nucleic Acids Res. 39, 3224–3239. [DOI] [PMC free article] [PubMed] [Google Scholar]
- 72.Jager P, Moore G, Calpin P, Durmishi X, Salgarella I, Menage L, Kita Y, Wang Y, Kim DW, Blackshaw S, et al. (2021). Dual midbrain and forebrain origins of thalamic inhibitory interneurons. eLife 10, e59272. 10.7554/eLife.59272. [DOI] [PMC free article] [PubMed] [Google Scholar]
- 73.Mathis A, Mamidanna P, Cury KM, Abe T, Murthy VN, Mathis MW, and Bethge M (2018). DeepLabCut: markerless pose estimation of user-defined body parts with deep learning. Nat. Neurosci. 21, 1281–1289. [DOI] [PubMed] [Google Scholar]
- 74.Hippenmeyer S (2023). Principles of neural stem cell lineage progression: Insights from developing cerebral cortex. Curr. Opin. Neurobiol. 79, 102695. [DOI] [PubMed] [Google Scholar]
- 75.Zhang X, Leavey P, Appel H, Makrides N, and Blackshaw S (2023). Molecular mechanisms controlling vertebrate retinal patterning, neurogenesis, and cell fate specification. Trends Genet. 39, 736–757. [DOI] [PMC free article] [PubMed] [Google Scholar]
- 76.Zhang Y-H, Xu M, Shi X, Sun X-L, Mu W, Wu H, Wang J, Li S, Su P, Gong L, et al. (2021). Cascade diversification directs generation of neuronal diversity in the hypothalamus. Cell Stem Cell 28, 1483–1499.e8. [DOI] [PubMed] [Google Scholar]
- 77.Arendt D, Musser JM, Baker CVH, Bergman A, Cepko C, Erwin DH, Pavlicev M, Schlosser G, Widder S, Laubichler MD, and Wagner GP (2016). The origin and evolution of cell types. Nat. Rev. Genet. 17, 744–757. [DOI] [PubMed] [Google Scholar]
- 78.Arendt D, Bertucci PY, Achim K, and Musser JM (2019). Evolution of neuronal types and families. Curr. Opin. Neurobiol. 56, 144–152. [DOI] [PMC free article] [PubMed] [Google Scholar]
- 79.Hong S-B (2023). Thalamocortical functional connectivity in youth with attention-deficit/hyperactivity disorder. J. Psychiatry Neurosci. 48, E50–E60. [DOI] [PMC free article] [PubMed] [Google Scholar]
- 80.McAlonan K, Cavanaugh J, and Wurtz RH (2006). Attentional modulation of thalamic reticular neurons. J. Neurosci. 26, 4444–4450. [DOI] [PMC free article] [PubMed] [Google Scholar]
- 81.Wood ET, Cummings KK, Jung J, Patterson G, Okada N, Guo J, O’Neill J, Dapretto M, Bookheimer SY, and Green SA (2021). Sensory over-responsivity is related to GABAergic inhibition in thalamocortical circuits. Transl. Psychiatry 11, 39. [DOI] [PMC free article] [PubMed] [Google Scholar]
- 82.Wells MF, Wimmer RD, Schmitt LI, Feng G, and Halassa MM (2016). Thalamic reticular impairment underlies attention deficit in Ptchd1(Y/-) mice. Nature 532, 58–63. [DOI] [PMC free article] [PubMed] [Google Scholar]
- 83.Jones NP, Versace A, Lindstrom R, Wilson TK, Gnagy EM, Pelham WE Jr., Molina BSG, and Ladouceur CD (2020). Reduced Activation in the Pallidal-Thalamic-Motor Pathway Is Associated With Deficits in Reward-Modulated Inhibitory Control in Adults With a History of Attention-Deficit/Hyperactivity Disorder. Biol. Psychiatry Cogn. Neurosci. Neuroimaging 5, 1123–1133. [DOI] [PMC free article] [PubMed] [Google Scholar]
- 84.Chaste P, Nygren G, Anckarsäter H, Råstam M, Coleman M, Leboyer M, Gillberg C, and Betancur C (2007). Mutation screening of the ARX gene in patients with autism. Am. J. Med. Genet. B Neuropsychiatr. Genet. 144B, 228–230. [DOI] [PMC free article] [PubMed] [Google Scholar]
- 85.Sherr EH (2003). The ARX story (epilepsy, mental retardation, autism, and cerebral malformations): one gene leads to many phenotypes. Curr. Opin. Pediatr. 15, 567–571. [DOI] [PubMed] [Google Scholar]
- 86.Lim Y, Akula SK, Myers AK, Chen C, Rafael KA, Walsh CA, Golden JA, and Cho G (2024). ARX regulates cortical interneuron differentiation and migration. Preprint at: bioRxiv. 10.1101/2024.01.31.578282 [DOI] [Google Scholar]
- 87.Staudt N, and Houart C (2007). The prethalamus is established during gastrulation and influences diencephalic regionalization. PLoS Biol. 5, e69. [DOI] [PMC free article] [PubMed] [Google Scholar]
- 88.Sunnen CN, Simonet JC, Marsh ED, and Golden JA (2014). Arx is required for specification of the zona incerta and reticular nucleus of the thalamus. J. Neuropathol. Exp. Neurol. 73, 253–261. [DOI] [PMC free article] [PubMed] [Google Scholar]
- 89.Jang S-S, Takahashi F, and Huguenard JR (2025). Reticular Thalamic Hyperexcitability Drives Autism Spectrum Disorder Behaviors in the Cntnap2 Model of Autism. Preprint at: bioRxiv. 10.1101/2025.03.21.644680 [DOI] [Google Scholar]
- 90.Pan L, Deng M, Xie X, and Gan L (2008). ISL1 and BRN3B co-regulate the differentiation of murine retinal ganglion cells. Development 135, 1981–1990. [DOI] [PMC free article] [PubMed] [Google Scholar]
- 91.Humphreys BD, Lin S-L, Kobayashi A, Hudson TE, Nowlin BT, Bonventre JV, Valerius MT, McMahon AP, and Duffield JS (2010). Fate tracing reveals the pericyte and not epithelial origin of myofibroblasts in kidney fibrosis. Am. J. Pathol. 176, 85–97. [DOI] [PMC free article] [PubMed] [Google Scholar]
- 92.Kwan KM, and Behringer RR (2002). Conditional inactivation of Lim1 function. Genesis 32, 118–120. [DOI] [PubMed] [Google Scholar]
- 93.Balderes DA, Magnuson MA, and Sussel L (2013). Nkx2.2:Cre knock-in mouse line: a novel tool for pancreas- and CNS-specific gene deletion. Genesis 51, 844–851. [DOI] [PMC free article] [PubMed] [Google Scholar]
- 94.Hoang T, Kim DW, Appel H, Ozawa M, Zheng S, Kim J, and Blackshaw S (2023). Ptbp1 deletion does not induce astrocyte-to-neuron conversion. Nature 618, E1–E7. [DOI] [PMC free article] [PubMed] [Google Scholar]
- 95.Korsunsky I, Millard N, Fan J, Slowikowski K, Zhang F, Wei K, Baglaenko Y, Brenner M, Loh P-R, and Raychaudhuri S (2019). Fast, sensitive and accurate integration of single-cell data with Harmony. Nat. Methods 16, 1289–1296. [DOI] [PMC free article] [PubMed] [Google Scholar]
- 96.Hao Y, Stuart T, Kowalski MH, Choudhary S, Hoffman P, Hartman A, Srivastava A, Molla G, Madad S, Fernandez-Granda C, and Satija R (2024). Dictionary learning for integrative, multimodal and scalable single-cell analysis. Nat. Biotechnol. 42, 293–304. [DOI] [PMC free article] [PubMed] [Google Scholar]
- 97.Wolf FA, Angerer P, and Theis FJ (2018). SCANPY: large-scale single-cell gene expression data analysis. Genome Biol. 19, 15. [DOI] [PMC free article] [PubMed] [Google Scholar]
- 98.Dervinis M, and Major G (2024). A novel method for reliably measuring miniature and spontaneous postsynaptic potentials/currents in whole-cell patch clamp recordings in the central nervous system. Preprint at: bioRxiv. 10.1101/2022.03.20.485046 [DOI] [PMC free article] [PubMed] [Google Scholar]
Associated Data
This section collects any data citations, data availability statements, or supplementary materials included in this article.
Supplementary Materials
Data Availability Statement
Data: all raw sequencing data, including scRNA-seq and scATAC-seq datasets, have been deposited in the NCBI Gene Expression Omnibus (GEO) under accession number GSE284492.
Code: this paper does not report original code. Complete analysis code and workflows are available at https://github.com/dkim195/HyDD2.
Other: processed Seurat objects and annotated datasets are hosted on Zenodo (https://doi.org/10.5281/zenodo.14292830).