

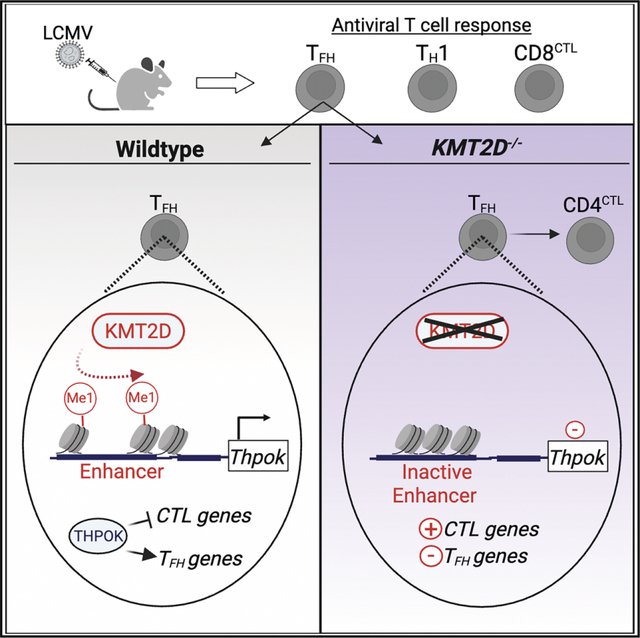
SUMMARY
T follicular helper (TFH) cells are essential for protective antibody responses. Histone modifications direct TFH development and function; however, the role of specific chromatin modifiers in this process is not well understood. Lysine methyltransferase 2D (KMT2D) is a histone methyltransferase that acts at H3K4 to promote gene expression. Herein, we examined the contribution of KMT2D to T cell responses during acute lymphocytic choriomeningitis virus infection. Mice lacking KMT2D in T cells generated sufficient antiviral CD8+ T cell responses to resolve infection. However, these mice formed fewer TFH cells and had diminished germinal center and antibody responses. Mechanistically, KMT2D sustained TFH responses in part by promoting Thpok and Il21 expression through H3K4Me1 deposition at gene enhancers. Consistent with loss of THPOK, KMT2D-deficient CD4+ T cells acquired a cytotoxic CD4+ T (CD4CTL) cell phenotype involving elevated expression of RUNX3, EOMES, and cytolytic molecules. Our findings show KMT2D balances TFH development and humoral immunity over CD4CTL cells.
In brief
Distinct subsets of T cells confer immune protection against infections. Histone modifiers integrate TCRs and other signaling pathways with transcription factors to specify each subset and its function. Herein, Cohen et al. reveal a central role for KMT2D in advancing TFH formation and antibodies while restricting cytolytic Th subsets.
Graphical Abstract
INTRODUCTION
Durable and high-affinity antibody responses are important for efficient control of virus infection and can provide lasting protection after vaccination or primary infection.1,2 These antibody responses depend upon CD4+ T follicular helper (TFH) cells that express C-X-C motif chemokine receptor 5 (CXCR5) and migrate into the B cell follicles to coordinate germinal center (GC) reactions. Within the GC, TFH cells deliver critical signals to cognate B cells that are required for the development of affinity-matured antibodies, long-lived plasma cells, and memory B cells.3–7
Virus-specific CD4+ T cells can also differentiate into the T helper 1 (TH1) lineage that promotes antiviral CD8+ T cell responses and supports cellular defenses at sites of infection. TFH and TH1 lineages are defined by their expression of the master transcriptional regulators B cell lymphoma 6 (BCL6) and T-box 21 (Tbet), respectively.8 Naive CD4+ T cells that receive signals through surface receptors such as ICOS and interleukin (IL)-6 receptor (IL-6R) upregulate BCL6 and differentiate into TFH cells.9–11 Other critical transcription factors, such as BATF, cMAF, TCF1/LEF1, TOX2, and THPOK, act upstream and/or in parallel to BCL6 to support TFH differentiation and function.12–16 In contrast, signals such as IL-2, IL-12, interferon (IFN)-γ, and type I IFN promote TH1 differentiation by upregulating the expression of Tbet and BLIMP1.17–20
CD4+ T cell differentiation into distinct TH lineages is enabled by epigenetic changes, including histone modifications, that alter chromatin accessibility and direct transcription factor binding.21 In TFH cells, activating histone marks such as histone 3 (H3) lysine 27 (K27) acetylation (H3K27Ac) and H3K4 mono- (Me1) and tri- (Me3) methylation are enriched at the enhancer and promoters of highly transcribed genes such as Il21 and Bcl6. In contrast, genes associated with other TH lineages, such as Prdm1 and Runx3, are kept in an inactive or poised configuration through a combination of repressive H3K27Me3 and activating histone marks.22–25 Collectively, these epigenetic marks may facilitate TFH gene expression and predispose TFH cells toward expression of alternative helper cell programs under certain inflammatory conditions.
Despite these initial chromatin studies, relatively little is known about how specific histone-modifying proteins program TFH responses. KMT2A (MLL1) promotes initial TFH differentiation by upregulating TCF1 expression.26 The H3K27me3 methyltransferase EZH2 cooperates with TCF1 to promote BCL6 expression and separately represses inhibitors of TFH differentiation and survival.25,27,28 Our group previously found that UTX was critical for sustaining TFH responses during chronic virus infection by promoting IL-6Ra expression through its H3K27 demethylase activity.29
UTX acts as part of a larger epigenetic complex that includes histone lysine methyltransferase 2D (KMT2D), an H3K4 mono-methyltransferase.30,31 KMT2D and UTX cooperatively promote cell-type-specific enhancer activation through complementary histone modifications and scaffolding activity.30,32–34 Germline mutations in KMT2D and UTX cause Kabuki syndrome, a rare multisystem disorder that frequently presents with low antibody titers and poor vaccine responses.35,36 KMT2D also has distinct functions compared to UTX in many developmental or disease settings.30,37–40
A growing body of work implicates KMT2D in immunity. KMT2D regulates B cell gut homing, GC proliferation, and plasma cell differentiation.41–43 Among developing T cells, KMT2D promotes regulatory T cell (Treg) differentiation and thymic egress.44,45 During Listeria monocytogenes infection, KMT2D increases the survival of activated CD8+ T cells.46 KMT2D-primed enhancers had varying effects on TH1/TH2 gene expression in CD4+ T cells that were cultured with polarizing cytokines.47,48 However, whether KMT2D is needed for CD4+ T helper cell responses in vivo is not known.
Here, we explored the role of KMT2D in virus-specific CD4+ and CD8+ T cells during lymphocytic choriomeningitis virus (LCMV)-Armstrong infection. Mice with a T cell-specific deletion of KMT2D (KMT2DTCD) efficiently controlled the infection due to a largely intact antiviral CD8+ T cell response. However, KMT2DTCD mice showed defects in the formation of virus-specific TFH cells and associated GC and antibody responses that coincided with an outgrowth of cytotoxic CD4+ T (CD4CTL) cells. Correspondingly, KMT2D sustained the expression of genes involved in TFH development and function and limited those involved in cytotoxicity. Our findings link CD4+ T cell expression of KMT2D to humoral immune defenses.
RESULTS
Antiviral CD8+ T cells do not require KMT2D expression to resolve acute LCMV infection
To assess whether KMT2D is important for antiviral T cell responses, we generated mice with a T cell-specific deficiency in KMT2D (KMT2DTCD; B6.Lck-Cre+;Kmt2dfl/fl) by intercrossing Kmt2dfl/fl mice that harbor loxP sites flanking exons 50–51 with mice carrying an Lck-Cre transgene. Wild-type (WT; either B6. Lck-Cre+;Kmt2dWT/WT or B6.Lck-Cre-;Kmt2dfl/fl) and KMT2DTCD mice were infected with LCMV-Armstrong, which causes a systemic virus infection that is normally resolved within ~8 days in C57BL/6 mice by CD8+ T cells.
Virus was undetectable by plaque assay in the sera of 11/13 mice from both groups, indicating that T cell expression of KMT2D was not required to control LCMV-Armstrong infection (Figure 1A). Both groups contained similar numbers of total activated CD4+ T cells, whereas KMT2DTCD mice had a modest decrease in activated CD8+ T cells (Figure 1B). We used qPCR to verify efficient deletion of Kmt2d by measuring the relative amount of genomic Kmt2d exons 50–51, which tightly correlates with KMT2D protein levels.49 Kmt2d deletion ranged from 50% to 99% for both activated CD4+ and CD8+ T cell subsets, and the majority of KMT2D samples showed >95% deletion (Figure 1C). Consistent with loss of KMT2D methyltransferase activity, activated CD4+ and CD8+ T cells from KMT2DTCD mice had a highly significant reduction in H3K4Me1 compared to WT (Figure 1D).
Figure 1. CD4+ T cells in KMT2DTCD mice have modestly reduced cytokine expression.

WT and KMT2DTCD mice were infected with LCMV-Armstrong. At 8–9 days after infection, viral titers in the serum, splenic T cell numbers, and CD4+ T cell cytokine expression were quantified.
(A) Amounts of infectious virus in sera were determined by plaque assay. The limit of detection is 50 plaque-forming units (PFU)/mL serum.
(B) Number of activated CD4+CD44hi and CD8+CD44hi T cells per spleen.
(C) qPCR was used to quantify the amount of KMT2D exons 50–51 in genomic DNA from CD8+CD44hi and CD4+CD44hi T cells. To account for differences in starting material, KMT2D exon 50–51 Ct values were normalized against an unrelated genomic region.
(D) The flow histogram shows H3K4Me1 expression among CD4+CD44hi T cells. The graph shows the gMFI of H3K4Me1 among CD8+CD44hi and CD4+CD44hi T cells.
(E) Flow plots show CD4+ T cells bound by I-Ab GP66–77 tetramer (GP66+), and the graph shows numbers of GP66+ cells per spleen.
(F) Splenocytes were stimulated ex vivo with GP61–80 peptide and analyzed for cytokine expression. Flow plots show CD4+ T cells expressing IFN-γ and IL-2. The graphs show the number of CD4+ cells expressing the indicated cytokine and the gMFI of cytokines among cytokine+ cells.
(G) Number of polyfunctional CD4+ T cells that co-express IFN-γ, TNF, and IL-2 after GP61–80 peptide stimulation.
For (C), data are from 1 experiment with 4 mice per group. (D) shows 1 of 3 representative experiments with 4–6 mice per group per experiment. (B) and (E) are pooled from 5–6 independent experiments with 3–6 mice per group per experiment. (F) and (G) are pooled from 3 independent experiments with 3–6 mice per group per experiment. Error bars depict mean ± SEM. Significance was determined using an unpaired Mann-Whitney U test (A) or unpaired Student’s t test (B–G) (*p < 0.05, **p < 0.01, ***p < 0.001, and ****p < 0.0001). gMFI, geometric mean fluorescence intensity.
See also Figures S1 and S2.
Both groups generated similar numbers of DbGP33–41 and DbNP396–404 tetramer+ CD8+ T cells in the spleen by days 8–9 post-infection, although there was a trend toward decreased DbNP396–404 in KMT2DTCD mice (Figure S1A). DbGP33–41+ CD8+ T cells from each group expressed similar amounts of granzyme B (GZMB), suggesting comparable cytotoxic potential (Figure S1B). However, CD8+ T cells in KMT2DTCD mice had impaired expression of IFN-γ and tumor necrosis factor (TNF) after ex vivo stimulation with LCMV peptides GP33, NP396, and NP205, although this varied based on the epitope and cytokine measured (Figure S1C). The reduction in cytokine expression was likely unrelated to effector cell differentiation because there were only minor differences in the percentage of short-lived and memory-precursor effector cells among only DbNP396–404+ CD8+ T cells (Figure S1D). Similar trends for CD8+ T cell numbers and cytokine expression were observed at day 15 post-infection (Figures S1E and S1F).
We considered that the impaired expression of cytokines by CD8+ T cells in KMT2DTCD mice might be due to alterations in the CD4+ T cell compartment. Therefore, we directly measured the CD8+ T cell-intrinsic function of KMT2D by engrafting WT and KMT2DTCD CD8+ P14 cells (which express a T cell receptor [TCR] transgene recognizing the GP33–41 epitope) into WT hosts, which were subsequently infected with LCMV (Figure S2A). At day 7 post-infection, the phenotype of KMT2DTCD P14 cells in the spleen and blood broadly recapitulated that of endogenous GP33-specific CD8+ T cells from KMT2DTCD mice, including relatively normal granzyme expression and short-lived effector cell (SLEC) and memory precursor effector cell (MPEC) distribution but diminished cytokine expression (Figures S2B–S2D). Taking these results together, we find that KMT2D is dispensable for CD8+ T cell expansion, cytotoxicity, and clearance of acute virus infection but does support the expression of inflammatory cytokines. Given the relatively minor impact of KMT2D on CD8+ T cells, we focused the remainder of our study on the primary antiviral CD4+ T cell response.
CD4+ T cell co-expression of pro-inflammatory cytokines is reduced in KMT2DTCD mice
CD4+ T cells coordinate immune responses through the expression of cytokines and surface ligands that provide help to multiple cell types, including B cells and CD8+ T cells. At 8–9 dpi, both groups contained similar numbers of I-AbGP66–77-tetramer+ (GP66+) CD4+ T cells in the spleen that recognize the immunodominant major histocompatibility complex (MHC) class II LCMV epitope (Figure 1E). In an intracellular cytokine staining (ICCS) assay, virus-specific CD4+ T cells from KMT2DTCD mice expressed normal amounts of IFN-γ but lower amounts of TNF and IL-2 on a per-cell basis following stimulation with the GP61–80 peptide compared to the WT (Figure 1F). Polyfunctional CD4+ T cells expressing all three cytokines are associated with superior antiviral immune responses,50,51 and we observed fewer polyfunctional CD4+ T cells in KMT2DTCD mice compared to WT (Figure 1G). Thus, similar to CD8+ T cells (Figures S1 and S2), KMT2D is dispensable for virus-specific CD4+ T cell proliferative expansion but needed for optimal co-expression of multiple cytokines.
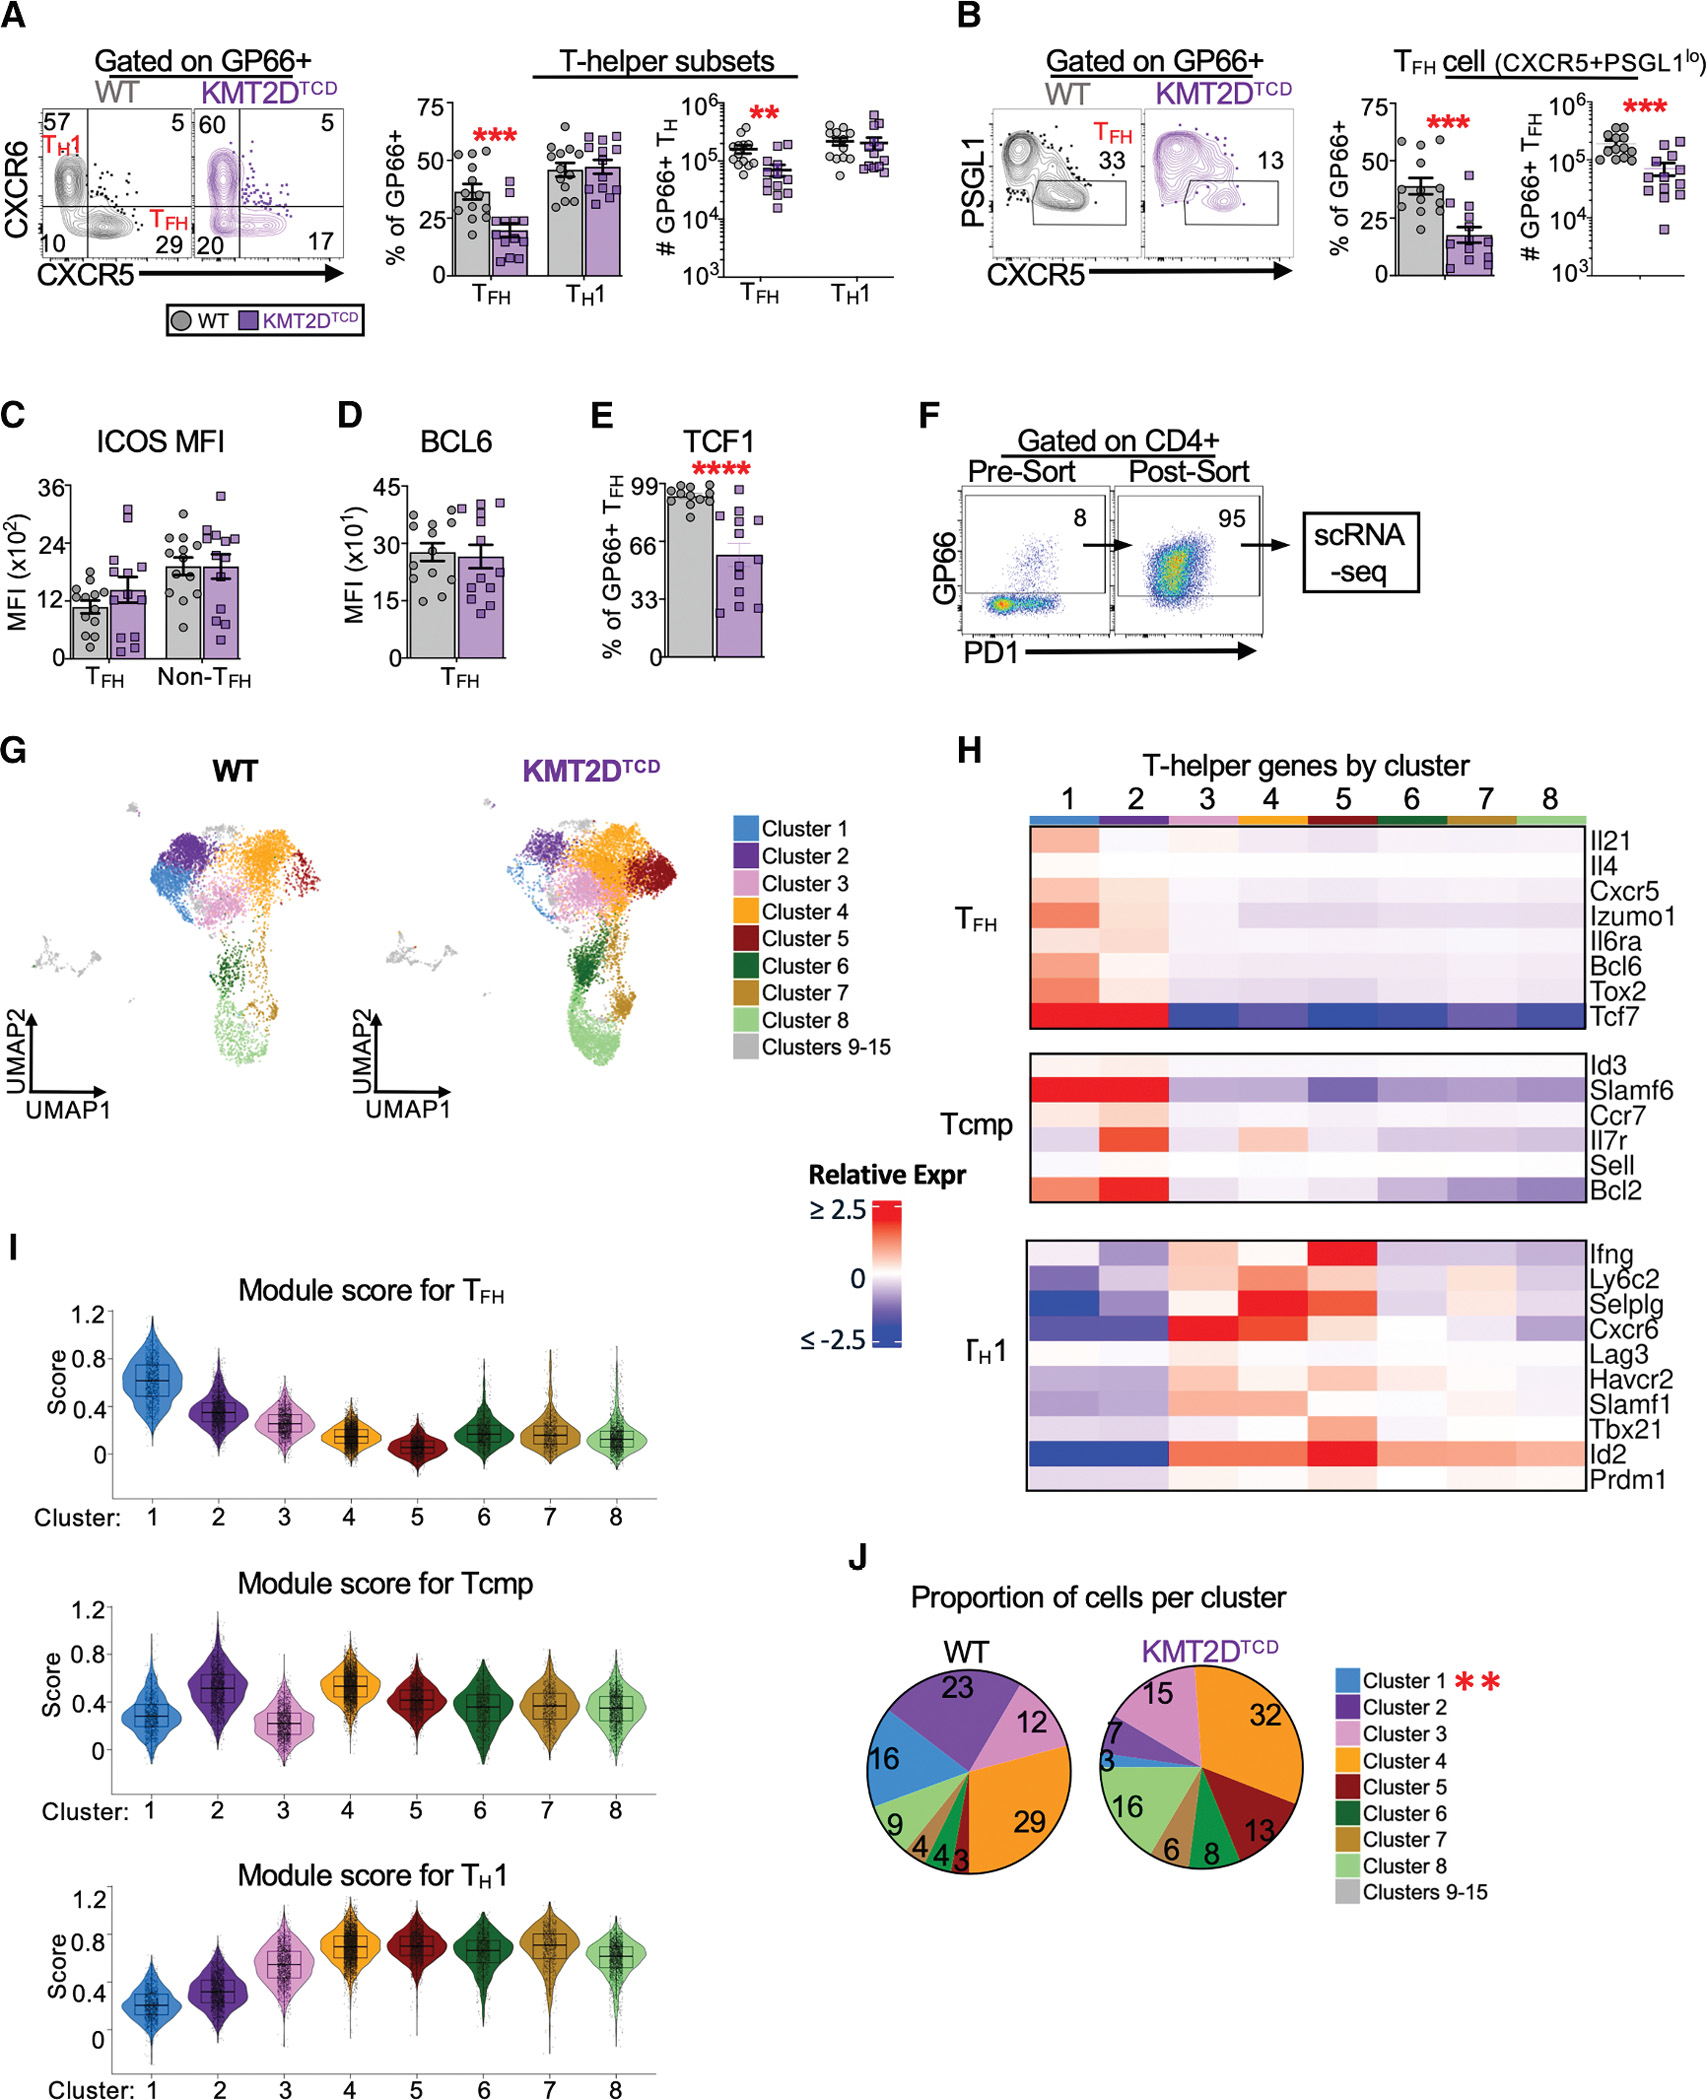
KMT2DTCD mice have impaired TFH cell responses
Given that KMT2D-deficient CD4+ T cells made less cytokine than WT, we next assessed whether KMT2D is important for establishing virus-specific TFH and TH1 cells. TH subsets can be distinguished by their differential expression of surface markers.52–58 TFH cells (identified as CXCR5+CXCR6− or CXCR5+PSGL1lo) and TH1 cells (CXCR5−CXCR6+) were found in the spleens of WT mice after infection (Figures 2A and 2B). In comparison, KMT2DTCD mice had ~2- to 3-fold fewer TFH cells but normal numbers of TH1 cells (Figures 2A and 2B). Alternative gating strategies identifying TFH and TH1 cells through expression of CXCR5, SLAM, and FR4 yielded similar results (Figures S3A and S3B). Interestingly, KMT2DTCD mice had significantly fewer virus-specific PSGL1hiLy6Chi CD4+ T cells (Figure S3C), a terminally differentiated subset of TH1 cells that produce the highest amount of IFN-γ.59 However, considering that CD4+ T cell expression of IFN-γ was comparable between groups (Figure 1F), it may be that KMT2D regulates Ly6C expression rather than terminal TH1 differentiation. Virus-specific T helper cell responses were not simply delayed in KMT2DTCD mice because the overall numbers of GP66+ CD4 T cells were significantly decreased in KMT2DTCD mice compared to the WT at 15 days post-infection (dpi) (Figure S3D), and this was largely due to a decrease in TFH cells, although we cannot rule out defects in early memory formation (Figure S3E).
Figure 2. KMT2D promotes TFH responses during acute viral infection.
The abundance of splenic LCMV-specific T helper cells and their expression of critical transcription factors and surface receptor ligands were analyzed by flow and scRNA-seq at 8–10 dpi.
(A) Flow plots show CD4+GP66+ cells expressing CXCR5 and CXCR6 with quadrant gates set to discriminate TFH (CXCR5+CXCR6−) and TH1 (CXCR5−CXCR6+) cells. Using this gating strategy, the graphs show the percentage of CD4+GP66+ T cells that are TFH and TH1 and the number of CD4+GP66+ TFH and TH1 cells per spleen.
(B) Flow plots show splenic CD4+GP66+ cells expressing PSGL1 and CXCR5 with gates set on TFH (PSGL1loCXCR5+). Using this gating strategy, the graphs show the percentage of CD4+GP66+ T cells that are TFH and the number of GP66+ TFH cells per spleen.
(C) The gMFI of ICOS among GP66+ TFH (CXCR5+) and non-TFH (CXCR5−) cells.
(D) The gMFI of BCL6 among GP66+ TFH cells (CXCR5+).
(E) The percentage of GP66+ TFH cells (CXCR5+) that express TCF1 in each group.
(F) GP66-tetramer+ CD4+ T cells were sorted from the spleens of WT and KMT2DTCD mice and subjected to scRNA-seq. Example flow plots show pre- and post-sort enrichment of total CD4+GP66+ T cells. The post-sort GP66+ gate was lowered slightly to account for excitation-induced photobleaching.
(G) The transcriptome of WT and KMT2D cells is represented by the UMAPs. Cell clusters were defined based on single-cell gene expression profiles and are colored according to their assigned cluster. Clusters 9–15 are colored gray and were excluded from downstream analyses.
(H) Heatmap of select TFH and TH1 genes per cluster. The heatmap intensity indicates the average expression of each indicated gene and cluster, relative to the average expression for that gene across all clusters.
(I) Violin plots of the of TFH, TCMP, and TH1 module scores in each cluster calculated using signature gene lists for each TH population obtained from Ciucci et al.60
(J) Pie charts show the proportion of cells assigned to each major cluster. Clusters that show significant differences between groups are indicated by asterisks in the legend.
Data were pooled from 3 independent experiments with 3–6 mice per group for (A)–(D). Error bars are mean ± SEM for phenotypic data. scRNA-seq data are from two samples per group. Violin plots show mean and 25th and 75th percentile expression. Significance was determined by unpaired Student’s t test (*p < 0.05, **p < 0.01, ***p < 0.001, and ****p < 0.0001). MFI, geometric mean fluorescence.
See also Figure S3.
The reduced number of TFH cells in KMT2DTCD mice at 8–9 dpi is most likely not explained by changes in regulatory subsets, TFH proliferation, or apoptosis. The frequencies of FoxP3+ T follicular regulatory (TFR) cells and Tregs were lower in KMT2DTCD mice (Figures S3F and S3G), consistent with a role for KMT2D in FoxP3 expression.44 There was a slightly increased frequency of KMT2DTCD TFH cells expressing Ki67 (Figure S3H), suggesting no defect in TFH proliferation. TFH cells (CXCR5+) in each group expressed similar amounts of the pro- and anti-apoptotic molecules BIM and BCL2, indicating that KMT2DTCD TFH cells do not have a greater propensity to undergo apoptosis at this time point. Interestingly, non-TFH cells (CXCR5−) from KMT2DTCD mice had increased BCL2 and an elevated BCL2:BIM ratio, suggesting that non-TFH cells may survive better than WT controls (Figure S3I).
Given that KMT2DTCD mice generated fewer TFH cells, we quantified the expression of a few regulators of TFH responses, including ICOS, BCL6, and TCF1. GP66+ TFH and non-TFH cells from each group expressed comparable amounts of ICOS and BCL6 (Figures 2C and 2D). In contrast, TCF1 was expressed by significantly fewer KMT2DTCD TFH cells. (Figure 2E). Thus, KMT2D appears to be dispensable for CD4+ T helper cell expansion and survival, but it may support TFH responses by promoting the expression of critical transcription factors.
Single-cell transcriptomic analyses reveal that KMT2D associates with TFH cell populations
To more broadly characterize how KMT2D impacts CD4+ T cell responses to virus infection, we performed single-cell RNA sequencing (scRNA-seq) on total GP66+ CD4+ T cells sorted from the spleens of WT and KMT2DTCD mice at 10 dpi (Figure 2F). Sequenced single cells pooled prior to sorting were demultiplexed using the Cell Ranger “multi” algorithm. After filtering low-quality single cells by a percentage of mitochondrial genes and total read and feature counts, we obtained 18,514 unique single-cell profiles (7,148 from the WT and 11,366 from the KMT2DTCD groups) (Figure S3J). Dimensionality reduction by principal-component analysis and sample integration were performed prior to uniform manifold approximation and projection (UMAP) of single-cell profiles onto 2D space. Cell clustering yielded 8 major clusters (clusters 1–8) (Figure 2G) and 7 minor clusters (9–15) consisting of only 30–100 cells per sample that were excluded from further analysis. Cluster 1 likely represented TFH-like cells based on the expression of genes such as Cxcr5, Bcl6, and Il21 and had the highest TFH gene signature score (Figures 2H and 2I). Cluster 2 cells were likely CD4+ T central memory precursor (TCMP) cells based on the high expression of genes like Ccr7, Il7r, and Tcf760 and a high TCMP signature score. Cluster 3 was similar to a previously described Lag3hi Th1 subset61 based on intermediate expression of Th1-associated genes such as Ifng and Tbx21 and high expression of Lag3 and Havcr2 (Figure 2H). Clusters 4 and 5 had high TH1 signature scores and the highest expression of critical TH1 genes, such as Ifng, Tbx21, Id2, and Ly6c2, and were likely fully differentiated TH1 cells (Figures 2H and 2I). Lastly, clusters 6, 7, and 8 were likely cycling CD4+ T cells, based on the enrichment of cell cycle genes and comparatively low expression of prototypical TFH and TH1 genes, such as Tbx21 and Bcl6 (Figures 2H, 2I, and S3K).
There were 5-fold fewer KMT2DTCD cells in cluster 1 (TFH-like) compared to the WT, and they trended toward a decrease in cluster 2 (TCMP-like) (Figure 2J). In contrast, KMT2DTCD cells trended toward an increase in clusters 4 and 5 (TH1-like), although this did not reach statistical significance. These findings are broadly consistent with our phenotypic data demonstrating that KMT2D is needed for TFH, but not TH1, responses (Figures 2A and 2B). In addition, the single-cell data show that KMT2DTCD cells may have defects in TCMP formation and have an elevated TH1-like profile, which was not previously revealed by antibody staining against a limited number of surface markers.
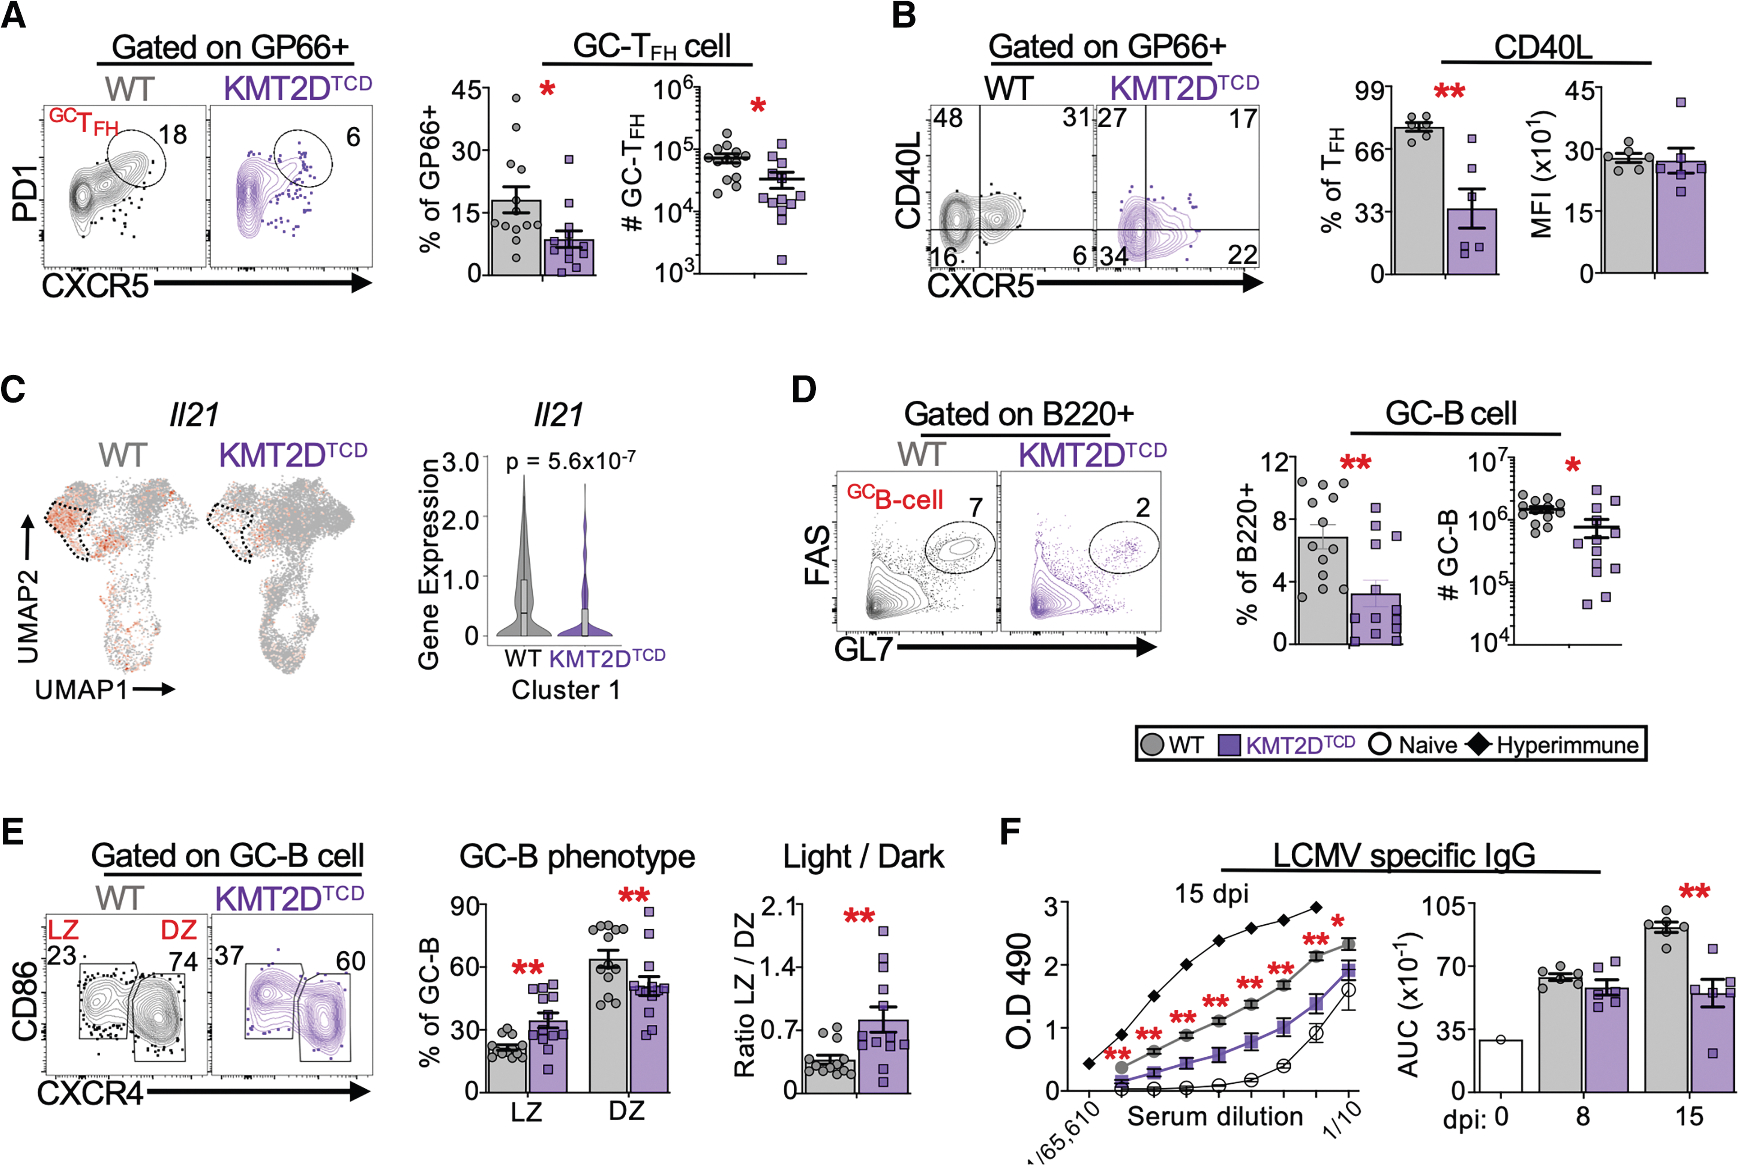
KMT2D promotes TFH functionality and the ensuing GC response
TFH development occurs in multiple stages. At the outset of infection, naive CD4+ T cells differentiate into immature TFH cells, which migrate toward lymphoid follicles and engage cognate B cells. This interaction enhances the expression of BCL6 and enables TFH maturation into GC-TFH cells that are indispensable for GC responses through the local production of factors such as CD40L and IL-21.62 Consistent with our findings above, there were significantly fewer virus-specific GC-TFH cells in KMT2DTCD compared to WT mice (Figure 3A). Fewer KMT2DTCD TFH cells expressed CD40L, although the amounts of CD40L expressed per CD40L+ cell were comparable between groups (Figure 3B). In addition, pseudobulk scRNA-seq analyses showed significantly lower expression of Il21 in the TFH-like cluster from KMT2DTCD GP66+ cells compared to the WT TFH cluster (Figure 3C; Table S1).
Figure 3. KMT2DTCD mice have reduced GC and antibody responses.
WT and KMT2DTCD mice were infected with LCMV-Armstrong. GC-TFH cells, TFH effector function, and GC-B cells were analyzed in the spleen by flow cytometry and/or scRNA-seq at day 8–9 post-infection. LCMV-specific IgG was quantified in sera at days 8 and 15 post-infection.
(A) Flow plots show GP66-tetramer+ CD4+ T cells expressing CXCR5 and PD1 (programmed cell death protein-1), with gates drawn on GC-TFH cells (CXCR5hiPD1hi). Graphs show the percentage of GP66+ GC-TFH cells among CD4+ T cells and their number per spleen at 8–9 dpi.
(B) Flow plots show endogenous GP66+ cells expressing CXCR5 and CD40L, with quadrant gates drawn to distinguish CXCR5− and CXCR5+ cells that produce CD40L. The graphs show the percentage of GP66+ TFH cells (CXCR5+) that express CD40L and the gMFI of CD40L among CD40L+ GP66+ TFH cells at 8–9 dpi.
(C) The UMAP plot shows the expression of Il21 among all tetramer+ CD4+ T cells. The dotted area outlines cluster 1 (TFH cluster) The violin plot of Il21 for cluster 1 is shown on the right, which indicates the false discovery rate (FDR)-adjusted p value for Il21 from pseudobulk differential expression analysis comparing WT and KMT2DTCD cluster 1.
(D) Flow plots show B220+ cells expressing FAS and GL7, with gates drawn on GC-B cells (FAShiGL7hi). The graphs depict the percentage of B cells (B220+) that are GC-B cells and the number of GC-B cells per spleen at 8–9 dpi.
(E) Flow plots show GC-B cell expression of CXCR4 and CD86, with gates identifying light zone (LZ; CXCR4loCD86hi) and dark zone (DZ; CXCR4hiCD86lo) GC-B cells. Graphs show the percentage of GC-B cells with an LZ or DZ phenotype and the ratio of LZ/DZ GC-B per spleen.
(F) Virus-specific IgG was quantified by ELISA. The left graph shows the OD490 for serial dilutions of sera at 15 dpi; hyper-immune serum from a rechallenged LCMV-Armstrong immune WT mouse and serum from an LCMV-naive WT mouse are used for reference. Based on the dilution series, the area under the curve (AUC) was calculated for the indicated mice at 8–9 and 14–15 dpi.
scRNA-seq data in (C) are from two mice per group. All other data were pooled from 1–3 independent experiments with 3–6 mice per group per experiment. Error bars are mean ± SEM. Significance was determined using an unpaired Student’s t test (*p < 0.05 and **p < 0.01).
The diminished TFH responses in KMT2DTCD mice corresponded with an ~2- to 3-fold reduction in GC B cells (B220 +FAS+GL7+) compared to WT mice, though the total numbers of B cells (B220+) were similar in both groups (Figures 3D and S4A). The GC-B cells from KMT2DTCD mice had a relative bias toward a light zone phenotype (CXCR4loCD86hi) (Figure 3E), which can result from restricted CD40 or IL-21R signaling.63,64 In contrast, both groups had similar numbers of activated (non-GC) and resting B cells (Figures S4B and S4C). By day 15, KMT2DTCD mice continued to show fewer GC-TFH and GC-B cells (Figures S4D–S4F), although this did not reach statistical significance for GC-TFH due to an outlier. Lastly, LCMV-specific immunoglobulin G (IgG) levels were significantly lower in KMT2DTCD mice at day 15 post-infection (Figure 3F), a time point when GC output should substantially contribute to the circulating pool of virus-specific antibodies. Collectively, these findings suggest that KMT2D promotes TFH development, function, and the ensuing GC and antibody responses.
CD4+ T cell-intrinsic expression of KMT2D is needed for TFH responses
CD4+ T cell differentiation is strongly influenced by the immunological microenvironment. We considered that our previous findings might be due to extrinsic factors, such as decreased CD8+ T cell cytokine expression (Figures S1F and S2C) and Tregs (Figures S3F and S3G), that collectively impair TFH responses in KMT2DTCD mice. Alternatively, CD4+ T cell-intrinsic expression of KMT2D may be needed for TFH cell formation and effector function. To distinguish between these possibilities, we performed adoptive transfers of CD4+ SMARTA transgenic cells that express an LCMV-specific TCR recognizing the GP66–77 epitope. Equal numbers of WT and KMT2DTCD SMARTA cells (CD45.1+) were engrafted into separate B6 hosts (CD45.2+), which were subsequently infected with LCMV; donor cell phenotypes were analyzed 7–8 days later (Figure 4A).
Figure 4. CD4+ T cell-intrinsic expression of KMT2D is needed for TFH responses.

WT or KMT2D-deficient SMARTA cells were introduced into congenic (CD45.2+) mice followed by LCMV-Armstrong infection 1 day later. At days 7–8 post-infection, SMARTA cells were identified in the spleens of host mice by flow cytometry, along with their expression of cytokines, TFH and TH1 differentiation, critical surface receptor ligands, and transcription factors.
(A) Illustration of the experimental setup.
(B) Flow plots of CD4+ cells showing CD4 and CD45.1 expression, with gates set on CD4+CD45.1+ donor SMARTA cells. The graphs show the number of donor cells per spleen and their percentage among total splenic CD4+ cells.
(C) Splenocytes were stimulated ex vivo with GP61–80 peptide, and donor cells were analyzed for cytokine expression. The left graph shows the frequency of donor cells expressing IFN-γ, TNF, and IL-2. The middle graph shows the gMFI of IFN-γ, TNF, and IL-2 among IFN-γ+, TNF+, and IL-2+ donor cells, respectively. The right graph shows the percentage of donor cells that co-express IFN-γ, TNF, and IL-2.
(D) The flow plots show donor cell expression of CXCR5 and CXCR6 with quadrant gates set to discriminate TFH (CXCR5+CXCR6−) and TH1 (CXCR5−CXCR6+) subsets. Using this gating strategy, the graphs show the percentage of donor cells that are TFH or TH1.
(E) Graphs show the percentage of donor cells that are TFH (CXCR5+PSGL1lo).
(F) Graphs show the percentage of donor TFH cells (CXCR5+) that express CD40L and the gMFI of CD40L among CD40L+ donor TFH cells.
(G) Splenocytes were stimulated ex vivo with GP61–80 peptide and analyzed for cytokine expression. Flow plots show donor TFH (CXCR5+) expression of IL-21 and CD4, with gates set on IL-21+ donor TFH cells. The graphs show the percentage of donor TFH cells expressing IL-21 and the gMFI of IL-21 among IL-21+ donor TFH cells.
(H) Graphs show the gMFI of TCF1, ICOS, and BCL6 among donor TFH cells (CXCR5+).
Data in (A)–(F) and (H) were pooled from 2 independent experiments with 3–4 mice per group per experiment. Data in (G) are from 1 experiment with 3–4 mice per group. Error bars depict mean ± SEM. Significance was determined using an unpaired Student’s t test (*p < 0.05, **p < 0.01, ***p < 0.001, and ****p < 0.0001).
See also Figure S4.
The KMT2DTCD SMARTA cell phenotype broadly recapitulated our findings for endogenous antiviral CD4+ T cell responses in KMT2DTCD mice, with some exceptions. The donor cells, identified by co-staining for CD4 and CD45.1, showed comparable engraftment in uninfected recipients (Figure S4G) and expanded similarly after infection (Figure 4B). H3K4Me1 was uniformly reduced in the KMT2D−/− SMARTA group (Figure S4H), indicating that there was no selective outgrowth of cells lacking sufficient Cre recombinase activity and retaining KMT2D expression during infection. These data indicate that KMT2DTCD SMARTA donors effectively compete with WT host cells for survival and proliferation cues.
Similar to our earlier findings, we observed a modest decrease in the percentage of KMT2DTCD donor cells expressing IFN-γ, TNF, or IL-2 after GP61–80 stimulation, and lower amounts of IL-2 were made in KMT2DTCD donor cells on a per-cell basis. Moreover, there were ~10-fold fewer polyfunctional KMT2DTCD donor cells compared to the WT (Figure 4C). A significantly lower percentage of KMT2DTCD donors were TFH cells, whereas the percentages of TH1 cells were equivalent between groups (Figures 4D and 4E). Fewer KMT2DTCD donor TFH cells produced CD40L and IL-21 (Figures 4F and 4G), and KMT2DTCD donor TFH expressed lower amounts of TCF1 (Figure 4H). In contrast to endogenous KMT2DTCD responses, KMT2DTCD SMARTA TFH cells had significantly increased expression of ICOS and BCL6 (Figure 4H). Although it is unclear why these two factors were elevated in this context, it is notable that elevated ICOS and BCL6 failed to overcome the TFH defect in the KMT2DTCD SMARTA group. It may be that ICOS- and BCL6-mediated gene regulation improperly functions in the absence of KMT2D. Collectively, these findings suggest that CD4+ T cell-intrinsic expression of KMT2D is necessary for TFH development and function during acute virus infection.
KMT2D limits the formation of CD4CTL cells during infection
Pseudobulk differential gene expression analyses of the scRNA-seq data (Figure 2) revealed that KMT2DTCD cells highly overexpressed genes associated with CD4CTL cells in every major cluster. For example, the transcription factors Runx3, Eomes, and Zeb2 were elevated in KMT2DTCD cells, as were the effector genes Gzma, Gzmb, Gzmk, Prf1, and Fasl (Figure 5A; Table S1). The relative expression of cytotoxic genes was highest in cluster 5 (the TH1-like cluster), followed by clusters 3, 4, 6, 7, and 8, and was lowest in cluster 1 (the TFH-like cluster) (Figure 5B).
Figure 5. KMT2D limits the formation of cytotoxic CD4+ T cells.

In (A)–(I), WT and KMT2DTCD mice were infected with LCMV-Armstrong. At days 8–11 post-infection, flow cytometry, scRNA-seq, and CUT&Tag analyses were used to analyze cytolytic molecules and transcription factors in splenic CD4+ T cells. (H) compares gene expression in KMT2DTCD TFH-like cells and ThPOK−/− TFH cells. In (J), WT and KMT2DTCD SMARTA cells were retrovirally transduced with THPOK overexpression vector (THPOK-OE) and analyzed for TFH differentiation in host spleens 8 days after transfer.
(A) Heatmap shows pseudobulk differential expression analysis of cytotoxicity-associated genes that are overexpressed in KMT2DTCD cells. The heatmap intensity indicates the log2 fold change in expression of KMT2DTCD over WT cells in the same cluster.
(B) Violin plots of cytotoxic genes across each major cluster; boxplots depict the 25th and 75th percentiles of expression.
(C) The percentage of GP66+ cells that expressed GZMB based on flow cytometry.
(D) The flow plot shows polyclonal PD1+ CD4+ T cells expressing CXCR5 and PERFORIN, with quadrant gates distinguishing PERFORIN+ TFH (CXCR5+) and non-TFH (CXCR5−) cells. Graphs show the number of polyclonal TFH and non-TFH cells that expressed PERFORIN per spleen and the percentage of CD4+ TFH and non-TFH cells that express PERFORIN at 8–9 dpi.
(E) The number of GP66+ TFH and non-TFH cells that expressed EOMES per spleen and the percentage of GP66+ TFH and non-TFH cells that expressed EOMES at 8–9 dpi.
(F) The expression of Thpok among all tetramer+ CD4+ T cells is depicted by UMAP.
(G) Flow plots show GP66+ CD4+ T cells expressing THPOK and EOMES, with gates drawn on THPOK+ cells at 8 dpi. The left graphs show the percentage of GP66+ cells that express THPOK and the gMFI of THPOK among THPOK+ GP66+ cells at 8–11 dpi. Right graphs show THPOK expression in CD4+ T cells from uninfected mice.
(H) The regression analysis compares Z-normalized log2 fold expression changes of all cluster 1 DEGs from KMT2DTCD cluster 1 and Tbet-deficient TFH cells. Each dot represents the Z score of a gene. Selected genes are annotated in red text on the scatterplot.
(I) H3K4Me1 enrichment at several genomic loci was measured by CUT&Tag followed by qPCR in CD44hiCD4+ T cells at 9 dpi.
(J) The top row shows the illustration of the experimental setup. The flow plots show THPOK-OE transduced WT and KMT2DTCD donor cells that are GFP+ and GFP− and expressing CXCR5 and CXCR6. Graphs show the percentages of GFP+ and GFP−cells from each donor group that are TFH cells (CXCR5+CXCR6−) in both empty control and THPOK-OE transduction conditions.
Data in (C)–(E), (I), and (J) were pooled from 1–2 independent experiments with 3–6 mice per group; data in (G) were pooled from 2–4 independent experiments performed on day 0 and days 8–11 post-infection, respectively. gMFI values in (G) at 8–11 dpi show 2 of 4 representative experiments. Significance was determined by paired (J) or unpaired (C–G and I) Student’s t test (*p < 0.05, **p < 0.01, ***p < 0.001, and ****p < 0.0001). scRNA-seq data represented in (A), (B), (F), and (H) are from two samples per group, and DEGs were determined by DESeq2 (FDR < 0.05).
See also Figures S5 and S7.
EOMES can drive CD4CTL formation and function during LCMV infection.65 EOMES, GZMB, PERFORIN, and FASL were all overexpressed in either polyclonal or tetramer+ CD4+ T cells from KMT2DTCD mice in terms of the percentage and number of cells expressing these factors, as well as the amount made per cell (Figures 5C–5E and S5A–S5C). Consistent with scRNA gene expression, CD4CTL molecules such as EOMES and PERFORIN were overexpressed in both TFH and non-TFH cells from KMT2DTCD mice (Figures 5A, 5D, 5E, S5B, and S5C). EOMES is dually associated with the development of CD4CTL- and IL-10-producing T regulatory 1 (TR1) cells. However, KMT2DTCD cells did not have elevated expression of TR1-associated genes, including Il10, Il10ra, Cd27, Cd39 (Entpd1), and Lag3, and IL-10 was undetectable in GP61–80-stimulated cells (Figures S5D and S5E). The cytotoxic phenotype was not associated with the loss of CD4 or the gain of CD8 expression, indicating that CD4+ T cell identity was intact in KMT2D-deficient CD4+ T cells. Reciprocal findings were observed for CD8+ T cells (Figures S5F and S5G). The elevated frequencies of EOMES+ CD4+ T cells in KMT2DTCD mice persisted to day 15 post-infection (Figure S5H), suggesting that their cytotoxic gene expression was not transient. Lastly, in an adoptive transfer setting, only KMT2DTCD SMARTA donor cells acquired the cytotoxic phenotype (Figures S5I and S5J), indicating that CD4+ T cell-intrinsic expression of KMT2D limits CD4CTL development.
KMT2D activity is dispensable for early formation of TFH and CD4CTL lineages
We asked whether the TFH and CD4CTL phenotype observed was due to baseline differences in KMT2D-deficient CD4+ T cells prior to infection. Naive CD4+ T cells from KMT2DTCD mice had significantly lower amounts of H3K4Me1 than WT controls (Figure S6A). Unexpectedly, these cells expressed ~60% lower amounts of TCF1 compared to WT (Figure S6B). Despite lower TCF1, we found similar proportions of TFH cells in each group at steady state (Figures S6C and S6D), and few CD4+ T cells expressed cytotoxic molecules such as EOMES and GZMB (Figures S6E and S6F). Moreover, proportions of GC-B cells were equivalent between groups (Figure S6G), suggesting similar TFH activity.
Based on these and other findings (Figures 2, 3, and 4), it was unclear whether KMT2D programmed initial CD4+ T cell differentiation or acted later during infection to support TFH cells and limit CD4CTL development. To study the early role of KMT2D, we co-transferred WT (CD45.1/.2) and KMT2DTCD (CD45.1/.1) SMARTA cells into B6 hosts (CD45.2+) and analyzed donor cells in the spleen 3.5 dpi (Figure S6H). Donor cells from each group were equally abundant at this time, and the KMT2DTCD donor cells had significantly lower levels of H3K4Me1 compared to the WT (Figures S6I and S6J). In contrast to later stages of infection, we observed similar percentages of TFH cells among WT and KMT2DTCD donor cells and negligible differences in their expression of CD40L, BCL6, and ICOS (Figures S6K–S6M). Surprisingly, TCF1 was only slightly reduced in KMT2DTCD donor TFH cells at 3.5 dpi (Figure S6M), which indicates that KMT2D is dispensable for the initial upregulation of TCF1 and TFH differentiation that occurs shortly after virus infection.12,13 This finding is consistent with a recent short hairpin RNA (shRNA) screen of chromatin regulators of early TFH differentiation that did not identify Kmt2d.26 Although GZMB and PERFORIN were upregulated in WT compared to KMT2DTCD donor cells at day 3.5 (Figure S6N), expression was transient in WT CD4+ T cells and lost by 7 dpi, whereas expression was sustained in KMT2D-deficient donor CD4+ T cells up to day 7 (Figures S5I and S5J). Lastly, EOMES was not expressed in donor cells from either group at day 3.5 (Figure S6N), suggesting that it is not driving cytotoxic markers at this time point. Collectively, these findings indicate that KMT2D functions at later stages of infection to sustain TFH responses and limit the formation of a stable CD4CTL lineage.
KMT2D associates with enhancer elements important for TFH lineages
Transcriptional control of TFH and CD4CTL development occurs through opposing regulatory mechanisms. Indeed, our scRNA analyses revealed that cytotoxic gene expression was lowest in TFH-like clusters (Figure 5B). KMT2D is critical for gene enhancer activation; therefore, we considered that KMT2D might be needed to promote the expression of transcription factors important for TFH formation and factors that repress CD4CTL formation.
THPOK (encoded by Zbtb7b, herein referred to as Thpok) impedes CD4CTL formation by repressing the transcription of Runx3 and Eomes, which drives CD4CTL formation during LCMV infection.14,65 THPOK can also promote TFH differentiation and function by increasing the expression of factors such as Bcl6 and Maf.14 In our scRNA-seq analysis, Thpok expression was substantially reduced in KMT2DTCD cells in every cluster compared to the WT (Figure 5F), suggesting that KMT2D regulates Thpok irrespective of T helper cell type. Consistent with transcriptomic data, GP66-tetramer+ CD4+ T cells from WT mice universally expressed THPOK, whereas most KMT2DTCD cells lacked THPOK (Figure 5G), and among those still expressing THPOK, KMT2DTCD cells expressed lower amounts per cell than the WT. EOMES was expressed almost exclusively in KMT2DTCD GP66+ cells lacking THPOK (Figure 5G), consistent with THPOK-mediated repression of cytotoxic genes.14,60,66,67 The loss of THPOK in KMT2DTCD cells was acquired during infection, as naive CD4+ T cells from each group showed minimal differences in THPOK expression (Figure 5G). Moreover, initial TFH differentiation after infection was intact in KMT2DTCD donor cells (Figures S6D and S6E), unlike the profound early defects observed in THPOK−/− CD4+ T cells.14
To understand the role of THPOK in KMT2D-mediated TFH responses, we compared differentially expressed genes (DEGs) identified in KMT2DTCD TFH-like cells (cluster 1) in this study by pseudobulk analyses against DEGs identified by bulk RNA-seq of THPOK-deficient (Ox40Cre+Zbtb7b+/+) TFH cells (CXCR5int PD1int) relative to WT GC-TFH controls at day 7 post-LCMV-Armstrong infection (GEO: GSE130474).14 Among 1,161 DEGs in cluster 1, approximately half were also differentially expressed in THPOK-deficient TFH cells (Figure S7A; Table S1). Relative changes in expression between KMT2DTCD and THPOK-deficient TFH cells were highly correlated (Pearson r = 0.54) (Figure 5H). In contrast, there was no correlation of DEGs when comparing KMT2DTCD TFH-like cells to Tbet−/− or Tet2−/− TFH cells, despite evidence that these factors promote or inhibit TFH development (Figures S7B and S7C).68,69 These data indicate that KMT2D and THPOK elaborate overlapping transcriptional programs for TFH development.
To assess the potential for KMT2D to regulate Thpok expression, we first reanalyzed data from KMT2D:chromatin immunoprecipitation (ChIP)-seq studies performed on naive CD4+ T cells (GEO: GSE69162, Placek et al.44). We identified KMT2D peaks relative to input control at multiple known Thpok enhancers that are located upstream or within intronic regions of Zbtb7b (Figure S7D). Next, to determine whether KMT2D methylation could regulate Thpok expression during virus infection, we fluorescence-activated cell-sorted activated CD4+ T cells from the spleens of WT and KMT2DTCD mice at day 9 post-infection and subjected the cells to CUT&Tag for H3K4Me1, followed by qPCR at several enhancers. H3K4Me1 was significantly depleted at three Thpok enhancer sites in KMT2DTCD cells compared to WT (Figure 5I). The GTE (general T lymphoid element) and proximal enhancer were previously shown to be important for Thpok expression in peripheral CD4+ T cells, whereas the activity of site A has not been studied outside of the thymus. H3K4Me1 was diminished at an Il21 enhancer (CNS-49) in KMT2DTCD CD4+ cells. For reference, both groups showed similarly low levels of H3K4Me1 at HoxB1, which is not expressed in CD4+ T cells, and at a genomic “desert” region devoid of genes (Figure 5I). Our findings indicate that KMT2D directly targets Thpok and Il21 through its histone methyltransferase activity, possibly explaining how it promotes their expression.
Finally, to directly assess whether KMT2D supports TFH responses by promoting THPOK, we retrovirally overexpressed Thpok or an empty vector in WT and KMT2DTCD SMARTA cells that were engrafted into infected B6 hosts; TFH differentiation was analyzed 8 days later (Figure 5J). We compared the percentages of TFH cells among GFP+ donor cells, which were successfully transduced and overexpressed THPOK, against GFP− donor cells within each group. As expected,14 we observed that WT GFP + and GFP− donor cells consisted of similar proportions of TFH cells (Figure 5J), indicating that THPOK overexpression does not affect TFH differentiation, most likely because WT cells express sufficient amounts of THPOK. As anticipated, the empty vector also had no impact on TFH differentiation in either group. In contrast, THPOK overexpression significantly enhanced TFH differentiation in GFP+ KMT2DTCD donor cells (Figure 5J), which reached WT levels of TFH cell formation. By comparison, TCF1 overexpression failed to rescue TFH formation in KMT2DTCD cells despite fully rescuing TCF1 amounts (Figures S7E and S7F), indicating that KMT2D employs TCF1-independent mechanisms to regulate TFH differentiation.
In sum, our findings implicate a role for KMT2D methyltransferase activity in sustaining Thpok expression in CD4+ T cells responding to virus infection, which promotes TFH formation, while restricting their differentiation into the CD4CTL lineage.
DISCUSSION
TFH cells act within the GC to mediate the formation of high-affinity, neutralizing antibodies that confer protection against viruses and other pathogens. This process unfolds through the iterative selection of affinity-matured B cells by TFH cells, often over the course of weeks or months.70 TFH cells must persist within the GC and maintain specialized functions required for B cell help. We found that the histone methyltransferase KMT2D sustains TFH responses during primary virus infection. Mice lacking KMT2D in T cells formed fewer TFH cells and had a diminished virus-specific antibody response. In WT CD4+ T cells, KMT2D acted after initial CD4+ T cell differentiation to promote the expression of Thpok and Il21 by activating critical enhancers via its H3K4 mono-methyltransferase activity. CD4+ T cells lacking KMT2D failed to remain as TFH cells and instead acquired a cytolytic transcriptional program. Our data implicate KMT2D in maintaining TFH gene expression and limiting CD4CTL development over the course of virus infection.
Among TFH cells, there was transcriptional overlap between genes advanced by KMT2D and those affected by THPOK. KMT2D regulates broad cell-type-specific transcriptional programs through enhancer activation, yet THPOK overexpression alone was sufficient to rescue the overall defect in TFH differentiation in KMT2D-deficient CD4+ T cells. Nevertheless, it is possible that KMT2D mediates other essential aspects of TFH physiology independent of THPOK. Nearly half of the genes differentially expressed in KMT2DTCD TFH-like cells were expressed normally in THPOK-deficient TFH cells, including genes like Mef2d, a transcriptional regulator of T:B adhesion and Il21 expression.71 KMT2D can associate with a distal CXCR5 enhancer in CD8+ T cells,46 suggesting a possible role for KMT2D in TFH migration. We showed that KMT2D may directly regulate effector genes such as Il21 through its methyltransferase activity. Thus, available evidence suggests a broader role of KMT2D beyond THPOK in regulating physiologically relevant TFH cell gene expression.
KMT2D and UTX, an H3K27 demethylase, can function in the same epigenetic complex and regulate gene expression through complementary histone-modifying and scaffolding activity.29,30,72 Our prior study found that UTX promotes TFH responses during persistent virus infection by promoting their expression of Il6ra, and Il6ra was also downregulated in KMT2DTCD cells based on our scRNA-seq data. Despite these commonalities, UTX and KMT2D likely regulate TFH responses through shared and distinct mechanisms. UTX had no obvious effect on TFH formation during acute infection and did not impact the expression of KMT2D-regulated genes such as ThPok.29 Although Il6ra expression was decreased in KMT2DTCD TFH-like cells, IL-6 signaling is redundant for TFH differentiation during acute LCMV infection.73 Future studies are needed to assess whether KMT2D-mediated IL-6Ra is important for TFH responses during persistent infection.
We do not know the degree to which KMT2D’s histone methyltransferase or scaffolding activity is needed for gene regulation in T cells. KMT2D is needed for UTX stability and nuclear localization.32,74 UTX stabilization may be a critical demethylase-independent function of KMT2D in TFH responses. It is possible that KMT2D and UTX are redundant for the expression of certain TFH genes, and changes to their expression may be evident only in CD4+ T cells lacking KMT2D and UTX. In addition, KMT2D and UTX may have additive or synergistic effects on the expression of other sets of genes.
Cytotoxic CD4+ T cells are increasingly identified in a variety of disease contexts, although their precise function has been difficult to parse out. Protective CD4CTL responses, identified in various viral and bacterial infections and during malignancy, exert their effects by killing infected or transformed cells. Conversely, maladaptive CD4CTL responses are reported in settings such as recurrent childhood tonsillitis, in which cytotoxic TFH cells eliminate GC-B cells and limit durable antibody protection.75 It is interesting to speculate whether the cytotoxic features acquired by KMT2D-deficient TFH cells during LCMV infection contributed to antibody defects in KMT2DTCD mice.
The pathways involved in CD4CTL formation vary between tissue and disease settings. In the intestines, intraepithelial lymphocytes (IELs) constitute a major constitutive population of cytotoxic CD4+ T cells that promote tissue homeostasis and microbial defense.76 CD4+ T cells differentiate into IELs through progressive downregulation of Thpok and upregulation of Runx3 and Eomes. These transcriptional changes are associated with signaling molecules such as IFN-γ, IL-27, transforming growth factor beta (TGF-β), PD1, and Aryl hydrocarbon receptor (AhR).66,77–79 Whether aberrant signaling through these factors triggers THPOK downmodulation and CD4CTL formation in KMT2D-deficient CD4+ T cells during infection is a matter of future investigation.
Kabuki syndrome frequently presents with low IgA and IgG titers and poor vaccine responses.41–43,80 KMT2D deficiency can contribute to B cell-intrinsic defects in migration and terminal differentiation in GCs in mice and in humans with Kabuki syndrome. Our study implies that there may be elevated CD4CTL and deficient TFH responses in Kabuki syndrome, causing weakened humoral immunity. Our findings highlight the need for further characterization of CD4+ T cells in Kabuki syndrome, for which clinical data are currently limited to immune cell frequencies in the blood.
Limitations of the study
Our findings suggest that KMT2D expression within CD4+ T cells promotes TFH development and antibody responses in part through H3K4Me1 deposition at Thpok and Il21 enhancers. However, we were unable to directly test the contribution of KMT2D’s methyltransferase activity to gene expression due to a lack of readily available mouse models or specific chemical inhibitors targeting the KMT2D catalytic domain. We showed that KMT2D-mediated THPOK expression is sufficient for TFH differentiation but did not test whether this extended to other aspects of TFH and CD4+ T cell responses, such as CD40L and cytokine expression.
RESOURCE AVAILABILITY
Lead contact
Additional information and requests for resources and reagents should be directed to and will be fulfilled by the lead contact, Jason K. Whitmire (jwhitmir@email.unc.edu).
Materials availability
KMT2Dfl/fl mice are available upon request with standard institutional material transfer agreements and evidence of institutional approval to receive mice.
Data and code availability
All experimental data are available within this article and will be shared by the lead contact upon request. scRNA-seq data have been deposited to the Gene Expression Omnibus under accession GEO: GSE282033.
No original code was developed for this study; however, the code utilized in the data processing and analyses is available upon request.
Any additional information required to reanalyze the data reported in this paper is available from the lead contact upon request.
STAR★METHODS
EXPERIMENTAL MODEL AND STUDY PARTICIPANT DETAILS
Mice
All mouse colonies were maintained in-house at UNC by the Whitmire lab. C57BL/6J (B6), B6.Ly5a (CD45.1), and B6.LckCre mice were purchased from Jackson laboratories. SMARTA TCR-Tg and P14 TCR-transgenic mice were backcrossed with B6.Ly5a mice to yield SMARTA.Ly5a and P14.Ly5a mice. Kmt2dfl/fl mice49 were kindly provided by Dr. Kai Ge (NIDKK) and were crossed with B6.LckCre mice to generate KMT2DTCD mice (LckCre+/wt;Kmt2dfl/fl). Both LckCreposKmt2dwt/wt and LckCrenegKmt2dfl/fl mice were used as WT controls. SMARTA and P14 TCR-Tg mice were maintained on a B6.Ly5a genetic background and intercrossed with KMT2DTCD mice to generate SMARTA.KMT2DTCD and P14.KMT2DTCD mice. The LckCre and TCR-Tg transgenes were maintained in a hemizygous state for all associated mouse lines (LckCre+/o, SMARTA+/o, P14+/0). Both male and female mice were included in repeated experiments; there was no discernable sex difference in the effects we assessed. Age and sex-matched adult mice ranging from 8 to 14 weeks old were used for all studies. All experiments and procedures were approved by the University of North Carolina-Chapel Hill Institutional Animal Care and Use Committee.
Virus
Stocks of LCMV-Armstrong were generated by infecting BHK-21 cells with plaque-purified isolates. Virus-containing supernatants were aliquoted and frozen at −80°C. The plaque-forming titer was quantified by plaque assay on Vero cell monolayers. Viral stocks tested negative for mycoplasma.
Cell lines
Vero cells are a female African green monkey kidney epithelial cell line, which were used to quantify infectious LCMV by plaque assay. BHK-21 cells, a fibroblast cell line derived from hamster of unknown sex, were used to grow LCMV for viral stocks. Both Vero and BHK-21 cells were used at low passage number and were negative for mycoplasma. Plat-E cells are derivative of the 293T female human kidney cell line and were used to generate retrovirus that was transduced into T cells. Vero cells and BHK-21 cells were cultured in DMEM supplemented with 5% FBS (heat-inactivated), L-Glutamine, penicillin and streptomycin. Plat-E were cultured in 10% DMEM supplemented with HEPES, Pen/Strep, L-Glutamine, and Non-Essential Amino Acids.
METHOD DETAILS
Genotyping
LckCre and KMT2DTCD mice were genotyped by PCR. DNA was isolated from PBMCs following overnight incubation with Proteinase K. Oligonucleotide primers were synthesized by Eurofins Genomics and used to PCR amplify DNA fragments, using the primers listed in Table and GoTaq PCR master mix. The PCR products were visualized by ethidium bromide staining after they were run on a 2% agarose gel. SMARTA and P14 TCR transgenic mice were genotyped by flow cytometry performed on PBMCs. CD4, Va2, and Vb8.3 identified SMARTA mice, and CD8, Va2, and Vb8.1 identified P14 mice. CD45 congenic background was determined by antibody labeling of CD45.1 and CD45.2.
Virus
Adult mice were intraperitoneally injected with 2 × 10⁵ PFU of LCMV Armstrong for analyses performed 7 or more days after infection, and 1 × 10⁶ pfu of LCMV Armstrong for analyses performed 3.5 days after infection. Viral titers in infected mice were quantified by plaque assay using Vero cell monolayers. Stocks of LCMV were generated by infecting BHK-21 cells with plaque purified isolates and tested negative for Mycoplasma.
PBMC isolation
Blood was collected by cheek bleed into a tube containing sodium citrate solution. Blood was underlaid with Ficoll, and then tubes were centrifuged at 2000 rpm for 20 min at room temperature with low acceleration/deceleration to separate PBMCs from other blood components.
Splenocyte isolation
Single cell splenocyte suspensions were prepared by mechanically disrupting spleens with scissors and a syringe plunger over a 70 μm strainer. RBC lysis was performed using ACK lysis buffer, followed by two washes with 1% RPMI. Live cells were counted with trypan blue on a hemocytometer. 2 × 10⁶ live cells were seeded per well of a 96 well plate. All isolation steps were carried out on ice or at 4°C.
Adoptive transfer experiments
All cell transfer studies were performed by tail vein injection into C57BL/6 recipients one day prior to infection of hosts with LCMV Armstrong, unless otherwise specified. Donor cell responses were analyzed in the spleen and blood of host mice by at the indicated time after infection. For single-transfer studies, donor cells were CD45.1 congenic. For co-transfer studies, one donor group was CD45.1 congenic, while the other was CD45.1 CD45.2 congenic.
P14 transfers
CD8+ P14 recovered from the spleens of WT and KMT2DTCD P14 TCR transgenic mice. Co-transfers of 5 × 10³ total P14 cells, consisting of equal numbers of congenic WT and KMT2D−/− P14 cells were performed.
SMARTA transfers
Splenocytes containing CD4+ SMARTA were recovered from WT and KMT2DTCD SMARTA TCR transgenic mice. For analyses at 7–8 days post infection, single transfers of 1 × 10⁴ SMARTA cells into B6 recipients were performed. For analyses at 3.5 days post infection, co-transfers of 1 × 10⁶ total SMARTA cells, consisting of equal numbers of congenic WT and KMT2D−/− SMARTA were performed.
Flow cytometry
Dead cells were labeled with fixable viability dye according to the manufacturer’s instructions (Cytek), and Fc receptors were blocked with anti-CD16/32 antibodies. Tetramer labeling was performed in cRPMI for 1 h at 4°C (MHC-I tetramers) or 37°C (MHC-II tetramer) and in some instances was performed simultaneously with CXCR5 labeling in a one-step stain. In other instances, CXCR5 labeling was performed as a two or three step stain for 1 h in FACS buffer. Next, the remaining surface markers were labeled with antibodies for 30 min at 4°C in FACS buffer. Transcription factors were labeled for 1 h with the FoxP3 Fixation/Permeabilization kit according to the manufacturer’s instructions. CD40L and Perforin staining was performed in Permeabilization/Wash Buffer (Biolegend) on splenocytes fixed with 4% PFA for 30 min. Intracellular cytokines were identified after 5-h stimulation with LCMV peptides GP61–80, GP33–41, NP205–212 or NP396–405 in the presence of Brefeldin A. Fixation and cytokine labeling was carried out the same as for CD40L. Fixation conditions used for identification of IL-21 were 2% PFA for 20 min. All labeling steps were carried out in 50ul of staining solution. Samples were washed 2–3 times following each staining step. Fixation and labeling were carried out at 4°C unless otherwise specified. Samples were acquired on a 5 laser LSR Fortessa, and data analysis was performed in FlowJo software (TreeStar).
Cell preparation for single cell RNA sequencing and Cut&Tag
For scRNA-seq, splenocyte single cell suspensions were prepared from WT and KMT2DTCD mice at 10 dpi by mechanical disruption. CD4+ T cells were negatively enriched using biotinylated antibodies against CD8, B220, and TER-119 with MojoSort Streptavidin Nanobeads according to the manufacturer’s instructions. Enriched CD4+ T cells were stained with fixable viability dye, GP66-tetramer, CD4, and PD1 as described above. Samples were multiplexed by labeling each sample with a unique Biolegend TotalSeq-B Hashtag antibody-oligo conjugate for 30 min on ice according to the manufacturer’s instructions. Live virus-specific CD4+ T cells (CD4+GP66+ cells) were sorted using the Sony SH800Z cell sorter (100um nozzle). Post-sort cell viability was determined by Propidium Iodide/Acridine Orange staining on a Luna-FX7 cell counter and was between 85% and 96% per sample. For CUT&Tag, splenocyte single cell suspensions were prepared from WT and KMT2DTCD mice at 9 dpi as described above. Total splenocytes were stained with fixable viability dye, and antibodies against CD4, CD8 and CD44. Live CD4+CD44hiCD8-cells were sorted using the SH800Z and kept in complete RPMI on ice prior to CUT&Tag.
CUT&Tag
CUT&Tag was performed for H3K4Me1 utilizing pAG-Tn5 according to manufacturer guidelines on sorted CD44hiCD4+ T cells. DNA was extracted from 5% of the cell population to serve as input. Briefly, nuclei were extracted in HEPES (20 mM, pH 7.9), KCL (10 mM), Triton X-100 (0.1%), glycerol (20%), spermidine (0.5 mM), and protease inhibitor. Approximately 50,000 nuclei were bound to Concanavalin A magnetic beads for 10 min at room temperature. Nuclei/beads were incubated with H3K4Me1 antibody in Digitonin Wash buffer (20 mM HEPES, pH 7.5), NaCl (150 mM), spermidine (0.5 mM), digitonin (0.01%), and protease inhibitor containing 2 mM EDTA overnight at 4°C with elevated cap on a rocker. Nuclei/beads were then incubated with secondary antibody for 30 min at room temperature on a rocker. Nuclei/beads were washed twice in Digitonin wash buffer and then incubated with pAG-Tn5 in high salt digitonin wash buffer and rocked for 1 h at room temperature. After washing and resuspension in high salt digitonin buffer, MgCl2 (10 mM) was added for tagmentation for 1 h at 37°C in a thermocycler. After wash in TAPS buffer (10 mM, pH 8.5) containing EDTA (0.2 mM), DNA was extracted in 10 mM TAPS containing SDS (0.1%) for 1 h at 58°C in a thermocycler. The extraction was quenched with Triton X-100 (0.5%) and amplified for 14 cycles with NEBNext HiFi PCR mix, using dual index oligos that anneal to Tn5 adapter sequences.1 Amplified samples were purified with KAPA pure SPRI beads, and eluted in Tris-HCl (10 mM, pH 8). One WT sample was discarded due to low input DNA concentration and lack of nucleosomal banding patterns by tape station analysis.
Quantitative PCR
qPCR was performed on a CFX96 thermocycler using the following cycling conditions: (1) initial denaturation at 95°C for 3 min, (2) 39 cycles of 95°C for 5 s and 60°C for 30 s. Each reaction was in 10 μl total volume, and contained 5 μl SYBR Green Master Mix, forward and reverse primer (500 nM each), and template DNA obtained from H3K4Me1 Cut&Tag (1:20 dilution) (see above). Melt-curve analysis was performed immediately after amplification to confirm the specificity of the PCR products. Each group contained 3–4 biological replicates, and reactions were run in duplicate. Enrichment of H3K4Me1 was calculated as ΔCt, with input DNA as the reference. qPCR primers for Thpok GTE, Il21 CNS-49, and Kmt2d Exon 50–51 were previously described.49,86,87 qPCR primers were designed for Thpok Proximal Enhancer and ThPok site A based on known genomic coordinates.88,89
Single-cell RNA-seq and bioinformatic analyses
Sorted virus-specific CD4+ T cells from each sample were pooled together in roughly equal numbers, and ~20k cells were converted into single-cell cDNA libraries using the 10x Genomics Chromium GEM-X Single Cell 3′ V4 kit. The multiplexed library was loaded onto the NextSeq P4 flow cell, and paired-end sequencing was performed on an Illumina NextSeq 2000 at the UNC High Throughput Sequencing core facility. Reads were mapped to genome build GRcM39 and demultiplexed through the 10x Genomics Cell Ranger multi pipeline (v8.0.0).83
Raw unique molecular identifier (UMI) counts for each demultiplexed sample were imported into R (v4.4.0) for analysis using Seurat (v5.1.0).90 Quality control (QC) filtering of low-quality cells was performed using the miQC (v1.12.0)91 package based on the flexmix model with a posterior cutoff of 0.75. Additional manual thresholds were applied to exclude cells with RNA counts above the 99th percentile and features detected above the 99th or below the 1st percentile. Post QC processing was performed using Seurat. Raw UMI counts were log normalized using the LogNormalize method with a scale factor of 10,000 and then scaled to variance with mitochondrial gene percentage regressed out.
Dimensionality reduction by uniform manifold approximation and projection (UMAP) was performed following PCA reduction using 41 principal components (PCs). The number of PCs was determined based on the point that PCs account for 90% of the cumulative variance and less than 5% of the standard deviation. Analysis of cell cycle genes indicated they were not major drivers of PC segregation on the UMAP, and thus were not removed by regression for downstream analysis. To facilitate comparison between groups, samples were integrated using Harmony (v1.2.1).92 The integrated data were clustered with the Louvain with multilevel refinement algorithm in Seurat at a resolution of 0.61. Clusters were visualized by UMAP.
Pseudobulk differential expression analyses were performed by summing counts across all cells within each cluster and sample. Differential expression between WT and KMT2DTCD clusters was assessed using DESeq2 (v1.44.0).93 Genes with a false discovery rate (FDR)-adjusted p value of less than 0.05 were considered significantly differentially expressed. Gene signatures for TFH, TH1 and Tcmp cells were obtained from Ciucci et al.,60 and gene signature scores were calculated using Seurat AddModule function for each gene list.
To relate gene expression changes in our scRNA-seq data to transcriptional regulation of genes by ThPok, Tet2, and Tbet, we re-analyzed publicly available bulk RNA-sequencing data. For ThPok, RNA-sequencing was performed on virus-specific WT (Ox40Cre+ ThPokwt/wt; GP66+ CD4+ CXCR5hiPD1hi) and ThPok-deficient (Ox40Cre+ ThPokfl/fl; GP66+ CD4+ CXCR5intPD1int) TFH cells that were sorted from the spleen of LCMV-Armstrong infected mice at 7 dpi (Vacchio et al.14). For Tet2, WT (CD45.1/.1 CXCR5+) and Tet2−/− (CD4Cre+ Tet2fl/fl; CD4+ CD45.1/.2 CXCR5+) donor SMARTA TFH cells were sorted from the spleen of LCMV-Armstrong infected mice at 7 dpi (Baessler et al.69). For Tbet, WT (B6; CD4+ Thy1.1+ PSGL1lo Ly6Clo CXCR5hiPD1hi) and Tbet−/− (B6.Tbx21−/−; CD4+ Thy1.1+ PSGL1loLy6Clo CXCR5hiPD1hi) donor SMARTA TFH cells were sorted from the spleen 8 days after LCMV infection (Weinstein et al. 68).
Differential expression analyses were performed using DESeq2 on raw count matrices obtained from GSE130474 and GSE183316 for the ThPok and Tet2 datasets respectively. For the Tbet dataset, sequencing files were downloaded from GSE105806. Adaptor trimming and removal of low-quality reads was performed using Trim Galore (v0.6.7). Reads were then aligned to the mm10 genome using STAR (v2.7.11b) to obtain raw gene counts followed by differential expression analysis using DESeq2. Genes with an FDR adjusted p value of less than 0.05 were considered significantly differentially expressed.
To compare genes regulated by KMT2D versus ThPOK, Tet2, and Tbet in TFH cells, the log2 fold-change in expression of genes from pseudobulk (KMT2DTCD cluster 1/WT cluster 1) and bulk (e.g., ThPok-deficient TFH/WT TFH) RNA-seq datasets were Z-normalized using the R scale function. The Z scores of cluster 1 DEGs from pseudobulk and bulk data was depicted on a scatterplot, and a Pearson correlation coefficient of Z scores was calculated.
Retrovirus production
MSCV-IRES-GFP plasmid vector was purchased from Addgene. MSCV-Thpok-t2a-GFP and MSCV-Tcf1-t2a-GFP vectors were kindly provided by Dr. Justin Milner (UNC-Chapel Hill). Plat-E cells were used to generate retrovirus following transfection with MSCV vector and pCL-Eco plasmids using Transit-LT1 reagent according to the manufacturer’s instructions. 24 h later, media were changed to cRPMI. Retroviral supernatant was collected 48 and 72 h after Plat-E cell transfection, and stored at −80°C.
Retroviral transductions
CD4+ SMARTA cells were enriched from the spleens of CD45 congenic SMARTA mice on a KMT2Dfl/fl and KMT2DTCD genetic background using the MojoSort CD4 T cell isolation kit and then pooled together in equal numbers. Pooled SMARTA cells were resuspended in RPMI supplemented with 10% heat-inactivated FCS, hIL-2 (100u/ml), and in vitro activated with plate bound anti-CD3/CD28 antibodies (5 μg/ml each) on a 6 well plate for 24 h in a 37°C incubator. Next, retroviral supernatant containing polybrene (4 μg/ml final concentration) was added to each well, and pooled SMARTA cells were spin transduced for 90 min at 2000g at 32°C. After spin-transduction, pooled SMARTA were incubated for an additional 5–6 h in a 37°C incubator and then washed twice with 0% RPMI. Finally, 2 × 10⁴ transduced SMARTA cells (containing 1 × 10⁴ SMARTA from KMT2Dwt/wt and KMT2Dfl/fl backgrounds) were transferred by tail vein injection into C57BL/6 mice that were infected with LCMV Armstrong one day earlier. Donor SMARTA cells were distinguished from each other and host cells by expression of CD4, CD45.1 and CD45.2. Donor cells which were successfully transduced, were identified by GFP expression.
QUANTIFICATION AND STATISTICAL ANALYSIS
Unpaired or paired Student’s t tests (parametric test) were used to assess the significance of normally distributed data, as indicated in each legend. An unpaired Mann-Whitney U test was used for non-normally distributed data. Statistical analyses and graphing were performed using Prism software (GraphPad Software Inc.). DESeq2 was used to identify differentially expressed genes using scRNA-seq and bulk RNA-seq data, with significant gene cutoff defined at FDR < 0.05. p values considered significant are indicated in the figure legends as: *p < 0.05; **p < 0.01; ***p < 0.001; ****p < 0.0001. All data are presented as mean ± SEM values. Each figure legend indicates the number of mice that were analyzed and the number of repeated experiments.
Supplementary Material
SUPPLEMENTAL INFORMATION
Supplemental information can be found online at https://doi.org/10.1016/j.celrep.2025.115775.
KEY RESOURCES TABLE.
| REAGENT or RESOURCE | SOURCE | IDENTIFIER |
|---|---|---|
|
| ||
| Antibodies | ||
|
| ||
| anti-mouse-B220-Biotin | Biolegend | Cat #103203; RRID:AB_312988 |
| anti-mouse-B220-Pacific Blue | Biolegend | Cat #103230; RRID:AB_492877 |
| anti-mouse-B220-FITC | Biolegend | Cat #103206; RRID:AB_312991 |
| anti-mouse-B220-Violet Fluor 500 | Cytek | Cat #850452U025 |
| anti-mouse-B220-PerCP | Biolegend | Cat #103233; RRID:AB_893355 |
| anti-mouse-B220-Spark Plus UV395 | Biolegend | Cat #103297; RRID:AB_3097645 |
| anti-mouse-BCL2-PE/Cy7 | Biolegend | Cat #633511; RRID:AB_2565246 |
| anti-mouse-Bcl6-PE | BD Biosciences | Cat #561522; RRID:AB_10717126 |
| anti-mouse-Bcl6-PE/Cy7 | BD Biosciences | Cat #563582; RRID:AB_2738292 |
| anti-mouse-BCL6-Real Blue 780 | BD Biosciences | Cat #569143; RRID:AB_3662681 |
| anti-mouse-Bim-unconjugated | Cell Signaling | Cat #2933S; RRID:AB_1030947 |
| anti-mouse-CD3-Purified | Biolegend | Cat #100340; RRID:AB_11149115 |
| anti-mouse-CD4-SparkUV387 | Biolegend | Cat #100492; RRID:AB_2922449 |
| anti-mouse-CD4-SparkPlusUV395 | Biolegend | Cat #100495; RRID:AB_3097649 |
| anti-mouse-CD4-BV421 | Biolegend | Cat #100563; RRID:AB_2563052 |
| anti-mouse-CD4-Violet Fluor 500 | Cytek | Cat #850041U025 |
| anti-mouse-CD4-FITC | Biolegend | Cat #100510; RRID:AB_312713 |
| anti-mouse-CD4-PE | Biolegend | Cat #100512; RRID:AB_312715 |
| anti-mouse-CD4-APC | Biolegend | Cat #100516; RRID:AB_312719 |
| anti-mouse-CD4-Alexa Fluor 700 | Biolegend | Cat #100536; RRID:AB_493701 |
| anti-mouse-CD8a-Biotin | Biolegend | Cat #100703; RRID:AB_312742 |
| anti-mouse-CD8a-SparkUV387 | Biolegend | Cat #100797; RRID:AB_2922451 |
| anti-mouse-CD8a-SparkPlus UV395 | Biolegend | Cat #104011; RRID:AB_3097648 |
| anti-mouse-CD8a-APC | Biolegend | Cat #100712; RRID:AB_312751 |
| anti-mouse-CD8a-Alexa Fluor 700 | Biolegend | Cat #100729; RRID:AB_493702 |
| anti-mouse-CD8a-BV421 | Biolegend | Cat #100753; RRID:AB_2562558 |
| anti-mouse-CD8a-VioletFluor500 | Cytek | Cat #850081U025 |
| anti-mouse-CD8b-Biotin | Biolegend | Cat #126604; RRID:AB_961291 |
| anti-mouse-CD28 -Purified | Biolegend | Cat #102116; RRID:AB_11147170 |
| anti-mouse-CD40L-PE | Biolegend | Cat #106505; RRID:AB_313270 |
| anti-mouse-CD40L-APC | Biolegend | Cat #106509; RRID:AB_2561560 |
| anti-mouse-CD44-FITC | Biolegend | Cat #103005; RRID:AB_312956 |
| anti-mouse-CD44-Alexa Fluor 700 | Biolegend | Cat #103026; RRID:AB_493713 |
| anti-mouse-CD44-BV711 | Biolegend | Cat #103057; RRID:AB_2564214 |
| anti-mouse-CD44-BV711 | BD Biosciences | Cat #563971; RRID:AB_2738518 |
| anti-mouse-CD45.1-eFluor450 | Thermofisher | Cat #48-0453-82; RRID:AB_1272189 |
| anti-mouse-CD45.1-eFluor506 | Thermofisher | Cat #69-0453-82; RRID:AB_2637182 |
| anti-mouse-CD45.1-FITC | Biolegend | Cat #110706; RRID:AB_313495 |
| anti-mouse-CD45.1-PE | Biolegend | Cat #110708; RRID:AB_313497 |
| anti-mouse-CD45.1-APC | Biolegend | Cat #110714; RRID:AB_313503 |
| anti-mouse-CD45.2-eFluor450 | Thermofisher | Cat #48045482; RRID:AB_11042125 |
| anti-mouse-CD45.2-FITC | Biolegend | Cat #109806; RRID:AB_313443 |
| anti-mouse-CD45.2-PE | Biolegend | Cat #109808; RRID:AB_313445 |
| anti-mouse-CD45.2-APC | Biolegend | Cat #109814; RRID:AB_389211 |
| anti-mouse-CD45.2-Alexa Fluor 700 | Biolegend | Cat #109822; RRID:AB_493731 |
| anti-mouse-CD62L-FITC | Biolegend | Cat #104405; RRID:AB_313092 |
| anti-mouse-CD69-BV711 | Biolegend | Cat #104537; RRID:AB_2566120 |
| anti-mouse-CD86-PE/Cy7 | Biolegend | Cat #Check; RRID:AB_439782 |
| anti-mouse-CD138-PE/Cy | Biolegend | Cat #142513; RRID:AB_2562197 |
| anti-mouse-CD150-APC | Biolegend | Cat #115909; RRID:AB_493461 |
| anti-mouse-CD150-Alexa Fluor 488 | Biolegend | Cat #115915; RRID:AB_528743 |
| anti-mouse-CXCR3-PE | Biolegend | Cat #126505; RRID:AB_1027656 |
| anti-mouse-CXCR4-Biotin | Thermofisher | Cat #13999180; RRID:AB_10596966 |
| anti-mouse-CXCR5-Purified | BD Biosciences | Cat #551961; RRID:AB_394302 |
| anti-mouse-CXCR5-Biotin | BD Biosciences | Cat #551960; RRID:AB_394301 |
| anti-mouse-CXCR5-PE | Thermofisher | Cat #12718582; RRID:AB_11217882 |
| anti-mouse-CXCR5-Biotin | Thermofisher | Cat #13-7185-82; RRID:AB_2572800 |
| anti-mouse-CXCR6-PE/Cy7 | Biolegend | Cat #151119; RRID:AB_2721670 |
| anti-mouse-EOMES-PE | Thermofisher | Cat #12-4875-82; RRID:AB_1603275 |
| anti-mouse-EOMES-APC | Thermofisher | Cat #17-4875-80; RRID:AB_2866427 |
| anti-mouse-Fas-PE | Biolegend | Cat #152608; RRID:AB_2632902 |
| anti-mouse-FasL-Biotin | Thermofisher | Cat #12-5911-82; RRID:AB_466794 |
| anti-mouse-FoxP3-FITC | Thermofisher | Cat #11-5773-80; RRID:AB_465242 |
| anti-mouse-FR4-Real Blue 780 | BD Biosciences | Cat #755354; RRID:AB_3687749 |
| anti-mouse-GL7 -APC | Biolegend | Cat #144618; RRID:AB_2800675 |
| anti-mouse-GzmB-FITC | Biolegend | Cat #515403; RRID:AB_2114575 |
| anti-mouse- H3K4Me1 -Purified | Cell Sign. | Cat #5326S; RRID:AB_10695148 |
| anti-mouse-ICOS-PE/Cy7 | Biolegend | Cat #117421; RRID:AB_2860636 |
| anti-mouse-IFN-γ-FITC | Biolegend | Cat #505806; RRID:AB_315400 |
| anti-mouse-IFN-γ-APC | Biolegend | Cat #505810; RRID:AB_315404 |
| anti-mouse-IFN-γ-PE/Cy7 | Biolegend | Cat #505826; RRID:AB_2295770 |
| anti-mouse-IgD-FITC | Biolegend | Cat #405703; RRID:AB_315025 |
| anti-mouse-IgD-Alexa Fluor 700 | Biolegend | Cat #405729; RRID:AB_2563340 |
| anti-mouse-IgG1-FITC | BD Biosciences | Cat #562026; RRID:AB_10926376 |
| anti-mouse-IL-2-APC | Biolegend | Cat #503809; RRID:AB_315303 |
| anti-mouse-IL7Ra-PE/Cy7 | Biolegend | Cat #135013; RRID:AB_1937266 |
| anti-mouse-IRF4-PE/Cy7 | Thermofisher | Cat #25-9858-82; RRID:AB_2573558 |
| anti-mouse-Ki67 Set-FITC | BD Biosciences | Cat #Cat# 556026; RRID:AB_396302 |
| anti-mouse-Ki67-Alexa Fluor 700 | Biolegend | Cat #16A8; RRID:AB_2564285 |
| anti-mouse-KLRG1-APC | Biolegend | Cat #138412; RRID:AB_10641560 |
| anti-mouse-KLRG1-PE | Biolegend | Cat #138408; RRID:AB_10574313 |
| anti-mouse-Lag3-PE/Cy7 | Biolegend | Cat #125225; RRID:AB_2715763 |
| anti-mouse-LEF1-Alexa Fluor 488 | Cell Signaling | Cat #8490S; RRID:AB_10949502 |
| anti-mouse-Ly108-APC | Biolegend | Cat #134610; RRID:AB_2728155 |
| anti-mouse-Ly6C-FITC | Biolegend | Cat #128005; RRID:AB_1186134 |
| anti-mouse-Ly6C-PE | Biolegend | Cat #128008; RRID:AB_1186132 |
| anti-mouse-Ly6C-APC | Biolegend | Cat #128016; RRID:AB_1732076 |
| anti-mouse-PD1-BV421 | Biolegend | Cat #109121; RRID:AB_2687080 |
| anti-mouse-PD1-PE | Biolegend | Cat #109104; RRID:AB_313421 |
| anti-mouse-PD1-APC | Biolegend | Cat #109111; RRID:AB_10613470 |
| anti-mouse-PD1-Alexa Fluor 488 | BD Biosciences | Cat #568577; RRID:AB_3684384 |
| anti-mouse-Perforin-APC | Biolegend | Cat #154303; RRID:AB_2721462 |
| anti-mouse-PSGL1-Alexa Fluor 647 | BD Biosciences | Cat #562806; RRID:AB_2737807 |
| anti-mouse-RORgt-Real Yellow 775 | BD Biosciences | Cat #571372; RRID:AB_3686452 |
| anti-mouse-Tbet-PE | Biolegend | Cat #644810; RRID:AB_2200542 |
| anti-mouse-Tbet-Real Blue 780 | BD Biosciences | Cat #569090; RRID:AB_3684770 |
| anti-mouse-TCF1-Alexa Fluor 647 | BD Biosciences | Cat #566693; RRID:AB_2869823 |
| anti-mouse-TER-119-Biotin | Biolegend | Cat #116203; RRID:AB_313704 |
| anti-mouse-ThPok-Real Blue 780 | BD Biosciences | Cat #568697; RRID:AB_3684476 |
| anti-mouse-ThPok-Real Yellow 586 | BD Biosciences | Cat #568129; RRID:AB_3684061 |
| anti-mouse-Thy1.2-FITC | Biolegend | Cat #105306; RRID:AB_313177 |
| anti-mouse-Thy1.2-Alexa Fluor 700 | Biolegend | Cat #105319; RRID:AB_493724 |
| anti-mouse-Tim3-BV711 | Biolegend | Cat #119727; RRID:AB_2716208 |
| anti-mouse-TNF-BV421 | Biolegend | Cat #506327; RRID:AB_10900823 |
| anti-mouse-TNF-Alexa Fluor 488 | Biolegend | Cat #506315; RRID:AB_493329 |
| anti-mouse-TNF-PE | Biolegend | Cat #506306; RRID:AB_315427 |
| anti-mouse-UTX-Purified | Cell Sign. | Cat #33510; RRID:AB_2721244 |
| anti-mouse-Va2-PE | Biolegend | Cat #127808; RRID:AB_1134183 |
| anti-mouse-Vb8.1-FITC | Biolegend | Cat #118406; RRID:AB_1227786 |
| anti-mouse-Vb8.3-FITC | Biolegend | Cat #156306; RRID:AB_2800702 |
| anti-human IgG Fab2(H + L)-Alexa Fluor 647 | Jackson | Cat #709-606-149; RRID:AB_2340581 |
| anti-rabbit-IgG | Thermofisher | Cat #NBP172763; RRID:AB_11024108 |
| IL21R-Fc chimera-Purified | R&D | Cat #596-MR-100 |
| Streptavidin BV421 | Biolegend | Cat #4414S |
| Streptavidin PE | Biolegend | Cat #405237 |
| Streptavidin APC | Biolegend | Cat #405207 |
| Streptavidin Alexa Fluor 647 | Biolegend | Cat #405237 |
| Ghost Dye Red 780 Viability dye | Cytek | Cat #13-0865-T100 |
|
| ||
| Bacterial and virus strains | ||
|
| ||
| LCMV-Armstrong | Whitmire Lab | N/A, generated in house |
|
| ||
| Chemicals, peptides, and recombinant proteins | ||
|
| ||
| Streptavidin BV421 | Biolegend | Cat #4414S |
| Streptavidin PE | Biolegend | Cat #405237 |
| Streptavidin APC | Biolegend | Cat # 405207 |
| Streptavidin Alexa Fluor 647 | Biolegend | Cat # 405237 |
| I-AbGP66-77 Tetramer-BV421 | NIH Tetramer Core | N/A |
| I-AbGP66-77 Tetramer-APC | NIH Tetramer Core | N/A |
| I-Ab-control Tetramer-BV421 | NIH Tetramer Core | N/A |
| I-Ab-control Tetramer-APC | NIH Tetramer Core | N/A |
| DbGP33-41 Tetramer-APC | NIH Tetramer Core | N/A |
| DbGP33-41 Tetramer-BV421 | NIH Tetramer Core | N/A |
| DbGP396-404 Tetramer-APC | NIH Tetramer Core | N/A |
| DbGP396-404 Tetramer-BV421 | NIH Tetramer Core | N/A |
| 2-mercaptoethanol | Sigma-Aldrich | Cat# M7522 |
| ACK lysing Buffer | Lonza | Cat# 10-548E |
| Agar:Agar | EMD | Cat# 1.01614.0500 |
| Bovine Serum Albumin | Sigma-Aldrich | Cat# A4503 |
| Brefeldin A Solution (1000x) | Biolegend | Cat# 420601 |
| Cell strainer (30um) | Sysmex | Cat# NC9682496 |
| Cell strainer (70um) | Greiner | Cat# 542070 |
| DH5-alpha \ (Subcloning efficiency) | LifeTechnologies | Cat# 18265017 |
| DMEM | Lonza | Cat# 12-614F |
| DMEM | Cytiva | Cat# SH30285.FS |
| EcoRI-HF | New England Biolabs | Cat# R3101S |
| EMEM | Sigma-Aldrich | Cat# 56416C |
| Ethidium Bromide | Calbiochem | Cat# 18H235208 |
| Fetal Bovine Serum | VWR | Cat# 97068-085 |
| Ficoll-Paque PLUS | Cytiva | Cat# 17144002 |
| Fixation Buffer | Biolegend | Cat# 420801 |
| FoxP3 Transcription Factor Staining Kit | eBioscience | Cat# 00-5523-00 |
| KAPA pure SPRI beads | Rocke | Cat# 7983271001 |
| GoTaq Green Master Mix | Promega | Cat# M7123 |
| HEPES 1M | Gibco | Cat# 15630-090 |
| L-Glutamine | Lonza | Cat# 17-605L |
| Max Efficiency Stbl2 | LifeTechnologies | Cat# 10268019 |
| MEM Non-Essential Amino Acids | Gibco | Cat# 11140-050 |
| NEB5-alpha competent E. Coli (High Efficiency) | New England Biolabs | Cat# C2987H |
| NEBNext HiFi 2X PCR mix | New England Biolabs | Cat# M0541L |
| Neutral Buffered Formalin (10%) | Thermofisher | Cat# 22-050-104 |
| PBS (10x) | Gibco | Cat# 70011-044 |
| PBS (1x) | VWR | Cat# SH30028.01 |
| Pen/Strep | VWR | Cat# BW17-602E |
| Percoll | GE Healthcare | Cat# 17-0891-02 |
| Permeabilization Wash Buffer | Biolegend | Cat# 421002 |
| Poly-D-Lysine | Gibco | Cat# M7522 |
| Polybrene | Sigma | Cat# 10-548E |
| Protease inhibitor | Sigma | Cat# 11836170001 |
| Proteinase K | Thermofisher | Cat# check |
| Recombinant Human IL-2 | Peprotech | Cat# A4503 |
| RPMI 1640 | Lonza | Cat# 420601 |
| RPMI 1640 | VWR | Cat# NC9682496 |
| Sodium Pyruvate (100mM) | Gibco | Cat# 542070 |
| TAE buffer (10x) | Corning | Cat# 18265017 |
| Trypan Blue | Lonza | Cat# 12-614F |
| UltraPure Agarose | Invitrogen | Cat# SH30285.FS |
| XhoI | New England Biolabs | Cat# R3101S |
| Zymo DNA Clean and Concentrator | Zymo | Cat# 56416C |
| Zymopure II Plasmid Midi Prep | Zymo | Cat# 18H235208 |
| Zymopure II Plasmid Mini Prep | Zymo | Cat# 97068-085 |
|
| ||
| Critical commercial assays | ||
|
| ||
| ArC™ Compensation Bead Kit | Thermofisher | Cat# A10346 |
| MojoSort™ mouse CD4 T cell Isolation Kit | Biolegend | Cat# 480033 |
| MojoSort™ Streptavidin Nanobeads | Biolegend | Cat# 480016 |
| UltraComp eBeads™ | Thermofisher | Cat# 01-2222-42 |
| UltraComp eBeads™ Plus | Thermofisher | Cat# 01-3333-42 |
| anti-mouse TotalSeq™ Hashtag 1 | Biolegend | Cat# 155831; RRID:AB_2814067 |
| anti-mouse TotalSeq™ Hashtag 2 | Biolegend | Cat# 155833; RRID:AB_2814068 |
| anti-mouse TotalSeq™ Hashtag 3 | Biolegend | Cat# 155835; RRID: AB_2814069 |
| anti-mouse TotalSeq™ Hashtag 6 | Biolegend | Cat# 155841; RRID:AB_2814072 |
| pAG-Tn5 | Epicypher | Cat# 15-1017 |
| Concanavalin A magnetic beads | Cell Signaling | Cat# 93569S |
|
| ||
| Deposited data | ||
|
| ||
| scRNA-seq: CD4+ T cells; Spleen | This paper | GEO: GSE282033 |
|
| ||
| Experimental models: Cell lines | ||
|
| ||
| Vero-E6 | Michael Buchmeier | The Scripps Research Institute, La Jolla, CA |
| BHK-21 | American Type Culture Collection | Cat# CCL-10 |
| Plat-E Cells | CellBioLabs (kindly provided by Dr. Milner, UNC) | Cat# RV-101 |
|
| ||
| Experimental models: Organisms/strains | ||
|
| ||
| Mouse: C57BL/6J | Jackson Laboratory (bred at UNC) | Cat# 000664 |
| Mouse: B6.Ly5a | Jackson Laboratory (bred at UNC) | Cat# 002014 |
| Mouse: LckCre | Jackson Laboratory (bred at UNC) | Cat# 003802 |
| Mouse: Kmt2dfl/fl | Bred in house | Jang et al.49 |
| Mouse: SMARTA TCR-Tg (B6.CD45.1) | Backcrossed in Whitmire Lab | Oxenius et al.81 |
| Mouse: P14 TCR-Tg (B6.CD45.1) | Backcrossed in Whitmire Lab | Pircher et al.82 |
|
| ||
| Oligonucleotides | ||
|
| ||
| Genotyping for Lck-Cre (FW) | TGCAACGAGTGATGAGGTTC | Eurofins |
| Genotyping for Lck-Cre (RV) | ACAGCATTGCTGTCACTTGG | Eurofins |
| Genotyping for KMT2Dfl/fl (FW1) | ATAAACGGTGAGCTTGTGCG | Eurofins |
| Genotyping for KMT2Dfl/fl (FW2) | AAGTTCCATAGCCATTGCTC | Eurofins |
| Genotyping for KMT2Dfl/fl (RV) | TTTCACCACTGTCGACCAAG | Eurofins |
| Thpok GTE (FW) | AGCCCTGGGTTCTTCTCTTC | Eurofins |
| Thpok GTE (RV) | CCTCCTTTCTTTCCCCTTTG | Eurofins |
| Thpok Proximal Enhancer (FW) | TGAGCCACATGTCACTAGAG | Eurofins |
| Thpok Proximal Enhancer (RV) | GAAGTTTAGAGGACCTGGAG | Eurofins |
| Thpok Site A (FW) | CCAGCCACCAAAAGTTCATC | Eurofins |
| Thpok Site A (RV) | TGTGAGGGTACAGGAAGTAC | Eurofins |
| Il21 CNS-49 (FW) | GGACCTCAACACTACCTTTTGT | Eurofins |
| Il21 CNS-49 (RV) | CCTTCCCATCACTGCTCATG | Eurofins |
| Hoxb1 (FW) | AGTCGGAAGGAGATGGAAGC | Eurofins |
| Hoxb1 (RV) | CTGTCTTAGGTGGGTTTCTC | Eurofins |
| Gene desert region (FW) | TTTCCTGCCTCTGCCTTTTA | Eurofins |
| Gene desert region (RV) | AGGTGGCACAGTGGGTAAAG | Eurofins |
| Kmt2d exon 50-51 (FW) | GGGTGGAGAGCTGTCAGAATTATT | Eurofins |
| Kmt2d exon 50-51 (RV) | CATGAGCGGTAACTCCATCAGA | Eurofins |
|
| ||
| Recombinant DNA | ||
|
| ||
| MSCV-IRES-eGFP | Addgene | Cat# 20672 |
| MSCV-ThPok-t2a-eGFP | Kindly provided by Dr. Justin Milner | N/A |
| MSCV-Tcf1 (p33) - t2a-eGFP | Kindly provided by Dr. Justin Milner | N/A |
|
| ||
| Software and algorithms | ||
|
| ||
| Cell Ranger | 10x Genomics | Zheng et al.83 |
| FlowJo v10 | Treestar | https://www.flowjo.com |
| GraphPad Prism v10 | Dotmatics | https://www.graphpad.com |
| IGV v2.18.2 | Robinson et al.84 | http://www.igv.org/ |
| Loupe Browser v8.0.0 | 10x Genomics | https://www.10xgenomics.com |
| R Studio | N/A | |
| Seurat v5.1.0 | Stuart et al.85 | http://www.satijalab.org/seurat; RRID: SCR_016341 |
High lights.
KMT2D promotes antiviral CD4+ and CD8+ T cell cytokine expression
CD4+ T cell expression of KMT2D enhances TFH formation and antibody responses
KMT2D limits the formation of cytolytic CD4+ T cells
ACKNOWLEDGMENTS
Dr. Kai Ge (NIDDK) kindly provided KMT2Dfl/fl mice. Dr. Justin Milner provided Plat-E cells and the THPOK and TCF1 retroviral constructs. We thank Dr. Justin Milner and Dr. Genevieve Nicole Mullins for offering technical advice. The NIH Tetramer Core Facility, supported by NIAID contract 75N93020D00005, provided the tetramers. Flow cytometry acquisitions were performed at the UNC Flow Cytometry Core, which is supported by NCI Center Core Support Grant 5P30CA016086–41. The UNC Advanced Analytics Core, supported by P30 DK034987 from NIDDK, assisted with cell sorting and processing of cells for scRNA-seq. The Bioinformatics and Analytics Research Collaborative assisted us with processing scRNA-seq data. This work was supported by NIH awards R01AI143894, R01AI138337, and R01AI131685 and DOD award W81XWH2110919 to J.K.W. and by NIH award R01DE030530 to K.B.S.
Footnotes
DECLARATION OF INTERESTS
The authors declare no competing interests.
REFERENCES
- 1.Nothelfer K, Sansonetti PJ, and Phalipon A (2015). Pathogen manipulation of B cells: the best defence is a good offence. Nat. Rev. Microbiol. 13, 173–184. 10.1038/nrmicro3415. [DOI] [PubMed] [Google Scholar]
- 2.Straub T, Schweier O, Bruns M, Nimmerjahn F, Waisman A, and Pircher H (2013). Nucleoprotein-specific nonneutralizing antibodies speed up LCMV elimination independently of complement and FcγR. Eur. J. Immunol. 43, 2338–2348. 10.1002/eji.201343565. [DOI] [PubMed] [Google Scholar]
- 3.Crotty S (2019). T Follicular Helper Cell Biology: A Decade of Discovery and Diseases. Immunity 50, 1132–1148. 10.1016/j.immuni.2019.04.011. [DOI] [PMC free article] [PubMed] [Google Scholar]
- 4.Ise W, Fujii K, Shiroguchi K, Ito A, Kometani K, Takeda K, Kawakami E, Yamashita K, Suzuki K, Okada T, and Kurosaki T (2018). T Follicular Helper Cell-Germinal Center B Cell Interaction Strength Regulates Entry into Plasma Cell or Recycling Germinal Center Cell Fate. Immunity 48, 702–715.e4. 10.1016/j.immuni.2018.03.027. [DOI] [PubMed] [Google Scholar]
- 5.Linterman MA, Beaton L, Yu D, Ramiscal RR, Srivastava M, Hogan JJ, Verma NK, Smyth MJ, Rigby RJ, and Vinuesa CG (2010). IL-21 acts directly on B cells to regulate Bcl-6 expression and germinal center responses. J. Exp. Med. 207, 353–363. 10.1084/jem.20091738. [DOI] [PMC free article] [PubMed] [Google Scholar]
- 6.Whitmire JK, Slifka MK, Grewal IS, Flavell RA, and Ahmed R (1996). CD40 ligand-deficient mice generate a normal primary cytotoxic T-lymphocyte response but a defective humoral response to a viral infection. J. Virol. 70, 8375–8381. [DOI] [PMC free article] [PubMed] [Google Scholar]
- 7.Greczmiel U, Kräutler NJ, Pedrioli A, Bartsch I, Agnellini P, Bedenikovic G, Harker J, Richter K, and Oxenius A (2017). Sustained T follicular helper cell response is essential for control of chronic viral infection. Sci. Immunol. 2, eaam8686. 10.1126/sciimmunol.aam8686. [DOI] [PubMed] [Google Scholar]
- 8.Sheikh AA, and Groom JR (2021). Transcription tipping points for T follicular helper cell and T-helper 1 cell fate commitment. Cell. Mol. Immunol. 18, 528–538. 10.1038/s41423-020-00554-y. [DOI] [PMC free article] [PubMed] [Google Scholar]
- 9.Choi YS, Kageyama R, Eto D, Escobar TC, Johnston RJ, Monticelli L, Lao C, and Crotty S (2011). ICOS receptor instructs T follicular helper cell versus effector cell differentiation via induction of the transcriptional repressor Bcl6. Immunity 34, 932–946. 10.1016/j.immuni.2011.03.023. [DOI] [PMC free article] [PubMed] [Google Scholar]
- 10.Choi YS, Eto D, Yang JA, Lao C, and Crotty S (2013). Cutting edge: STAT1 is required for IL-6-mediated Bcl6 induction for early follicular helper cell differentiation. J. Immunol. 190, 3049–3053. 10.4049/jimmunol.1203032. [DOI] [PMC free article] [PubMed] [Google Scholar]
- 11.Stone EL, Pepper M, Katayama CD, Kerdiles YM, Lai C-Y, Emslie E, Lin YC, Yang E, Goldrath AW, Li MO, et al. (2015). ICOS Coreceptor Signaling Inactivates the Transcription Factor FOXO1 to Promote Tfh Cell Differentiation. Immunity 42, 239–251. 10.1016/j.immuni.2015.01.017. [DOI] [PMC free article] [PubMed] [Google Scholar]
- 12.Xu L, Cao Y, Xie Z, Huang Q, Bai Q, Yang X, He R, Hao Y, Wang H, Zhao T, et al. (2015). The transcription factor TCF-1 initiates the differentiation of TFH cells during acute viral infection. Nat. Immunol. 16, 991–999. 10.1038/ni.3229. [DOI] [PubMed] [Google Scholar]
- 13.Choi YS, Gullicksrud JA, Xing S, Zeng Z, Shan Q, Li F, Love PE, Peng W, Xue H-H, and Crotty S (2015). LEF-1 and TCF-1 orchestrate TFH differentiation by regulating differentiation circuits upstream of the transcriptional repressor Bcl6. Nat. Immunol. 16, 980–990. 10.1038/ni.3226. [DOI] [PMC free article] [PubMed] [Google Scholar]
- 14.Vacchio MS, Ciucci T, Gao Y, Watanabe M, Balmaceno-Criss M, McGinty MT, Huang A, Xiao Q, McConkey C, Zhao Y, et al. (2019). A Thpok-Directed Transcriptional Circuitry Promotes Bcl6 and Maf Expression to Orchestrate T Follicular Helper Differentiation. Immunity 51, 465–478.e6. 10.1016/j.immuni.2019.06.023. [DOI] [PMC free article] [PubMed] [Google Scholar]
- 15.Xu W, Zhao X, Wang X, Feng H, Gou M, Jin W, Wang X, Liu X, and Dong C (2019). The Transcription Factor Tox2 Drives T Follicular Helper Cell Development via Regulating Chromatin Accessibility. Immunity 51, 826–839.e5. 10.1016/j.immuni.2019.10.006. [DOI] [PubMed] [Google Scholar]
- 16.Ise W, Kohyama M, Schraml BU, Zhang T, Schwer B, Basu U, Alt FW, Tang J, Oltz EM, Murphy TL, and Murphy KM (2011). The transcription factor BATF controls the global regulators of class-switch recombination in both B cells and T cells. Nat. Immunol. 12, 536–543. 10.1038/ni.2037. [DOI] [PMC free article] [PubMed] [Google Scholar]
- 17.Liao W, Lin JX, Wang L, Li P, and Leonard WJ (2011). Modulation of cytokine receptors by IL-2 broadly regulates differentiation into helper T cell lineages. Nat. Immunol. 12, 551–559. 10.1038/ni.2030. [DOI] [PMC free article] [PubMed] [Google Scholar]
- 18.Ray JP, Marshall HD, Laidlaw BJ, Staron MM, Kaech SM, and Craft J (2014). Transcription Factor STAT3 and Type I Interferons Are Corepressive Insulators for Differentiation of Follicular Helper and T Helper 1 Cells. Immunity 40, 367–377. 10.1016/j.immuni.2014.02.005. [DOI] [PMC free article] [PubMed] [Google Scholar]
- 19.Krueger PD, Goldberg MF, Hong S-W, Osum KC, Langlois RA, Kotov DI, Dileepan T, and Jenkins MK (2021). Two sequential activation modules control the differentiation of protective T helper-1 (Th1) cells. Immunity 54, 687–701.e4. 10.1016/j.immuni.2021.03.006. [DOI] [PMC free article] [PubMed] [Google Scholar]
- 20.DiToro D, Winstead CJ, Pham D, Witte S, Andargachew R, Singer JR, Wilson CG, Zindl CL, Luther RJ, Silberger DJ, et al. (2018). Differential IL-2 expression defines developmental fates of follicular versus nonfollicular helper T cells. Science 361, eaao2933. 10.1126/science.aao2933. [DOI] [PMC free article] [PubMed] [Google Scholar]
- 21.Schmidl C, Delacher M, Huehn J, and Feuerer M (2018). Epigenetic mechanisms regulating T-cell responses. J. Allergy Clin. Immunol. 142, 728–743. 10.1016/j.jaci.2018.07.014. [DOI] [PubMed] [Google Scholar]
- 22.Lu KT, Kanno Y, Cannons JL, Handon R, Bible P, Elkahloun AG, Anderson SM, Wei L, Sun H, O’Shea JJ, and Schwartzberg PL (2011). Functional and epigenetic studies reveal multistep differentiation and plasticity of in vitro-generated and in vivo-derived follicular T helper cells. Immunity 35, 622–632. 10.1016/j.immuni.2011.07.015. [DOI] [PMC free article] [PubMed] [Google Scholar]
- 23.Hatzi K, Nance JP, Kroenke MA, Bothwell M, Haddad EK, Melnick A, and Crotty S (2015). BCL6 orchestrates Tfh cell differentiation via multiple distinct mechanisms. J. Exp. Med. 212, 539–553. 10.1084/jem.20141380. [DOI] [PMC free article] [PubMed] [Google Scholar]
- 24.Weinstein JS, Lezon-Geyda K, Maksimova Y, Craft S, Zhang Y, Su M, Schulz VP, Craft J, and Gallagher PG (2014). Global transcriptome analysis and enhancer landscape of human primary T follicular helper and T effector lymphocytes. Blood 124, 3719–3729. 10.1182/blood-2014-06-582700. [DOI] [PMC free article] [PubMed] [Google Scholar]
- 25.Chen X, Cao G, Wu J, Wang X, Pan Z, Gao J, Tian Q, Xu L, Li Z, Hao Y, et al. (2020). The histone methyltransferase EZH2 primes the early differentiation of follicular helper T cells during acute viral infection. Cell. Mol. Immunol. 17, 247–260. 10.1038/s41423-019-0219-z. [DOI] [PMC free article] [PubMed] [Google Scholar]
- 26.Bélanger S, Haupt S, Faliti CE, Getzler A, Choi J, Diao H, Karunadharma PP, Bild NA, Pipkin ME, and Crotty S (2023). The Chromatin Regulator Mll1 Supports T Follicular Helper Cell Differentiation by Controlling Expression of Bcl6, LEF-1, and TCF-1. J. Immunol. 210, 1752–1760. 10.4049/jimmunol.2200927. [DOI] [PMC free article] [PubMed] [Google Scholar]
- 27.Li F, Zeng Z, Xing S, Gullicksrud JA, Shan Q, Choi J, Badovinac VP, Crotty S, Peng W, and Xue HH (2018). Ezh2 programs TFH differentiation by integrating phosphorylation-dependent activation of Bcl6 and polycomb-dependent repression of p19Arf. Nat. Commun. 9, 5452. 10.1038/s41467-018-07853-z. [DOI] [PMC free article] [PubMed] [Google Scholar]
- 28.Luo Y, Li D, Xie L, Lei S, Chen X, Wang C, Yao D, Li L, Fang J, Chen C, et al. (2022). EZH2 restricts Tcf7 DNA methylation and promotes TFH differentiation during acute viral infection. Front. Immunol. 13, 942465. 10.3389/fimmu.2022.942465. [DOI] [PMC free article] [PubMed] [Google Scholar]
- 29.Cook KD, Shpargel KB, Starmer J, Whitfield-Larry F, Conley B, Allard DE, Rager JE, Fry RC, Davenport ML, Magnuson T, et al. (2015). T Follicular Helper Cell-Dependent Clearance of a Persistent Virus Infection Requires T Cell Expression of the Histone Demethylase UTX. Immunity 43, 703–714. 10.1016/j.immuni.2015.09.002. [DOI] [PMC free article] [PubMed] [Google Scholar]
- 30.Wang SP, Tang Z, Chen CW, Shimada M, Koche RP, Wang LH, Nakadai T, Chramiec A, Krivtsov AV, Armstrong SA, and Roeder RG (2017). A UTX-MLL4-p300 Transcriptional Regulatory Network Coordinately Shapes Active Enhancer Landscapes for Eliciting Transcription. Mol. Cell 67, 308–321.e6. 10.1016/j.molcel.2017.06.028. [DOI] [PMC free article] [PubMed] [Google Scholar]
- 31.Cenik BK, and Shilatifard A (2021). COMPASS and SWI/SNF complexes in development and disease. Nat. Rev. Genet. 22, 38–58. 10.1038/s41576-020-0278-0. [DOI] [PubMed] [Google Scholar]
- 32.Rickels R, Wang L, Iwanaszko M, Ozark PA, Morgan MA, Piunti A, Khalatyan N, Soliman SHA, Rendleman EJ, Savas JN, et al. (2020). A small UTX stabilization domain of Trr is conserved within mammalian MLL3–4/COMPASS and is sufficient to rescue loss of viability in null animals. Genes Dev. 34, 1493–1502. 10.1101/gad.339762.120. [DOI] [PMC free article] [PubMed] [Google Scholar]
- 33.Aubert Y, Egolf S, and Capell BC (2019). The Unexpected Noncatalytic Roles of Histone Modifiers in Development and Disease. Trends Genet. 35, 645–657. 10.1016/j.tig.2019.06.004. [DOI] [PMC free article] [PubMed] [Google Scholar]
- 34.Yan J, Chen SAA, Local A, Liu T, Qiu Y, Dorighi KM, Preissl S, Rivera CM, Wang C, Ye Z, et al. (2018). Histone H3 lysine 4 monomethylation modulates long-range chromatin interactions at enhancers. Cell Res. 28, 204–220. 10.1038/cr.2018.1. [DOI] [PMC free article] [PubMed] [Google Scholar]
- 35.Comel M, Saad N, Sil D, Apparailly F, Willems M, Djouad F, Andrau JC, Lozano C, and Genevieve D (2024). Abnormal Immune Profile in Individuals with Kabuki Syndrome. J. Clin. Immunol. 45, 7. 10.1007/s10875-024-01796-5. [DOI] [PubMed] [Google Scholar]
- 36.Margot H, Boursier G, Duflos C, Sanchez E, Amiel J, Andrau J-C, Arpin S, Brischoux-Boucher E, Boute O, Burglen L, et al. (2020). Immunopathological manifestations in Kabuki syndrome: a registry study of 177 individuals. Genet. Med. 22, 181–188. 10.1038/s41436-019-0623-x. [DOI] [PubMed] [Google Scholar]
- 37.Shpargel KB, Mangini CL, Xie G, Ge K, and Magnuson T (2020). The KMT2D Kabuki syndrome histone methylase controls neural crest cell differentiation and facial morphology. Development 147, dev187997. 10.1242/dev.187997. [DOI] [PMC free article] [PubMed] [Google Scholar]
- 38.Andricovich J, Perkail S, Kai Y, Casasanta N, Peng W, and Tzatsos A (2018). Loss of KDM6A Activates Super-Enhancers to Induce Gender-Specific Squamous-like Pancreatic Cancer and Confers Sensitivity to BET Inhibitors. Cancer Cell 33, 512–526.e8. 10.1016/j.ccell.2018.02.003. [DOI] [PMC free article] [PubMed] [Google Scholar]
- 39.Cuvertino S, Hartill V, Colyer A, Garner T, Nair N, Al-Gazali L, Canham N, Faundes V, Flinter F, Hertecant J, et al. (2020). A restricted spectrum of missense KMT2D variants cause a multiple malformations disorder distinct from Kabuki syndrome. Genet. Med. 22, 867–877. 10.1038/s41436-019-0743-3. [DOI] [PMC free article] [PubMed] [Google Scholar]
- 40.Luperchio TR, Boukas L, Zhang L, Pilarowski G, Jiang J, Kalinousky A, Hansen KD, and Bjornsson HT (2021). Leveraging the Mendelian disorders of the epigenetic machinery to systematically map functional epigenetic variation. Elife 10, e65884. 10.7554/eLife.65884. [DOI] [PMC free article] [PubMed] [Google Scholar]
- 41.Pilarowski GO, Cazares T, Zhang L, Benjamin JS, Liu K, Jagannathan S, Mousa N, Kasten J, Barski A, Lindsley AW, and Bjornsson HT (2020). Abnormal Peyer patch development and B-cell gut homing drive IgA deficiency in Kabuki syndrome. J. Allergy Clin. Immunol. 145, 982–992. 10.1016/j.jaci.2019.11.034. [DOI] [PubMed] [Google Scholar]
- 42.Zhang J, Dominguez-Sola D, Hussein S, Lee JE, Holmes AB, Bansal M, Vlasevska S, Mo T, Tang H, Basso K, et al. (2015). Disruption of KMT2D perturbs germinal center B cell development and promotes lymphomagenesis. Nat. Med. 21, 1190–1198. 10.1038/nm.3940. [DOI] [PMC free article] [PubMed] [Google Scholar]
- 43.Ortega-Molina A, Boss IW, Canela A, Pan H, Jiang Y, Zhao C, Jiang M, Hu D, Agirre X, Niesvizky I, et al. (2015). The histone lysine methyltransferase KMT2D sustains a gene expression program that represses B cell lymphoma development. Nat. Med. 21, 1199–1208. 10.1038/nm.3943. [DOI] [PMC free article] [PubMed] [Google Scholar]
- 44.Placek K, Hu G, Cui K, Zhang D, Ding Y, Lee JE, Jang Y, Wang C, Konkel JE, Song J, et al. (2017). MLL4 prepares the enhancer landscape for Foxp3 induction via chromatin looping. Nat. Immunol. 18, 1035–1045. 10.1038/ni.3812. [DOI] [PMC free article] [PubMed] [Google Scholar]
- 45.Potter SJ, Zhang L, Kotliar M, Wu Y, Schafer C, Stefan K, Boukas L, Qu’d D, Bodamer O, Simpson BN, et al. (2024). KMT2D regulates activation, localization, and integrin expression by T-cells. Front. Immunol. 15, 1341745. 10.3389/fimmu.2024.1341745. [DOI] [PMC free article] [PubMed] [Google Scholar]
- 46.Kim J, Nguyen T, Cifello J, Ahmad R, Zhang Y, Yang Q, Lee JE, Li X, Kai Y, De S, et al. (2022). Lysine methyltransferase Kmt2d regulates naive CD8+ T cell activation-induced survival. Front. Immunol. 13, 1095140. 10.3389/fimmu.2022.1095140. [DOI] [PMC free article] [PubMed] [Google Scholar]
- 47.Cui K, Chen Z, Cao Y, Liu S, Ren G, Hu G, Fang D, Wei D, Liu C, Zhu J, et al. (2023). Restraint of IFN-γ expression through a distal silencer CNS–28 for tissue homeostasis. Immunity 56, 944–958.e6. 10.1016/j.immuni.2023.03.006. [DOI] [PMC free article] [PubMed] [Google Scholar]
- 48.Liu S, Cao Y, Cui K, Ren G, Zhao T, Wang X, Wei D, Chen Z, Gurram RK, Liu C, et al. (2024). Regulation of T helper cell differentiation by the interplay between histone modification and chromatin interaction. Immunity 57, 987–1004.e5. 10.1016/j.immuni.2024.03.018. [DOI] [PMC free article] [PubMed] [Google Scholar]
- 49.Jang Y, Broun A, Wang C, Park Y-K, Zhuang L, Lee J-E, Froimchuk E, Liu C, and Ge K (2019). H3.3K4M destabilizes enhancer H3K4 methyltransferases MLL3/MLL4 and impairs adipose tissue development. Nucleic Acids Res. 47, 607–620. 10.1093/nar/gky982. [DOI] [PMC free article] [PubMed] [Google Scholar]
- 50.Kannanganat S, Ibegbu C, Chennareddi L, Robinson HL, and Amara RR (2007). Multiple-Cytokine-Producing Antiviral CD4 T Cells Are Functionally Superior to Single-Cytokine-Producing Cells. J. Virol. 81, 8468–8476. 10.1128/jvi.00228-07. [DOI] [PMC free article] [PubMed] [Google Scholar]
- 51.Seder RA, Darrah PA, and Roederer M (2008). T-cell quality in memory and protection: implications for vaccine design. Nat. Rev. Immunol. 8, 247–258. 10.1038/nri2274. [DOI] [PubMed] [Google Scholar]
- 52.Nguyen C, Kudek M, Zander R, Niu H, Shen J, Bauer A, Alson D, Khatun A, Chen Y, Sun J, et al. (2024). Bhlhe40 Promotes CD4+ T Helper 1 Cell and Suppresses T Follicular Helper Cell Differentiation during Viral Infection. J. Immunol. 212, 1829–1842. 10.4049/jimmunol.2300355. [DOI] [PMC free article] [PubMed] [Google Scholar]
- 53.Zander R, Kasmani MY, Chen Y, Topchyan P, Shen J, Zheng S, Burns R, Ingram J, Cui C, Joshi N, et al. (2022). Tfh-cell-derived interleukin 21 sustains effector CD8(+) T cell responses during chronic viral infection. Immunity 55, 475–493.e5. 10.1016/j.immuni.2022.01.018. [DOI] [PMC free article] [PubMed] [Google Scholar]
- 54.Zander R, Khatun A, Kasmani MY, Chen Y, and Cui W (2022). Delineating the transcriptional landscape and clonal diversity of virus-specific CD4(+) T cells during chronic viral infection. Elife 11, e80079. 10.7554/eLife.80079. [DOI] [PMC free article] [PubMed] [Google Scholar]
- 55.Choi J, Diao H, Faliti CE, Truong J, Rossi M, Bélanger S, Yu B, Goldrath AW, Pipkin ME, and Crotty S (2020). Bcl-6 is the nexus transcription factor of T follicular helper cells via repressor-of-repressor circuits. Nat. Immunol. 21, 777–789. 10.1038/s41590-020-0706-5. [DOI] [PMC free article] [PubMed] [Google Scholar]
- 56.Shaw LA, Bélanger S, Omilusik KD, Cho S, Scott-Browne JP, Nance JP, Goulding J, Lasorella A, Lu L-F, Crotty S, and Goldrath AW (2016). Id2 reinforces TH1 differentiation and inhibits E2A to repress TFH differentiation. Nat. Immunol. 17, 834–843. 10.1038/ni.3461. [DOI] [PMC free article] [PubMed] [Google Scholar]
- 57.Iyer SS, Latner DR, Zilliox MJ, McCausland M, Akondy RS, Penaloza-Macmaster P, Hale JS, Ye L, Mohammed AUR, Yamaguchi T, et al. (2013). Identification of novel markers for mouse CD4(+) T follicular helper cells. Eur. J. Immunol. 43, 3219–3232. 10.1002/eji.201343469. [DOI] [PMC free article] [PubMed] [Google Scholar]
- 58.Künzli M, Schreiner D, Pereboom TC, Swarnalekha N, Litzler LC, Lötscher J, Ertuna YI, Roux J, Geier F, Jakob RP, et al. (2020). Long-lived T follicular helper cells retain plasticity and help sustain humoral immunity. Sci. Immunol. 5, eaay5552. 10.1126/sciimmunol.aay5552. [DOI] [PubMed] [Google Scholar]
- 59.Marshall HD, Chandele A, Jung YW, Meng H, Poholek AC, Parish IA, Rutishauser R, Cui W, Kleinstein SH, Craft J, and Kaech SM (2011). Differential expression of Ly6C and T-bet distinguish effector and memory Th1 CD4(+) cell properties during viral infection. Immunity 35, 633–646. 10.1016/j.immuni.2011.08.016. [DOI] [PMC free article] [PubMed] [Google Scholar]
- 60.Ciucci T, Vacchio MS, Gao Y, Tomassoni Ardori F, Candia J, Mehta M, Zhao Y, Tran B, Pepper M, Tessarollo L, et al. (2019). The Emergence and Functional Fitness of Memory CD4(+) T Cells Require the Transcription Factor Thpok. Immunity 50, 91–105.e4. 10.1016/j.immuni.2018.12.019. [DOI] [PMC free article] [PubMed] [Google Scholar]
- 61.Khatun A, Kasmani MY, Zander R, Schauder DM, Snook JP, Shen J, Wu X, Burns R, Chen Y-G, Lin C-W, et al. (2021). Single-cell lineage mapping of a diverse virus-specific naive CD4 T cell repertoire. J. Exp. Med. 218, e20200650. 10.1084/jem.20200650. [DOI] [PMC free article] [PubMed] [Google Scholar]
- 62.Song W, and Craft J (2019). T follicular helper cell heterogeneity: Time, space, and function. Immunol. Rev. 288, 85–96. 10.1111/imr.12740. [DOI] [PMC free article] [PubMed] [Google Scholar]
- 63.Petersone L, Wang CJ, Edner NM, Fabri A, Nikou SA, Hinze C, Ross EM, Ntavli E, Elfaki Y, Heuts F, et al. (2023). IL-21 shapes germinal center polarization via light zone B cell selection and cyclin D3 upregulation. J. Exp. Med. 220, e20221653. 10.1084/jem.20221653. [DOI] [PMC free article] [PubMed] [Google Scholar]
- 64.Luo W, Weisel F, and Shlomchik MJ (2018). B Cell Receptor and CD40 Signaling Are Rewired for Synergistic Induction of the c-Myc Transcription Factor in Germinal Center B Cells. Immunity 48, 313–326.e5. 10.1016/j.immuni.2018.01.008. [DOI] [PMC free article] [PubMed] [Google Scholar]
- 65.Thelen B, Schipperges V, Knörlein P, Hummel JF, Arnold F, Kupferschmid L, Klose CSN, Arnold SJ, Boerries M, and Tanriver Y (2023). Eomes is sufficient to regulate IL-10 expression and cytotoxic effector molecules in murine CD4+ T cells. Front. Immunol. 14, 1058267. 10.3389/fimmu.2023.1058267. [DOI] [PMC free article] [PubMed] [Google Scholar]
- 66.Moon S, Park Y, Hyeon S, Kim Y-M, Kim J-H, Kim H, Park S, Lee K-J, Koo B-K, Ha S-J, and Lee S-W (2021). Niche-specific MHC II and PD-L1 regulate CD4+CD8αα+ intraepithelial lymphocyte differentiation. J. Exp. Med. 218, e20201665. 10.1084/jem.20201665. [DOI] [PMC free article] [PubMed] [Google Scholar]
- 67.Parsa R, London M, Rezende de Castro TB, Reis B, Buissant des Amorie J, Smith JG, and Mucida D (2022). Newly recruited intraepithelial Ly6A+CCR9+CD4+ T cells protect against enteric viral infection. Immunity 55, 1234–1249.e6. 10.1016/j.immuni.2022.05.001. [DOI] [PMC free article] [PubMed] [Google Scholar]
- 68.Weinstein JS, Laidlaw BJ, Lu Y, Wang JK, Schulz VP, Li N, Herman EI, Kaech SM, Gallagher PG, and Craft J (2018). STAT4 and T-bet control follicular helper T cell development in viral infections. J. Exp. Med. 215, 337–355. 10.1084/jem.20170457. [DOI] [PMC free article] [PubMed] [Google Scholar]
- 69.Baessler A, Novis CL, Shen Z, Perovanovic J, Wadsworth M, Thiede KA, Sircy LM, Harrison-Chau M, Nguyen NX, Varley KE, et al. (2022). Tet2 coordinates with Foxo1 and Runx1 to balance T follicular helper cell and T helper 1 cell differentiation. Sci. Adv. 8, eabm4982. 10.1126/sciadv.abm4982. [DOI] [PMC free article] [PubMed] [Google Scholar]
- 70.Lee JH, Sutton HJ, Cottrell CA, Phung I, Ozorowski G, Sewall LM, Nedellec R, Nakao C, Silva M, Richey ST, et al. (2022). Long-primed germinal centres with enduring affinity maturation and clonal migration. Nature 609, 998–1004. 10.1038/s41586-022-05216-9. [DOI] [PMC free article] [PubMed] [Google Scholar]
- 71.Kim YJ, Oh J, Jung S, Kim CJ, Choi J, Jeon YK, Kim HJ, Kim JW, Suh CH, Lee Y, et al. (2023). The transcription factor Mef2d regulates B:T synapse-dependent GC-TFH differentiation and IL-21-mediated humoral immunity. Sci. Immunol. 8, eadf2248. 10.1126/sciimmunol.adf2248. [DOI] [PMC free article] [PubMed] [Google Scholar]
- 72.Wang C, Lee JE, Lai B, Macfarlan TS, Xu S, Zhuang L, Liu C, Peng W, and Ge K (2016). Enhancer priming by H3K4 methyltransferase MLL4 controls cell fate transition. Proc. Natl. Acad. Sci. USA 113, 11871–11876. 10.1073/pnas.1606857113. [DOI] [PMC free article] [PubMed] [Google Scholar]
- 73.Eto D, Lao C, DiToro D, Barnett B, Escobar TC, Kageyama R, Yusuf I, and Crotty S (2011). IL-21 and IL-6 are critical for different aspects of B cell immunity and redundantly induce optimal follicular helper CD4 T cell (Tfh) differentiation. PLoS One 6, e17739. 10.1371/journal.pone.0017739. [DOI] [PMC free article] [PubMed] [Google Scholar]
- 74.Zhao Z, Aoi Y, Philips CN, Meghani KA, Gold SR, Yu Y, John LS, Qian J, Zeidner JM, Meeks JJ, and Shilatifard A (2023). Somatic mutations of MLL4/COMPASS induce cytoplasmic localization providing molecular insight into cancer prognosis and treatment. Proc. Natl. Acad. Sci. USA 120, e2310063120. 10.1073/pnas.2310063120. [DOI] [PMC free article] [PubMed] [Google Scholar]
- 75.Dan JM, Havenar-Daughton C, Kendric K, Al-kolla R, Kaushik K, Rosales SL, Anderson EL, LaRock CN, Vijayanand P, Seumois G, et al. (2019). Recurrent group A Streptococcus tonsillitis is an immunosusceptibility disease involving antibody deficiency and aberrant TFH cells. Sci. Transl. Med. 11, eaau3776. 10.1126/scitranslmed.aau3776. [DOI] [PMC free article] [PubMed] [Google Scholar]
- 76.Lockhart A, Mucida D, and Bilate AM (2024). Intraepithelial Lymphocytes of the Intestine. Annu. Rev. Immunol. 42, 289–316. 10.1146/annurev-immunol-090222-100246. [DOI] [PMC free article] [PubMed] [Google Scholar]
- 77.Mucida D, Husain MM, Muroi S, van Wijk F, Shinnakasu R, Naoe Y, Reis BS, Huang Y, Lambolez F, Docherty M, et al. (2013). Transcriptional reprogramming of mature CD4+ helper T cells generates distinct MHC class II-restricted cytotoxic T lymphocytes. Nat. Immunol. 14, 281–289. 10.1038/ni.2523. [DOI] [PMC free article] [PubMed] [Google Scholar]
- 78.Lin C-H, Chen M-C, Lin L-L, Christian DA, Min B, Hunter CA, and Lu L-F (2021). Gut epithelial IL-27 confers intestinal immunity through the induction of intraepithelial lymphocytes. J. Exp. Med. 218, e20210021. 10.1084/jem.20210021. [DOI] [PMC free article] [PubMed] [Google Scholar]
- 79.Cervantes-Barragan L, Chai JN, Tianero MD, Di Luccia B, Ahern PP, Merriman J, Cortez VS, Caparon MG, Donia MS, Gilfillan S, et al. (2017). Lactobacillus reuteri induces gut intraepithelial CD4+CD8αα+ T cells. Science 357, 806–810. 10.1126/science.aah5825. [DOI] [PMC free article] [PubMed] [Google Scholar]
- 80.Lindsley AW, Saal HM, Burrow TA, Hopkin RJ, Shchelochkov O, Khandelwal P, Xie C, Bleesing J, Filipovich L, Risma K, et al. (2016). Defects of B-cell terminal differentiation in patients with type-1 Kabuki syndrome. J. Allergy Clin. Immunol. 137, 179–187.e10. 10.1016/j.jaci.2015.06.002. [DOI] [PMC free article] [PubMed] [Google Scholar]
- 81.Oxenius A, Bachmann MF, Zinkernagel RM, and Hengartner H (1998). Virus-specific MHC-class II-restricted TCR-transgenic mice: effects on humoral and cellular immune responses after viral infection. Eur. J. Immunol. 28, 390–400. [DOI] [PubMed] [Google Scholar]
- 82.Pircher H, Bürki K, Lang R, Hengartner H, and Zinkernagel RM (1989). Tolerance induction in double specific T-cell receptor transgenic mice varies with antigen. Nature 342, 559–561. [DOI] [PubMed] [Google Scholar]
- 83.Zheng GXY, Terry JM, Belgrader P, Ryvkin P, Bent ZW, Wilson R, Ziraldo SB, Wheeler TD, McDermott GP, Zhu J, et al. (2017). Massively parallel digital transcriptional profiling of single cells. Nat. Commun. 8, 14049. 10.1038/ncomms14049. [DOI] [PMC free article] [PubMed] [Google Scholar]
- 84.Robinson JT, Thorvaldsdóttir H, Winckler W, Guttman M, Lander ES, Getz G, and Mesirov JP (2011). Integrative genomics viewer. Nat. Biotechnol. 29, 24–26. [DOI] [PMC free article] [PubMed] [Google Scholar]
- 85.Stuart T, Butler A, Hoffman P, Hafemeister C, Papalexi E, Mauck WM 3rd, Hao Y, Stoeckius M, Smibert P, and Satija R (2019). Comprehensive Integration of Single-Cell Data. Cell 177, 1888–1902.e21. [DOI] [PMC free article] [PubMed] [Google Scholar]
- 86.Pham D, Moseley CE, Gao M, Savic D, Winstead CJ, Sun M, Kee BL, Myers RM, Weaver CT, and Hatton RD (2019). Batf Pioneers the Reorganization of Chromatin in Developing Effector T Cells via Ets1-Dependent Recruitment of Ctcf. Cell Rep. 29, 1203–1220.e7. 10.1016/j.celrep.2019.09.064. [DOI] [PMC free article] [PubMed] [Google Scholar]
- 87.Steinke FC, Yu S, Zhou X, He B, Yang W, Zhou B, Kawamoto H, Zhu J, Tan K, and Xue HH (2014). TCF-1 and LEF-1 act upstream of Th-POK to promote the CD4(+) T cell fate and interact with Runx3 to silence Cd4 in CD8(+) T cells. Nat. Immunol. 15, 646–656. 10.1038/ni.2897. [DOI] [PMC free article] [PubMed] [Google Scholar]
- 88.Äijö T, Theofilatos D, Cheng M, Smith MD, Xiong Y, Baldwin AS, and Tsagaratou A (2022). TET proteins regulate T cell and iNKT cell lineage specification in a TET2 catalytic dependent manner. Front. Immunol. 13, 940995. 10.3389/fimmu.2022.940995. [DOI] [PMC free article] [PubMed] [Google Scholar]
- 89.Wang L, Wildt KF, Zhu J, Zhang X, Feigenbaum L, Tessarollo L, Paul WE, Fowlkes BJ, and Bosselut R (2008). Distinct functions for the transcription factors GATA-3 and ThPOK during intrathymic differentiation of CD4(+) T cells. Nat. Immunol. 9, 1122–1130. 10.1038/ni.1647. [DOI] [PMC free article] [PubMed] [Google Scholar]
- 90.Hao Y, Stuart T, Kowalski MH, Choudhary S, Hoffman P, Hartman A, Srivastava A, Molla G, Madad S, Fernandez-Granda C, and Satija R (2024). Dictionary learning for integrative, multimodal and scalable single-cell analysis. Nat. Biotechnol. 42, 293–304. 10.1038/s41587-023-01767-y. [DOI] [PMC free article] [PubMed] [Google Scholar]
- 91.Hippen AA, Falco MM, Weber LM, Erkan EP, Zhang K, Doherty JA, Vähärautio A, Greene CS, and Hicks SC (2021). miQC: An adaptive probabilistic framework for quality control of single-cell RNA-sequencing data. PLoS Comput. Biol. 17, e1009290. 10.1371/journal.pcbi.1009290. [DOI] [PMC free article] [PubMed] [Google Scholar]
- 92.Korsunsky I, Millard N, Fan J, Slowikowski K, Zhang F, Wei K, Baglaenko Y, Brenner M, Loh P. r., and Raychaudhuri S (2019). Fast, sensitive and accurate integration of single-cell data with Harmony. Nat. Methods 16, 1289–1296. 10.1038/s41592-019-0619-0. [DOI] [PMC free article] [PubMed] [Google Scholar]
- 93.Love MI, Huber W, and Anders S (2014). Moderated estimation of fold change and dispersion for RNA-seq data with DESeq2. Genome Biol. 15, 550. 10.1186/s13059-014-0550-8. [DOI] [PMC free article] [PubMed] [Google Scholar]
Associated Data
This section collects any data citations, data availability statements, or supplementary materials included in this article.
Supplementary Materials
Data Availability Statement
All experimental data are available within this article and will be shared by the lead contact upon request. scRNA-seq data have been deposited to the Gene Expression Omnibus under accession GEO: GSE282033.
No original code was developed for this study; however, the code utilized in the data processing and analyses is available upon request.
Any additional information required to reanalyze the data reported in this paper is available from the lead contact upon request.