

Abstract
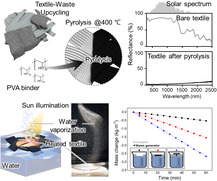
Numerous studies have been conducted into the reuse of such waste fabric; however, diversity in fiber type and the dyes used limits their potential applications. Therefore, innovative methods for recycling waste fiber need to be developed. This study explores the use of waste fabric as the primary raw material for the development of solar steam generators (SSGs) by harnessing abundant and affordable artificial 3D structures to deliver an efficient and cost‐effective steam‐generation solution. The limitations associated with conventional steam‐generation methods, such as high costs and the limited availability of suitable materials, are addressed by combining waste fabric with readily available artificial 3D structures. This investigation encompasses the design and fabrication of waste‐fabric‐based SSGs and evaluated performance, with an emphasis on viability, affordability, and scalability. Cotton fabric heat treated at 400 °C for 1 h exhibits a high light absorbance of 94.7%. In addition, an SSG fabricated using this cotton fabric delivers a high evaporation rate of 2.66 kg (m−2 h−1). These findings contribute to the advancement of sustainable and accessible applications in a variety of domains by leveraging the potential of affordable artificial 3D structures for use in SSG applications.
Keywords: desalination, solar steam generators, upcycling, waste fabrics
This study develops solar steam generators using waste fabric. Cotton fabric heat‐treated at 400 °C for 1 h exhibits 94.7% light absorbance and an evaporation rate of 2.66 kg (m−2 h−1). The method leverages artificial 3D structures to provide a cost‐effective and sustainable solution for steam generation.
1. Introduction
Water purification and desalination have become increasingly important owing to the growing global demand for clean and accessible water resources. Population growth, industrialization, and climate change have significantly stressed freshwater supply, leading to water scarcity in various regions.[ 1 , 2 ] In addition, the contamination of water sources with pollutants poses serious challenges in meeting the demand for safe, potable water; consequently, there has been a recent need for research and development into more advanced technologies that secure clean water resources, in response to the discovery of microplastics in purified drinking water, as an example.[ 3 , 4 , 5 , 6 ] Therefore, the development of efficient and sustainable water purification and desalination methods is an urgent objective.
One promising research area uses solar steam generators (SSGs) to purify and desalinate water.[ 7 ] SSGs harness sunlight to generate steam that is subsequently condensed and collected as purified water. This approach offers several advantages, including low energy consumption, environmental sustainability, and cost‐effectiveness. Furthermore, purifying water through evaporation and condensation results in significantly lower concentrations of impurities than observed for methods that rely on filters, and several studies have focused on developing efficient SSG technologies using different materials, designs, and configurations.
Many studies that fabricate SSGs using carbon[ 7 , 8 , 9 , 10 , 11 , 12 , 13 , 14 , 15 , 16 , 17 , 18 , 19 , 20 , 21 , 22 , 23 , 24 , 25 , 26 , 27 , 28 , 29 , 30 , 31 , 32 ] and metals[ 33 , 34 , 35 , 36 , 37 , 38 , 39 , 40 , 41 , 42 , 43 , 44 , 45 , 46 ] have been reported. However, the use of carbon or inorganic raw materials in SSGs is somewhat paradoxical, as they require significant amounts of energy to produce, which leads to the emission of environmental pollutants. In addition, the use of natural 3D‐structured materials has limitations in terms of raw‐material‐collection difficulties for large‐scale production. Furthermore, up‐scaling the size of the device is challenging in many cases, which reduces the feasibility of such a method.
Approximately 113 million tons of fiber are estimated to have been produced for clothing applications in 2021,[ 47 ] with a similar amount projected to be discarded as waste fabric. Numerous studies have been conducted into the reuse of such waste fabric; however, diversity in fiber type and the dyes used limits their potential applications.[ 48 ] Waste fabric is most commonly recycled for use in the construction industry as insulation or soundproofing materials.[ 49 , 50 , 51 ] However, the properties of these materials are not ideal due to simple textile blending and filling. Therefore, innovative methods for recycling waste fiber need to be developed. Moreover, waste fabric has an artificial 3D structure, making it highly suitable for SSG applications. In addition, waste fabric is relatively well segregated and disposed of; consequently, it is easily collected as a raw material for SSG use.
In this study, we evaluated the impact of fabric type and manufacturing conditions on the production of SSGs using waste fabric with the aim of determining the optimal conditions for solar steam generation. Furthermore, SSG production was demonstrated to be feasible even when using commonly discarded mixed‐waste fabrics, and the potential of manufacturing large SSGs is also discussed. We demonstrated a method for transforming waste fabric, as a valuable resource, that provides an economical and environmentally friendly solution for securing clean water.
2. Results and Discussion
Figure 1 shows the production shares and thermal/textural data for various types of fabric. Global fiber production by source in 2021 is shown in Figure 1a,[ 47 ] which reveals that most of the produced fibers were synthetic, followed by plant‐based fibers, with a small proportion of animal‐based fibers; the ratios of the various waste‐fabric fibers were assumed to be the same, with polyester, cotton, and wool, which represent synthetic, plant‐based, and animal‐based fibers, respectively, analyzed. The TGA traces in Figure 1b reveal that most fabrics underwent dramatic decomposition between 300 and 500 °C under nitrogen. Wool exhibited the highest yield of ≈20%, whereas cotton exhibited a value of 10%. On the other hand, little of the polyester remained after heating to 500 °C. These observations are consistent with the textures of the various fabrics (Figure 1c–e); wool and cotton maintained their shapes even after pyrolysis, whereas the woven polyester‐fiber shape was destroyed, leaving a film‐like residue on the surface of the crucible. Based on these findings, we conclude that wool and cotton are suitable raw materials for manufacturing porous carbons for use in SSG applications. However, cotton was selected as a representative waste fabric owing to the low production ratio of wool (Figure 1a).
Figure 1.
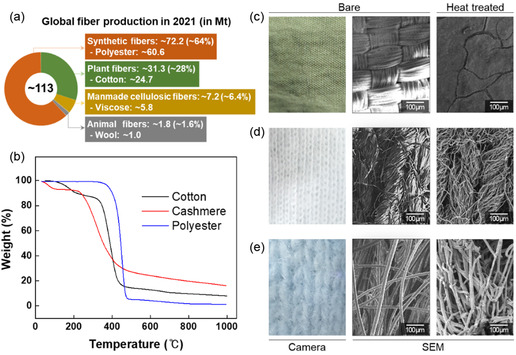
Fiber types and characteristics. a) Fiber types produced in 2021[ 47 ] and b) thermogravimetric traces for various fiber types. Textures of c) polyester, d) cotton, and e) wool before and after heat treatment.
An SSG was fabricated by subjecting waste cotton fabric to heat treatment to increase its solar‐light absorbance. Figure 2a illustrates the changes in color and morphology of the fabrics after heat treatment at various temperatures. The fabric color visibly transformed to brown after heat treatment at 300 °C and then changed to black at temperature of 400 °C and above. Morphological analysis revealed an increase in porosity between the fibers due to thermal decomposition. Notably, the fabric maintained its original textural, even after heat treatment at 1000 °C, which indicates that its form was preserved throughout the high‐temperature treatment process. Optical properties were quantitatively evaluated by acquiring UV‐Vis absorbance and reflectance spectra of samples heated at various temperatures, the results of which are shown in Figure 2b,c. The fabric absorbed only ≈10% of the visible light prior to heat treatment. While heat treatment at 300 °C led to a substantial increase in absorbance across a broad spectral range (250–1800 nm), the treated fabric absorbed less in the long‐wavelength range than the raw fabric. On the contrary, lower absorbance was observed in the range above 1800 nm after heat treatment at 300 °C, which is interpreted as the removal of O and H through heat treatment. Previous similar cellulose absorbance measurements reported light absorption in the long wavelength range. For instance, the band at ≈1923 nm is attributable to —OH and —C=O groups, the signal at around 2108 nm is ascribable to the combination of O—H and C—H stretching vibrations, the absorption peak at ≈2272 nm is assigned to O—H and C—O combination bands, and the peak at 2336 nm belongs to polysaccharide C—H stretching and deformation frequencies.[ 52 , 53 ] Such structures are presumed to decompose through heat treatment at 300 °C, resulting in the removal of H2O or CO2, leading to a decrease in absorbance. Significantly higher absorbance was observed following heat treatment at 400 °C, with an average absorbance of ≈94.7% across the strongly intense solar spectrum (≈300–2000 nm). Heat treatment at 600 °C led to slightly higher absorption compared to treatment at 400 °C; however, the difference was not significant. Further heat treatment at even higher temperatures afforded similar results (Figure 2b). The UV–Vis reflectance spectra in Figure 2c show opposite trends to those observed for absorbance. Based on these results, we conclude that waste cotton fabric heat treated at temperatures above 400 °C is a good candidate material for preparing highly efficient SSGs because it absorbs solar energy and converts it into heat.
Figure 2.
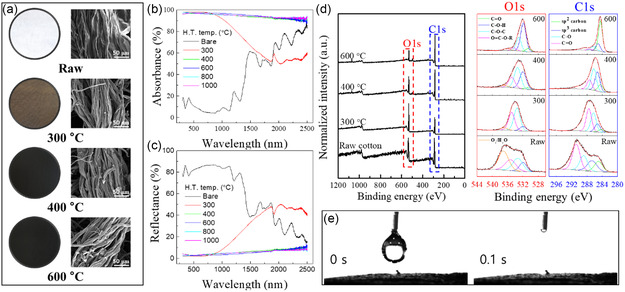
Cotton‐fabric characteristics as functions of heat‐treatment temperature: a) Optical and SEM images, b) absorbance spectra, c) reflectance spectra, d) XPS spectra, and e) water contact angles after heat treatment at 600 °C for 1 h.
The thermally induced chemical structures of the samples were evaluated using XPS. The XPS spectra of fabrics prepared under various heat‐treatment conditions show O1s and C1s peaks (Figure 2d). The intensity of the C1s peak relative to the O1s peak and the atomic fraction of sp 2‐bonded carbons (green traces in the enlarged C1s spectra) were observed to increase with increasing thermal treatment temperature. The C1s peaks in the XPS spectra clearly reveal a structural transformation leading to variously conjugated carbonized materials during pyrolysis, based on the change in fabric color (from white to black; Figure 2a) and the higher UV‐Vis absorbance after heat treatment at 400 °C or above (Figure 2b). On the other hand, the O1s peak was not completely absent, even after heat treatment at 600 °C. In addition, the sample was hydrophilic to the extent that it was impossible to measure its water contact angle, as shown in Figure 2e. The unexpected affinity of the pyrolyzed cotton for water is presumably due to hydroxyl groups (blue traces in the enlarged O1s spectra) dominating over other oxygen‐containing functional groups, including ethers, after pyrolysis. The essential characteristics of hydrophilicity and high absorbance required for use in SSG applications were achieved by precisely controlling the heat‐treatment temperature without the need for any additional processing. The optimum heat‐treatment temperature was determined to be 400 °C in this study. Additionally, compression strength tests on samples heat treated at 1000 °C, the least ductile among the samples, revealed an average value of 568 kPa, which is considered sufficient for practical handling and use.
We investigated the evaporation behavior of the sample prepared at the optimal heat treatment temperature (400 °C) using simulated solar light. Figure 3a,b shows schematic diagrams and photographic images of the two types of SSG examined in this study: a steam generator that directly contacts water (type I, Figure 3a) and one separated from water using polystyrene foam (type II, Figure 3b). Many studies have investigated enhancing evaporation efficiency by separating steam generated from the evaporating water with an insulating material.[ 7 , 8 , 22 , 54 ] The process used to manufacture SSGs from waste fabric and a PVA binder enabled them to be shaped into structures capable of supplying water, as shown in Figure 3b. Figure 3c shows how the temperatures of devices fabricated under dry, type I, and type II conditions vary when exposed to 1.0‐sun light from a solar simulator, as measured using an IR camera. The temperature rapidly increased without any heat loss under dry conditions, in which water is hardly supplied to the steam generator, owing to water evaporation, with a maximum temperature of over 100 °C reached after 200 s. The temperature of the type I system rose more slowly than that of the dry setup due to the evaporation and heat conduction of water, with a maximum temperature of 37.3 °C recorded after 200 s. The type II system exhibited a temperature rise that was slower than the dry setup but faster than the type 1 system as the heat conducted by water was insulated; in this case, a maximum temperature of over 50 °C was recorded after 200 s. Figure 3d shows the maximum temperature of each SSG as measured by the IR camera, which clearly shows that the dry conditions led to a rapid temperature increase due to the high photothermal conversion efficiency of the steam generator. In addition, the insulated type II system was found to concentrate heat in the SSG, resulting in a faster temperature rise compared to that of the type I system. Figure 3e shows evaporation‐rate data acquired by filling a beaker with distilled water, keeping the SSG afloat, and illuminating it with light from a solar simulator while measuring its weight. The blank corresponds to measurements performed without an SSG, which delivered an evaporation rate ≈0.52 kg (m−2 h−1). In contrast, the type I and type II systems delivered rates of 1.54 and 2.66 kg (m−2 h−1), respectively, which confirms that insulation leads to a higher evaporation rate. Moreover, as shown in Table 1 , our SSG demonstrates superior evaporation efficiency compared to previously reported SSGs in the literature. The consistent fiber diameter and regular spatial arrangement in the recycled textile structure offer an ideal balance between water retention and evaporation surface area, significantly enhancing mass transfer efficiency. This structural regularity minimizes flow resistance and creates optimal pathways for both water supply and vapor escape, contributing substantially to the exceptional evaporation performance observed in our type II system. Additionally, the hierarchical pore structure of the recycled textile‐based evaporator facilitates rapid water transport while maintaining sufficient residence time at the evaporation interface, resulting in clear performance advantages over conventional designs.
Figure 3.
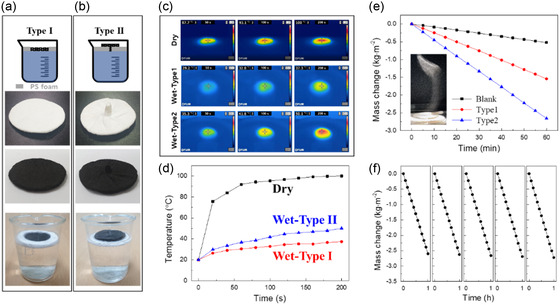
Schematic diagrams depicting evaporation using SSGs: a) direct contact and b) insulation using polystyrene foam. c) Images and d) graphs of temperature as functions of time for SSGs under simulated solar light as measured using an IR camera. e) Mass changes during evaporation testing and f) results of repeated experiments.
Table 1.
Comparison of the evaporation rates of previously reported SSGs in the literature.
| Reference# | Year | Authors | Materials | Solar power | Evaporation rate [kgm−2 h−1] |
|---|---|---|---|---|---|
| [11] | 2021 | Zhou et al. | Graphene | 1 sun | 2.67 |
| [12] | 2021 | Sun et al. | Carbon (corncob) | 1 sun | 4.16 |
| [13] | 2022 | Li et al. | Carbon black | 1 sun | 1.26 |
| [14] | 2022 | Li et al. | CNTs | 1 sun | 2.13 |
| [15] | 2022 | Xiong et al. | Carbon (bagasse) | 1 sun | 1.36 |
| [16] | 2022 | Saad et al. | Biochar | 1 sun | 1.49 |
| [17] | 2022 | Chen et al. | rGO | 1 sun | 1.65 |
| [18] | 2022 | Li et al. | rGO/SiC | 1 sun | 1.4 |
| [19] | 2022 | Sun et al. | Ammonium persulfate | 1 sun | 1.73 |
| [20] | 2022 | Yuan et al. | Carbon black | 1 sun | 1.33 |
| [21] | 2023 | Shi et al. | Carbon (cellulose) | 1 sun | 1.25 |
| [22] | 2023 | Xie et al. | Tannic acid complex | 1 sun | 1.79 |
| [23] | 2023 | Guo et al. | Carbon (fallen leaves) | 1 sun | 1.5 |
| [24] | 2023 | Li et al. | Graphene | 1 sun | 1.778 |
| [25] | 2023 | Hu et al. | MXene nanosheet | 1 sun | 4.31 |
| [26] | 2023 | Noureen et al. | rGO | 1 sun | 1.7 |
| [27] | 2024 | Luo et al. | Carbon (candle soot) | 1 sun | 1.67 |
| [28] | 2024 | Zheng et al. | Oxygen‐doped microporous carbon | 1 sun | 2.44 |
| [29] | 2024 | Zhou et al. | rGO | 1 sun | 1.68 |
| [30] | 2024 | Pan et al. | Carbon black | 1 sun | 1.56 |
| [31] | 2024 | Chen et al. | Carbon (potato lamella) | 1 sun | 1.36 |
| [32] | 2025 | Jing et al. | Asphalt | 1 sun | 1.59 |
| [38] | 2021 | Song et al. | Fe3O4 | 1 sun | 1.3 |
| [39] | 2021 | Shi et al. | Carbon (melamine), plasmonic silver nanoparticles | 1 sun | 1.25 |
| [40] | 2021 | He et al. | MOFs‐derived carbon | 1 sun | 2.07 |
| [41] | 2022 | Fan et al. | Polydopamine, silver nanoparticles | 1 sun | 1.70 |
| [42] | 2022 | Chen et al. | Aluminum | 1 sun | 1.24 |
| [43] | 2022 | Soo Joo et al. | Plasmonic silicon nanowires | 1 sun | 1.12 |
| [45] | 2023 | Yuan et al. | In2S3‐modified nanosheet | 1 sun | 1.56 |
| [46] | 2024 | Zuo et al. | Carbon (coal powder) | 1 sun | 3.6 |
| This work | Carbon (waste fabric) | 1 sun | 2.66 | ||
The SSG described above was fabricated using a specific cotton fabric product; therefore, we extended our study to include unsorted waste fabric. Figure 4 shows performance results for an SSG prepared using crushed fabrics containing various types of mixed fiber (shown in Figure 1a). The TGA thermogram displayed in Figure 4a is characteristic of a mixed material, with weight decreasing with increasing temperature. The raw material was gray in color owing to the presence of various colored fibers and turned black during heat treatment at 400 °C, as shown in the photographic image in Figure 4a. The UV‐Vis data in Figure 4b show the optical characteristics of the material following heat treatment at 400 °C. Although the absorption rate of the heat‐treated mixed fabric was slightly lower than that of the pyrolyzed cotton fabric, while its reflectance rate was slightly higher, it showed a high average absorption rate of 92.4% in the 300–2000 nm range, which corresponds to the solar spectrum. The higher reflectance is rationalized in terms of the textural structure of the pyrolyzed mixed fabric (Figure 4c). Synthetic fibers, such as polyester (as shown in Figure 1c), form dense structures when heated, and a similar structure is observed in Figure 4c (areas marked with red dotted lines). This dense, smooth surface reflects light, resulting in lower absorbance.[ 55 ] Although the light‐absorption rate may be slightly lower, the mixed‐fabric‐based device still exhibited a high evaporation rate of 2.21 kg (m−2 h−1), which is highly significant because it demonstrates the feasibility of textile waste as a sustainable material for securing clean water resources without the need for extensive sorting.
Figure 4.
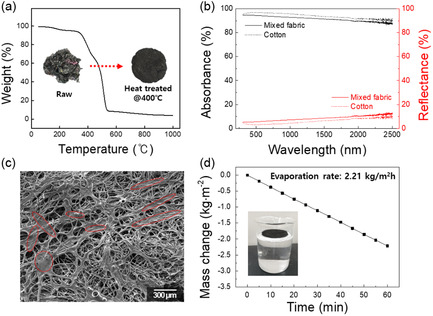
a) Mixed‐fiber TGA trace, b) optical properties, c) microstructure, and d) evaporation rate of the solar steam generator manufactured using mixed fibers.
Figure 5 summarizes the potential practical applications of the fabricated SSG for seawater and contaminated water treatment. Evaporation experiments were conducted using seawater over a period of 6 h. As shown in Figure 5a, no performance degradation due to salt crystal formation was observed, and the evaporation rate remained nearly identical to that in the distilled water. This suggests that the seawater was rapidly absorbed by the SSG, preventing the salt concentration from reaching the level required for crystal formation during the 6 h test period. As demonstrated in Figure 5b, the optical properties of the device remained unchanged throughout the experiment. The sample photographs in Figure 5b also show no significant surface changes during the 6 h in the wet state. Salt crystals were only observed when samples were removed from seawater and dried after the test. Figure 5c presents a large‐scale SSG manufactured in this study, with a photographic image of a 100 × 100 mm SSG prepared using cotton fabric, along with a schematic diagram of the seawater desalination device and corresponding test results. A significant difference in the amount of condensed water on the light‐transmissive film is clearly observed when the SSG was present compared to its absence. The ion concentrations of the seawater used in the experiment and the collected condensed water were measured by ICP‐OES, with results presented in Figure 5d. The ion concentrations were significantly lower in the condensed water than in the seawater; hence, the condensed water meets World Health Organization (WHO) drinking standards. In addition, methyl orange and methylene blue were added to distilled water as part of a mock sewage‐water purification experiment; UV‐Vis spectroscopy (Figure 5e) revealed that the SSG‐purified water did not contain any dye residues. The results presented herein confirm the significant potential of solar steam generation technology for purifying water contaminated with microplastics
Figure 5.
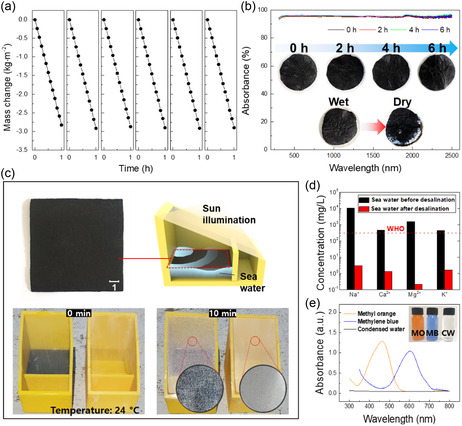
a) Evaporation time‐cycling test results using seawater over a period of 6 h. b) The absorbance spectra of samples and corresponding photographs during 6 h. c) Water purification with a large‐scale solar steam generator. d) Comparing salinity before and after seawater desalination. e) Evaluating water‐purification performance for dye‐contaminated water.
3. Conclusion
In this study, we manufactured a highly efficient SSG device using waste fabrics as a sustainable resource. We confirmed that waste cotton fabric exhibits high absorbance when subjected to heat treatment at temperatures above 400 °C. In addition, the obtained material retained its hydrophilicity, which is suitable for SSG applications. The fabric was molded using a polyvinyl alcohol (PVA) binder and heat‐treated to produce an SSG that delivered a high evaporation rate of 2.66 kg (m−2 h−1). We conducted an analogous experiment using actual disposed mixed‐waste fabrics, which delivered a high evaporation rate of 2.21 kg (m−2 h−1), confirming the universal applicability of this technology. We desalinated seawater and purified mock sewage water using a large‐scale device to determine its ability to produce clean water. This study demonstrated a technology that uses the microstructures of recycled waste textiles as eco‐friendly energy materials. This process is widely applicable as it does not require specialized equipment and uses relatively easily accessible raw materials.
4. Experimental Section
Polyester, cotton, wool, and mixed‐waste fabric materials were obtained from a market and used to manufacture SSGs. The binder solution was prepared by mixing polyvinyl alcohol (PVA) (MW:85 000–124 000 g mol−1, Merck, Germany) with distilled water in a weight ratio of 1:4, which was then used to stack and shape fabrics. The fabric‐to‐binder solution ratio was ≈1:1 (fabric‐to‐PVA weight ratio was 5:1) by weight to minimize the amount of binder while ensuring that the structure was not destroyed during pyrolysis. The shaped samples were then completely dried in an oven at 100 °C.
The dried samples were subjected to heat‐treatment conditions determined from onset temperatures and residual weights observed by thermogravimetric analysis (TGA, SDT 650, TA Instruments, USA). Heat treatment was conducted using a tube furnace in which samples were heated from 300 to 600 °C at 5 °C min−1 under nitrogen (99.999%, 50 mL min−1), and held at the target temperature for 1 h.
Optical microscopy (Axiolab 5, Karl Zeiss, Germany) and scanning electron microscopy (SEM, NOVA NANO SEM 450, FEI Company, USA) were used to microstructurally analyze the raw fabrics and manufactured SSGs. A UV‐visible‐NIR spectrometer (UV‐Vis‐NIR, SolidSpec‐3700, Shimadzu Co., Japan) equipped with an integrating sphere was used to analyze spectral properties in the 300–2500 nm range. X‐ray photoelectron spectroscopy (XPS, K‐Alpha, Thermo Fisher Scientific, USA) was used to determine the chemical states of the SSGs, with wettabilities determined by measuring contact angles using a contact‐angle measuring device (PHOENIX‐300 TOUCH, SEO, Korea). To evaluate the suitability of the fabricated SSG for practical applications, compression strength measurements were conducted on samples heat‐treated at 1000 °C with dimensions of 10 × 10 × 10 mm. The compression tests were performed using a Universal Testing Machine (UTM, SALT, Model‐1002, South Korea).
Temperature variations experienced by the SSGs under 1.0‐sun conditions were measured using an infrared camera (FLIR E5‐XT, Teledyne FLIR LLC, USA). The photothermal conversion effect and evaporation rate of each SSG were measured using a solar simulator (ABET‐10 500, Abet Technologies, USA) set to a fixed light intensity of 100 mW cm−2 measured and calibrated using an optical power meter (PM400, Thorlabs, USA). A calibrated light beam was directed onto the evaporator. In addition, the evaporation rate was measured using distilled water over a period of 1 h. Experiments were repeated five times to ensure reliability.
Finally, a large‐scale SSG was manufactured and its ability to desalinate seawater and purify contaminated water was examined. A large‐scale device was fabricated and its ability to evaporate water under sunlight was tested. The ion concentrations in seawater before and after desalination were analyzed using inductively coupled plasma optical emission spectrometry (ICP‐OES, iCAP 6000 SERIES, Thermo Fisher Scientific Inc., USA).
Conflict of Interest
The authors declare no conflict of interest.
Acknowledgements
All authors contributed equally to this work. This work was supported by the National Research Council of Science & Technology (NST) grant from the Korean Government (MSIT) (grant no. CRC23012‐000) and the Materials and Components Development Program (RS‐2024‐00431920) funded by the Ministry of Trade, Industry & Energy, Korea. This work was also supported by a grant from the National R&D Program through the National Research Foundation of Korea (NRF) funded by the Ministry of Science and ICT (2021M3H4A1A03041296), Republic of Korea.
Contributor Information
Yeong Jae Kim, Email: kimyj@kicet.re.kr.
Sungho Lee, Email: sunghol@kist.re.kr.
Data Availability Statement
The data that support the findings of this study are available from the corresponding author upon reasonable request.
References
- 1. Boretti A., Rosa L., npj Clean Water 2019, 2, 15. [Google Scholar]
- 2. du Plessis A. in Current and Future Water Scarcity and Stress, Vol. (Ed. A. du Plessis), Springer International Publishing, Cham, 2019, pp.13‐25. [Google Scholar]
- 3. Bäuerlein P. S., Hofman‐Caris R. C. H. M., Pieke E. N., ter Laak T. L., Water Res. 2022, 221, 118790. [DOI] [PubMed] [Google Scholar]
- 4. Semmouri I., Vercauteren M., Van Acker E., Pequeur E., Asselman J., Janssen C., Int. J. Food Contam. 2022, 9, 6. [Google Scholar]
- 5. Li H., Zhu L., Ma M., Wu H., An L., Yang Z., Sci. Total Environ. 2023, 867, 161553. [DOI] [PubMed] [Google Scholar]
- 6. Qian N., Gao X., Lang X., Deng H., Bratu T. M., Chen Q., Stapleton P., Yan B., Min W., Proc. Natl. Acad. Sci. 2024, 121, e2300582121. [DOI] [PMC free article] [PubMed] [Google Scholar]
- 7. Ghasemi H., Ni G., Marconnet A. M., Loomis J., Yerci S., Miljkovic N., Chen G., Nat. Commun. 2014, 5, 4449. [DOI] [PubMed] [Google Scholar]
- 8. Xu N., Hu X., Xu W., Li X., Zhou L., Zhu S., Zhu J., Adv. Mater. 2017, 29, 1606762. [DOI] [PubMed] [Google Scholar]
- 9. Higgins M. W., Rahmaan A. R. S., Devarapalli R. R., Shelke M. V., Jha N., Sol. Energy 2018, 159, 800. [Google Scholar]
- 10. Guo X., Gao H., Wang S., Yin L., Dai Y., Desalination 2020, 488, 114535. [Google Scholar]
- 11. Zhou S., Huang S., Ming Y., Long Y., Liang H., Ruan S., Zeng Y.‐J., Cui H., J. Mater. Chem. A. 2021, 9, 9909. [Google Scholar]
- 12. Sun Y., Zhao Z., Zhao G., Wang L., Jia D., Yang Y., Liu X., Wang X., Qiu J., Carbon 2021, 179, 337. [Google Scholar]
- 13. Li J., Cui Y., Xiu H., Wang W., Du M., Yang X., Xu Q., Kozliak E., Ji Y., Cellulose 2022, 29, 2461. [Google Scholar]
- 14. Li Q., Zhang S., Wei N., Xu R., Li X., Gong L., Cui H., Sol. Energy Mater. Sol. Cells 2022, 243, 111815. [Google Scholar]
- 15. Xiong J., Zhang Z., Liu Y., Yi J., Wang Y., Li B., Wang W., Peng S., Min X., Gui Y., Li M., Peng J., Cellulose 2022, 29, 927. [Google Scholar]
- 16. Saad A. G., Gebreil A., Kospa D. A., El‐Hakam S. A., Ibrahim A. A., Desalination 2022, 535, 115824. [Google Scholar]
- 17. Chen Y., Qiu H., Li X., Tong Q., Jensen M., Li Q., Wang N., Appl. Surf. Sci. 2022, 582, 152483. [Google Scholar]
- 18. Li Y., Zan R., Wang Y., Shang L., Wu R., Liu Y., Rao Z., Yao K., Liu Y., Fei L., Appl. Surf. Sci. 2022, 599, 154021. [Google Scholar]
- 19. Sun S., Shi C., Kuang Y., Li M., Li S., Chan H., Zhang S., Chen G., Nilghaz A., Cao R., Tian J., Water Res. 2022, 226, 119279. [DOI] [PubMed] [Google Scholar]
- 20. Yuan J., Lei X., Yi C., Jiang H., Liu F., Cheng G. J., Chem. Eng. J. 2022, 430, 132765. [Google Scholar]
- 21. Shi C., Luo W., Zhang Y., Liu H., Yang M., Song Y., Zhao J., Ling Z., Cellulose 2023, 30, 7193. [Google Scholar]
- 22. Xie M., Zhang P., Cao Y., Yan Y., Wang Z., Jin C., npj Clean Water 2023, 6, 12. [Google Scholar]
- 23. Guo H.‐X., Li T.‐J., Ai S., He C.‐Y., Liu B.‐H., Lu Z.‐W., Wang W.‐M., Liu M.‐M., Wang X.‐T., Liu G., Gao X.‐H., Appl. Surf. Sci. 2023, 619, 156728. [Google Scholar]
- 24. Li Z., Cai W., Song L., Gui Z., Hu Y., Wang X., Appl. Surf. Sci. 2023, 609, 155286. [Google Scholar]
- 25. Hu C., Li W., Zhao H.‐Y., Li C., Ma Z.‐Y., Hao L., Pang Y., Yu Z.‐Z., Li X., Chem. Eng. J. 2023, 460, 141622. [Google Scholar]
- 26. Noureen L., Zaman S., Shah W. Ali, Wang Q., Humayun M., Xu Q., Wang X., Chem. Eng. J. 2023, 473, 145122. [Google Scholar]
- 27. Luo W., Zhang J., Liu M., Yi A., Jiao R., Zhu Z., Li J., Sun H., Li A., Chem. Eng. J. 2024, 483, 149211. [Google Scholar]
- 28. Zheng Y., Huang R., Yu Y., Wei X., Yin J., Zhang S., Water Res. 2024, 257, 121707. [DOI] [PubMed] [Google Scholar]
- 29. Zhou J., Cao X., Jing Y., Zhang J., Sun H., Li J., Jiao R., Li A., Chem. Eng. J. 2024, 488, 150892. [Google Scholar]
- 30. Pan J., Zhang X., Zhang C., Hu W., Bi S., Shao H., Chen N., Yu R., Jiang J., Shao G., Chem. Eng. J. 2024, 492, 152305. [Google Scholar]
- 31. Chen Y., Cheng L., Liu Q., Chen M., Li C., Wang L., Shen J., Senin P., Yan S., Bian T., Appl. Surf. Sci. 2024, 656, 159667. [Google Scholar]
- 32. Jing Y., Long Y., Si Y., Li J., Sun H., Jiao R., Zhu Z., Liang W., Li A., Chem. Eng. J. 2025, 506, 160358. [Google Scholar]
- 33. Wang H., Miao L., Tanemura S., Sol. RRL 2017, 1, 1600023. [Google Scholar]
- 34. Liang J., Liu H., Yu J., Zhou L., Zhu J., Nanophotonics 2019, 8, 771. [Google Scholar]
- 35. Wang Q., Jia F., Huang A., Qin Y., Song S., Li Y., Arroyo M. A. C., Desalination 2020, 481, 114359. [Google Scholar]
- 36. Ghafurian M. M., Niazmand H., Goharshadi E. K., Zahmatkesh B. B., Moallemi A. E., Mehrkhah R., Mahian O., Desalination 2020, 493, 114657. [Google Scholar]
- 37. Zhang L., Mu L., Zhou Q., Hu X., Water Res. 2020, 170, 115367. [DOI] [PubMed] [Google Scholar]
- 38. Song L., Zhang X.‐F., Wang Z., Zheng T., Yao J., Desalination 2021, 507, 115024. [Google Scholar]
- 39. Shi Y., Zhang C., Wang Y., Cui Y., Wang Q., Liu G., Gao S., Yuan Y., Desalination 2021, 507, 115038. [Google Scholar]
- 40. He P., Hao L., Liu N., Bai H., Niu R., Gong J., Chem. Eng. J. 2021, 423, 130268. [Google Scholar]
- 41. Fan X., Mu H., Xu Y., Song C., Liu Y., Int. J. Energy Res. 2022, 46, 8949. [Google Scholar]
- 42. Chen Z., Lin Y., Qian Q., Su P., Ding Y., Tuan P. D., Chen L., Feng D., Desalination 2022, 528, 115561. [Google Scholar]
- 43. Joo B. S., Kim I. S., Han I. K., Ko H., Kang J. G., Kang G., Appl. Surf. Sci. 2022, 583, 152563. [Google Scholar]
- 44. Duan X., Zhang S., Liu Q., Yu Z., Cui Y., Tang B., Zhang Q., Wang J., Cellulose 2023, 30, 2279. [Google Scholar]
- 45. Yuan B., Sui Y., Dong J., Lv X., Guo M., Xiao Y., Yang L., Yang H., Bai L., Wang W., Wei D., Liang Y., Chen H., Appl. Surf. Sci. 2023, 611, 155678. [Google Scholar]
- 46. Zuo Z., Zhu F., Wang L., Wang Z., Zhao J., Ji Z., An M., Ye Y. N., Yu W., Wang Z., Wang Y., Zheng Q., Chem. Eng. J. 2024, 481, 148524. [Google Scholar]
- 47. in Textile Exchange. Preferred Fiber & Materials, Market Report., Vol. (Ed.^Eds.: Editor), City 2022. https://textileexchange.org/knowledge‐center/reports/materials‐market‐report‐2022/
- 48. Dissanayake D. G. K., Weerasinghe D. U., Mater. Circ. Econ. 2021, 3, 24. [Google Scholar]
- 49. Tilioua A., Libessart L., Lassue S., Appl. Therm. Eng. 2018, 142, 56. [Google Scholar]
- 50. Islam S., Bhat G., J. Environ. Manage. 2019, 251, 109536. [DOI] [PubMed] [Google Scholar]
- 51. Sakthivel S., Kumar S. S., Mekonnen S., Solomon E., J. Eng. Fibers Fabr. 2020, 15, 1558925020968819. [Google Scholar]
- 52. Cséfalvayová L., Pelikan M., Cigić I. K., Kolar J., Strlič M., Talanta 2010, 82, 1784. [DOI] [PubMed] [Google Scholar]
- 53. Li X., Sun C., Zhou B., He Y., Sci. Rep. 2015, 5, 17210. [DOI] [PMC free article] [PubMed] [Google Scholar]
- 54. Xue T., Zhu C., Feng X., Wali Q., Fan W., Liu T., Adv. Fiber Mater. 2022, 4, 1118. [Google Scholar]
- 55. Kim S.‐K., Ee H.‐S., Choi W., Kwon S.‐H., Kang J.‐H., Kim Y.‐H., Kwon H., Park H.‐G., Appl. Phys. Lett. 2011, 98, 011109. [Google Scholar]
Associated Data
This section collects any data citations, data availability statements, or supplementary materials included in this article.
Data Availability Statement
The data that support the findings of this study are available from the corresponding author upon reasonable request.