

Abstract
Background
As the most prevalent female malignancy worldwide, breast cancer frequently involves axillary lymph node metastasis (ALNM), which critically affects therapeutic algorithms. Current guidelines mandate preoperative ultrasound-guided axillary biopsy for suspicious lymph nodes, potentially exposing some low-risk patients with negative results to invasive risks. To optimize the utilization of biopsy, this study established a multimodal predictive framework that preoperatively assesses axillary lymph node (ALN) status, thereby triaging candidates for ultrasound-guided axillary biopsy.
Methods
We conducted a retrospective single-center analysis of 703 breast cancer patients who underwent ultrasound-guided axillary biopsy with subsequent definitive surgery at the First Affiliated Hospital of Xi’an Jiaotong University (07/2020–05/2023). Following rigorous application of the inclusion/exclusion criteria, 439 eligible patients were randomized into training (n = 307, 69.9%) and validation (n = 132, 30.1%) cohorts. Axillary surgical pathology served as the reference standard for categorizing lymph node status. Multivariable predictors identified through the least absolute shrinkage and selection operator (LASSO) and logistic regression informed the construction of a clinically deployable nomogram. Model discrimination was quantified via receiver operating characteristic (ROC) analysis with area under the curve (AUC) calculations. The optimal threshold was determined using the maximum Youden index.
Results
LASSO, univariate, and multivariate logistic regression analyses revealed that estrogen receptor (ER) status (P = 0.007), ALN cortical–medullary boundary (P = 0.012), ALN cortical thickness (P < 0.001), short-axis diameter (P = 0.032), and the BI-RADS category on magnetic resonance imaging (MRI) (P = 0.021) were independent predictors of non-ALNM. A nomogram was constructed based on these factors. The multimodal model demonstrated excellent discrimination with AUCs of 0.955 (95% CI 0.926–0.983) and 0.905 (95% CI 0.832–0.978) for the training and validation cohorts, respectively. The model achieved a maximum Youden index of 0.7789 with an optimal threshold of 0.3958.
Conclusion
Our multimodal predictive model integrates clinicopathological profiles with imaging biomarkers (ultrasound and magnetic resonance imaging). This model holds promise for preoperative axillary risk stratification in breast cancer patients, thereby identifying candidates suitable for axillary biopsy exemption, while its application serves as a reference for personalized and refined axillary management.
Supplementary Information
The online version contains supplementary material available at 10.1186/s40001-025-02950-4.
Keywords: Multimodal model, Ultrasound-guided biopsy, Axillary lymph node status, Noninvasive
Introduction
Breast cancer is the most prevalent malignancy and leading cause of cancer-related mortality among women globally, with increasing incidence rates underscoring its public health burden [1, 2]. According to 2022 global cancer statistics, breast cancer accounts for 23.8% of all new cancer cases and 15.4% of cancer-related deaths among females, making it the most frequently diagnosed malignancy and leading cause of cancer mortality in this population [3]. According to recent statistics from the American Cancer Society, the incidence of breast cancer in women is 32%, which ranks first among female malignant tumors and is the primary cause of cancer death in women under 50 years of age [4]. Axillary lymph node metastasis (ALNM) represents a pivotal determinant of disease progression, serving not only as a prognostic indicator, but also as a gateway for systemic dissemination. Metastasis represents the primary cause of mortality risk in breast cancer patients, and initial metastasis of these tumors most frequently occurs in regional lymph nodes [5]. Axillary lymph nodes (ALN) metastatic burden exhibits an inverse correlation with survival outcomes, directly informing therapeutic algorithms and surgical planning [6]. but its diagnosis remains a clinical challenge [7].
American Society of Clinical Oncology guidelines endorse ultrasound-guided axillary biopsy as the cornerstone for preoperative ALN staging in clinically suspicious cases. Nevertheless, an initial study demonstrated that approximately 36% of patients undergoing preoperative needle biopsy with subsequent axillary surgery exhibited lymph nodes negative for malignancy on postoperative histopathology [8]. Corroborating this finding, Britton et al. reported that 51 of 121 patients (42.15%) with preoperative ultrasound-guided biopsies showed no evidence of malignant involvement during axillary surgical procedures [9]. Furthermore, a comparative study assessing diagnostic accuracy across biopsy modalities documented that an average of 56% of patients ultimately had negative pathological findings postoperatively [10]. Although ultrasound-guided core needle biopsy (US-CNB) demonstrates superior sensitivity over fine-needle aspiration (US-FNA) (88 vs. 74%) [10], its adoption is tempered by elevated complication rates, including hematoma, neural injury, and iatrogenic pneumothorax. Paradoxically, the National Comprehensive Cancer Network still mandates subsequent sentinel lymph node biopsy (SLNB) for patients whose ALNs were negative on ultrasound-guided biopsy, perpetuating diagnostic redundancy and delaying treatment initiation. These limitations underscore the necessity of employing non-invasive preoperative stratification tools to optimize the application of axillary ultrasound-guided biopsy.
Current non-invasive modalities for preoperative ALN assessment predominantly rely on imaging techniques, including mammography (MMG), ultrasound (US), and magnetic resonance imaging (MRI) [11–13]. MMG has inherent anatomical limitations, capturing only the anteroinferior axillary quadrant while demonstrating compromised diagnostic performance in lesion detection and malignancy differentiation, a deficiency exacerbated in dense breast parenchyma [14]. Axillary US has become the cornerstone of preoperative evaluation for newly diagnosed breast cancer patients, owing to its cost-efficiency, technical accessibility, and rapid integration into clinical workflows [15]. Despite its high specificity, its suboptimal sensitivity (56–72% in primary treatment candidates) restricts its standalone diagnostic utility [16]. Conversely, MRI offers operator-independent objectivity with superior soft-tissue resolution, yet its current applications remain disproportionately focused on neoadjuvant therapy (NAT) monitoring rather than initial staging [17].
Emerging multimodal paradigms that synergize clinical parameters, histopathological biomarkers, and radiomic signatures demonstrate transformative potential through complementary sensitivity augmentation, non-invasive risk stratification, and dynamic therapeutic monitoring. Prior investigations have pioneered predictive frameworks that combine clinicopathological variables with unimodal imaging (US or MRI) data. The study by Zhang et al. incorporated multiple MRI parameters, including dynamic contrast-enhanced magnetic resonance imaging (DCE-MRI) images with features such as time-intensity curve (TIC). The constructed multiparametric MRI model for predicting lymph node metastasis in invasive breast cancer achieved an area under the curve (AUC) of 0.913 (95% CI 0.799–0.974), reflecting the predictive potential of MRI parameters [18]. Yu et al. incorporated clinicopathological data including hormone receptor (HR), human epidermal growth factor receptor-2 (HER2), and Ki67 status, combined with radiomics and deep learning, to develop a model for evaluating ALN status after NAT. The model achieved an exceptional AUC of 0.986 (95% CI 0.954–1.000). Although this model did not focus on the initial assessment of ALN status, the strong predictive performance of its incorporated features may serve as a reference for future model development [19]. Yang et al. developed a multivariable model combining US and clinicopathological features to prevent unnecessary axillary lymph node dissection (ALND). The incorporated factors included tumor margins, shape, lymph node long-to-short axis ratio, cortical thickness, and hilum status. The model achieved an AUC of 0.749 (95% CI 0.676–0.823) [20]. Nevertheless, extant models primarily focus on predicting the necessity of SLNB or ALND, or evaluating responses to NAT, leaving a critical unmet need: no preoperative non-invasive multimodal tool currently exists to stratify the risk of ultrasound-guided axillary biopsy or guide its selective application [21].
This study pioneers a multimodality prediction framework that integrates preoperative clinicopathological variables with advanced imaging biomarkers. We developed a nomogram to identify low-risk breast cancer patients unlikely to benefit from preoperative axillary needle biopsy. Through the consolidation of preoperative data, this approach has the potential to enable risk-stratified management for patients requiring axillary biopsy, minimize invasive procedural morbidity, and reduce unnecessary health care expenditures, ultimately contributing to the development of precision-based axillary management protocols.
Materials and methods
This study design followed international regulations according to the Declaration of Helsinki. Our research was approved by the Ethical Committee of the First Affiliated Hospital of Xi’an Jiaotong University (XJTU1AF2024LSYY-503). The ethics committee granted a waiver of informed consent, as this was a retrospective analysis of existing clinical records, and all the data were anonymized prior to analysis. All procedures were performed in accordance with ethical standards, and no additional interventions were applied to the participants. The data were deidentified to ensure confidentiality.
Patient enrollment
Patients who underwent preoperative ultrasound-guided axillary biopsy and breast surgery at the First Affiliated Hospital of Xi’an Jiaotong University between July 2020 and May 2023 were deemed eligible for this study (n = 703). Patients were included if they: [1] had histologically confirmed primary invasive breast cancer; [2] had surgical treatment at the study center during the enrollment period; [3] clinical lymph nodes positive (cN +) verified by physical examination; [4] underwent preoperative ultrasound-guided axillary biopsy; or [5] had no prior neoadjuvant therapy. The exclusion criteria were as follows: [1] bilateral breast cancer (n = 11); [2] male breast cancer (n = 4); [3] occult breast cancer (n = 6); [4] distant metastases (M1) at diagnosis (n = 13); [5] incomplete baseline imaging (US and MRI) or clinicopathological records before ultrasound-guided axillary biopsy (n = 216); and [6] postoperative ALN pathology was unavailable for patients whose nodes were negative on ultrasound-guided biopsy (UpN0) (n = 14). A total of 439 patients were included in this study (Fig. 1).
Fig. 1.
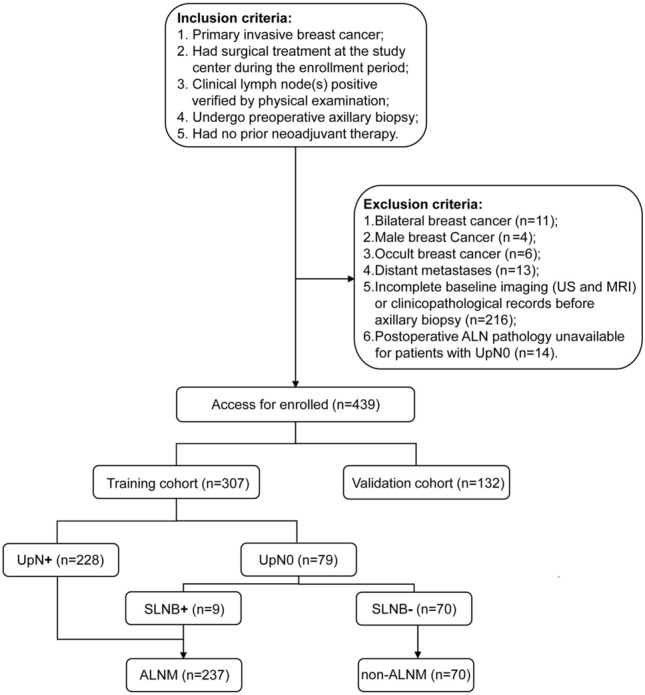
Flowchart of patient inclusion and exclusion criteria in the study. US: ultrasound; MRI: magnetic resonance imaging; ALN: axillary lymph node; UpN0: ALNs were negative on ultrasound-guided biopsy; UpN + : ALNs were positive on ultrasound-guided biopsy; SLNB+: pathology of sentinel lymph node biopsy was positive; SLNB–: pathology of sentinel lymph node biopsy was negative; ALNM: axillary lymph node metastasis; non-ALNM: without axillary lymph node metastasis
MRI and US sources and collection
Patient medical data were obtained from medical records, and all MRI and US images of the mass and lymph nodes were digitally stored and retrospectively reviewed. Only preoperative MRI and US studies performed prior to any treatment were included in the analysis. All radiological examinations and interpretations adhered to the American College of Radiology Appropriateness Criteria (2023) and European Society of Breast Imaging Guidelines (2021), ensuring diagnostic consistency.
MRI was performed via a 3.0 T MRI scanner (GE Signa HDxt 3.0TMR, GE Healthcare, USA) with a dedicated eight-channel breast coil. After anatomical localization, axial Diffusion-Weighted Imaging (DWI) was obtained with b = 0, 200, and 1500 s/mm2. Three acquisitions were performed, and the signals were averaged to improve the signal-to-noise ratio. DWI images were measured with a diffusion gradient in the z-axis. The DCE-MRI characteristics are summarized in Table 1.
Table 1.
Clinicopathologic and radiological characteristics of patients in the entire, training, and validation cohorts
| Characteristic | Overall N = 439 N (%) | Training set N = 307 N (%) | Validation set N = 132 N (%) | P |
|---|---|---|---|---|
| Age | 50 ± 11 | 50 ± 11 | 50 ± 11 | 0.8902 |
| Education | 0.0743 | |||
| Primary school and below | 79 (18.0%) | 51 (16.6%) | 28 (21.2%) | |
| Middle school | 226 (51.5%) | 169 (55.0%) | 57 (43.2%) | |
| College degree and above | 134 (30.5%) | 87 (28.3%) | 47 (35.6%) | |
| Marital status | 0.9064 | |||
| Married | 428 (97.5%) | 298 (97.1%) | 130 (98.5%) | |
| Spinsterhood | 6 (1.4%) | 5 (1.6%) | 1 (0.8%) | |
| Divorced | 4 (0.9%) | 3 (1.0%) | 1 (0.8%) | |
| Widowed | 1 (0.2%) | 1 (0.3%) | 0 (0.0%) | |
| Height (cm) | 160.0 ± 6.9 | 160.2 ± 7.6 | 159.7 ± 4.9 | 0.3662 |
| Weight (kg) | 61 ± 9 | 62 ± 9 | 60 ± 10 | 0.0772 |
| BMI (kg/m2)6 | 23.44 (21.48, 25.71) | 23.71 (21.48, 25.83) | 22.89 (21.28, 24.97) | 0.1085 |
| First menstruation | 15.00 (14.00, 16.00) | 15.00 (14.00, 16.00) | 15.00 (14.00, 16.00) | 0.5935 |
| Menopausal status7 | 0.2363 | |||
| Yes | 185 (42.1%) | 135 (44.0%) | 50 (37.9%) | |
| No | 254 (57.9%) | 172 (56.0%) | 82 (62.1%) | |
| Reproductive history | > 0.9994 | |||
| Yes | 428 (97.5%) | 299 (97.4%) | 129 (97.7%) | |
| No | 11 (2.5%) | 8 (2.6%) | 3 (2.3%) | |
| Family history of breast cancer | > 0.9994 | |||
| Yes | 11 (2.5%) | 8 (2.6%) | 3 (2.3%) | |
| No | 428 (97.5%) | 299 (97.4%) | 129 (97.7%) | |
| CEA (ng/mL) | 1.97 (1.22, 2.99) | 2.06 (1.30, 3.13) | 1.69 (1.06, 2.74) | 0.0375 |
| CA125 (U/mL) | 13 (10, 20) | 14 (10, 20) | 13 (9, 19) | 0.1915 |
| CA153 (U/mL) | 13 (8, 18) | 13 (8, 18) | 13 (8, 18) | 0.8755 |
| Lymphocyte count (109/L) | 1.58 (1.22, 1.97) | 1.60 (1.27, 2.01) | 1.55 (1.14, 1.88) | 0.0655 |
| Monocyte count (109/L) | 0.32 (0.26, 0.42) | 0.33 (0.26, 0.42) | 0.32 (0.27, 0.42) | 0.6435 |
| Neutrophil count (109/L) | 3.82 (2.92, 4.95) | 3.96 (2.96, 5.05) | 3.57 (2.80, 4.67) | 0.0835 |
| Lymphocyte percentage | 27 (21, 33) | 27 (21, 33) | 27 (21, 34) | 0.7325 |
| Monocyte percentage | 5.50 (4.40, 6.80) | 5.50 (4.40, 6.80) | 5.55 (4.40, 7.00) | 0.5335 |
| Neutrophil percentage | 64 ± 11 | 64 ± 11 | 64 ± 13 | 0.7902 |
| Platelet count (109/L) | 247 ± 72 | 249 ± 73 | 242 ± 68 | 0.3142 |
| PLR | 155 (120, 198) | 154 (122, 194) | 159 (119, 204) | 0.2735 |
| NLR | 2.34 (1.76, 3.44) | 2.35 (1.75, 3.45) | 2.34 (1.79, 3.37) | 0.6885 |
| Clinical T stage8 | 0.6943 | |||
| T4 | 20 (4.6%) | 16 (5.2%) | 4 (3.0%) | |
| T3 | 35 (8.0%) | 25 (8.1%) | 10 (7.6%) | |
| T2 | 242 (55.1%) | 165 (53.7%) | 77 (58.3%) | |
| T1 | 142 (32.3%) | 101 (32.9%) | 41 (31.1%) | |
| Pathological type9 | 0.1693 | |||
| Non-specific invasive type | 355 (80.9%) | 251 (81.8%) | 104 (78.8%) | |
| Specific invasive type | 18 (4.1%) | 15 (4.9%) | 3 (2.3%) | |
| Unclassified | 66 (15.0%) | 41 (13.4%) | 25 (18.9%) | |
| Histological grade10 | 0.6694 | |||
| III | 68 (15.5%) | 50 (16.3%) | 18 (13.6%) | |
| II | 365 (83.1%) | 252 (82.1%) | 113 (85.6%) | |
| I | 6 (1.4%) | 5 (1.6%) | 1 (0.8%) | |
| ER status11 | 0.8203 | |||
| Positive | 316 (72.0%) | 220 (71.7%) | 96 (72.7%) | |
| Negative | 123 (28.0%) | 87 (28.3%) | 36 (27.3%) | |
| ER-positive percentage11 | 70 (0, 90) | 70 (0, 82) | 70 (0, 90) | 0.3835 |
| PR status11 | 0.9363 | |||
| Positive | 264 (60.1%) | 185 (60.3%) | 79 (59.8%) | |
| Negative | 175 (39.9%) | 122 (39.7%) | 53 (40.2%) | |
| PR-positive percentage11 | 10 (0, 50) | 10 (0, 49) | 20 (0, 60) | 0.2955 |
| HER2 expression11 | 0.9173 | |||
| High expression | 124 (28.2%) | 85 (27.7%) | 39 (29.5%) | |
| Low expression | 215 (49.0%) | 152 (49.5%) | 63 (47.7%) | |
| Negative | 100 (22.8%) | 70 (22.8%) | 30 (22.7%) | |
| Ki6711 | 40 (30, 60) | 40 (30, 60) | 40 (30, 60) | 0.3895 |
| Tumor location | 0.1073 | |||
| Left | 217 (49.4%) | 144 (46.9%) | 73 (55.3%) | |
| Right | 222 (50.6%) | 163 (53.1%) | 59 (44.7%) | |
| Tumor morphology | 0.3604 | |||
| Irregular shape | 426 (97.0%) | 296 (96.4%) | 130 (98.5%) | |
| Regular shape | 13 (3.0%) | 11 (3.6%) | 2 (1.5%) | |
| Tumor boundary | 0.2633 | |||
| Unclear | 348 (79.3%) | 239 (77.9%) | 109 (82.6%) | |
| Clear | 91 (20.7%) | 68 (22.1%) | 23 (17.4%) | |
| BI-RADS (US) | 0.1163 | |||
| 5 | 267 (60.8%) | 181 (59.0%) | 86 (65.2%) | |
| 4c | 92 (21.0%) | 64 (20.8%) | 28 (21.2%) | |
| 4b | 47 (10.7%) | 40 (13.0%) | 7 (5.3%) | |
| 4a | 33 (7.5%) | 22 (7.2%) | 11 (8.3%) | |
| Tumor long-axis diameter (mm) | 25 (18, 33) | 26 (18, 34) | 25 (19, 32) | 0.8505 |
| Tumor short-axis diameter (mm) | 15 (11, 20) | 15 (11, 20) | 16 (11, 19) | 0.7875 |
| Tumor long-to-short | 1.57 (1.35, 1.94) | 1.57 (1.35, 1.95) | 1.57 (1.35, 1.93) | 0.7375 |
| axis diameter ratio | ||||
| ALN cortical–medullary boundary | 0.1423 | |||
| Unclear | 263 (59.9%) | 177 (57.7%) | 86 (65.2%) | |
| Clear | 176 (40.1%) | 130 (42.3%) | 46 (34.8%) | |
| ALN cortical thickness | 0.0643 | |||
| Thickening | 371 (84.5%) | 253 (82.4%) | 118 (89.4%) | |
| Normal | 68 (15.5%) | 54 (17.6%) | 14 (10.6%) | |
| ALN long-axis diameter (mm) | 16 (12, 21) | 16 (13, 21) | 17 (12, 21) | 0.7715 |
| ALN short-axis diameter (mm) | 8.0 (6.0, 11.0) | 8.0 (6.0, 11.0) | 8.0 (6.0, 11.0) | 0.3645 |
| ALN long-to-short axis diameter ratio | 2.00 (1.62, 2.33) | 2.00 (1.64, 2.38) | 1.96 (1.60, 2.27) | 0.4325 |
| BI-RADS (MRI) | 0.0173 | |||
| V | 415 (94.5%) | 285 (92.8%) | 130 (98.5%) | |
| III/IV | 24 (5.5%) | 22 (7.2%) | 2 (1.5%) | |
| Tumor TIC type12 | 0.6843 | |||
| III | 25 (5.7%) | 19 (6.2%) | 6 (4.5%) | |
| II | 394 (89.7%) | 273 (88.9%) | 121 (91.7%) | |
| I | 20 (4.6%) | 15 (4.9%) | 5 (3.8%) | |
| Tumor mean ADC value (10−3) | 0.99 (0.90, 1.11) | 0.99 (0.89, 1.11) | 0.99 (0.91, 1.10) | 0.93555 |
| Tumor maximum inflow slope of TIC13 | 4.70 (3.49, 5.67) | 4.70 (3.49, 5.67) | 4.68 (3.44, 5.67) | 0.70853 |
| ALN TIC type12 | 0.5633 | |||
| III | 19 (4.3%) | 15 (4.9%) | 4 (3.0%) | |
| II | 307 (69.9%) | 209 (68.1%) | 98 (74.2%) | |
| I | 53 (12.1%) | 38 (12.4%) | 15 (11.4%) | |
| 0 | 60 (13.7%) | 45 (14.7%) | 15 (11.4%) | |
| ALN mean ADC value (10−3) | 0.95 (0.88, 1.04) | 0.95 (0.88, 1.04) | 0.96 (0.90, 1.04) | 0.6855 |
| ALN maximum inflow slope of TIC13 | 2.97 (2.25, 3.56) | 2.98 (2.25, 3.49) | 2.95 (2.36, 3.57) | 0.9945 |
| Tumor to ALN | 1.53 (1.10, 2.00) | 1.53 (1.16, 2.01) | 1.52 (1.07, 1.99) | 0.5755 |
| maximum flow slope ratio | ||||
| Lymph node treatment | 0.1873 | |||
| SLNB | 98 (22.3%) | 70 (22.8%) | 28 (21.2%) | |
| ALND | 327 (74.5%) | 228 (74.3%) | 99 (75.0%) | |
| SLNB + ALND | 14 (3.2%) | 9 (2.9%) | 5 (3.8%) | |
| Number of metastases lymph nodes | 1.0 (1.0, 3.0) | 1.0 (1.0, 3.0) | 1.0 (1.0, 3.0) | 0.6805 |
| Number of removed lymph nodes | 16 (11, 20) | 16 (11, 20) | 16 (11, 19) | 0.9005 |
CEA: carcinoembryonic antigen; CA125: cancer antigen 12–5; CA153: cancer antigen 15–3; PLR: platelet to lymphocyte ratio; NLR: neutrophil to lymphocyte ratio; ER: estrogen receptor; PR: progesterone receptor; ALN: axillary lymph node; TIC: tumor time-intensity curve; ADC: apparent diffusion coefficient
1Mean ± SD; n (%); median (IQR)
2Welch two-sample t-test
3Pearson’s Chi-squared test
4Fisher’s exact test
5Wilcoxon rank sum test
6BMI: weight (kg)/height2 (m2)
7Menopausal status was assessed according to the International Menopause Society (IMS) 2016 guidelines
8The clinical T stage was classified in accordance with the eighth edition of the American Joint Committee on Cancer (AJCC) Breast Cancer Staging Manual
9Pathological types assessments were made according to the WHO classification of breast tumors
10Histological Grades were based on Nottingham histologic grades
11Hormonal receptor statuses, including ER and PR, along with HER-2 and Ki-67 expressions, were evaluated based on the NCCN guidelines (version 4, 2023)
12TIC types assessments were made according to the European Society of Breast Imaging 2022 guidelines
13Slope of signal intensity value of the two time points with the maximal difference value at the rapid increasing stage on TIC
US examinations were conducted by 2 radiologists (with 12 and 15 years of experience in breast imaging, respectively), blinded to the final axillary histopathological results. Discrepancies were resolved through consensus discussion. Using US equipment equipped with an 18L6 HD transducer (Acuson Sequoia Silver, Siemens, CA). Patients were placed in a supine position with their hands near their heads for optimal breast exposure during the examination. Scans of both longitudinal and transverse sections of the breast lesions were performed. The US features of the tumor and ALN are included in Table 1.
ALN surgical staging and pathological assessment
The surgical approach adhered to relevant guideline protocols. For patients who were candidates for SLNB (ALNs were negative on axillary biopsy), ALN pathology was assessed via intraoperative frozen sections, and methylene blue was used as the indicator for initial SLNB. If intraoperative frozen section or postoperative paraffin pathology suggested SLN positivity, ALND was continued or subsequently performed. People were entered into the ALNM group directly if their lymph nodes were positive on preoperative axillary biopsy (UpN +).
Clinicopathological analysis
The clinicopathological features, including histological type (non-specific invasive type, specific invasive type, unclassified), histological grade (I, II or III), estrogen receptor (ER) status, progesterone receptor (PR) status, ER-positive percentage, PR-positive percentage, HER2 expression, were obtained via preoperative biopsy of tumor. ER-positive/PR-positive expression was defined as expression greater than 1% [22]. HER2 status by immunohistochemistry (IHC) was negative (IHC-0), low (IHC-1 + and IHC-2 +/in situ hybridization (ISH)-negative), or high (IHC-3 +/ISH-positive) [23, 24].
Statistical analysis
Statistical analyses were conducted via SPSS Statistics version 27.0 (IBM Corp), R programming language version 4.2.2 (R Foundation for Statistical Computing), and the MSTATA platform (http://www.mstata.com/). Study participants were randomly allocated to either the training cohort (70%) or the validation cohort (30%) through computer-generated randomization. The analysis included measures such as the mean (standard deviation [SD]) for normally distributed variables and median (interquartile range [IQR]) for nonnormally distributed variables for continuous variables and frequencies and percentages for categorical variables. Continuous variables were analyzed via parametric and nonparametric approaches: Welch t-tests (two-group comparisons) or analysis of variance (ANOVA) (multigroup comparisons) for normally distributed variables (assessed by Shapiro–Wilk tests), with Wilcoxon rank‒sum tests or Kruskal‒Wallis tests employed for nonnormal distributions. Categorical variables were compared via χ2 tests (expected cell frequencies ≥ 5) or Fisher’s exact tests (expected cell frequencies < 5). Predictor selection was implemented through least absolute shrinkage and selection operator (LASSO) regression with tenfold cross-validation (λ selected via the minimum mean squared error criterion). Variables retaining nonzero coefficients in LASSO regression were subjected to univariable logistic regression analysis. Variables demonstrating statistical significance (two-tailed P < 0.05) were subsequently entered into multivariable logistic regression models. A clinical prediction nomogram was developed from the final multivariable model using the training cohort. Model validation included both training set and validation set assessments. Discriminatory capacity was quantified via AUC comparisons. A 1000-iteration bootstrap resampling procedure was performed on the full cohort to assess model stability. To determine the optimal cut-off value for classification, the Youden index (defined as sensitivity + specificity − 1) was calculated, and the threshold corresponding to the maximum Youden index was selected. Clinical utility was appraised via decision curve analysis (DCA).
Results
Patient characteristics
Among these 439 patients included in this study, the final outcome of preoperative axillary guided biopsy in 95 individuals (21.64%) was reactive lymph node hyperplasia, without ALNM (Fig. 2a). Of the ALNM group, 64.83% (n = 223) resented with ≤ 2 positive lymph nodes (LN + ≤ 2), and 35.17% (n = 121) presented with ≥ 3 positive lymph nodes (LN + ≥ 3) (Fig. 2b). The overall cohort comprised predominantly middle-aged participants with a mean age of 50 ± 11 years. The majority were married (97.5%), and 51.5% had attained a middle school education. Anthropometric measurements revealed a median BMI of 23.44 kg/m2 (IQR 21.48–25.71), with a mean height of 160.0 ± 6.9 cm and weight of 61 ± 9 kg. Postmenopausal status was reported in 42.1% of participants, and 97.5% had a history of prior pregnancies. A family history of breast cancer was rare (2.5%). Tumor pathology revealed that 80.9% of the cases were non-specific invasive carcinomas, with histological grade II carcinomas predominating (83.1%). ER positivity was observed in 72.0% of cases, whereas PR positivity was present in 60.1%, and the median number of removed lymph nodes was 16 (IQR 11–20). The demographics and baseline characteristics of the patients in our training set (n = 307) and validation set (n = 132) are listed in Table 1. The cohorts were well-balanced in most baseline characteristics, with only minor differences (CEA and BI-RADS of MRI) observed in specific variables.
Fig. 2.

Proportion of non-ALNM and ALNM (a). Percentages reflect proportions in the ALNM subgroup (b). ALNM: axillary lymph node metastasis; LN + : positive lymph node(s)
LASSO regression and univariate analysis of non-ALNM
LASSO regression analysis identified 14 predictors with nonzero coefficients from candidate variables in the training cohort (Fig. 3). The key retained variables included: education (β = − 0.063), menopausal status (β = 0.018), reproductive history (β = 0.611), CA125 (β = 0.009), ER status (β = 0.027), ER-positive percentage (β = − 0.004), PR-positive percentage (β = − 0.00007), US BI-RADS category (β = 0.076), ALN cortical-medullary boundary (β = 0.888), ALN cortical thickness (β = 4.166), ALN short-axis diameter (β = − 0.069), MRI BI-RADS category (β = 0.925), ALN TIC type (β = − 0.577), and ALN maximum inflow slope of TIC (β = 0.010) (Supplementary Table 1). Figure 3 illustrates the coefficient distribution across the log(λ) sequence and the 14 variables retained in the final non-ALNM model. The 14 LASSO-selected variables were subsequently analyzed via univariate models (Table 2). Compared with the ALNM group, the non-ALNM group presented a greater prevalence of ER-negative status (40.0 vs. 24.9%; P < 0.05), a lower US BI-RADS category (61.4 vs. 35.0%; P < 0.05), a lower MRI BI-RADS category (24.3 vs. 2.1%; P < 0.05), increased rates of clear cortical–medullary boundaries (85.7 vs. 29.5%; P < 0.05), a greater proportion of normal ALN cortical thickness (74.3 vs. 0.8%; P < 0.05) and shorter median ALN short-axis diameter (6.0 vs. 9.0 mm; P < 0.05).
Fig. 3.

Cross-validation plot for the penalty term (a). Plots for LASSO regression coefficients over different values of the penalty parameter (b)
Table 2.
Clinicopathologic and radiological characteristics screened after LASSO
| Characteristic | Non-ALNM N = 70 N (%) | ALNM N = 237 N (%) | P |
|---|---|---|---|
| Education | 0.0652 | ||
| Primary school and below | 15 (21.4%) | 36 (15.2%) | |
| Middle school | 30 (42.9%) | 139 (58.6%) | |
| College degree and above | 25 (35.7%) | 62 (26.2%) | |
| Menopausal status | 0.1132 | ||
| Yes | 25 (35.7%) | 110 (46.4%) | |
| No | 45 (64.3%) | 127 (53.6%) | |
| Reproductive history | 0.0833 | ||
| Yes | 66 (94.3%) | 233 (98.3%) | |
| No | 4 (5.7%) | 4 (1.7%) | |
| CA125 (U/mL) | 14 (11, 19) | 14 (10, 20) | 0.4834 |
| ER | 0.0142 | ||
| Positive | 42 (60.0%) | 178 (75.1%) | |
| Negative | 28 (40.0%) | 59 (24.9%) | |
| ER-positive percentage | 60 (0, 80) | 70 (1, 90) | 0.0854 |
| PR-positive percentage | 4 (0, 42) | 10 (0, 50) | 0.1944 |
| BI-RADS(US) | < 0.0012 | ||
| 5 | 27 (38.6%) | 154 (65.0%) | |
| 4c | 18 (25.7%) | 46 (19.4%) | |
| 4b | 12 (17.1%) | 28 (11.8%) | |
| 4a | 13 (18.6%) | 9 (3.8%) | |
| ALN cortical–medullary boundary | < 0.0012 | ||
| Clear | 60 (85.7%) | 70 (29.5%) | |
| Unclear | 10 (14.3%) | 167 (70.5%) | |
| ALN cortical thickness | < 0.0012 | ||
| Normal | 52 (74.3%) | 2 (0.8%) | |
| Thickening | 18 (25.7%) | 235 (99.2%) | |
| ALN short-axis diameter (mm) | 6.0 (5.8, 7.0) | 9.0 (7.0, 11.4) | < 0.0014 |
| ALN TIC type | < 0.0013 | ||
| III | 3 (4.3%) | 12 (5.1%) | |
| II | 31 (44.3%) | 178 (75.1%) | |
| I | 9 (12.9%) | 29 (12.2%) | |
| 0 | 27 (38.6%) | 18 (7.6%) | |
| BI-RADS(MRI) | < 0.0012 | ||
| V | 53 (75.7%) | 232 (97.9%) | |
| III/IV | 17 (24.3%) | 5 (2.1%) | |
| ALN maximum inflow slope of TIC | 2.67 (2.26, 3.34) | 3.04 (2.25, 3.61) | 0.1864 |
CA125: cancer antigen 12–5; ER: estrogen receptor; PR: progesterone receptor; ALN: axillary lymph node; TIC: tumor time-intensity curve
1n (%); median (IQR)
2Pearson’s Chi-squared test
3Fisher’s exact test
4Wilcoxon rank sum test
Univariate and multivariate logistic regression of non-ALNM patients
Univariate logistic regression analysis revealed ER status, US BI-RADS, ALN cortical–medullary boundary, ALN cortical thickness, ALN short-axis diameter, ALN TIC type, and MRI BI-RADS categories as independent predictors of patients with non-ALMN (Table 3). The initial input for the multiple logistic regression analysis was based on significant variables found in the univariate analysis (P < 0.05). Multifactorial analysis revealed that ER negativity (OR 5.14; 95% CI 1.56–16.89; P = 0.007), clear ALN cortical–medullary boundary (OR 4.32; 95% CI 1.39–13.48; P = 0.012), normal ALN cortical thickness (OR 168.41; 95% CI 33.55–845.31; P < 0.001), shorter ALN short-axis diameter (OR 0.8; 95% CI 0.66–0.98; P = 0.032), and lower MRI BI-RADS categories (III/IV) (OR 10.18; 95% CI 1.41–73.36; P = 0.021) were considered as independent predictors of non-ALNM. US BI-RADS and ALN TIC type were not significant factors (Table 4).
Table 3.
Univariate logistic regression analysis for predicting non-ALNM
| Characteristic | OR | 95% CI | P |
|---|---|---|---|
| Education | |||
| Primary school and below | – | – | |
| Middle school | 0.52 | 0.25, 1.06 | 0.073 |
| College degree and above | 0.97 | 0.45, 2.07 | 0.933 |
| Menopausal status | |||
| Yes | – | – | |
| No | 1.56 | 0.90, 2.71 | 0.115 |
| Reproductive history | |||
| Yes | – | – | |
| No | 3.53 | 0.86, 14.50 | 0.08 |
| CA125(U/mL) | 1.01 | 1.00, 1.02 | 0.242 |
| ER status | |||
| Positive | – | – | |
| Negative | 2.01 | 1.15, 3.53 | 0.015* |
| ER-positive percentage | 0.99 | 0.99, 1.00 | 0.139 |
| PR-positive percentage | 1 | 0.99, 1.01 | 0.454 |
| BI-RADS(US) | |||
| 5 | – | – | |
| 4c | 2.23 | 1.13, 4.41 | 0.021* |
| 4b | 2.44 | 1.11, 5.39 | 0.027* |
| 4a | 8.24 | 3.21, 21.16 | < 0.001*** |
| ALN cortical-medullary boundary | |||
| Unclear | – | – | |
| Clear | 14.31 | 6.93, 29.56 | < 0.001*** |
| ALN cortical thickness | |||
| Thickening | – | – | |
| Normal | 339.44 | 76.39, 1,508.30 | < 0.001*** |
| ALN short-axis diameter (mm) | 0.72 | 0.63, 0.81 | < 0.001*** |
| ALN TIC type | |||
| III | – | – | |
| II | 0.7 | 0.19, 2.61 | 0.592 |
| I | 1.24 | 0.29, 5.40 | 0.773 |
| 0 | 6 | 1.48, 24.30 | 0.012* |
| BI-RADS(MRI) | |||
| V | — | — | |
| III/IV | 14.88 | 5.26, 42.14 | < 0.001*** |
| ALN maximum inflow slope of TIC | 0.98 | 0.83, 1.16 | 0.847 |
OR odds ratio; CI: confidence interval; ER: estrogen receptor; PR: progesterone receptor; ALN: axillary lymph node; TIC: tumor time-intensity curve
*P < 0.05
**P < 0.01
***P < 0.001
Table 4.
Multivariate logistic regression analysis for predicting non-ALNM
| Characteristic | OR | 95% CI | P |
|---|---|---|---|
| ER status | |||
| Positive | – | – | |
| Negative | 5.14 | 1.56, 16.89 | 0.007** |
| BI-RADS(US) | |||
| 5 | – | – | |
| 4c | 2.48 | 0.74, 8.25 | 0.139 |
| 4b | 1.71 | 0.35, 8.50 | 0.509 |
| 4a | 1.33 | 0.19, 9.24 | 0.775 |
| ALN cortical–medullary boundary | |||
| Unclear | – | – | |
| Clear | 4.32 | 1.39, 13.48 | 0.012* |
| ALN cortical thickness | |||
| Thickening | – | – | |
| Normal | 168.41 | 33.55, 845.31 | < 0.001*** |
| ALN short-axis diameter (mm) | 0.8 | 0.66, 0.98 | 0.032* |
| ALN TIC type | |||
| III | – | – | |
| II | 0.79 | 0.08, 7.46 | 0.839 |
| I | 3.42 | 0.33, 35.91 | 0.305 |
| 0 | 1.83 | 0.14, 23.90 | 0.644 |
| BI-RADS(MRI) | |||
| V | – | – | |
| III/IV | 10.18 | 1.41, 73.36 | 0.021* |
OR odds ratio; CI: confidence interval; ER: estrogen receptor; ALN: axillary lymph node; TIC: tumor time-intensity curve
*P < 0.05
**P < 0.01
***P < 0.001
Development and validation of the predictive nomogram
A multivariate logistic regression-derived nomogram was constructed to estimate the probability of non-ALNM (Fig. 4). Points were assigned to each predictor variable based on its regression coefficient, with cumulative scores corresponding to individualized risk predictions. The model exhibited strong discriminative performance, achieving an AUC of 0.955 (95% CI 0.926–0.983) in the training cohort and 0.905 (95% CI 0.832–0.978) in the validation cohort (Fig. 5). Bootstrap validation demonstrated excellent discriminatory capacity (AUC = 0.931) with substantial predictive concordance (Kappa = 0.769), refer to Supplementary Table 2 for comprehensive metrics. To enhance clinical applicability, the predictive model was further transformed into a dynamic online nomogram using R's Shiny package and deployed on shinyapps.io. The interactive nomogram is accessible at https://comprehensivepredictionofnonalnm.shinyapps.io/dynnomapp/, allowing researchers and clinicians to use the tool effectively. By inputting clinical features such as ER status, ALN cortical–medullary boundary, ALN cortical thickness, ALN short-axis diameter, and MRI BI-RADS, users can readily determine the possibility of non-ALNM in breast cancer before preoperative axillary biopsy (Supplementary Fig. 1).
Fig. 4.

A nomogram for predicting non-ALNM. Variables include estrogen receptor (ER) status, axillary lymph node (ALN) cortical–medullary boundary, ALN cortical thickness, ALN short-axis diameter, and MRI BI-RADS classification. Each variable is assigned points on the upper axis (0–100), which are summed to calculate the total points (0–240) on the lower axis. The final probability of non-ALNM is projected onto the corresponding scale (0.1–0.9), with higher total points indicating a lower likelihood of metastasis
Fig. 5.

Predictive performance and clinical utility of the model. ROC curve for the training group, The AUC is 0.955 (95% CI 0.926–0.983) (a). ROC curve for the validation group, with an AUC of 0.905 (95% CI 0.832–0.978) (b). DCA for the training group (c). DCA for the validation group (d). AUC: area under the ROC curve; DCA: decision curve analysis; Net benefit, calculated as the weighted difference between true positives and false positives, adjusted for risk threshold preferences
To optimize predictive performance, the ideal threshold for classification was determined by maximizing the Youden Index (defined as Sensitivity + Specificity − 1). ROC curve analysis identified the optimal cut-off value as 0.3958, yielding a sensitivity of 80.00% (0.8000), a specificity of 97.89% (0.9789), and a Youden Index of 0.7789. Detailed classification performance of the model across different risk thresholds can be found in Supplementary Table 3. The optimal threshold was applied to stratify patients into different risk groups, enabling more precise diagnostic evaluation. Patients with predicted values exceeding this threshold (0.3958) were identified as having a relatively low risk of ALNM. In this subgroup, the exemption of preoperative axillary biopsy may potentially reduce diagnostic and treatment costs, as well as shorten the waiting time, without compromising clinical safety. DCA demonstrated the nomogram’s superior clinical utility across threshold probabilities ranging from 0 to 80% (Fig. 5). Compared with the “treat-all” and “treat-none"strategies, the model provided a substantial net benefit within this clinically relevant probability range, supporting its potential for risk stratification in clinical decision-making.
Discussion
In this study, we developed a nomogram for the preoperative, non-invasive identification of breast cancer patients who may be exempted from preoperative axillary biopsy by integrating clinicopathological data, US, and MRI features. Through LASSO regression and multivariate logistic analysis, ER status, ALN cortical-medullary boundary, ALN cortical thickness, ALN short-axis diameter, and MRI BI-RADS category were identified as independent predictors for the non-ALNM. The resulting nomogram demonstrated excellent discriminative ability, with AUCs of 0.955 (95% CI 0.926–0.983) in the training cohort and 0.905 (95% CI 0.832–0.978) in the validation cohort. Findings from the Z0011 trial and subsequent studies support the safety of axillary de-escalation in selected patients, highlighting the importance of multidisciplinary decision-making and patient preference when considering the omission of ALND or SLNB [15, 25]. However, to date, no studies have focused on optimizing the utilization of preoperative axillary lymph node biopsy. This approach provides a potential means of integrating ALN status assessment into preoperative biopsy decision-making, which may inform and enhance axillary management practices.
To enhance clinical utility, we developed an interactive online platform that enables clinicians to input individual patient data and receive personalized risk predictions. A threshold value of 0.3958, determined by maximizing the Youden index, was employed to stratify patients for clinical management. Patients with predicted probabilities above this cutoff are classified as low risk for ALNM and may safely omit preoperative axillary biopsy. This strategy may help lower medical costs, reduce the risks linked to invasive procedures, and potentially shorten the preoperative waiting period. Preoperative evaluation in breast cancer is progressively evolving toward greater non-invasiveness, precision, and personalization. Ongoing multidisciplinary collaboration remains essential to further optimize clinical decision-making, improve diagnostic accuracy, and enhance patient quality of life [26].
In this study, ER status was significantly associated with ALN status, but the association between ER status and ALN involvement remains controversial [27]. Several studies have reported a negative correlation between ER expression and ALNM [28, 29]. However, our findings suggest that ER-negative status is an independent predictor of non-ALNM, which aligns with the results of Howlader et al., who analyzed 191,403 patients from the SEER database and found a lower incidence of ALNM in ER-negative (36%) compared to ER-positive (42%) [30]. Similarly, Yang et al. conducted a retrospective analysis of 830 breast cancer patients and identified ER positivity (P = 0.034) as an independent risk factor for ALNM [31]. Alsumai et al.in a multivariate analysis, found that ER-positive patients had a higher risk of ALNM (OR 1.837; 95% CI 1.022–3.302) [32]. Moreover, ER-positive status has been associated with increased angiogenesis and invasiveness in some malignancies [33–36]. Taken together, previous clinical and mechanistic studies provide supporting evidence for our observation that ER-negative status is a predictor of non-ALNM.
Furthermore, the structural differences between metastatic and normal lymph nodes result in distinct US features. Our model successfully captured these differences and incorporated them into the nomogram. Due to the deposition and coalescence of tumor cells near the marginal sinus, the lymph node cortex progressively thickens, which manifests on US as a cortical thickness > 3 mm, consistent with the established morphological criteria for pathological lymph nodes [37, 38]. Akissue et al. reported that the mean cortical thickness in patients with ALNM (3.7 ± 2.0 mm) was significantly greater than that in non-ALNM patients (2.3 ± 1.3 mm; P < 0.001) [39], which is consistent with our findings. In the present study, cortical thickness was identified as a significant predictor of ALNM, with an odds ratio (OR) of 168.41 (95% CI 33.55–845.31; P < 0.001). However, this exceptionally high OR may be attributed to the extremely unbalanced distribution of cortical thickness in the training cohort. Specifically, only 0.8% of patients in the ALNM group (n = 237) exhibited normal cortical thickness (< 3 mm), and this rare event likely resulted in unstable estimates from the logistic regression model, thereby inflating the effect size. Although the association was statistically significant, the magnitude of the OR should be interpreted with caution, as it may overestimate the true effect. Further validation in larger, more balanced cohorts is warranted to confirm the robustness and reproducibility of this association.
Previous studies have also found that lymph nodes in non-ALNM patients typically exhibit a shorter short-axis diameter (8 ± 3 mm in ALNM vs. 6 ± 2 mm in non-ALNM; P = 0.038), whereas the long-axis diameter shows no significant association [39]. This trend was similarly observed in our cohort, where the median short-axis diameter was 6.0 mm (IQR 5.8–7.0) in non-ALNM patients and 9.0 mm (IQR 7.0–11.4) in ALNM patients (P < 0.001). These data highlight a shorter short-axis diameter as a marker indicative of non-ALNM status. In summary, our model demonstrates the capability of the US to differentiate lymph nodes in different states.
MRI BI-RADS assessment emerged as an independent predictor of non-ALNM in our cohort of invasive breast cancer patients. To date, many studies have found that MRI morphological features and tumor enhancement parameters are associated with ALN status [40, 41]. Based on this, several models utilizing semi-quantitative DCE-MRI parameters to predict ALN status have been developed [42, 43]. Accordingly, our study initially incorporated a wide range of semi-quantitative DCE-MRI parameters. Although these factors did not reach statistical significance in the final multivariate logistic regression analysis and were subsequently excluded from the predictive model, univariate analysis revealed a significant difference in the distribution of axillary TIC types between the two groups (P < 0.05). Notably, the non-ALNM group exhibited a significantly higher proportion of Type 0 TIC patterns (characteristic of normal lymph nodes) compared to the ALNM group (38.6 vs. 7.6%, Table 2). The intricate contrast enhancement patterns inherent to fibroglandular breast tissue and the heterogeneity of tumor tissue, which may lead to significant differences in ADC values across different regions-of-interest (ROIs) within the same lesion, affect the predictive ability of MRI [44, 45]. In the future, comparing and correcting the US-suspicious ALN regions with MRI-determined ROIs and jointly identifying the target lymph nodes may enhance the diagnostic utility of MRI in this clinical context.
In recent years, numerous models have been developed to predict ALN status using omics data. For instance, Li et al. [46] constructed a nomogram incorporating mRNA expression profiles and clinical variables based on data from The Cancer Genome Atlas, and externally validated it in an independent Gene Expression Omnibus cohort. The model achieved an AUC of 0.728 in the training set and 0.810 in the validation set [46]. Although the model demonstrated robust predictive performance, further clinical validation is warranted. Moreover, their clinical utility is limited by high costs, long turnaround times, and restricted accessibility—factors that may delay timely surgical decision-making. Additionally, Jun et al. established a model for ER-positive/HER2-negative breast cancer based on microRNA expression, tumor size, and lymphovascular invasion, achieving AUCs of 0.877 and 0.883 in the training and validation cohorts, respectively [47]. Although the identified microRNAs in that study were significantly associated with ALNM, both microRNA expression and lymphovascular invasion data were derived from surgical specimens, and the study population was selectively defined. This may limit the broader application of such models in preoperative ALN status assessment.
Several nomograms have been developed using US features to predict ALNM, though their clinical applicability remains variable due to differences in feature selection and validation strategies. Luo et al. [48] proposed a US-only nomogram that achieved AUCs of 0.75 in the training set and 0.91 in a conditionally matched validation set. However, the artificially balanced cohort (equal pN0 and pN1 cases) may overestimate performance and limit generalizability [48]. Similarly, Song et al. integrated contrast-enhanced ultrasound (CEUS) and clinical parameters, achieving an AUC of 0.903. Although promising, CEUS relies on operator expertise and intravenous contrast, making it less feasible as a routine, non-invasive assessment [49]. In contrast, our model utilizes standard US features without contrast, preserving non-invasiveness and enhancing accessibility for broader clinical application.
Radiomics and deep learning techniques applied to imaging modalities have shown encouraging results in ALNM prediction. Gu et al. developed a deep learning–based radiomics nomogram to assess tumor and nodal status post-neoadjuvant chemotherapy [50]. Similarly, Dong et al. employed T2-weighted and diffusion-weighted MRI sequences to construct a radiomics model based on breast cancer-specific texture features, which achieved AUCs of 0.863 and 0.805 in the training and validation cohorts, respectively [51]. While these models exhibit favorable predictive performance and non-invasiveness, the extraction of imaging features often relies on manual segmentation by radiologists, which imposes higher operational demands and limits widespread clinical adoption.
Current evidence supports the significant value of preoperative US and MRI in evaluating ALN status. Integrating these modalities leverages their complementary strengths. The US demonstrates significant advantages in the non-invasive assessment of ALNs, primarily through its real-time dynamic visualization capability that characterizes cortical morphology and vascular flow pattern [52]. The absence of radiation exposure, high accessibility (enabling repeated screenings), and pronounced cost-effectiveness establish it as a frontline modality for initial triage and surveillance, particularly in resource-constrained settings. For non-invasive assessment of ALN status in breast cancer, MRI also has unique strengths. Suspicious MRI features include loss of fatty hilum and heterogeneous enhancement in lymph nodes. On DWI, metastatic ALNs usually show lower ADC values than benign nodes [53]. This is due to higher cellular density and microstructural damage in metastases [54]. DCE-MRI also helps evaluate cancer by tracking contrast changes. Type I curves (steady enhancement) suggest benign lesions, Type III curves (rapid washout) indicate malignancy, and Type II curves (plateau) require further assessment [55]. Investigating imaging features beyond lymph node size and incorporating functional imaging techniques may improve diagnostic accuracy, particularly in distinguishing benign from malignant nodes, thereby enhancing specificity [54]. Future investigations may benefit from focusing on developing standardized multimodal frameworks, such as combining morphological features with functional parameters, to advance comprehensive imaging support for clinical management.
Although our model demonstrated promising predictive performance, several limitations should be noted. First, validation was restricted to a relatively small internal cohort (n = 132), potentially affecting the stability and generalizability of performance estimates. While internal validation confirms feasibility, prospective external validation in larger multi-institutional cohorts remains essential to establish robustness across diverse populations and clinical settings. Second, lymph node assessment prioritized larger nodes or those with overt malignant morphology on US/MRI, which may overlook smaller nodes with subtle abnormalities. Although this pragmatic clinical approach enhances efficiency, it lacks standardized imaging protocols and inter-observer reliability validation, potentially compromising diagnostic consistency. Future studies will implement blinded dual-reader assessments with κ-statistics and third-reader arbitration to quantify variability, while exploring AI-assisted detection algorithms for subtle nodal features. Third, while the model achieves robust performance using clinically accessible parameters, it currently excludes advanced multi-omics data and quantitative radiomic features from advanced imaging. This omission may constrain biological interpretability and the capacity to capture tumor heterogeneity. Future work should prioritize integrating these high-dimensional data sources via multimodal fusion frameworks to enhance precision and discover novel biomarkers.
Conclusion
In conclusion, our approach uniquely integrates ALN status prediction with preoperative biopsy decision-making, supported by the deployment of a dynamic online prediction platform to enable rapid clinical application. Clearly defined cut-off values (0.3958) facilitate effective patient risk stratification. Patients with a predicted probability of non-ALNM above the threshold may be eligible to forgo preoperative axillary biopsy and proceed directly to SLNB, thereby minimizing preoperative costs and delays. Conversely, high-risk patients can undergo standard preoperative axillary biopsy. This strategy may contribute to optimizing patient-specific axillary management.
Supplementary Information
Supplementary Material 1: Figure 1. Interface of the online risk prediction tool for non-ALNM
Supplementary Material 2: Table 1 The coefficients of Lasso regression analysis
Supplementary Material 3: Table 2 Model performance validated by 1000-iteration bootstrap
Supplementary Material 4: Table 3 Classification accuracy for prediction at different risk cut-off points in the training cohort
Supplementary Material 5: Table 4 Abbreviations
Acknowledgements
We would like to extend our sincere gratitude to all our colleagues in the Departments of Breast Surgery, Radiology, Ultrasound, and Departments of Pathology at the First Affiliated Hospital of Xi’an Jiaotong University for their unwavering support and contributions to this study, and thank MSTATA software (https://www.mstata.com/) for providing data analysis services.
Author contributions
Conceptualization, BW and L-ZZ; Data curation, J-QZ and J-NZ; Formal analysis, J-QZ, J-NZ and Z-HL; Funding acquisition, BW and KW; Methodology, J-QZ, L-ZZ, Y-DZ and Y-LW; Resources, TQ, F-QW, X-NZ and BW; Software, J-QZ, J-NZ, D-NL, J-SD and C-LD; Supervision, BW, L-ZZ and KW; Validation, J-QZ and J-NZ; Visualization, J-QZ, J-NZ and YP; Writing-original draft, J-QZ and J-NZ; Writing-review & editing, BW and L-ZZ.
Funding
This work was supported by the National Natural Science Foundation of China (Grant Number: 82172798) and the Key Research and Development Plans in Shaanxi Province of China (No.2024SF-YBXM-223).
Availability of data and materials
All data generated or analysed during this study are included in this published article and its supplementary information files. The datasets presented in this article are not readily available due to sensitive information in accordance with current data legislation, but are available from the first or corresponding author upon reasonable request.
Declarations
Ethics approval and consent to participate
The studies involving human participants were reviewed and approved by the Ethics Committee of the First Affiliated Hospital of Xi’an Jiaotong University (XJTU1AF2024LSYY-503). In accordance with national legislation and institutional requirements, written informed consent for participation was not deemed necessary for this study.
Competing interests
The authors declare no competing interests.
Footnotes
Publisher's Note
Springer Nature remains neutral with regard to jurisdictional claims in published maps and institutional affiliations.
Jiaqi Zhang and Jianing Zhang have contributed equally to this work and should be considered co-first authors.
Contributor Information
Lizhe Zhu, Email: zhulizhe0301@163.com.
Bin Wang, Email: february111@163.com.
References
- 1.Lei S, Zheng R, Zhang S, Wang S, Chen R, Sun K, et al. Global patterns of breast cancer incidence and mortality: a population-based cancer registry data analysis from 2000 to 2020. Cancer Commun. 2021;41(11):1183–94. [DOI] [PMC free article] [PubMed] [Google Scholar]
- 2.Rojas K, Stuckey A. Breast cancer epidemiology and risk factors. Clin Obstet Gynecol. 2016;59(4):651–72. [DOI] [PubMed] [Google Scholar]
- 3.Bray F, Laversanne M, Sung H, Ferlay J, Siegel RL, Soerjomataram I, et al. Global cancer statistics 2022: GLOBOCAN estimates of incidence and mortality worldwide for 36 cancers in 185 countries. CA Cancer J Clin. 2024;74(3):229–63. [DOI] [PubMed] [Google Scholar]
- 4.Siegel RL, Kratzer TB, Giaquinto AN, Sung H, Jemal A. Cancer statistics, 2025. CA Cancer J Clin. 2025;75(1):10–45. [DOI] [PMC free article] [PubMed] [Google Scholar]
- 5.Chida T, Miura Y, Cabral H, Nomoto T, Kataoka K, Nishiyama N. Epirubicin-loaded polymeric micelles effectively treat axillary lymph nodes metastasis of breast cancer through selective accumulation and pH-triggered drug release. J Control Release. 2018;292:130–40. [DOI] [PubMed] [Google Scholar]
- 6.Whelan TJ, Olivotto IA, Parulekar WR, Ackerman I, Chua BH, Nabid A, et al. Regional nodal irradiation in early-stage breast cancer. N Engl J Med. 2015;373(4):307–16. [DOI] [PMC free article] [PubMed] [Google Scholar]
- 7.Zhao D, Xu M, Yang S, Ma H, Li H, Wu R, et al. Specific diagnosis of lymph node micrometastasis in breast cancer by targeting activatable near-infrared fluorescence imaging. Biomaterials. 2022;282: 121388. [DOI] [PubMed] [Google Scholar]
- 8.Grup de Mama Vallès-Osona-Bages (GMVOB; Cooperative Breast Workgroup Vallés-Osona-Bagés), Del Riego J, Diaz-Ruiz MJ, Teixidó M, Ribé J, Vilagran M, et al. The impact of preoperative axillary ultrasonography in T1 breast tumours. Eur Radiol. 2016;26(4):1073–81. [DOI] [PubMed] [Google Scholar]
- 9.Britton PD, Provenzano E, Barter S, Gaskarth M, Goud A, Moyle P, et al. Ultrasound guided percutaneous axillary lymph node core biopsy: how often is the sentinel lymph node being biopsied? Breast. 2009;18(1):13–6. [DOI] [PubMed] [Google Scholar]
- 10.Balasubramanian I, Fleming CA, Corrigan MA, Redmond HP, Kerin MJ, Lowery AJ. Meta-analysis of the diagnostic accuracy of ultrasound-guided fine-needle aspiration and core needle biopsy in diagnosing axillary lymph node metastasis. Br J Surg. 2018;105(10):1244–53. [DOI] [PubMed] [Google Scholar]
- 11.Hwang SO, Lee SW, Kim HJ, Kim WW, Park HY, Jung JH. The comparative study of ultrasonography, contrast-enhanced MRI, and 18 f-fdg pet/ct for detecting axillary lymph node metastasis in T1 breast cancer. J Breast Cancer. 2013;16(3):315. [DOI] [PMC free article] [PubMed] [Google Scholar]
- 12.Shetty MK, Carpenter WS. Sonographic evaluation of isolated abnormal axillary lymph nodes identified on mammograms. J of Ultrasound Medicine. 2004;23(1):63–71. [DOI] [PubMed] [Google Scholar]
- 13.Alvarez S, Añorbe E, Alcorta P, López F, Alonso I, Cortés J. Role of sonography in the diagnosis of axillary lymph node metastases in breast cancer: a systematic review. Am J Roentgenol. 2006;186(5):1342–8. [DOI] [PubMed] [Google Scholar]
- 14.Conti A, Duggento A, Indovina I, Guerrisi M, Toschi N. Radiomics in breast cancer classification and prediction. Semin Cancer Biol. 2021;72:238–50. [DOI] [PubMed] [Google Scholar]
- 15.Xiong J, Zuo W, Wu Y, Wang X, Li W, Wang Q, et al. Ultrasonography and clinicopathological features of breast cancer in predicting axillary lymph node metastases. BMC Cancer. 2022;22(1):1155. [DOI] [PMC free article] [PubMed] [Google Scholar]
- 16.García Fernández A, Fraile M, Giménez N, Reñe A, Torras M, Canales L, et al. Use of axillary ultrasound, ultrasound-fine needle aspiration biopsy and magnetic resonance imaging in the preoperative triage of breast cancer patients considered for sentinel node biopsy. Ultrasound Med Biol. 2011;37(1):16–22. [DOI] [PubMed] [Google Scholar]
- 17.Li Z, Gao J, Zhou H, Li X, Zheng T, Lin F, et al. Multiregional dynamic contrast-enhanced MRI-based integrated system for predicting pathological complete response of axillary lymph node to neoadjuvant chemotherapy in breast cancer: multicentre study. eBioMedicine. 2024;107:105311. [DOI] [PMC free article] [PubMed] [Google Scholar]
- 18.Zhang X, Liu M, Ren W, Sun J, Wang K, Xi X, et al. Predicting of axillary lymph node metastasis in invasive breast cancer using multiparametric MRI dataset based on CNN model. Front Oncol. 2022;6(12):1069733. [DOI] [PMC free article] [PubMed] [Google Scholar]
- 19.Yu Y, Chen R, Yi J, Huang K, Yu X, Zhang J, et al. Non-invasive prediction of axillary lymph node dissection exemption in breast cancer patients post-neoadjuvant therapy: a radiomics and deep learning analysis on longitudinal DCE-MRI data. The Breast. 2024;77: 103786. [DOI] [PMC free article] [PubMed] [Google Scholar]
- 20.Yang L, Gu Y, Wang B, Sun M, Zhang L, Shi L, et al. A multivariable model of ultrasound and clinicopathological features for predicting axillary nodal burden of breast cancer: potential to prevent unnecessary axillary lymph node dissection. BMC Cancer. 2023;23(1):1264. [DOI] [PMC free article] [PubMed] [Google Scholar]
- 21.Rejmer C, Dihge L, Bendahl PO, Förnvik D, Dustler M, Rydén L. Preoperative prediction of nodal status using clinical data and artificial intelligence derived mammogram features enabling abstention of sentinel lymph node biopsy in breast cancer. Front Oncol. 2024;10(14):1394448. [DOI] [PMC free article] [PubMed] [Google Scholar]
- 22.Qiu SQ, Wei XL, Huang WH, Wu MY, Qin YS, Li YK, et al. Diagnostic and therapeutic strategy and the most efficient prognostic factors of breast malignant fibrous histiocytoma. Sci Rep. 2013;3(1):2529. [DOI] [PMC free article] [PubMed] [Google Scholar]
- 23.Hamilton E, Shastry M, Shiller SM, Ren R. Targeting HER2 heterogeneity in breast cancer. Cancer Treat Rev. 2021;100: 102286. [DOI] [PubMed] [Google Scholar]
- 24.Gaudio M, Jacobs F, Benvenuti C, Saltalamacchia G, Gerosa R, De Sanctis R, et al. Unveiling the HER2-low phenomenon: exploring immunohistochemistry and gene expression to characterise HR-positive HER2-negative early breast cancer. Breast Cancer Res Treat. 2024;203(3):487–95. [DOI] [PubMed] [Google Scholar]
- 25.Lee SY, Yoo TK, Kim J, Chung IY, Ko BS, Kim HJ, et al. Characteristics and risk factors of axillary lymph node metastasis of microinvasive breast cancer. Breast Cancer Res Treat. 2024;206(3):495–507. [DOI] [PubMed] [Google Scholar]
- 26.García-Mejido JA, Sanchez-Sevilla M, García-Jimenez R, Fernández-Palacín A, Antonio-Sainz J. Intraoperative predictive model for the detection of metastasis in non-sentinel axillary lymph nodes. Clin Exp Obstet Gyn. 2022;49(4):86. [Google Scholar]
- 27.Hermansyah D, Indra W, Paramita D, Siregar E. Role of hormonal receptor in predicting sentinel lymph node metastasis in early breast cancer. Med Arch. 2022;76(1):34. [DOI] [PMC free article] [PubMed] [Google Scholar]
- 28.Xiang K, Chen J, Min Y, Chen H, Yang J, Hu D, et al. A multi-dimensional nomogram to predict non-sentinel lymph node metastases in T1–2HR+ breast cancer. Front Endocrinol. 2023;14: 1121394. [DOI] [PMC free article] [PubMed] [Google Scholar]
- 29.Farley C, Bassett R, Meric-Bernstam F, Bedrosian I, Caudle A, DeSnyder S, et al. To dissect or not to dissect: can we predict the presence of four or more axillary lymph node metastases in postmenopausal women with clinically node-negative breast cancer? Ann Surg Oncol. 2023;30(13):8327–34. [DOI] [PubMed] [Google Scholar]
- 30.Howlader N, Cronin KA, Kurian AW, Andridge R. Differences in Breast Cancer Survival by Molecular Subtypes in the United States. Cancer Epidemiol Biomark Prev. 2018;27(6):619–26. [DOI] [PubMed] [Google Scholar]
- 31.Yang L, Zhao X, Yang L, Chang Y, Cao C, Li X, et al. A new prediction nomogram of non-sentinel lymph node metastasis in cT1-2 breast cancer patients with positive sentinel lymph nodes. Sci Rep. 2024;14(1):9596. [DOI] [PMC free article] [PubMed] [Google Scholar]
- 32.Alsumai TS, Alhazzaa N, Alshamrani A, Assiri S, Alhefdhi A. Factors predicting positive sentinel lymph node biopsy in clinically node-negative breast cancer. Breast Cancer Targets Ther. 2022;14:323–34. [DOI] [PMC free article] [PubMed] [Google Scholar]
- 33.Franco R, Pirozzi G, Scala S, Cantile M, Scognamiglio G, Camerlingo R, et al. CXCL12-binding receptors expression in non-small cell lung cancer relates to tumoral microvascular density and CXCR4 positive circulating tumoral cells in lung draining venous blood. Eur J Cardiothorac Surg. 2012;41(2):368–75. [DOI] [PubMed] [Google Scholar]
- 34.Felix AS, Stone RA, Chivukula M, Bowser R, Parwani AV, Linkov F, et al. Survival outcomes in endometrial cancer patients are associated with CXCL12 and estrogen receptor expression. Int J Cancer. 2012;131(2):E114-121. [DOI] [PMC free article] [PubMed] [Google Scholar]
- 35.Sauvé K, Lepage J, Sanchez M, Heveker N, Tremblay A. Positive feedback activation of estrogen receptors by the CXCL12-CXCR4 pathway. Cancer Res. 2009;69(14):5793–800. [DOI] [PubMed] [Google Scholar]
- 36.Szekely B, Bossuyt V, Li X, Wali VB, Patwardhan GA, Frederick C, et al. Immunological differences between primary and metastatic breast cancer. Ann Oncol. 2018;29(11):2232–9. [DOI] [PubMed] [Google Scholar]
- 37.Chung HL, Le-Petross HT, Leung JWT. Imaging updates to breast cancer lymph node management. Radiographics. 2021;41(5):1283–99. [DOI] [PubMed] [Google Scholar]
- 38.Chang JM, Leung JWT, Moy L, Ha SM, Moon WK. Axillary nodal evaluation in breast cancer: state of the art. Radiology. 2020;295(3):500–15. [DOI] [PubMed] [Google Scholar]
- 39.De Camargo Teixeira PA, Chala LF, Shimizu C, Filassi JR, Maesaka JY, De Barros N. Axillary lymph node sonographic features and breast tumor characteristics as predictors of malignancy: a nomogram to predict risk. Ultrasound Med Biol. 2017;43(9):1837–45. [DOI] [PubMed] [Google Scholar]
- 40.Loiselle CR, Eby PR, DeMartini WB, Peacock S, Bittner N, Lehman CD, et al. Dynamic contrast-enhanced MRI kinetics of invasive breast cancer: a potential prognostic marker for radiation therapy. Int J Radiat Oncol Biol Phys. 2010;76(5):1314–9. [DOI] [PubMed] [Google Scholar]
- 41.Tuncbilek N, Karakas HM, Okten OO. Dynamic magnetic resonance imaging in determining histopathological prognostic factors of invasive breast cancers. Eur J Radiol. 2005;53(2):199–205. [DOI] [PubMed] [Google Scholar]
- 42.Zhao M, Wu Q, Guo L, Zhou L, Fu K. Magnetic resonance imaging features for predicting axillary lymph node metastasis in patients with breast cancer. Eur J Radiol. 2020;129: 109093. [DOI] [PubMed] [Google Scholar]
- 43.Choi EJ, Youk JH, Choi H, Song JS. Dynamic contrast-enhanced and diffusion-weighted MRI of invasive breast cancer for the prediction of sentinel lymph node status. J Magn Reson Imaging. 2020;51(2):615–26. [DOI] [PubMed] [Google Scholar]
- 44.Choi YJ, Lee IS, Song YS, Kim JI, Choi K, Song JW. Diagnostic performance of diffusion-weighted (DWI) and dynamic contrast-enhanced (DCE) MRI for the differentiation of benign from malignant soft-tissue tumors. J Magn Reson Imaging. 2019;50(3):798–809. [DOI] [PubMed] [Google Scholar]
- 45.Zhao Z, Du S, Xu Z, Yin Z, Huang X, Huang X, et al. SwinHR: Hemodynamic-powered hierarchical vision transformer for breast tumor segmentation. Comput Biol Med. 2024;169: 107939. [DOI] [PubMed] [Google Scholar]
- 46.Li X, Yang L, Jiao X. Development and validation of a nomogram for predicting axillary lymph node metastasis in breast cancer. Clin Breast Cancer. 2023;23(5):538–45. [DOI] [PubMed] [Google Scholar]
- 47.Okuno J, Miyake T, Sota Y, Tanei T, Kagara N, Naoi Y, et al. Development of prediction model including MicroRNA expression for sentinel lymph node metastasis in ER-positive and HER2-negative breast cancer. Ann Surg Oncol. 2021;28(1):310–9. [DOI] [PubMed] [Google Scholar]
- 48.Luo Y, Zhao C, Gao Y, Xiao M, Li W, Zhang J, et al. Predicting axillary lymph node status with a nomogram based on breast lesion ultrasound features: performance in N1 breast cancer patients. Front Oncol. 2020;27(10): 581321. [DOI] [PMC free article] [PubMed] [Google Scholar]
- 49.Song Y, Liu J, Jin C, Zheng Y, Zhao Y, Zhang K, et al. Value of contrast-enhanced ultrasound combined with immune-inflammatory markers in predicting axillary lymph node metastasis of breast cancer. Acad Radiol. 2024;31(9):3535–45. [DOI] [PubMed] [Google Scholar]
- 50.Gu J, Tong T, Xu D, Cheng F, Fang C, He C, et al. Deep learning radiomics of ultrasonography for comprehensively predicting tumor and axillary lymph node status after neoadjuvant chemotherapy in breast cancer patients: A multicenter study. Cancer. 2023;129(3):356–66. [DOI] [PubMed] [Google Scholar]
- 51.Dong Y, Feng Q, Yang W, Lu Z, Deng C, Zhang L, et al. Preoperative prediction of sentinel lymph node metastasis in breast cancer based on radiomics of T2-weighted fat-suppression and diffusion-weighted MRI. Eur Radiol. 2018;28(2):582–91. [DOI] [PubMed] [Google Scholar]
- 52.Ng WL, Omar N, Ab Mumin N, Ramli Hamid MT, Vijayananthan A, Rahmat K. Diagnostic accuracy of shear wave elastography as an adjunct tool in detecting axillary lymph nodes metastasis. Acad Radiol. 2022;29(Suppl 1):S69-78. [DOI] [PubMed] [Google Scholar]
- 53.Cho P, Park CS, Park GE, Kim SH, Kim HS, Oh SJ. Diagnostic usefulness of diffusion-weighted MRI for axillary lymph node evaluation in patients with breast cancer. Diagnostics. 2023;13(3):513. [DOI] [PMC free article] [PubMed] [Google Scholar]
- 54.Ogut E. Rouvière’s lymph nodes: clinical insights and therapeutic frontiers. Chin J Acad Radiol. 2024;7(3):197–210. [Google Scholar]
- 55.Wekking D, Porcu M, De Silva P, Saba L, Scartozzi M, Solinas C. Breast MRI: clinical indications, recommendations, and future applications in breast cancer diagnosis. Curr Oncol Rep. 2023;25(4):257–67. [DOI] [PubMed] [Google Scholar]
Associated Data
This section collects any data citations, data availability statements, or supplementary materials included in this article.
Supplementary Materials
Supplementary Material 1: Figure 1. Interface of the online risk prediction tool for non-ALNM
Supplementary Material 2: Table 1 The coefficients of Lasso regression analysis
Supplementary Material 3: Table 2 Model performance validated by 1000-iteration bootstrap
Supplementary Material 4: Table 3 Classification accuracy for prediction at different risk cut-off points in the training cohort
Supplementary Material 5: Table 4 Abbreviations
Data Availability Statement
All data generated or analysed during this study are included in this published article and its supplementary information files. The datasets presented in this article are not readily available due to sensitive information in accordance with current data legislation, but are available from the first or corresponding author upon reasonable request.