

Abstract
Escherichia coli is widely used as an indicator of faecal contamination, as it is assumed that faeces from warm-blooded animals is the primary source of E. coli in the environment. However, various studies have shown that E. coli can survive and multiply in environmental niches, including soil, sand and sediment. E. coli can be assigned to eight main phylogroups but environmental E. coli are associated primarily with phylogroups A and B1. In this study, 410 E. coli were isolated from different niches within two peri-urban catchments in the Gauteng province of South Africa. To represent the E. coli circulating within the human population, E. coli was also isolated from sewage before treatment and released into these reservoirs. To capture the diversity of E. coli among these isolates, the β-D-glucuronidase (uidA) and mismatch repair (mutS) genes were sequenced. While isolates linked to phylogroup B1 dominated as was expected, the recovery of many isolates linked to phylogroup B2, the second most dominant group, was unanticipated. To further investigate this observation, the genomes of representative phylogroup B2 isolates were sequenced and subjected to phylogenetic and functional analyses. The results showed that phylogroup B2 isolates formed a distinct phylogenetic cluster, apparently independent of niche or geographic origin. Our findings also showed that while isolates seem to be associated with environmental samples, they could have the ability to colonize the gut and cause disease as they harboured several virulence factors associated with extraintestinal E. coli.
Supplementary Information
The online version contains supplementary material available at 10.1007/s00284-025-04402-y.
Introduction
Escherichia coli are frequently isolated from environments outside the gastro-intestinal tract of warm-blooded animals, where they occur as commensals [1, 2]. Populations of this bacterium can persist and become naturalized in environments ranging from soil, sand, water and wastewater to plant-associated niches—referred to as “environmental” E. coli [3, 4]. Because the composition of these persistent extraintestinal populations and their potential health impacts is not well understood, the interpretation of data related to the use of E. coli as an indicator of faecal contamination is often debated [1].
In an effort to understand the population structure and related functions of E. coli, a phylogenetic approach based on Multi-Locus Sequence Type (MLST) and genome data is widely used to link strains to specific lineages [5]. According to this framework, E. coli can be subdivided into eight phylogroups (A, B1, B2, C, D, E, F and G), which broadly correspond to different sets of ecological traits and lifestyles [5, 6]. Phylogroups A and B1 consist of commensal E. coli, while phylogroup B1 is also associated with pathogenic E. coli [6]. Phylogroup C consists of avian pathogenic E. coli (APEC) and Enterotoxigenic Escherichia coli (ETEC) [7]. Phylogroup D consists of uropathogenic E. coli (UPEC), enteroaggregative E. coli (EAEC) and extraintestinal pathogenic E. coli (ExPEC) [7]. Phylogroup E consists of enterohemorrhagic E. coli (EHEC), phylogroup F consists of ExPEC and environmental strains and phylogroup G consists of avian pathogenic E. coli (APEC) [7]. Phylogroup B2 includes ExPEC, UPEC and APEC. This group exhibits genetic variability and is believed to have diverged early during the evolutionary history of E. coli [6].
Among the known phylogroups, environments not associated with humans or animals are usually dominated by phylogroups B1 and A [3, 8–13]. For example, these two phylogroups constituted approximately 70% of the strains from drinking water in a Brazilian study, where the remaining strains mostly belonged to phylogroup D (26.5%), with phylogroup B2 being the least prevalent [12]. Similar patterns of dominance of phylogroups A and B1 have also been reported in studies focussing on surface water from the Yeongsan River basin in South Korea and from selected locations in Minnesota and Wisconsin, USA [10, 11]. Some authors have even suggested that phylogroup B1 is especially adapted to extraintestinal environments, thus explaining its dominance in plant-associated niches [3], freshwater beach sites in Michigan, USA [13] and soil collected near the Buffalo River in Minnesota, USA [9].
Human and wastewater isolates are associated mainly with phylogroups B2 and D, members of these phylogroups are known pathogens that are specifically adapted to the gastro-intestinal tract of warm-blooded animals [14]. For example, phylogroup B2 has a range of metabolic capabilities and adaptations that increase its ability to colonize the intestinal mucosa and persist in the human gut [15]. The notion that these bacteria are less fit in extraintestinal environments is consistent with their low frequency of occurrence in samples from freshwater and plant-associated environments [3, 12]. When phylogroups B2 or D occur at relatively high frequencies in freshwater and plant-associated environments, their incidence is linked to possible faecal contamination [8, 16]. In a study of surface water from the main watershed in and around Athens, Georgia, USA, phylogroup B2 was among the dominant lineages of E. coli detected, which the authors suggested was due to exposure of the water to faecal contamination of human and animal origin [8].
Environmental E. coli were initially reported from warmer tropical and subtropical regions but have since also been isolated from temperate regions [17]. However, only a limited number of these previous studies considered phylogroup associations among environmental E. coli populations. These include studies of samples collected from North America, South America, Europe, Asia and Australia in regions with temperate climates [1, 10], continental to humid continental climates [9, 11, 13, 18] and humid subtropical climates [8, 12, 18]. In Africa, the diversity and phylogroup distribution of environmental E. coli has received limited attention. The main focus of previous South African studies was on the microbial quality of vegetables and irrigation water, particularly with respect to faecal contamination using E. coli as indicator [16, 19]. The genetic composition and health risks associated with environmental E. coli populations from various aquatic environments in peri-urban regions with a subtropical climate have not been reported before. This is important information for the management of health risks associated with these environments. The aims of our study were to (i) determine the diversity of E. coli within two peri-urban freshwater catchments, (ii) examine how the phylogroups of isolates compare with each other and published data, (iii) investigate the genetic structure of populations using two protein-coding gene sequences and (iv) evaluate the potential virulence of isolates based on genome sequence information.
Materials And Methods
Sample Collection, E. coli Isolation and Phylogroup Assignment
The samples were obtained from the Roodeplaat dam and Rietvlei dam catchments in the Crocodile River Basin, Gauteng, South Africa. The Roodeplaat dam catchment was sampled from the inflowing Hartbees spruit (water, plant and sediment), outflow from the Zeekoegat and Baviaanspoort sewage plants that ultimately flow into the dam where we collected surface water, sediment, hyacinth, plant and algae samples. The Rietvlei dam catchment was sampled from the Olifantsfontein sewage treatment plant, which releases its effluent into the dam where we collected surface water, sediment, plants and plant debris samples. To represent E. coli circulating within local human populations, sewage samples were collected before sewage treatment and at final release into these reservoirs. All the samples were transported to the laboratory on ice and processed within 24 h.
Membrane Lactose Glucuronide Agar (MLGA) (Oxoid) was used to isolate E. coli. This medium contains indicators for β-glucuronidase (blue) and β-galactosidase (yellow) activity, enabling the differentiation of E. coli which exhibits activity for both, resulting in the production of green colonies. The liquid samples were diluted one thousand-fold, after which 100 μL of each dilution was plated onto MLGA and incubated at 37 °C overnight. For samples that did not yield green colonies, 1 mL was passed through 0.45 µm nitrocellulose filters, which were then placed on MLGA and incubated overnight at 37 °C. For the plant samples, a section of the plant was cut and placed into 50 mL of sterile Ringer’s solution (calcium chloride hexahydrate, 0.12 g/L; potassium chloride, 0.105 g/L; sodium bicarbonate, 0.05 g/L; and sodium chloride, 2.25 g/L) in a tube. This was sonicated for 1 min; thereafter, 10 mL was filtered through sterile 0.45 μm nitrocellulose filters (Whatman®, Merck) and placed on MLGA. For all presumptive E. coli isolates, β-glucuronidase and β-galactosidase activities were confirmed based on their ability to hydrolyse, 4-methylumbelliferyl-β-D-glucuronide (MUG) and ortho-nitrophenyl-β-D-galactopyranoside (ONPG) [20]. These isolates were inoculated into 5 mL of Colilert ®-18 medium (Dehteq), followed by incubation at 37 °C for 18 h and then checking for fluorescence under ultraviolet illumination.
For phylogroup assignment, genomic DNA was extracted from overnight MLGA cultures using the Quick-DNA™ MiniPrep Kit (Zymo Research). The isolates were classified into the major phylogroups A, B1, B2 or D using a PCR-based method developed by [21], with minor modifications. Briefly, this approach targets the chuA and yjaA genes, as well as the TspE4.C2 DNA fragment and modifications included the use of three separate PCR reactions rather than multiplex PCR, as well as 35 rather than 30 PCR cycles. Additionally, isolates negative for all three PCRs were denoted as “unassigned”, as suggested by [18].
Analyses of the uidA and mutS Sequences
The DNA sequences of the two protein-coding genes were determined. These genes included the β-D-glucuronidase-encoding (uidA) gene, which is specific to E. coli, and the mutS gene, which encodes the “mismatch recognition” protein of the DNA methyl-directed mismatch repair system in E. coli [22]. Portions of the genes were amplified using protocols provided by the Michigan State University MLST database (http://shigatox.net/ecmlst/protocols/index.html) [22], each 25 μL reaction mixture consisted of 25 mM MgCl2 (Separation Scientific), 2.5 mM of each dNTP (Thermo Fisher Scientific), 5 U/μL Super-Therm Taq DNA polymerase with reaction buffer (Separation Scientific), 10 mM of each primer (Table S1) and 50–100 ng template DNA. The PCR conditions comprised of initial denaturation at 94 °C for 10 min, followed by 30 cycles of denaturation at 92 °C for 1 min, annealing at 60 °C for 1 min and extension at 72 °C for 1 min, followed by a final extension step at 72 °C for 5 min. A negative control containing no DNA was included for each PCR reaction to ensure no cross-contamination occurred. Amplicons were visualized using 1% (w/v) agarose gel electrophoresis and GelRed (Biotium) according to the manufacturer’s specifications. Products in the expected size range (i.e. 658 bp for uidA and 596 bp for mutS) were purified enzymatically by incubating the PCR products at 37 °C for 15 min using 20 U/μL Exonuclease I (Thermo Fisher Scientific) and 2 U/μL FastAP Alkaline Phosphatase (Thermo Fisher Scientific) followed by inactivation of the enzymes at 80 °C for 15 min. The purified products were then sequenced using the BigDye™ Terminator v3.1 Cycle Sequencing Kit (Applied BioSystems) and the ABI3500xl Genetic Analyzer (Applied Biosystems). Consensus sequences were assembled for each amplicon using BioEdit version 7.0.9.0 [23]. Each sequence dataset was aligned using ClustalW multiple alignment [23]. The aligned uidA and mutS nucleotide datasets were then concatenated and subjected to phylogenetic analyses. The dataset also included sequences downloaded from GenBank for representatives of phylogroups A, B1, B2, D and E, as well as Shigella boydii, S. dysenteriae, S. flexneri, S. sonnei and E. coli Clade 1, which could be considered distinct E. coli phylogroups [22, 24]. Other Escherichia species (E. marmotae and E. ruysiae) were included for outgroup purposes [22]. A maximum likelihood phylogenetic tree was inferred from the concatenated dataset using PhyML 3.0 [25], and the best-fit evolutionary model parameters were determined via jModelTest software v. 0. 1. 1 and the Akaike Information Criterion [26].
The concatenated uidA and mutS nucleotide dataset containing only the E. coli strains obtained from the Roodeplaat and Rietvlei dams was subjected to two sets of population genetic analyses. First, population differentiation was explored using Weir and Cockerham’s [27] θ. For this purpose, the concatenated dataset was subjected to MULTILOCUS v. 1.3b [28], where the null hypothesis of no population differentiation was tested by calculating θ across different isolate collections using 1,000,000 randomizations. These collections were defined in such a way as to evaluate population differentiation between samples from the two dams as well as between and among phylogroups (with and without accounting for sample type or sample location). The second set of population genetic analyses utilized a Bayesian clustering approach in which isolates were modelled as having a proportion of their genomes derived from one or more source populations. Analyses were performed with the programme STRUCTURE 2.3.4 following the recommendations of Wang [29]. Accordingly, independent runs involving 500,000 Markov chain Monte Carlo iterations were used following a burn-in of 10,000 and the software’s default parameters, with the only exception being the use of an α value of 1/K (assuming the number of clusters). The optimum K was determined by STRUCTURE HARVESTER, which compared the data (obtained for 10 independent runs) at each analysis of K, from K = 1 to K = 10. The data were processed for the 10 runs at the optimal K with CLUMPP, after which CLUMPAK was used to graphically display the results [30].
Genome-Based Analyses
Due to their higher than expected occurrence (see below), nine presumptive phylogroup B2 isolates were selected for genome-based analyses. This selection was based on the uidA and mutS phylogenetic tree where we sought to span the genetic diversity among phylogroup B2 isolates. Accordingly, high-quality DNA was extracted from the nine isolates using the cetyltrimethylammonium bromide (CTAB) method described previously [31]. DNA quality and quantity were evaluated using a NanoDrop 2000 spectrophotometer (Thermo Fisher Scientific). These DNAs were then subjected to whole-genome sequencing using the Ion Torrent™ PGM Platform with the PI chip at the Central Analytical Facilities of the University of Stellenbosch. The genomes were assembled using IonGAP and annotated using the GenDB 2.4 Standalone pipeline [32, 33]. To confirm the phylogroup assignments for the nine isolates, they were subjected to ClermonTyping (http://clermontyping.iame-research.center/).
The annotated genome sequences generated in this study were added to a dataset containing information for other E. coli isolates obtained from GenBank. These were included to span the diversity of phylogroup B2 but also included genomes for representatives of each of phylogroups A, B1, D, E and F, as well as one representative from phylogroup C. The dataset additionally included genome sequences for isolates from other Escherichia species, as well as E. coli Clade 1. The entire dataset was analysed using the EDGAR 2.0 platform [34] to identify the genes common to all the genomes (i.e. core genes) and those encoded by only some of the genomes (i.e. accessory genes). The non-core genes were determined by removing the core genes from the accessory gene dataset.
For the identified core and non-core genes, dendrograms were constructed to examine the relationships among the isolates. In the case of the core gene data, individual amino acid sequences were aligned using the MUSCLE plugin in the QIAGEN CLC Main Workbench 21.0 [35]. The aligned core gene sequences were then concatenated and partitioned using FASconCAT-G 1.02 after which ProtTest 3.4 was used to determine the best-fit substitution model for each gene [36]. Maximum likelihood phylogenetic analysis was then conducted in RAxML using the identified model parameters. Branch support was estimated using the same parameters and bootstrap analysis of 1000 pseudoreplicates [37]. In the case of the non-core genes, a UPGMA (Unweighted Pair Group Method with Arithmetic Mean) tree was constructed from the gene presence/absence data using PAST3 (Paleontological Statistics Software Package for Education and Data Analysis) with the Jaccard similarity index [38].
Three rounds of pangenome analyses were conducted, with the first involving a comparison of each phylogroup B2 isolate sequenced here with known B2 strains to identify genes unique to each isolate. The amino acid sequences encoded by these unique genes were then subjected to GO-FEAT (Gene Ontology-Functional Enrichment Annotation Tool) analysis to determine their Gene Ontology (GO) terms for functional annotation [39]. The second pangenome analysis was conducted in the same way, but each of our isolates was compared with all of the strains included in the dataset. Where relevant, Fisher’s exact tests implemented in OmicsBox were used to investigate gene enrichment [40]. The third round of analyses involved the identification of virulence genes in the sequences for E. coli (i.e. those for E. ruysiae, E. marmotae or E. albertii were excluded). For this purpose, the annotation provided by EDGAR was used to determine which of the 58 virulence genes associated with ExPEC [41], eight genes linked to human association [42], and 44 UPEC and EHEC virulence genes also commonly associated with wastewater-specific strains [4] were encoded by each isolate. The presence of typical ExPEC pathovar virulence genes was also confirmed by submitting the newly sequenced genomes to the VirulenceFinder webtool on the Center for Genomic Epidemiology (CGE) website (https://cge.food.dtu.dk/services/VirulenceFinder/) or, if necessary, identifying the genes using local blast searches. The presence of the uspC-IS30-flhDC markers associated with wastewater-specific strains [4] was also investigated.
The database of the CGE was used to determine sequence types (STs) for the 64 isolates included in the genome dataset [43, 44]. The CGE database includes data for two MLST schemes based on eight and seven genes [43, 44]. We determined STs according to both schemes by subjecting the sequences to analyses with the MLST 2.0 tool provided on the CGE website (https://cge.food.dtu.dk/services/MLST/).
The assembled genome sequences were deposited under accession numbers JBFQXY000000000 (R2F1.2), JBFQYD000000000 (14m2), JBFQYF000000000 (4m4), JBFQYA000000000 (Q02H13), JBFQYB000000000 (Q02H4), JBFQYC000000000 (15m2), JBFQYG000000000 (1m6), JBFQYE000000000 (13m5), JBFQXZ000000000 (Q09A12) into the GenBank database (BioProject PRJNA1139092).
Results
Phylogroups B1 and B2 Dominate the Sampled E. coli Populations
A total of 410 E. coli isolates were obtained from the samples collected during this study (Table S2). A few strains belonging to related species have been shown to have β-glucuronidase activity [20]. Any such isolates were excluded from the study by confirming the identity of E. coli isolates based on their uidA and mutS sequences. There were 87 water isolates obtained from the Rietvlei (25) and Roodeplaat (62) dams. The sediment samples yielded 49 E. coli isolates, 31 and 18 from the respective dams. A total of 36 isolates were obtained from aquatic plants sampled from the dams, with 11 from Rietvlei and 25 from Roodeplaat, which included 13 isolates from water hyacinths, whereas plant debris (decaying plant material) sampled from the Rietvlei dam provided 24 E. coli isolates. A total of 172 isolates were obtained from raw sewage, with 87, 48 and 37 isolates originating from samples collected at the Olifantsfontein, Zeekoegat and Baviaanspoort treatment plants, respectively.
Application of the original Clermont et al. [21] method, allowed for separation of the 410 isolates into four main phylogroups: A (17%), B1 (38%), B2 (27%) and D (18%) (Table 1). According to this method, when amplifications of chuA and TspE4.C2 are negative, the isolate is assigned to phylogroup A. However, according the Gordon et al. [18] approach, isolates negative for these two markers and positive for yjaA are designated as phylogroup A, while isolates negative for all three markers were scored as “unassigned” (U). Therefore, according to the Gordon et al. [18] approach, the 410 isolates were separated as follows: A (8%), B1 (38%), B2 (27%), D (18%) and U (9%). In terms of overall catchment, which includes all sample types, phylogroup B2 comprised 25% of the Roodeplaat dam isolates and 29% of the Rietvlei dam isolates (Table 1). Phylogroup B1 comprised 42% and 33% of the isolates from the Roodeplaat and Rietvlei dams, respectively.
Table 1.
Comparison of the phylogroup distribution of 410 isolates obtained from the Roodelplaat and Rietvlei dam catchments with those reported in previous studies
| Sample source | Number of isolates per phylogroup | Percentage of isolates per phylogroup | ||||||||
|---|---|---|---|---|---|---|---|---|---|---|
| A* | B1 | B2 | D | U | A* | B1 | B2 | D | U | |
| Roodeplaat dam (overall) | 17 (44) | 97 | 57 | 34 | 27 | 7 (19) | 42 | 24 | 15 | 12 |
| Environmental (total) | 7 (23) | 79 | 27 | 18 | 16 | 5 (16) | 54 | 18 | 12 | 11 |
| Algae | 0 (3) | 17 | 3 | 5 | 3 | 0 (11) | 60 | 11 | 18 | 11 |
| Aquatic Plant | 0 (0) | 9 | 3 | 0 | 0 | 0 (0) | 75 | 25 | 0 | 0 |
| Water | 3 (14) | 20 | 5 | 9 | 11 | 6 (29) | 42 | 10 | 19 | 23 |
| Water hyacinth | 0 (0) | 0 | 13 | 0 | 0 | 0 (0) | 0 | 100 | 0 | 0 |
| Sediment Hartbeesspruit | 1 (1) | 14 | 2 | 1 | 0 | 6 (6) | 77 | 11 | 6 | 0 |
| Algae Hartbeesspruit | 1 (3) | 8 | 0 | 3 | 2 | 7 (21) | 57 | 0 | 22 | 14 |
| Water Hartbeesspruit | 2 (2) | 11 | 1 | 0 | 0 | 14 (14) | 79 | 7 | 0 | 0 |
| Sewage (total) | 10 (21) | 18 | 30 | 16 | 11 | 12 (25) | 21 | 35 | 19 | 13 |
| Baviaanspoort | 5 (9) | 9 | 12 | 7 | 4 | 14 (25) | 24 | 32 | 19 | 11 |
| Zeekoegat | 5 (12) | 9 | 18 | 9 | 7 | 10 (25) | 19 | 37 | 19 | 15 |
| Rietvlei dam (overall) | 17 (27) | 59 | 52 | 40 | 10 | 10 (16) | 33 | 29 | 22 | 6 |
| Environmental (total) | 11 (18) | 31 | 17 | 25 | 7 | 12 (20) | 34 | 19 | 27 | 8 |
| Aquatic Plant | 2 (5) | 1 | 4 | 1 | 3 | 18 (45) | 9 | 37 | 9 | 27 |
| Water | 2 (6) | 14 | 5 | 0 | 4 | 8 (24) | 56 | 20 | 0 | 16 |
| Sediment | 5 (5) | 9 | 7 | 10 | 0 | 16 (16) | 29 | 23 | 32 | 0 |
| Plant debris | 2 (2) | 7 | 1 | 14 | 0 | 8 (8) | 29 | 5 | 58 | 0 |
| Sewage (Olifantsfontein) | 6 (9) | 28 | 35 | 15 | 3 | 7 (11) | 32 | 40 | 17 | 4 |
| Both dams (overall) | 34 (71) | 156 | 109 | 74 | 37 | 8 (17) | 38 | 27 | 18 | 9 |
| Environmental (total) | 18 (41) | 110 | 44 | 43 | 23 | 7 (17) | 46 | 19 | 18 | 10 |
| Sewage (total) | 16 (30) | 46 | 65 | 31 | 14 | 9 (17) | 27 | 38 | 18 | 10 |
| Johnson et al. [11] | ||||||||||
| Animal | 54 | 159 | 51 | 19 | – | 17 | 51 | 16 | 6 | – |
| Surface water | 17 | 160 | 55 | 31 | – | 6 | 57 | 20 | 11 | – |
| Hamelin et al. [2] | ||||||||||
| Non-pathotypes | 57 | 129 | 21 | 1 | – | 27 | 62 | 10 | 1 | – |
| Pathotypes | 7 | 10 | 49 | 34 | – | 7 | 10 | 49 | 34 | – |
| Berthe et al. [1] | ||||||||||
| Bovine | 7 | 118 | 0 | 13 | – | 5 | 86 | 0 | 9 | – |
| Human | 30 | 4 | 15 | 1 | – | 60 | 8 | 30 | 2 | – |
| Water | 55 | 69 | 8 | 18 | – | 34 | 42 | 5 | 11 | – |
| Walk et al. [13] | ||||||||||
| Freshwater beach | 43 | 106 | 12 | 29 | – | 23 | 56 | 6 | 15 | – |
| Dusek et al. [9] | ||||||||||
| Soil | 0 | 249 | 110 | 104 | – | 0 | 43 | 19 | 18 | – |
| Méric et al. [3] | ||||||||||
| Plant | 26 | 44 | 8 | 22 | – | 25 | 42 | 8 | 21 | – |
| Cho et al. [8] | ||||||||||
| Surface water | 33 | 153 | 157 | 0 | – | 7 | 31 | 32 | 0 | – |
| Orsi et al. [48] | ||||||||||
| Recreational water | 72 | 32 | 8 | 21 | – | 54 | 24 | 6 | 16 | – |
| Orsi et al. [12] | ||||||||||
| Drinking water | 15 | 19 | 2 | 13 | – | 31 | 39 | 4 | 26 | – |
| Jang et al. [10] | ||||||||||
| River water | 1724 | 1192 | 118 | 376 | – | 50 | 34 | 5 | 11 | – |
*Values in brackets indicate totals and percentages if the unassigned phylogroup was assigned as phylogroup A according to Clermont et al. [21]. This is because strains were typed as belonging to phylogroup A when they were negative for chuA and TspE4.C2 in the triplex method, but they are typed as “unassigned” when negative for all the markers in the triplex method [18]
Among the isolates from the environmental samples (i.e. non-sewage samples), 19% were assigned to phylogroup B2, whereas 46% represented phylogroup B1. More specifically, in the Roodeplaat dam catchment, 54% of the environmental isolates formed part of phylogroup B1, and 18% formed part of phylogroup B2, whereas only 5% formed part of phylogroup A (or 16%, if all the “unassigned” isolates were included with this phylogroup). The same pattern was observed in the Rietvlei catchment samples, where most of the environmental isolates were typed as belonging to phylogroups B1 (34%) and B2 (19%), and phylogroup A contained only 12% of the environmental isolates (20% if the latter included the “unassigned” isolates). Phylogroup B2 (38%) was the dominant group linked to the sewage isolates as well as the aquatic plants with a high percentage of 55%. In contrast, the most dominant phylogroup associated with the plant debris was group D at 58%.
Phylogroup B2 is Genetically Distinct Based on uidA and mutS Sequences
To explore relatedness and evaluate the genetic diversity among the E. coli isolates obtained from the two catchments, the nucleotide sequences of uidA and mutS were analysed. Phylogenetic analyses of the concatenated dataset separated the 410 isolates into various clusters, with no clear patterns reflecting the source of the isolates (Supplementary Fig. S1). However, individual clusters mostly contained isolates from a particular phylogroup, which was particularly evident for phylogroups B2 and D. With respect to the environmental samples, isolates were spread across the tree, although most of them grouped with isolates from phylogroups B1 and B2.
Analysis of the concatenated uidA and mutS data with MULTILOCUS yielded highly significant but low θ values when comparing isolates from the Roodeplaat dam catchment with those from the Rietvlei dam catchment (θ = 0.012, p = 0.0014) or when comparing phylogroup B2 isolates from the two catchments (θ = 0.031, p = 0.0104). Such values are indicative of little population differentiation, suggesting that the two isolate collections essentially form part of the same overall population Wright (1978 as cited in [45]). This contrasts with the much stronger genetic differentiation detected (θ = 0.3068, p < 0.0001) when the analysis was performed using isolate collections defined based on their phylogroup assignments.
The observed genetic patterns were supported by the results of the STRUCTURE analysis of the concatenated uidA and mutS sequences (Fig. 1). This Bayesian approach for investigating population structure suggested that the genomes of the included isolates were derived from seven source populations (K = 7). However, the inferred ancestry proportions of the isolates did not correlate with their geographic origins or the sample types from which they were recovered. Instead, the inferred ancestry of the isolates reflected their phylogroup assignments, especially in the case of phylogroups B2 and D. For the latter, the largest proportion of the genomes of isolates from the respective phylogroups were each derived from single source populations (i.e. orange for phylogroup B2 and yellow for phylogroup D in Fig. 1). For phylogroups A, B1 and U, such a clear separation was lacking, as, irrespective of phylogroup assignment, ancestry membership for the isolates included one or combinations of four main source populations (i.e. grey, light blue, green and two darker blue populations), two of which were more dominant. Nevertheless, many exceptions to these patterns were also evident, with isolates from a particular phylogroup sharing ancestry membership with isolates from another phylogroup.
Fig. 1.
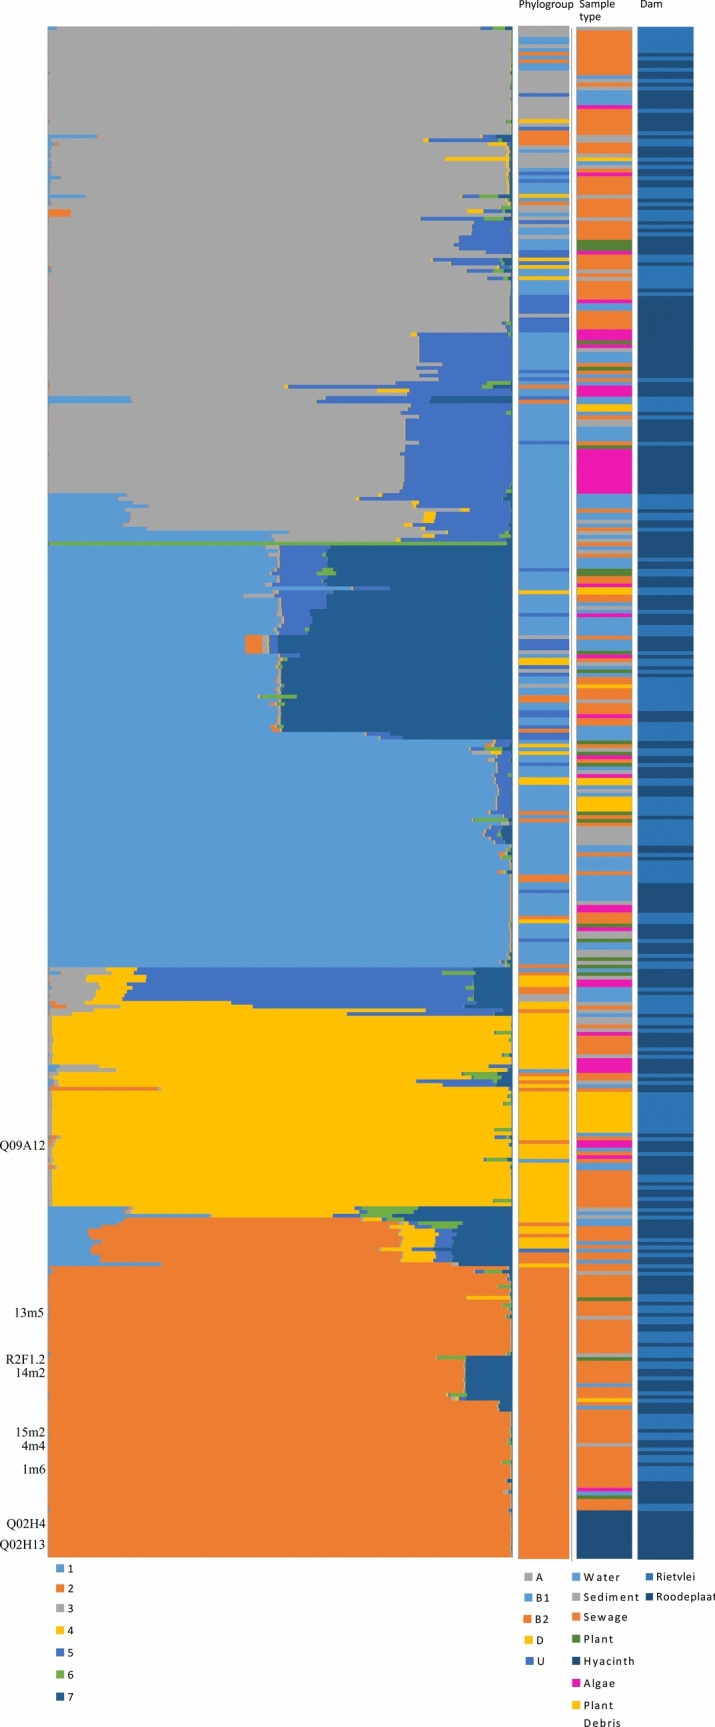
Population structure analysis of E. coli isolates. Concatenated mutS and uidA sequences were analysed under the assumption of the presence of two populations, but analysis using Structure Harvester revealed that K = 7 best explained the data. Each population was assigned a colour, and each isolate was assigned to one or more inferred source or ancestral populations making up 100% of the population. The graphical display of population structure was ordered according to the phylogenetic tree (Fig. S1). The nine sequenced isolates from this study are indicated on the left of the figure and include three aquatic plant (R2F1.2, Q02H4 and Q02H13), one algal (Q09A12) and five isolates (14m2, 4m4, 1m6, 13m5 and 15m2). Phylogroups are indicated according to the Gordon et al. [18] approach
Genome Data Cluster Environmental and Sewage Isolates of Phylogroup B2 Together
The nine bacteria for which genome sequences were generated were selected to represent phylogenetic diversity among our B2 isolates (Fig. S1) and included three aquatic plant (R2F1.2, Q02H4 and Q02H13), one algal (Q09A12) and five isolates (14m2, 4m4, 1m6, 13m5 and 15m2) from sewage samples. Their genome assemblies consisted of 84 to 221 contigs totaling approximately 5 Mb in size (Table S4), ranging from 4.81 Mb for isolate Q09A12 to 5.37 Mb for isolate R2F1.2. Confirmation of their initial phylogroup assignments using the genome-based ClermonTyping scheme further confirmed that all isolates except isolate Q09A12 formed part of phylogroup B2. This isolate was assigned to phylogroup G, which is closely related to B2 [5]. All nine of these new sequences were included in a larger dataset containing the genome sequences for 55 reference strains (i.e. phylogroups A, B1, B2, C-F and E. coli Clade 1, as well as E. marmotae, E. ruysiae, S. boydii, S. dysenteriae, S. flexneri and S. sonnei). Some of these genomes were complete, consisting of a single contig, whereas others contained as many as 1936 contigs (see Table 2 and Table S4 for details regarding their origins and genomes). Analysis with EDGAR allowed the identification of 1537 genes common to all 64 genomes included in the dataset (i.e. core genes), whereas 22,550 genes were missing in one or more of the genomes (i.e. non-core genes).
Table 2.
Pathotype, source, GenBank accession number and MLST1 and MLST2* sequence types of the isolates and reference strains used
| Strain | Phylogroup | Pathotype# | Source | Accession number | MLST 1 | MLST 2 |
|---|---|---|---|---|---|---|
| E. coli UTI89 | B2 | ExPEC | Human | NC_007946 | ST-95 | ST-1 |
| E. coli UM146 | B2 | AIEC | Human | NC_017632 | ST-643 | ST-1 |
| R2F1.2 | B2 | Plant | JBFQXY000000000 | ST-95 | ST-1 | |
| E. coli PMV1 | B2 | ExPEC | Human | NC_022370 | ST-6134 | ST-1 |
| E. coli IHE3034 | B2 | ExPEC | Human | NC_017628 | ST-95 | ST-1 |
| E. coli S88 | B2 | ExPEC | Human | NC_011742 | ST-95 | ST-1 |
| 14m2 | B2 | Sewage | JBFQYD000000000 | ST-95 | ST-1 | |
| E. coli APECO1 | B2 | ExPEC | Avian | NC_008563 | ST-95 | ST-418 |
| E. coli ECOR64 | B2 | ExPEC | Human | LYDC00000000 | ST-14 | ST-6 |
| 4m4 | B2 | Sewage | JBFQYF000000000 | ST-1193 | ST-53 | |
| E. coli F11 | B2 | ExPEC | Human | AAJU02000001 | ST-127 | ST-33 |
| E. coli 536 | B2 | ExPEC | Human | NC_008253 | ST-127 | Unknown |
| Q02H13 | B2 | Hyacinth | JBFQYA000000000 | Unknown | Unknown | |
| Q02H4 | B2 | Hyacinth | JBFQYB000000000 | Unknown | Unknown | |
| 15m2 | B2 | Sewage | JBFQYC000000000 | ST-372 | ST-455 | |
| E. coli ED1a | B2 | Commensal | Human | NC_011745 | ST-452 | ST-149 |
| E. coli TA014 | B2 | Commensal | Potoroo | ADKC00000000 | ST-104 | ST-798 |
| E. coli clone Di14 | B2 | ExPEC | Human | NC_017652 | ST-73 | ST-4 |
| E. coli CFT073 | B2 | ExPEC | Human | NC_004431 | ST-73 | ST-4 |
| E. coli ABU 83972 | B2 | ExPEC | Human | NC_017631 | ST-73 | ST-4 |
| E. coli ECOR57 | B2 | Commensal | Gorilla | LYCX00000000 | ST-73 | ST-4 |
| E. coli ECOR60 | B2 | Commensal | Human | LYDA00000000 | ST-12 | ST-36 |
| E. coli J96 | B2 | ExPEC | Human | ALIN02000001 | ST-12 | ST-36 |
| E. coli H223 | B2 | EAEC | Human | ADIV00000000 | ST-141 | ST-10 |
| E. coli LF82 | B2 | AIEC | Human | NC_011993 | ST-135 | ST-64 |
| E. coli O83:H1 NRG 857C | B2 | AIEC | Human | NC_017634 | ST-135 | ST-64 |
| 1m6 | B2 | Sewage | JBFQYG000000000 | ST-1170 | Unknown | |
| E. coli ECOR66 | B2 | ExPEC | Human | LYDE00000000 | ST-83 | ST-207 |
| E. coli NA114 | B2 | ExPEC | Human | NC_017644 | ST-131 | ST-43 |
| E. coli JJ1886 | B2 | EIEC | Human | NC_022648 | ST-131 | ST-43 |
| E. coli SE15 | B2 | Commensal | Human | NC_013654 | ST-131 | ST-506 |
| 13m5 | B2 | Sewage | JBFQYE000000000 | ST-131 | ST-506 | |
| E. coli O127:H6 E2348/69 | B2 | EPEC | Human | NC_011601 | ST-15 | ST-491 |
| Q09A12 | G | Algae | JBFQXZ000000000 | ST-657 | ST-385 | |
| E. coli O7:K1 CE10 | F | ExPEC | Human | NC_017646 | ST-62 | ST-254 |
| E. coli IAI39 | F | ExPEC | Human | NC_011750 | ST-62 | ST-254 |
| E. coli UMN026 | D | ExPEC | Human | NC_011751 | ST-414 | Unknown |
| E. coli 042 | D | EAEC | Human | NC_017626 | ST-597 | ST-3 |
| S. dysenteriae 1617 | NC_022912 | ST-146 | Unknown | |||
| S. dysenteriae Sd197 | NC_007606 | ST-146 | Unknown | |||
| E. coli O55:H7 CB9615 | E | EPEC | Human | NC_013941 | ST-335 | ST-553 |
| E. coli O157:H7 EDL933 | E | EHEC | Human | NC_002655 | ST-11 | Unknown |
| E. coli H10407 | A | ETEC | Human | NC_017633 | ST-48 | ST-132 |
| E. coli P12b | A | EPEC | Human | NC_017663 | ST-10 | Unknown |
| S. flexneri 5 8401 | NC_008258 | ST-634 | Unknown | |||
| S. flexneri 2a 301 | NC_004337 | ST-245 | Unknown | |||
| E. coli 55,989 | B1 | EAEC | Human | NC_011748 | ST-678 | ST-290 |
| E. coli O111:H− 11,128 | B1 | EHEC | Human | NC_013364 | ST-16 | ST-480 |
| E. coli APECO78 | C | APEC | Avian | NC_020163 | ST-23 | ST-708 |
| S. sonnei Ss046 | NC_007384 | ST-152 | ST-563 | |||
| S. sonnei 53G | NC_016822 | ST-152 | ST-563 | |||
| S. boydii CDC 3083–94/BS512 | NC_010658 | ST-1129 | Unknown | |||
| S. boydii Sb227 | NC_007613 | ST-1130 | Unknown | |||
| Escherichia TW15838 | Clade I | NZ_AEJX00000000 | ST-3692 | Unknown | ||
| Escherichia TW10509 | Clade I | GL872204 | ST-747 | ST-675 | ||
| E. ruysiae TW09276 | NZ_AEJV00000000 | |||||
| E. ruysiae TW09231 | NZ_AEJW0000000 | |||||
| E. ruysiae H605 | NZ_ADJX00000000 | |||||
| E. ruysiae TW14182 | NZ_AEJZ00000000 | |||||
| E. marmotae E1118 | NZ_ADKG00000000 | |||||
| E. albertii NIAH | AP014855 | |||||
| E. albertii CB9786 | AP014856 | |||||
| E. albertii EC06 | NZ_AP014857 | |||||
| E. fergusonii ATCC 35469 | NC_011740 |
*MLST 1 according to Wirth et al. [44] and MLST 2 according to Jaureguy et al. [43]
#ExPEC extraintestinal E. coli, AIEC adherent-invasive E. coli, EIEC enteroinvasive E. coli, EPEC enteropathogenic E. coli, EAEC enteroaggregative E. coli, EHEC enterohemorrhagic E. coli, ETEC enterotoxigenic E. coli and APEC Avian pathogenic E. coli
RAxML-based Maximum likelihood analysis of the concatenated data for the corresponding amino acid sequences of the core genes revealed that phylogroup B2 formed a cohesive cluster despite its high diversity (Fig. 2a). All the phylogroup B2 isolates were clustered together with 100% bootstrap support. The sister-group relationship between phylogroup B2 and phylogroup G isolate Q09A12 received 100% bootstrap support. Similarly, the PAST3-based UPGMA dendrogram inferred from the presence/absence data for the 22,550 non-core genes clustered all phylogroup B2 isolates together at approximately 50% similarity, with isolate Q09A12 nested within it (Fig. 2b). However, no clear patterns were evident in either the core or non-core gene trees in terms of the sampling origins of the isolates. In other words, our environmental- and sewage-related isolates were scattered across the respective clusters containing phylogroup B2 isolates. The only exceptions were isolates Q02H4 and Q02H13, which originated from water hyacinths in the Roodeplaat dam and always grouped together as part of a unique lineage.
Fig. 2.

Core and non-core phylogenetic analysis. a The amino acid core genome tree using 1537 core genes determined by EDGAR 2.0, drawn using RAxML. The tree is rooted using E. fergusonii, branch support based on 1000 bootstrap is indicated at the nodes and the scale bar depicts substitutions per site. b The amino acid non-core genome dendrogram using 22,550 genes determined by EDGAR 2.0, drawn using PAST3. For both of these analyses, the 55 reference phylogroups used, as well as the nine isolates from this study, are denoted using the phylogroup key and isolates from this study are indicated in purple
The presence/absence analysis of the virulence genes (non-core), typically associated with ExPEC (Mahfouz et al. 2018) also supported the phenotypic cohesiveness among phylogroup B2 isolates irrespective of their source (Fig. S2). Despite the large diversity observed among phylogroup B2 isolates, most contained 20 or more of these genes, suggesting that they likely represent ExPEC (Mahfouz et al. 2018). Additionally, seven of our nine isolates had 20 or more virulence genes, of which three were aquatic plant-associated (R2F1.2, Q02H4 and Q02H13) and four originated from sewage strains (14m2, 4m4, 1m6 and 13m5). The two strains with fewer than 20 virulence genes originated from sewage (15m2), whereas the other represents an environmental strain isolated from algae (Q09A12), which was confirmed to belong to phylogroup G.
In addition, virulence genes among wastewater-specific isolates were explored to determine whether these genes were present in the E. coli strains used in this study. All phylogroup B2 isolates had genes associated with iron acquisition except for the reference strain ED1a (fepA) (Fig. S2). Selected genes typically associated with UPEC strains were present in most of the B2 isolates. None of these isolates had the virulence genes associated with EHEC isolates and the uspC-IS30-flhDC maker associated with wastewater-specific strains was absent among all the B2 isolates [4].
Exploration of the functional properties encoded by the phylogroup B2 genomes also supported the close association of the environmental and sewage isolates examined in the present study. This was particularly evident for genes encoding products involved in adaptation to human-associated niches, such as the UmuDC SOS DNA polymerase, EmrYK and EvgAS efflux systems, the BetTB chlorine transporter and the NhaR transcriptional activator of the proton-sodium antiport system [42]. Regardless of the samples from which they originated, the genomes of all phylogroup B2 isolates encoded umuDC, emrYK and evgAS. All phylogroup B2 isolates also contained the betB and betT genes, with our sewage isolate 15m2 and reference strain ED1a being the only exceptions. Similarly, the nhaR gene was present in all the isolates except for the reference strain F11 (Fig. S2).
Sequence Types and Inferred Gene Functions of Environmental Isolates
GO-FEAT analysis was used to explore the functions encoded by the genes that are unique to each of our algae and plant-associated (R2F1.2, Q02H4, Q02H13 and Q09A12) or sewage genomes (14m2, 4m4, 1m6, 13m5 and 15m2). Here, “unique genes” refer to those present in the genome of a particular isolate relative to those encoded by the genomes of the remaining 55 strains included in our genome dataset (see Table 2). The number of functional categories in the strains ranged from 19 for strain Q02H13 to four for strain 14m2. Analyses based on Fisher’s exact test of the unique genes in all the isolates revealed that isolate 1m6 had genes that were significantly over-represented. These genes had “molecular function” GO terms involved in the catalysis of biochemical reactions (GO:0003824, p = 2.5 × 10⁻⁶) and in binding/interaction with one or more specific sites on another molecule (GO:0005488, p = 1.7 × 10⁻⁵), as well as the “cellular component” GO term involved in cellular anatomical structure (GO:0110165, p = 3.2 × 10⁻⁵).
Overall, the complement of genes unique to each of the nine genomes had only the “carbohydrate metabolism” functional category in common. The GO terms associated with this category also made up a large proportion of the functional capability of the unique genes (Fig. S3). The “stress response” category also appeared to be an important functional capability, although GO terms associated with this category were not included among the genes unique to isolate R1F1.2 obtained from the water hyacinths. However, the plant-associated isolates generally lacked GO terms associated with “virulence, disease and defence”, which were present in three of the sewage isolates (Fig. S3).
Seven of the nine isolates examined represented known sequence types (STs) in one or both of the MLST schemes (1 and 2) proposed by Wirth et al. [44] and Jaureguy et al. [43], respectively. For those reference strains for which this information is lacking, we also determined their STs (see Table 2). Our environmental isolate R2F1.2 and sewage isolate 14m2 were both assigned to ST-95 in Scheme 1 and to ST-1 in Scheme 2. Sewage isolate 13m5 was assigned to ST-131 in Scheme 1 and ST-506 in Scheme 2. Another four of the nine isolates were assigned to STs, with 4m4 representing ST-1193 (scheme 1) and ST-53 (scheme 2), 15m2 representing ST-372 (scheme 1) and ST-455 (scheme 2), and Q09A12 representing ST-657 (scheme 1) and ST-385 (scheme 2). Sewage isolate 1m6 represented ST-1170 in scheme 1 and UNKNOWN in scheme 2. Additionally, the water hyacinth-associated isolates Q02H13 and Q02H4 could not be assigned to known STs using either scheme, indicating that they belong to hitherto undescribed sequence types.
Discussion
Here, we describe for the first time the prevalence and diversity of environmental E. coli from subtropical freshwater catchments in Southern Africa. Application of the widely used Clermont et al. [21] method revealed that populations from the Rietvlei and Roodeplaat dam catchments were dominated by phylogroups B1, B2 and D, where they accounted for 46%, 19% and 18%, respectively, of the isolates obtained from the surface water, sediments, algae, plants and plant debris. Phylogroup B1 typically dominates non-host environments, as strains from this phylogroup are capable of persisting and thriving in water environments [3, 12, 13]. However, the dominance of phylogroup B2 and D associated with aquatic plant and plant debris samples, respectively, was unexpected, as they are usually associated with extraintestinal infections [3, 12, 13]. Phylogroups B2 and D are reportedly rare in non-host environments, where they lose culturability after introduction [46].
Higher than expected numbers of phylogroup B2 isolates were recovered from the aquatic plant-associated samples collected in the two freshwater catchments targeted. This phylogroup constituted 19% of all the environmental isolates. The phylogroup B2 levels of the water- and sediment-associated samples corresponded with levels observed in other freshwater systems [1, 8, 11]. However, 24% of the isolates from the aquatic plant-associated samples represented phylogroup B2 (see Table S3), which is substantially higher than that previously reported for plant-associated E. coli [3]. The reasons underlying this pattern are unclear; the phylogroup B2 strains predominant in plant-associated samples may be able to persist on the surfaces of aquatic plants. These plant-associated phylogroup B2 strains which persisted on the surface of the aquatic plants, especially the water hyacinths, could have been introduced from the human reservoir by passage through sewage treatment into the dams or could represent plant-specific ecotypes [47]. Generally, the detection of E. coli in aquatic environments would indicate a recent faecal contamination event, but the finding that these isolates can persist on the surface of aquatic plants may affect the use of E. coli as an indicator of faecal contamination [12].
A small proportion of the E. coli detected in the present study formed part of phylogroup A, although its distribution varied among samples. This was similar to reports for environmental samples in North America [8, 11] but much lower than other reports for freshwater environments, where phylogroup A is more abundant and even dominant [1, 3, 10, 12, 13, 48]. This was true, irrespective of whether the three-marker triplex PCR method or the four-marker quadruplex PCR method was used for typing strains. A strain is typed as belonging to phylogroup A when it is negative for chuA and TspE4.C2 via the triplex method; however, when the three markers were analysed separately, the strain was typed as unknown when chuA, yjaA and TspE4.C2 were not present [18, 21]. In the present study, 7% and 10% of the environmental isolates were typed as belonging to phylogroup A and to an unassigned phylogroup, respectively, via the quadruplex PCR system. However, even when the triplex PCR system was used, the abundance of phylogroup A among our environmental isolates was lower than that reported in many previous studies [1, 10, 12, 48].
The phylogroup distribution patterns observed among the host-associated samples (sewage) linked to the catchments examined differed markedly from those observed among the environmental samples. Within the collection of sewage samples, the majority of isolates constituted phylogroups B1 (27%) and B2 (38%), with phylogroup D accounting for 18%. The prevalence of phylogroups B2 and D was expected, as they are closely associated with animals/humans and often cause extraintestinal infections [3, 12, 13]. Phylogroups B2 and D are associated with wastewater as well as the intestinal microbiota of humans; however, phylogroup B2 is dominant and has increased persistence in these sample types [1, 15]. Nevertheless, a substantial proportion of the E. coli population in the sewage samples was also represented by phylogroup B1, which is normally associated with environmental samples and might reflect the high abundance of these bacteria in the overall system.
Phylogenetic and population genetic analyses of the concatenated nucleotide sequences of the mutS and uidA genes revealed that the E. coli populations in the Rietvlei dam and Roodeplaat dam catchments were genetically diverse yet highly interconnected. When comparing the mutS and uidA phylogeny with the genome trees, the genome trees were able to distinguish the phylogroups more accurately. Based on the θ statistic Weir and Cockerham [27], which is equivalent to Wright’s FST (1978 as cited in [45]), a θ value of 0.25 and above is suggestive of strong genetic variation, as was the case for our comparisons among phylogroups. Populations displaying little to no differentiation has θ values of 0–0.05, which was the case for our comparisons involving all isolates from the two catchments (θ = 0.012) and phylogroup B2 isolates from the two catchments (θ = 0.031). These values suggest that E. coli isolates within these catchments are highly mobile within these aquatic environments and probably also the human communities in the area. Bayesian analysis suggested that the variation observed in our collection of E. coli isolates was most likely derived from as many as seven different genetic backgrounds or source populations [49]. Based on their ancestry membership, phylogroup B2 and D isolates were more differentiated from one another and from those representing phylogroups A, B1 and U. This is consistent with the higher recombination rates previously observed between members of phylogroups A and B1 than between these groups and phylogroups B2 and D or between the latter two groups [50]. This interconnectedness of phylogroups A and B1 is also consistent with the notion that they represent recently diverged sister lineages [6, 50]. In contrast, the strong differentiation between phylogroups B2 and D is consistent with a much earlier origin during E. coli evolution [6]. Therefore, despite varying levels of gene flow being maintained among phylogroups, their differentiation (particularly among phylogroups B2, D and A + B1) likely forms the basis of niche adaptation [50].
Because of the unexpected prevalence of phylogroup B2 among environmental samples, particularly those associated with algae and plants, we subjected several strains to various genomic analyses. Phylogenetic analyses of datasets containing conserved genes included in the core genome and more variable genes included in the non-core genome of E. coli and its close relatives grouped our B2 isolates with known members of this phylogroup. Also, the maximum likelihood phylogeny inferred from the 1537-core-gene dataset robustly grouped all E. coli into a single clade with each of the phylogroups clearly separated from one another and from E. coli Clade I, with the four Shigella species (i.e. S. flexneri, S. dysenteriae, S. boydii and S. sonnei, all regarded as being conspecific to E. coli) nested among them [24, 51]. Although similar groupings have been reported in previous studies, some did not recover all of the phylogroups as monophyletic [50, 52]. Additionally, in the study by Meier-Kolthoff and colleagues [52], Shigella did not group according to species but was scattered among other E. coli strains. Nevertheless, both the core and non-core gene trees emphasized the phylogenetic cohesion among members of phylogroup B2, with our environmental and sewage isolates clustering with known members of the phylogroup, independent of niche or geographic origin. This suggests that these E. coli isolates are highly mobile within these aquatic environments. Phylogroup B2 is usually human associated and based on this observation our isolates linked to environmental sources could be part of the E.coli population circulating in the community inhabiting this larger catchment area.
Analysis of the putative functions encoded by the respective E. coli genomes suggested that our environmental and sewage-associated phylogroup B2 isolates likely share adaptive and clinical properties with known members of the phylogroup. All but one of our phylogroup B2 isolates encoded 20 or more of the 58 known virulence genes, suggesting that they might represent ExPEC [41]. Indeed, phylogroup B2 typically includes ExPEC isolates and is well adapted for host colonization to cause extraintestinal infections [6]. The presence of several virulence factors associated with UPEC [4] confirmed this finding as the UPEC strains are considered to be a specific disease associated group belonging to ExPEC [53]. Furthermore, genome-based comparisons against international databases using the Center for Genomic Epidemiology (CGE) revealed that most of our phylogroup B2 isolates represent known STs in both commonly used MLST schemes for E. coli [43, 44]. For example, our isolates were diagnosed as ST-95, ST-1193, ST-372, ST-1170 and ST-131 according to the Wirth et al. [44] scheme. ST-95 is usually associated with neonatal meningitis and contains the UPEC PAI marker malX [54], as well as with cell attachment and invasion in human and rat brain cell lines [54]. Additionally, certain ST-131 and ST-1193 strains have been reported to be multidrug resistant [14], whereas ST-372 is associated with dogs and causes infrequent human infections [55]. However, we analysed only eight phylogroup B2 isolates, and it would be interesting to determine whether any one of the 46 remaining isolates available from the current study represent STs implicated in diseases such as those reported by Vignaroli et al. [56] of E. coli from extraintestinal disease. Additionally, it would be interesting to determine if and how the novel STs detected are implicated in disease. Overall, there was no distinction among our B2 isolates in terms of their geographic origin or source, again emphasizing that they form part of the larger population of phylogroup B2 isolates.
The cohesiveness among phylogroup B2 isolates, including our eight isolates (isolate Q09A12 was not included in this analysis as it was assigned to phylogroup G), was also supported by numerous shared sets of genes and processes encoded by these bacteria. For example, their accessory genomes contain genes previously associated with colonization of the gut, as well as genes needed for stress responses [42]. Based on the unique genes identified in the sequenced isolates, a subset of virulence, disease and defense genes was found exclusively in the sewage-derived isolates, but absent in the environmental isolates. Defense genes play a crucial role in helping bacteria evade the host immune system. Their absence from the non-core genomes of environmental strains may suggest a reduced capacity for gut colonization. In contrast, most Phylogroup B2 isolates, regardless of whether they originated from sewage or aquatic environments, contained a variety of virulence genes, particularly those associated with ExPEC. While these genes may indicate pathogenic potential, Zhi and colleagues noted that such genes might also provide advantages for extraintestinal survival [4]. The persistence of E. coli Phylogroup B2 strains in the environment, particularly those associated with aquatic plants, raises concerns about the reliability of E. coli as an indicator of potential health risks. However, the virulence of these environmental isolates warrants further validation.
Conclusions
A higher than expected proportion of phylogroup B2 was detected in the E. coli population from the peri-urban subtropical catchments examined, although phylogroup B1 was predominant. Phylogroup B2 showed a distinct grouping based on both core and non-core genes. Genome analyses suggested that our isolates could be associated with human sources. Two of our sequenced isolates were related to multidrug resistant strains and two to strains attaching to human and rat brain cell lines. Seven of our isolates were also denoted as ExPEC and UPEC. Association of many of our B2 strains with water plants and algae indicate persistence in the catchment, with the risk of circulating back into the human population and manifesting disease. Furthermore, the occurrence of isolates that lack unique virulence, disease or defence genes, and isolates of unknown sequence type such as those associated water hyacinth, raise the possibility of adaptation to aquatic environments and population maintenance on plant surfaces. These findings highlight the complexities of using E. coli as an indicator organism, particularly in environmental systems influenced by treated wastewater inputs. Its presence in freshwater catchments does not necessarily signify contamination, underscoring the need for more nuanced interpretations and further investigations when E. coli is detected in such contexts.
Supplementary Information
Below is the link to the electronic supplementary material.
Acknowledgements
We thank the University of Pretoria, for access to computing infrastructure.
Author Contributions
Tarren Seale participated in writing—original draft, laboratory experimentation, data curation, formal analysis and interpretation of findings. Volker S. Brözel participated in conceptualization, supervision, interpretation of findings and writing—review and editing. Sarah C. Potgieter participated in writing—review and editing, laboratory experimentation, data curation, formal analysis and interpretation of findings. Oliver Rupp and Jochen Blom contributed methodology and writing—review and editing. Emma steenkamp participated in conceptualization, supervision, interpretation of findings and writing—review and editing. Stephanus N. Venter participated in conceptualization, resources, supervision, interpretation of findings and writing—review and editing.
Funding
Open access funding provided by University of Pretoria. This research was funded by the South African Water Research Commission for funding – project K5/1976.
Data Availability
The datasets presented in this study can be found in online repositories as follows: https://www.ebi.ac.uk/ena/, PRJEB35465; https://www.ncbi.nlm.nih.gov/, PRJNA1139092.
Declarations
Conflict of interest
The authors would like to confirm that there are no known conflicts of interest associated with this publication.
Ethical Approval
Not applicable.
Consent to Participate
Not applicable.
Footnotes
Publisher's Note
Springer Nature remains neutral with regard to jurisdictional claims in published maps and institutional affiliations.
Contributor Information
Tarren Seale, Email: tarren.seale@up.ac.za.
Stephanus N. Venter, Email: fanus.venter@up.ac.za
References
- 1.Berthe T, Ratajczak M, Clermont O, Denamur E, Petit F (2013) Evidence for coexistence of distinct Escherichia coli populations in various aquatic environments and their survival in estuary water. Appl Environ Microbiol 79(15):4684–4693. 10.1128/AEM.00698-13 [DOI] [PMC free article] [PubMed] [Google Scholar]
- 2.Hamelin K, Bruant G, El-Shaarawi A, Hill S, Edge TA, Fairbrother J, Harel J, Maynard C, Masson L, Brousseau R (2007) Occurrence of virulence and antimicrobial resistance genes in Escherichia coli isolates from different aquatic ecosystems within the St. Clair River and Detroit River areas. Appl Environ Microbiol 73(2):477–484. 10.1128/AEM.01445-06 [DOI] [PMC free article] [PubMed] [Google Scholar]
- 3.Méric G, Kemsley EK, Falush D, Saggers EJ, Lucchini S (2013) Phylogenetic distribution of traits associated with plant colonization in Escherichia coli. Environ Microbiol 15(2):487–501. 10.1111/j.1462-2920.2012.02852.x [DOI] [PubMed] [Google Scholar]
- 4.Zhi S, Banting G, Stothard P, Ashbolt NJ, Checkley S, Meyer K, Otto S, Neumann NF (2019) Evidence for the evolution, clonal expansion and global dissemination of water treatment-resistant naturalized strains of Escherichia coli in wastewater. Water Res 156:208–222. 10.1016/j.watres.2019.03.024 [DOI] [PubMed] [Google Scholar]
- 5.Clermont O, Dixit OVA, Vangchhia B, Condamine B, Dion S, Bridier-Nahmias A, Denamur E, Gordon D (2019) Characterization and rapid identification of phylogroup G in Escherichia coli, a lineage with high virulence and antibiotic resistance potential. Environ Microbiol 21(8):3107–3117. 10.1111/1462-2920.14713 [DOI] [PubMed] [Google Scholar]
- 6.Leimbach A, Hacker J, Dobrindt U (2013) E. coli as an all-rounder: the thin line between commensalism and pathogenicity. Curr Top Microbiol Immunol 358:3–32. 10.1007/82_2012_303 [DOI] [PubMed] [Google Scholar]
- 7.Denamur E, Clermont O, Bonacorsi S, Gordon D (2021) The population genetics of pathogenic Escherichia coli. Nat Rev Microbiol 19(1):37–54. 10.1038/s41579-020-0416-x [DOI] [PubMed] [Google Scholar]
- 8.Cho S, Hiott LM, Barrett JB, McMillan EA, House SL, Humayoun SB, Adams ES, Jackson CR, Frye JG (2018) Prevalence and characterization of Escherichia coli isolated from the Upper Oconee Watershed in Northeast Georgia. PLoS ONE. 10.1371/journal.pone.0197005 [DOI] [PMC free article] [PubMed] [Google Scholar]
- 9.Dusek N, Hewitt AJ, Schmidt KN, Bergholz PW (2018) Landscape-scale factors affecting the prevalence of Escherichia coli in surface soil include land cover type, edge interactions, and soil pH. Appl Environ Microbiol 84(10):e02714-02717 [DOI] [PMC free article] [PubMed] [Google Scholar]
- 10.Jang J, Doris YWD, Lee A, Tatsuya U, Sadowsky MJ, Hor-Gil H (2014) Seasonal and genotypic changes in Escherichia coli phylogenetic groups in the Yeongsan River Basin of South Korea. PLoS ONE. 10.1371/journal.pone.0100585 [DOI] [PMC free article] [PubMed] [Google Scholar]
- 11.Johnson JR, Johnston BD, Delavari P, Thuras P, Clabots C, Sadowsky MJ (2017) Phylogenetic backgrounds and virulence-associated traits of Escherichia coli isolates from surface waters and diverse animals in Minnesota and Wisconsin. Appl Environ Microbiol 83(24):e01329 [DOI] [PMC free article] [PubMed] [Google Scholar]
- 12.Orsi RH, Stoppe NC, Sato MI, Ottoboni LM (2007) Identification of Escherichia coli from groups A, B1, B2 and D in drinking water in Brazil. J Water Health 5(2):323–327. 10.2166/wh.2007.028 [DOI] [PubMed] [Google Scholar]
- 13.Walk ST, Alm EW, Calhoun LM, Mladonicky JM, Whittam TS (2007) Genetic diversity and population structure of Escherichia coli isolated from freshwater beaches. Environ Microbiol 9(9):2274–2288. 10.1111/j.1462-2920.2007.01341.x [DOI] [PubMed] [Google Scholar]
- 14.Pitout JDD, Peirano G, Chen L, Devinney R, Matsumura Y (2022) Escherichia coli ST1193: following in the footsteps of E. coli ST131. Antimicrob Agents Chemother 66(7):e0051122 [DOI] [PMC free article] [PubMed] [Google Scholar]
- 15.Nowrouzian FL, Adlerberth I, Wold AE (2006) Enhanced persistence in the colonic microbiota of Escherichia coli strains belonging to phylogenetic group B2: role of virulence factors and adherence to colonic cells. Microbes Infect 8(3):834–840. 10.1016/j.micinf.2005.10.011 [DOI] [PubMed] [Google Scholar]
- 16.Lamprecht C, Romanis M, Huisamen N, Carinus A, Schoeman N, Sigge GO, Britz TJ (2014) Escherichia coli with virulence factors and multidrug resistance in the Plankenburg River. S Afr J Sci. 10.1590/sajs.2014/20130347 [Google Scholar]
- 17.Byappanahalli M, R F (2004) Indigenous soil bacteria and low moisture may limit but allow faecal bacteria to multiply and become a minor population in tropical soils. Water Science and Technology 50(1):27–32 [PubMed]
- 18.Gordon DM, Clermont O, Tolley H, Denamur E (2008) Assigning Escherichia coli strains to phylogenetic groups: multi-locus sequence typing versus the PCR triplex method. Environ Microbiol 10(10):2484–2496. 10.1111/j.1462-2920.2008.01669.x [DOI] [PubMed] [Google Scholar]
- 19.Du Plessis EM, Govender S, Pillay B, Korsten L (2017) Exploratory study into the microbiological quality of spinach and cabbage purchased from street vendors and retailers in Johannesburg, South Africa. J Food Prot 80(10):1726–1733. 10.4315/0362-028X.JFP-16-540 [DOI] [PubMed] [Google Scholar]
- 20.Sartory DP, Watkins J (1998) Conventional culture for water quality assessment: is there a future? J Appl Microbiol 85(Suppl 1):225S-233S. 10.1111/j.1365-2672.1998.tb05302.x [DOI] [PubMed] [Google Scholar]
- 21.Clermont O, Bonacorsi S, Bingen E (2000) Rapid and simple determination of the Escherichia coli phylogenetic group. Appl Environ Microbiol 66(10):4555–4558 [DOI] [PMC free article] [PubMed] [Google Scholar]
- 22.Walk ST, Alm EW, Gordon DM, Ram JL, Toranzos GA, Tiedje JM, Whittam TS (2009) Cryptic lineages of the genus Escherichia. Appl Environ Microbiol 75(20):6534–6544. 10.1128/AEM.01262-09 [DOI] [PMC free article] [PubMed] [Google Scholar]
- 23.Hall TA (1999) BioEdit a user-friendly biological sequence alignment editor and analysis program for Windows 95/98/NT. Nucleic Acids Symp Ser 41:95–98 [Google Scholar]
- 24.Dif G, Djemouai N, Bouras N, Zitouni A (2025) In-depth genome-based analysis of Shigella spp. and Escherichia spp.: resolving ambiguities and unveiling phylogenetic relationships. Curr Microbiol 82(4):170. 10.1007/s00284-025-04158-5 [DOI] [PubMed] [Google Scholar]
- 25.Guindon S, Dufayard JF, Lefort V, Anisimova M, Hordijk W, Gascuel O (2010) New algorithms and methods to estimate maximum-likelihood phylogenies: assessing the performance of PhyML 3.0. Syst Biol 59(3):307–321. 10.1093/sysbio/syq010 [DOI] [PubMed] [Google Scholar]
- 26.Posada D (2008) jModelTest: phylogenetic model averaging. Mol Biol Evol 25(7):1253–1256. 10.1093/molbev/msn083 [DOI] [PubMed] [Google Scholar]
- 27.Weir BS, Cockerham CC (1984) Estimating F-statistics for the analysis of population structure. Evolution 38:1358–1370 [DOI] [PubMed] [Google Scholar]
- 28.Agapow PM, Burt A (2005) Indices of multilocus linkage disequilibrium. Mol Ecol Notes 1(1–2):101–102. 10.1046/j.1471-8278.2000.00014.x [Google Scholar]
- 29.Wang J (2017) The computer program structure for assigning individuals to populations: easy to use but easier to misuse. Mol Ecol Resour 17(5):981–990. 10.1111/1755-0998.12650 [DOI] [PubMed] [Google Scholar]
- 30.Kopelman NM, Mayzel J, Jakobsson M, Rosenberg NA, Mayrose I (2015) Clumpak: a program for identifying clustering modes and packaging population structure inferences across K. Mol Ecol Resour 15(5):1179–1191. 10.1111/1755-0998.12387 [DOI] [PMC free article] [PubMed] [Google Scholar]
- 31.Cleenwerck I, Vandemeulebroecke K, Janssens D, Swings J (2002) Re-examination of the genus Acetobacter, with descriptions of Acetobacter cerevisiae sp. nov. and Acetobacter malorum sp. nov. Int J Syst Evolut Microbiol 52(5):1551–1558. 10.1099/00207713-52-5-1603 [DOI] [PubMed] [Google Scholar]
- 32.Baez-Ortega A, Lorenzo-Diaz F, Hernandez M, Gonzalez-Vila CI, Roda-Garcia JL, Colebrook M, Flores C (2015) Iongap: integrative bacterial genome analysis for Ion Torrent sequence data. Bioinformatics 31(17):2870–2873. 10.1093/bioinformatics/btv283 [DOI] [PubMed] [Google Scholar]
- 33.Meyer F, Goesmann A, McHardy AC, Bartels D, Bekel T, Clausen J, Kalinowski J, Linke B, Rupp O, Giegerich R, Puhler A (2003) GenDB - an open source genome annotation system for prokaryote genomes. Nucleic Acids Res 31(8):2187–2195. 10.1093/nar/gkg312 [DOI] [PMC free article] [PubMed] [Google Scholar]
- 34.Blom J, Kreis J, Spanig S, Juhre T, Bertelli C, Ernst C, Goesmann A (2016) EDGAR 2.0: an enhanced software platform for comparative gene content analyses. Nucleic Acids Res 44(W1):W22-28. 10.1093/nar/gkw255 [DOI] [PMC free article] [PubMed] [Google Scholar]
- 35.Edgar RC (2004) Muscle: a multiple sequence alignment method with reduced time and space complexity. BMC Bioinformatics 5:113. 10.1186/1471-2105-5-113 [DOI] [PMC free article] [PubMed] [Google Scholar]
- 36.Darriba D, Taboada GL, Doallo R, Posada D (2011) ProtTest 3: fast selection of best-fit models of protein evolution. Bioinformatics 27(8):1164–1165. 10.1093/bioinformatics/btr088 [DOI] [PMC free article] [PubMed] [Google Scholar]
- 37.Stamatakis A (2006) RAxML-VI-HPC: maximum likelihood-based phylogenetic analyses with thousands of taxa and mixed models. Bioinformatics 22(21):2688–2690. 10.1093/bioinformatics/btl446 [DOI] [PubMed] [Google Scholar]
- 38.Hammer Ø, Harper DAT, Ryan PD (2001) Past: paleontological statistics software package for education and data analysis. Palaeontol Electron 4(1):9 [Google Scholar]
- 39.Araujo FA, Barh D, Silva A, Guimaraes L, Ramos RTJ (2018) Go feat: a rapid web-based functional annotation tool for genomic and transcriptomic data. Sci Rep 8(1):1794. 10.1038/s41598-018-20211-9 [DOI] [PMC free article] [PubMed] [Google Scholar]
- 40.Gotz S, Garcia-Gomez JM, Terol J, Williams TD, Nagaraj SH, Nueda MJ, Robles M, Talon M, Dopazo J, Conesa A (2008) High-throughput functional annotation and data mining with the Blast2GO suite. Nucleic Acids Res 36(10):3420–3435. 10.1093/nar/gkn176 [DOI] [PMC free article] [PubMed] [Google Scholar]
- 41.Mahfouz N, Caucci S, Achatz E, Semmler T, Guenther S, Berendonk TU, Schroeder M (2018) High genomic diversity of multi-drug resistant wastewater Escherichia coli. Sci Rep. 10.1038/s41598-018-27292-6 [DOI] [PMC free article] [PubMed] [Google Scholar]
- 42.Oh S, Buddenborg S, Yoder-Himes DR, Tiedje JM, Konstantinidis KT (2012) Genomic diversity of Escherichia isolates from diverse habitats. PLoS ONE 7(10):e47005. 10.1371/journal.pone.0047005 [DOI] [PMC free article] [PubMed] [Google Scholar]
- 43.Jaureguy F, Landraud L, Passet V, Diancourt L, Frapy E, Guigon G, Carbonnelle E, Lortholary O, Clermont O, Denamur E, Picard B, Nassif X, Brisse S (2008) Phylogenetic and genomic diversity of human bacteremic Escherichia coli strains. BMC Genomics 9:560. 10.1186/1471-2164-9-560 [DOI] [PMC free article] [PubMed] [Google Scholar]
- 44.Wirth T, Falush D, Lan R, Colles F, Mensa P, Wieler LH, Karch H, Reeves PR, Maiden MC, Ochman H, Achtman M (2006) Sex and virulence in Escherichia coli: an evolutionary perspective. Mol Microbiol 60(5):1136–1151. 10.1111/j.1365-2958.2006.05172.x [DOI] [PMC free article] [PubMed] [Google Scholar]
- 45.Wang J (2012) On the measurements of genetic differentiation among populations. Genet Res 94(5):275–289. 10.1017/S0016672312000481 [DOI] [PubMed] [Google Scholar]
- 46.Touchon M, Perrin A, de Sousa JAM, Vangchhia B, Burn S, O’Brien CL, Denamur E, Gordon D, Rocha EP (2020) Phylogenetic background and habitat drive the genetic diversification of Escherichia coli. PLoS Genet 16(6):e1008866. 10.1371/journal.pgen.1008866 [DOI] [PMC free article] [PubMed] [Google Scholar]
- 47.Yu D, Banting G, Neumann NF (2021) A review of the taxonomy, genetics, and biology of the genus Escherichia and the type species Escherichia coli. Can J Microbiol 67(8):553–571. 10.1139/cjm-2020-0508 [DOI] [PubMed] [Google Scholar]
- 48.Orsi RH, Stoppe NC, Sato MI, Gomes TA, Prado PI, Manfio GP, Ottoboni LM (2007) Genetic variability and pathogenicity potential of Escherichia coli isolated from recreational water reservoirs. Res Microbiol 158(5):420–427. 10.1016/j.resmic.2007.02.009 [DOI] [PubMed] [Google Scholar]
- 49.Pritchard JK, Stephens M, Donnelly P (2000) Inference of population structure using multilocus genotype data. Genetics 155(2):945–959 [DOI] [PMC free article] [PubMed] [Google Scholar]
- 50.Didelot X, Méric G, Falush D, Darling AE (2012) Impact of homologous and non-homologous recombination in the genomic evolution of Escherichia coli. BMC Genomics 13:256 [DOI] [PMC free article] [PubMed] [Google Scholar]
- 51.Lukjancenko O, Wassenaar TM, Ussery DW (2010) Comparison of 61 sequenced Escherichia coli genomes. Microb Ecol 60(4):708–720. 10.1007/s00248-010-9717-3 [DOI] [PMC free article] [PubMed] [Google Scholar]
- 52.Meier-Kolthoff JP, Hahnke RL, Petersen J, Scheuner C, Michael V, Fiebig A, Rohde C, Rohde M, Fartmann B, Goodwin LA, Chertkov O, Reddy TBK, Pati A, Ivanova NN, Markowitz V, Kyrpides NC, Woyke T, Göker M, Klenk H-P (2014) Complete genome sequence of DSM 30083T, the type strain (U5/41T)of Escherichia coli, and a proposal for delineating subspecies in microbial taxonomy. Stand Genomic Sci 9:2 [DOI] [PMC free article] [PubMed] [Google Scholar]
- 53.Dale AP, Woodford N (2015) Extra-intestinal pathogenic Escherichia coli (ExPEC): disease, carriage and clones. J Infect 71(6):615–626. 10.1016/j.jinf.2015.09.009 [DOI] [PubMed] [Google Scholar]
- 54.Alkeskas A, Ogrodzki P, Saad M, Masood N, Rhoma NR, Moore K, Farbos A, Paszkiewicz K, Forsythe S (2015) The molecular characterisation of Escherichia coli K1 isolated from neonatal nasogastric feeding tubes. BMC Infect Dis 15:449. 10.1186/s12879-015-1210-7 [DOI] [PMC free article] [PubMed] [Google Scholar]
- 55.LeCuyer TE, Byrne BA, Daniels JB, Hammac GK, Miller CB, Besser TE, Davis MA (2018) Population structure and antimicrobial resistance of canine uropathogenic Escherichia coli. J Clin Microbiol 56:e00788. 10.1128/JCM [DOI] [PMC free article] [PubMed] [Google Scholar]
- 56.Vignaroli C, Luna GM, Rinaldi C, Di Cesare A, Danovaro R, Biavasco F (2012) New sequence types and multidrug resistance among pathogenic Escherichia coli isolates from coastal marine sediments. Appl Environ Microbiol 78(11):3916–3922. 10.1128/AEM.07820-11 [DOI] [PMC free article] [PubMed] [Google Scholar]
Associated Data
This section collects any data citations, data availability statements, or supplementary materials included in this article.
Supplementary Materials
Data Availability Statement
The datasets presented in this study can be found in online repositories as follows: https://www.ebi.ac.uk/ena/, PRJEB35465; https://www.ncbi.nlm.nih.gov/, PRJNA1139092.