

Abstract
Cancer-associated cachexia (CAC) is a prevalent condition that accelerates cancer progression and heightens treatment-related adverse effects in patients by affecting multiple organ systems. Despite the profound impact of CAC on clinical management and treatment outcomes of patients with cancer, the current understanding of mechanisms associated with the condition, as well as the tools necessary for early diagnosis, are limited. Currently, the clinical diagnosis of CAC relies on weight change–based assessments, which have limited sensitivity and cannot identify patients at risk for CAC. In this context, noninvasive imaging-based biomarkers, such as the composition and properties of adipose and muscle tissues, may allow for diagnosis of CAC before substantial weight loss occurs. Such early detection can potentially enable more timely and effective interventions. Furthermore, imaging allows for quantitative assessment of CAC, enabling monitoring of prognosis and treatment response. This article reviews current applications and future developments of imaging techniques, particularly those employed in current clinical radiology, that can reveal diagnostic information and facilitate early detection of CAC and quantitative evaluation of associated metabolic alterations.
Keywords: Molecular Imaging, Cancer, MRI, PET/CT, Ultrasound, Muscular, Oncology
© RSNA, 2025
Keywords: Molecular Imaging, Cancer, MRI, PET/CT, Ultrasound, Muscular, Oncology
Summary
Early detection and comprehensive assessment of cancer-associated cachexia using diverse imaging modalities, such as dual-energy x-ray absorptiometry, US, CT, MRI, and PET/CT, combined with artificial intelligence–based analysis can improve patient outcomes by enabling timely interventions.
Essentials
■ Diverse imaging modalities—dual-energy x-ray absorptiometry, CT, US, MRI, and PET/CT—offer unique advantages for assessing muscle and adipose tissue changes in cancer-associated cachexia.
■ MRI and PET are expected to play increasingly important roles in early detection of cachexia given their capabilities to help detect and quantify metabolic changes that precede measurable weight loss during the development and progression of the condition.
■ Ongoing research should focus on improving imaging techniques that target imaging biomarkers of cancer-associated cachexia and using artificial intelligence to improve diagnostic accuracy and patient outcomes.
Introduction
Cancer-associated cachexia (CAC) is a multifactorial syndrome characterized by sustained muscle loss, with or without concurrent fat loss, that cannot be fully reversed by nutrition alone (1–3). It accelerates disease progression, exacerbates treatment-related adverse effects, and leads to poor clinical outcomes and reduced survival rates in patients with cancer (4). Approximately 20%–70% of patients with cancer are affected by CAC, with 10%–20% of cancer-related deaths directly attributed to CAC (5). The prevalence of CAC varies across different cancer types, ranging from 12% to 67% (2); incidences are relatively lower in prostate cancer (14%) and breast cancer (21%) (6) but higher in pancreatic cancer (67%), gastroesophageal cancer (60%), and colorectal cancer (48%) (6,7). CAC can develop as early as the initial stages of cancer, but its exact mechanisms remain unclear (2).
Existing evidence indicates that CAC is driven by tumor-derived substances, such as inflammatory cytokines, hormones, and growth factors, which disrupt normal metabolism and adversely affect multiple organ systems (2). These substances trigger a series of biologic responses, including inflammation, appetite suppression, and alterations in muscle and fat metabolism, involving signaling pathways such as JAK/STAT (Janus kinase/signal transducer and activator of transcription), SMAD (small mothers against decapentaplegic), MAPK (mitogen-activated protein kinases), PI3K/AKT/mTOR (phosphoinositide 3-kinases/protein kinase B/mammalian target of rapamycin), and NF-κB (nuclear factor kappa-light-chain-enhancer of activated B cells) (2,8). Consequently, both muscle and fat mass decrease substantially in patients with CAC (9,10). Beyond its detrimental impact on physical function and quality of life, CAC also compromises the efficacy of anticancer therapies, while exacerbating their toxic adverse effects (8). Therefore, CAC is now recognized as a critical contributor to cancer progression and mortality.
Clinically, CAC can be staged into three phases: (a) precachexia, characterized by weight loss of 5% or less, along with anorexia and metabolic changes; (b) cachexia, defined by weight loss greater than 5% within 6 months, weight loss greater than 2% in individuals with body mass index (BMI) (calculated as weight in kilograms divided by height in meters squared) less than 20 kg/m2, or weight loss greater than 2% with sarcopenia; and (c) refractory cachexia, marked by continuous tumor progression, no response to antitumor therapy, active catabolism, and irreversible continuous weight loss (1). In the cachexia phase, sarcopenia can be determined based on the appendicular skeletal muscle index (SMI) measured by dual-energy x-ray absorptiometry (DXA) (cutoff: <7.00 kg/m2 for men; <5.50 kg/m2 for women) (11), or by the lumbar SMI measured using CT imaging (cutoff: <52.40 cm2/m2 for men; <38.50 cm2/m2 for women) (12). It is important to note that there are numerous cutoff values for diagnosing sarcopenia, which vary depending on the measurement modality, sex, and consensus (13,14). In the refractory cachexia phase, patients typically exhibit low performance status (scores 3 or 4) based on the World Health Organization criteria, with a prognosis of less than 3 months of survival (2). Currently, there are no approved drugs to treat CAC (8). Adequate nutritional support remains the primary intervention strategy for this condition (15), though its effectiveness hinges on the early diagnosis of CAC. Therefore, detecting CAC or predicting the risk for early intervention is crucial for improving patient survival. In current clinical management of patients with cancer, weight loss and BMI alterations are the main indicators for diagnosing CAC (1). However, these metrics are not specific to disease biology and may be confounded by other abnormal physiologic and metabolic conditions of patients, such as obesity, edema, and pleural or peritoneal effusion. To overcome these limitations and enable a more precise assessment, imaging modalities have become essential tools in diagnosing and evaluating CAC.
With the increasing use of imaging in cancer management and advances in imaging technology, various clinically available cancer imaging modalities, including DXA, US, CT, MRI, and PET, have been investigated for early detection and intervention in CAC (Fig 1). These imaging techniques play a crucial role in improving the accuracy of CAC diagnosis and guiding timely interventions. Among these, CT stands out for its ability to accurately estimate the volume of fat and skeletal muscle, calculate the SMI, and depict the presence of sarcopenia, thereby providing a fairly comprehensive assessment of whether a patient is in a cachectic state (16). The development of biomarker-based imaging methods is motivated by the potential to enable early and precise diagnosis before substantial weight loss occurs (17). For instance, previous studies have consistently demonstrated that low SMI and low skeletal muscle attenuation in patients with cancer, as determined by using imaging-based body composition analysis, are strongly correlated with systemic inflammatory markers, including C-reactive protein, albumin, modified Glasgow prognostic score, and the neutrophil to lymphocyte ratio (18). These findings are pivotal for defining and managing CAC (18). Furthermore, sarcopenia, characterized by a reduced SMI, has been shown to complement these inflammatory markers in the pathogenesis of CAC, thereby providing additional prognostic value (19). Therefore, incorporating these parameters from the imaging-based body composition analysis into routine clinical practice offers a promising approach to refine the characterization, management, and prognosis of CAC in patients with cancer. This review introduces the emerging roles of various clinical imaging modalities in the diagnosis and evaluation of CAC, providing examples that highlight their capabilities and potential. It also discusses the current limitations of imaging technologies and methods in their applications, as well as approaches to overcome these challenges. Additionally, future research opportunities aimed at advancing imaging-based approaches for the earlier and more accurate diagnosis and characterization of CAC are outlined.
Figure 1:

Diagram illustrates the use of different imaging modalities to assess cancer-associated cachexia. AI = artificial intelligence, CRP = C-reactive protein, DXA = dual-energy x-ray absorptiometry.
Imaging of Skeletal Muscle with DXA
DXA is a widely used imaging technique that differentiates various tissue types based on their attenuation of x-ray photons at two distinct energy levels (20). This capability allows DXA to assess body composition by producing image contrast based on differences in the densities of muscle, fat, and bone (20). While DXA is valuable for evaluating body composition and bone health, it is limited in visualizing internal adipose and muscular tissues compared with three-dimensional imaging modalities like CT and MRI.
The key advantages of DXA include its low cost, portability, and accessibility, making it especially useful in resource-limited settings. With a short examination time (typically 3 to 8 minutes), DXA provides a rapid assessment of body composition (21). DXA produces detailed images of various anatomic regions, including the head, trunk, upper and lower limbs, gynoid, and abdominal areas (22). These images categorize tissues into fat, lean soft tissue, and bone mineral content (Fig 2) (23), providing quantitative metrics such as the whole-body lean mass index and appendicular lean mass index, as recommended by the International Society for Clinical Densitometry (24). In the context of CAC, radiologists using DXA can assess both systemic and regional distributions of skeletal muscle and adipose tissue (25), enabling the evaluation of sarcopenia and cachexia, particularly in patients with muscle loss. Moreover, the low radiation exposure (<1 mrem) at DXA scans makes it especially suitable for more frail patients.
Figure 2:
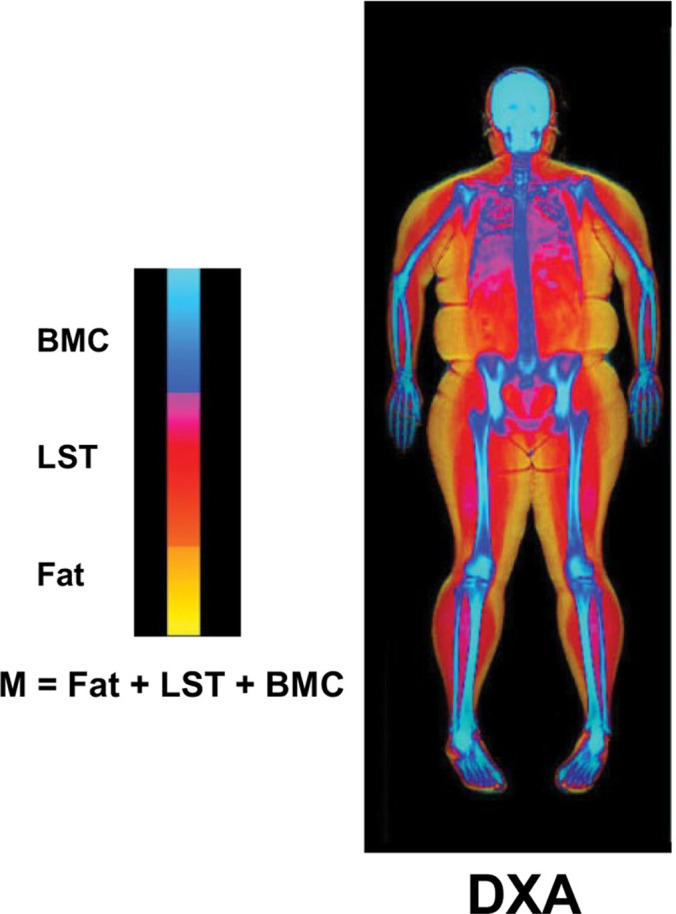
Body composition components measured with DXA. Body mass (M) is the sum of fat, LST, and BMC. BMC = bone mineral content, DXA = dual-energy x-ray absorptiometry, LST = lean soft tissue. (Adapted and reprinted, under a CC BY 3.0 license, from reference 23.)
Despite its advantages, DXA has several limitations. It is less effective at discriminating specific muscle tissues, particularly in the thoracic and abdominal regions (26). Additionally, variability in patients’ height and weight can affect scan accuracy, as some patients may require multiple scans if they do not fit entirely within the scanning field (27). Furthermore, DXA does not provide information on metabolic changes associated with CAC, nor can it depict structural alterations in muscle and adipose tissues, limiting its application in the early diagnosis of cachexia.
In summary, DXA serves as a cost-effective and accessible option for identifying patients with CAC with substantial muscle and adipose tissue loss. However, it lacks utility in the early diagnosis of CAC due to its inability to depict metabolic changes and structural alterations in muscle and adipose tissue.
Measurement of Muscle Properties with US
US imaging is a low-cost, portable modality widely available in most clinical settings, including nonradiology specialties. Its durability for bedside use makes it particularly beneficial for critically ill patients (28–30). Unlike high-energy x-ray, US uses low-energy, high-frequency sound waves that are sensitive to soft tissues, such as muscles and internal organs, to generate tissue contrast and assess tissue properties. Given its widespread availability and robustness in implementation, there is a growing trend to use US imaging for body composition analysis (Fig 3A) (31,32).
Figure 3:
![(A) Axial US imaging shows echogenicity measurement; yellow circle, region of interest; white arrowhead, the mean echogenicity value from the histogram; red rectangle, a schematic representation of the transducer’s position. (Reprinted, under a CC BY 4.0 license, from reference 32.) (B) Exemplary US image of a cross-section of the quadriceps. All quadriceps muscles (vastus medialis [VM], rectus femoris [RF], vastus lateralis [VL], vastus intermedius [VI]) were captured in a single motion. The femur (F) is also discernible within the thigh. (Adapted and reprinted, under a CCBY NC ND 4.0 license, from reference 39.)](https://www.ncbi.nlm.nih.gov/core/lw/2.0/html/tileshop_pmc/tileshop_pmc_inline.html?title=Click%20on%20image%20to%20zoom&p=PMC3&id=12304533_rycan.240291.fig3.jpg)
(A) Axial US imaging shows echogenicity measurement; yellow circle, region of interest; white arrowhead, the mean echogenicity value from the histogram; red rectangle, a schematic representation of the transducer’s position. (Reprinted, under a CC BY 4.0 license, from reference 32.) (B) Exemplary US image of a cross-section of the quadriceps. All quadriceps muscles (vastus medialis [VM], rectus femoris [RF], vastus lateralis [VL], vastus intermedius [VI]) were captured in a single motion. The femur (F) is also discernible within the thigh. (Adapted and reprinted, under a CCBY NC ND 4.0 license, from reference 39.)
Early changes in muscle and body composition often precede the clinical signs of cachexia, such as substantial weight loss. These changes can serve as crucial biomarkers for identifying the risk of CAC before it becomes clinically apparent.
By measuring muscle thickness, cross-sectional area, stiffness, and echogenicity (33,34), radiologists using US can detect these early changes in muscle properties, often before patients experience weight loss. This ability to identify muscle wasting before the onset of noticeable weight loss makes US a valuable tool in the early diagnosis and management of CAC. The absence of ionizing radiation and enhanced portability of US imaging is particularly advantageous compared with DXA and CT (35,36). Unlike MRI and nuclear imaging, which require dedicated facilities and personnel with specialized training, US imaging is readily accessible in health care settings beyond radiology departments (36).
US also provides both quantitative and qualitative muscle information (37). Muscle quantity is typically assessed through measurements of muscle thickness and cross-sectional area (38), while muscle quality is evaluated based on muscle echogenicity (33). The updated consensus from the European Working Group on Sarcopenia in Older People recommends US for assessing muscle quantity (11). A recent study comparing panoramic US and MRI measurements of skeletal muscle cross-sectional areas found excellent concordance between the two methods in monitoring quadriceps muscle atrophy and hypertrophy (Fig 3B) (39).
US-based muscle echogenicity is associated with fat infiltration, fibrous tissue, and reduced muscle function (40). These early changes in muscle quality often precede substantial weight loss and serve as important markers for early diagnosis of CAC. Combining measurements of the skeletal muscle cross-sectional area and echogenicity can improve diagnostic accuracy for muscle wasting compared with using these parameters individually (31,41). Muscle fat infiltration, as indicated by US measurements of echogenicity and shear wave velocity, can effectively monitor the biologic and physiologic processes in the tissue, providing a more detailed assessment compared with traditional gross weight measurements such as BMI (29). Studies have demonstrated that US assessment of calf muscles can effectively depict sarcopenia based on muscle thickness and echogenicity of the anterior tibial muscle (41).
US elastography enables the assessment of stiffness and elastic properties of soft tissue (42), offering additional insights into muscle quality and functional loss in patients with CAC. Increased intramuscular fat and muscle fibrosis detected with elastography are associated with decreased muscle function, reduced strength, and higher mortality rates (43,44). Shear wave US elastography measures tissue stiffness as a parameter of muscle quality and functional loss, independent of muscle quantity (45).
A challenge in using US imaging for the quantitative assessment of tissue properties is the inconsistency in US imaging protocols for monitoring longitudinal muscle loss. This variability arises primarily from differences in patient muscle compression, site selection, and fluid status (23,46). To address this limitation, standardized scanning protocols have been developed to enhance the reproducibility of US systems for grayscale analysis (47).
Comprehensive Measurement of Skeletal Muscles Using CT
CT is an essential imaging modality for evaluating body composition in patients with cancer due to its high resolution (0.25–0.50 mm) and ability to differentiate skeletal muscle and adipose tissue, including visceral and subcutaneous fat, based on distinct Hounsfield unit values (48,49). This capability to quantify muscle and fat mass has proven beneficial for assessing CAC.
CT imaging at the third lumbar vertebra (L3) is commonly used to assess muscle and fat distribution in patients with CAC, as it correlates well with whole-body muscle and fat mass (50). Several studies have demonstrated that reductions in subcutaneous adipose tissue (SAT) and subsequent muscle atrophy are early indicators of CAC. In patients with pancreatic cancer, CT images at the L3 level revealed that SAT depletion occurred first, followed by atrophy in visceral adipose tissue (VAT) and skeletal muscle (51). One study found that reductions in adipose tissue were detectable 6 months before diagnosis, while muscle mass decline was observed 18 months prior (52). These findings highlight the importance of early detection of changes in skeletal muscle and adipose tissue for cancer diagnosis.
CAC can be diagnosed using the SMI at the L3 level (cutoff: <52.40 cm2/m2 for men; <38.50 cm2/m2 for women) as a diagnostic criterion for sarcopenia, in combination with a weight loss exceeding 2% of BMI (1,12). In patients with metastatic lung cancer, sarcopenia due to CAC, identified using SMI thresholds, has been found to be effective in independently predicting response rate and prognosis (53). Furthermore, preexisting sarcopenia increases the risk of perioperative complications and worsens long-term prognosis in patients with lung cancer (54). SMI at L1 is sometimes used as an alternative to L3 for diagnosing sarcopenia (55). Additionally, CT measurement of the pectoralis muscle area at the fourth thoracic vertebra has been shown to predict survival in non–small cell lung cancer (56). The role of SMI in predicting CAC prognosis has also been investigated in other cancers, including esophageal (57), colorectal (58), and pancreatic cancers (59). The combination of sarcopenia and adipopenia at the L3 level has been integrated into a cachexia scoring system, providing prognostic markers for diffuse large B-cell lymphoma (60).
CT-derived muscle quality measurements, such as mean muscle attenuation, negatively correlate with muscular fat content, indicating latent sarcopenia (61). As CAC progresses, adipose tissue degradation leads to intramuscular fat infiltration, known as myosteatosis, which is associated with decreased CT attenuation values (62). Elevated myosteatosis has been linked to poorer survival and prolonged hospital stays in patients with cancer (63,64). Skeletal muscle attenuation, as quantified with CT, has proven to be a prognostic marker for outcomes in cancers, including colorectal cancer (65) and diffuse large B-cell lymphoma (66).
The major advantages of CT lie in its ability to assess metabolic changes in CAC, such as hepatic fat content. Recent studies suggest that CT may be useful for monitoring hepatic fat accumulation, which is often associated with increased energy expenditure in patients with CAC (5,67). These findings emphasize CT’s potential as an early diagnostic tool for depicting metabolic shifts in CAC.
CT offers rapid, high-resolution, multiplanar three-dimensional volumetric imaging, making it an effective tool for assessing muscle, adipose tissue, and liver in CAC prognosis. Despite its strengths, CT has limited ability to distinctly visualize muscular layers due to the inherent nature of x-ray–based imaging. Furthermore, concerns over radiation exposure during repeated scans may restrict its use in CAC (68).
Functional and Metabolic Imaging with MRI
Cancer-associated skeletal muscle atrophy involves changes such as loss of muscle fibers and increased fat infiltration (69). These functional and metabolic changes occur earlier than structural or morphologic changes, making MRI a promising tool for depicting early-stage CAC. MRI provides high contrast and resolution, making it ideal for assessing muscle and adipose tissue changes associated with CAC (25). Unlike CT, MRI can also reveal functional and metabolic changes, offering insights beyond anatomic imaging (25,70). For instance, hyperpolarized MRI is valuable for monitoring tumor metabolism and treatment response (71,72), while chemical exchange saturation transfer MRI provides insights into the metabolic pathways of creatine and phosphocreatine in muscle tissue (73,74), among other applications.
Advanced MRI techniques, such as diffusion-weighted imaging and diffusion-tensor imaging, enable early detection of muscle abnormalities (75). Diffusion-weighted imaging can assess skeletal muscle integrity, while diffusion-tensor imaging evaluates muscle microstructure and fiber composition, offering valuable biomarkers for CAC (75). Additionally, MRI elastography can help assess tissue stiffness, aiding in the evaluation of muscle changes in CAC (Fig 4A) (76). Moreover, T1 and T2 mapping sequences, which measure relaxation times, provide insights into both pathologic and physiologic changes in muscle (77). Proton MR spectroscopy combined with MRI can quantify intracellular lipids in muscle, offering a direct measure of fat infiltration, a key feature in CAC progression (78). Together with 31P-MR spectroscopy, which depicts muscle energy metabolism, and 13C-MR spectroscopy, which depicts muscle triglycerides and glycogen, these methods enable a comprehensive assessment of metabolic changes associated with CAC (78).
Figure 4:

(A) MR elastography assessment of biceps brachii stiffness in the right arm under varying loads in a healthy male individual lying in the right lateral decubitus position. The images show muscle orientation and driver placement, with wave patterns for 0-, 4-, and 8-kg loads, indicating muscle stiffness with higher loads. (Reprinted, under a CC BY 4.0 license, from reference 76.) (B) The proton density fat fraction (PDFF) maps of the psoas and erector spinae muscles (highlighted in red) in a 56-year-old male individual with esophagogastric junction adenocarcinoma show a decrease in PDFF over 218 days. (Reprinted, under a CC BY 4.0 license, from reference 80.) (C) MRI employs chemical shift-selective imaging in both healthy control mice and mice with pancreatic cancer, demonstrating metabolic changes in white adipose tissue (WAT). CSSI = chemical shift-selective imaging, eWAT = epididymal WAT, PC = pancreatic cancer, sWAT = subcutaneous WAT. (Adapted and reprinted, under a CC BY 4.0 license, from reference 83.)
MRI is also sensitive to fat changes, which is crucial for monitoring CAC. Techniques like chemical shift imaging can quantify fat infiltration (79), with studies showing significant correlations between fat content in muscles and BMI loss in patients with CAC (Fig 4B) (80). CAC is often accompanied by ectopic fat deposition, particularly in the liver (81). Advanced techniques, such as the three-point Dixon method, enhance the accuracy of fat quantification, especially in the liver and vertebrae, allowing for organ- and tissue-specific assessment of fat accumulation in CAC (82).
Moreover, MRI can capture dynamic metabolic changes associated with CAC progression, such as the browning of white adipose tissue, which contributes to lipid breakdown—a key feature of CAC (9,10). A study in mice with pancreatic cancer and CAC showed that chemical shift imaging measurement of fat fraction in SAT and VAT revealed a significant reduction due to white adipose browning (Fig 4C) (83). Functional MRI techniques, such as blood oxygen level–dependent imaging, can further help confirm changes in brown adipose tissue, which are related to the metabolic shifts in CAC (84).
With its nonionizing radiation and high accuracy, MRI shows great promise for the early assessment and diagnosis of CAC. However, clinical applications face challenges such as long scan times, high costs, and complex postprocessing. Advances in rapid imaging sequences, improved image reconstruction algorithms, and optimized clinical workflows should overcome these limitations, making MRI a critical tool for early detection of CAC in oncology and radiology clinics.
Molecular Imaging with PET/CT
PET, often used in combination with CT, offers a multimodal approach to assessing and diagnosing CAC by integrating both morphologic and metabolic imaging modalities. Fluorodeoxyglucose (FDG), a glucose analog, is a widely used tracer in oncology for imaging of cancer metabolism. FDG is taken up by cells and trapped intracellularly after phosphorylation, making it suitable for evaluating cancer metabolism and associated metabolic changes, including those observed in CAC (85).
Recent studies have explored the use of FDG PET/CT for the early detection of muscle changes in CAC. For instance, a study involving 56 patients with stage III non–small cell lung cancer found increased FDG uptake in the psoas muscle of patients with CAC, indicating its potential as a prognostic indicator (86). Additionally, elevated muscle standardized uptake value (SUV) of FDG was associated with decreased overall survival and local recurrence-free survival time in soft tissue sarcomas (87). Lower muscle SUV correlated with reduced serum hemoglobin and albumin levels, highlighting its potential in assessing nutritional status and disease severity (87).
FDG PET/CT is the currently accepted method for quantifying brown adipose tissue, which exhibits high glucose uptake. A preclinical investigation showed that FDG uptake serves as a biomarker for the CAC-associated process of white adipose browning (88). Furthermore, a study of 390 patients with cancer found that reduced hepatic FDG uptake and increased uptake in VAT and SAT were linked to CAC (Fig 5) (89). Additionally, a nomogram incorporating age, hemoglobin levels, maximum SUV of the liver, and minimum SUV of the subcutaneous fat has shown strong predictive ability for the onset of cachexia in patients with cancer, facilitating risk stratification for overall survival in these patients (90).
Figure 5:

Representative PET/CT images of two patients with lung cancer. (A–D) A 60-year-old female individual with cachexia shows lower peak liver SUV (2.22), higher minimum visceral fat SUL (0.50), and subcutaneous fat SUL (0.26). (E–H) A 59-year-old female individual without cancer-associated cachexia, with higher peak liver SUV (2.98), lower minimum visceral fat SUL (0.16), and subcutaneous fat SUL (0.07). Both patients were female individuals under 65 years old, with a BMI more than 20 and WBC less than 9.5×10⁹/L. However, the patient with cachexia showed lower peak liver SUV and higher minimum visceral and subcutaneous fat SUL compared with the patient without cachexia. BMI = body mass index, SUL = standardized uptake value normalized by lean body mass, SULmin = minimum standardized uptake value normalized by lean body mass, SUV = standardized uptake value, SUVpeak = peak standardized uptake value, WBC = white blood cell. (Adapted and reprinted, with permission, from reference 89.)
Since PET/CT allows for the simultaneous assessment of primary tumors and distant organs, it provides a comprehensive evaluation of metabolic changes in CAC. For example, in esophageal and gastroesophageal junction cancer, pretreatment FDG PET/CT scans showed that higher maximum SUV in the primary tumor was significantly associated with CAC and patient survival (91). Similarly, a large retrospective study found markedly reduced hepatic FDG uptake in patients with CAC, which correlated with poorer survival rates (92).
Recently, efforts have been focused on developing novel radionuclides with high specificity and sensitivity to CAC-specific biomarkers. Preclinical studies have shown that translocator protein tracers, such as fluorine 18 (18F)-FEPPA and 18F-DPA-714, can effectively image brown adipose tissue (93,94). While these novel tracers have shown promise in preclinical investigations, they require further development for clinical applications (93,94).
Future Perspectives
As precision and individualized cancer care continue to advance, the impact of CAC on patient outcomes and survival is increasingly recognized. However, a substantial gap remains in the understanding of CAC mechanisms and the effective medical interventions available. Emerging evidence also suggests that CAC patterns vary significantly across different demographic and socioeconomic groups, highlighting the role of health disparities in disease progression. For instance, a study comparing non-Hispanic Black and non-Hispanic White patients with pancreatic cancer found that CAC-related muscle loss was more pronounced in Non-Hispanic Black patients, with greater decreases in core and psoas musculature, lower baseline serum albumin levels, and higher platelet counts (95). These findings underscore the need for a more comprehensive approach to CAC assessment that accounts for racial and socioeconomic factors.
These unmet needs can be addressed through new imaging technologies and approaches that are already available within clinical imaging modalities. The imaging techniques discussed in this review provide examples of noninvasive methods to quantitatively analyze systemic metabolic changes in patients with CAC, including changes in muscle tissue, adipose tissue, and liver function. These approaches and technologies provide valuable information for the potential early diagnosis of CAC, which can inform clinical decisions regarding early intervention to slow its progression.
Importantly, using clinically available imaging modalities is cost-effective and does not impose additional burdens on resource-limited communities. We can utilize the resources and technologies developed for imaging primary cancer problems to also image CAC, thereby accelerating the clinical translation of these applications. This review discusses the use of DXA, US, CT, MRI, and PET to evaluate CAC-related changes in tissue properties and metabolic functions. Other potential applications are discussed in the literature. For instance, functional MRI techniques can depict alterations in brain activity related to appetite regulation and food intake, which are frequently dysregulated in cachectic patients (96). High-resolution proton MR spectroscopy has been used to detect increased levels of free choline and phosphocholine, contributing to higher total choline levels in cachectic tumors (97). Additionally, DXA, CT, and MRI can help identify sarcopenic obesity by evaluating muscle and fat tissue composition (98). In patients with CAC, sarcopenic obesity is prevalent but often overlooked due to minimal weight loss (98). This condition is associated with poor prognosis, including worsened overall outcomes and reduced chemotherapy efficacy (98). Furthermore, research in animal models of CAC has demonstrated progressive cardiac atrophy, accompanied by impaired cardiac function, as shown with echocardiography (99). Cachexia-induced heart failure further exacerbates the progression of CAC (99). The bidirectional relationship between CAC and subsequent heart failure, as observed in preclinical studies, calls for further investigation in humans. Advanced imaging modalities, such as CT, MRI, and echocardiography, can help elucidate these interconnected pathophysiologic processes (99).
Each imaging modality discussed in this review has its strengths and limitations, as summarized in the Table. Thus, proper diagnosis and assessment of CAC necessitates the selection of appropriate imaging tools and capabilities based on specific circumstances and resources to maximize diagnostic information from routine clinical imaging examinations. Since metabolic changes often precede cachexia, ongoing research should aim to detect and identify specific biomarkers using molecular and functional imaging to enable highly sensitive and specific imaging of the early stages of cachexia.
Advantages and Disadvantages of Different Imaging Modalities for Assessing Cancer-associated Cachexia

Given the complexity of CAC, multimodal imaging assessments are essential for its accurate diagnosis. In this context, radiomics is emerging as a promising tool for deriving imaging biomarkers for early detection and prediction of CAC. Radiomics uses large datasets and advanced computational capabilities, including artificial intelligence (AI) (100), to extract image features from medical images, enabling the identification of subtle patterns indicative of early structural changes associated with CAC. AI-driven radiomics may allow clinicians to detect CAC at its early stages, facilitating timely intervention and potentially improving patient outcomes. For example, AI-assisted analysis of US images enables assessment of muscle quality through the evaluation of intermuscular adipose tissue (101). This method has been shown to effectively screen and diagnose sarcopenia, an early manifestation of CAC (101). A recent study demonstrated that radiomics can predict CAC in patients with stage IV non–small cell lung cancer, with gray-level co-occurrence matrix features of skeletal muscle serving as strong indicators of muscle loss, a key sign of CAC (102). Additionally, a radiomics signature derived from PET/CT, combined with BMI, M staging, and Eastern Cooperative Oncology Group score, can help predict cachexia onset before immune checkpoint inhibitor therapy in non–small cell lung cancer, enabling proactive monitoring of high-risk cases (103). In addition to advancements in radiomics, platforms like Storyline Health (https://storylinehealth.com), which integrates telemedicine with AI tools, may support early CAC detection and clinical decision-making. By incorporating imaging data, clinical information, and personalized care plans, this platform could assist in assessing CAC risk. While still in its early stages, it holds potential to complement existing diagnostic methods and contribute to more proactive and personalized care for patients with CAC.
Recent advances in deep learning, particularly in automatic segmentation, have further enhanced the utility of radiomics in CAC diagnosis. AI-assisted approaches, such as the V-Net network (https://github.com/faustomilletari/VNet), have demonstrated high accuracy in segmenting adipose and muscle tissue, with Dice indexes of 0.96 for SAT and 0.98 for VAT (104). Additionally, an automatic segmentation method based on a fully convolutional network has been successfully applied to process and analyze abdominal CT images (Fig 6) (105).
Figure 6:

Fully convolutional neural network–based adipose and muscle tissue segmentations on abdominal CT images at the third lumbar vertebra. (A) Integrated depiction of all segmented areas. (B–D) Segmentation maps distinguish subcutaneous fat (B, highlighted in red), skeletal muscle (C, highlighted in purple), and visceral fat (D, highlighted in green). The Dice similarity coefficients stand at 0.98, 0.99, and 0.98 for subcutaneous fat, skeletal muscle, and visceral fat, respectively. (Adapted and reprinted, under a CC BY 4.0 license, from reference 105.)
Despite the promising potential, the clinical application of AI and radiomics in diagnosing CAC remains limited, highlighting the need for further research in this area. Addressing this gap is expected to yield innovative tools for the early detection and prediction of CAC, ultimately contributing to improved clinical management of CAC and patient outcomes.
Conclusion
Clinical imaging technologies, including DXA, US, CT, MRI, and molecular imaging, can complement the quantitative analysis of systemic metabolic changes in CAC, which is crucial for early diagnosis and intervention planning. Implementing cost-effective imaging tools like DXA and US imaging to diagnose and assess CAC not only benefits resource-limited settings but also utilizes existing capabilities from primary cancer imaging, thus expediting applications for CAC. Looking ahead, the integration of AI technologies with molecular and functional imaging to identify specific imaging biomarkers holds great promise for early detection and risk prediction of CAC. This approach has the potential to enhance detection rates, support informed decision-making, and improve clinical outcomes, ultimately enabling more effective management of CAC.
Y.J. and Y.Z. contributed equally to this work.
Funding: Supported by the National Natural Science Foundation of China (82272064), the Jiangsu Provincial Science and Technique Program (BK20221461), Zhongda Hospital affiliated with Southeast University, Jiangsu Province High-Level Hospital Pairing Assistance Construction (zdlyg08), Postgraduate Research & Practice Innovation Program of Jiangsu Province (KYCX23_0323 and KYCX22_0297).
Disclosures of conflicts of interest: Y.J. No relevant relationships. Y.Z. No relevant relationships. J.D. No relevant relationships. Q.Y. No relevant relationships. X.T. No relevant relationships. L.F. No relevant relationships. H.M. Associate editor of Radiology: Imaging Cancer. X.G.P. No relevant relationships.
Abbreviations:
- AI
- artificial intelligence
- BMI
- body mass index
- CAC
- cancer-associated cachexia
- DXA
- dual-energy x-ray absorptiometry
- FDG
- fluorodeoxyglucose
- SAT
- subcutaneous adipose tissue
- SMI
- skeletal muscle index
- SUV
- standardized uptake value
- VAT
- visceral adipose tissue
References
- 1. Fearon K , Strasser F , Anker SD , et al . Definition and classification of cancer cachexia: an international consensus . Lancet Oncol 2011. ; 12 ( 5 ): 489 – 495 . [DOI] [PubMed] [Google Scholar]
- 2. Baracos VE , Martin L , Korc M , Guttridge DC , Fearon KCH . Cancer-associated cachexia . Nat Rev Dis Primers 2018. ; 4 : 17105 . [DOI] [PubMed] [Google Scholar]
- 3. Nishie K , Nishie T , Sato S , Hanaoka M . Update on the treatment of cancer cachexia . Drug Discov Today 2023. ; 28 ( 9 ): 103689 . [DOI] [PubMed] [Google Scholar]
- 4. Schmidt SF , Rohm M , Herzig S , Berriel Diaz M . Cancer cachexia: more than skeletal muscle wasting . Trends Cancer 2018. ; 4 ( 12 ): 849 – 860 . [DOI] [PubMed] [Google Scholar]
- 5. Tisdale MJ . Cachexia in cancer patients . Nat Rev Cancer 2002. ; 2 ( 11 ): 862 – 871 . [DOI] [PubMed] [Google Scholar]
- 6. Hébuterne X , Lemarié E , Michallet M , et al . Prevalence of malnutrition and current use of nutrition support in patients with cancer . JPEN J Parenter Enteral Nutr 2014. ; 38 ( 2 ): 196 – 204 . [DOI] [PubMed] [Google Scholar]
- 7. Pressoir M , Desné S , Berchery D , et al . Prevalence, risk factors and clinical implications of malnutrition in French comprehensive cancer centres . Br J Cancer 2010. ; 102 ( 6 ): 966 – 971 . [DOI] [PMC free article] [PubMed] [Google Scholar]
- 8. Ferrer M , Anthony TG , Ayres JS , et al . Cachexia: a systemic consequence of progressive, unresolved disease . Cell 2023. ; 186 ( 9 ): 1824 – 1845 . [DOI] [PMC free article] [PubMed] [Google Scholar]
- 9. Petruzzelli M , Schweiger M , Schreiber R , et al . A switch from white to brown fat increases energy expenditure in cancer-associated cachexia . Cell Metab 2014. ; 20 ( 3 ): 433 – 447 . [DOI] [PubMed] [Google Scholar]
- 10. Giralt M , Villarroya F . White, brown, beige/brite: different adipose cells for different functions? Endocrinology 2013. ; 154 ( 9 ): 2992 – 3000 . [DOI] [PubMed] [Google Scholar]
- 11. Cruz-Jentoft AJ, Bahat G, Bauer J, et al. ; Writing group for the European Working Group on Sarcopenia in Older People 2 (EWGSOP2), and the Extended Group for EWGSOP2 . . Sarcopenia: revised European consensus on definition and diagnosis . Age Ageing 2019. ; 48 ( 1 ): 16 – 31 . [DOI] [PMC free article] [PubMed] [Google Scholar]
- 12. Prado CMM , Lieffers JR , McCargar LJ , et al . Prevalence and clinical implications of sarcopenic obesity in patients with solid tumours of the respiratory and gastrointestinal tracts: a population-based study . Lancet Oncol 2008. ; 9 ( 7 ): 629 – 635 . [DOI] [PubMed] [Google Scholar]
- 13. Sayer AA , Cooper R , Arai H , et al . Sarcopenia . Nat Rev Dis Primers 2024. ; 10 ( 1 ): 68 . [DOI] [PubMed] [Google Scholar]
- 14. Shah UA , Ballinger TJ , Bhandari R , et al . Imaging modalities for measuring body composition in patients with cancer: opportunities and challenges . J Natl Cancer Inst Monogr 2023. ; 2023 ( 61 ): 56 – 67 . [DOI] [PMC free article] [PubMed] [Google Scholar]
- 15. Muscaritoli M , Arends J , Bachmann P , et al . ESPEN practical guideline: clinical nutrition in cancer . Clin Nutr 2021. ; 40 ( 5 ): 2898 – 2913 . [DOI] [PubMed] [Google Scholar]
- 16. Kim EY , Kim SR , Won DD , Choi MH , Lee IK . Multifrequency bioelectrical impedance analysis compared with computed tomography for assessment of skeletal muscle mass in primary colorectal malignancy: a predictor of short-term outcome after surgery . Nutr Clin Pract 2020. ; 35 ( 4 ): 664 – 674 . [DOI] [PubMed] [Google Scholar]
- 17. Brown JC , Caan BJ , Cespedes Feliciano EM , et al . Weight stability masks changes in body composition in colorectal cancer: a retrospective cohort study . Am J Clin Nutr 2021. ; 113 ( 6 ): 1482 – 1489 . [DOI] [PMC free article] [PubMed] [Google Scholar]
- 18. Abbass T , Dolan RD , Laird BJ , McMillan DC . The relationship between imaging-based body composition analysis and the systemic inflammatory response in patients with cancer: a systematic review . Cancers (Basel) 2019. ; 11 ( 9 ): 1304 . [DOI] [PMC free article] [PubMed] [Google Scholar]
- 19. Schmeusser BN , Ali AA , Fintelmann FJ , et al . Imaging techniques to determine degree of sarcopenia and systemic inflammation in advanced renal cell carcinoma . Curr Urol Rep 2023. ; 24 ( 7 ): 317 – 334 . [DOI] [PMC free article] [PubMed] [Google Scholar]
- 20. Plank LD . Dual-energy x-ray absorptiometry and body composition . Curr Opin Clin Nutr Metab Care 2005. ; 8 ( 3 ): 305 – 309 . [DOI] [PubMed] [Google Scholar]
- 21. Johnson J , Dawson-Hughes B . Precision and stability of dual-energy x-ray absorptiometry measurements . Calcif Tissue Int 1991. ; 49 ( 3 ): 174 – 178 . [DOI] [PubMed] [Google Scholar]
- 22. Guglielmi G , Ponti F , Agostini M , et al . The role of DXA in sarcopenia . Aging Clin Exp Res 2016. ; 28 ( 6 ): 1047 – 1060 . [DOI] [PubMed] [Google Scholar]
- 23. Prado CMM , Heymsfield SB . Lean tissue imaging: a new era for nutritional assessment and intervention . JPEN J Parenter Enteral Nutr 2014. ; 38 ( 8 ): 940 – 953 . [DOI] [PMC free article] [PubMed] [Google Scholar]
- 24. Erlandson MC , Lorbergs AL , Mathur S , Cheung AM . Muscle analysis using pQCT, DXA and MRI . Eur J Radiol 2016. ; 85 ( 8 ): 1505 – 1511 . [DOI] [PubMed] [Google Scholar]
- 25. Han J , Harrison L , Patzelt L , et al . Imaging modalities for diagnosis and monitoring of cancer cachexia . EJNMMI Res 2021. ; 11 ( 1 ): 94 . [DOI] [PMC free article] [PubMed] [Google Scholar]
- 26. Di Sebastiano KM , Mourtzakis M . A critical evaluation of body composition modalities used to assess adipose and skeletal muscle tissue in cancer . Appl Physiol Nutr Metab 2012. ; 37 ( 5 ): 811 – 821 . [DOI] [PubMed] [Google Scholar]
- 27. Shepherd JA , Ng BK , Sommer MJ , Heymsfield SB . Body composition by DXA . Bone 2017. ; 104 : 101 – 105 . [DOI] [PMC free article] [PubMed] [Google Scholar]
- 28. Flatres A , Aarab Y , Nougaret S , et al . Real-time shear wave ultrasound elastography: a new tool for the evaluation of diaphragm and limb muscle stiffness in critically ill patients . Crit Care 2020. ; 24 ( 1 ): 34 . [DOI] [PMC free article] [PubMed] [Google Scholar]
- 29. Lortie J , Rush B , Osterbauer K , et al . Myosteatosis as a shared biomarker for sarcopenia and cachexia using MRI and ultrasound . Front Rehabil Sci 2022. ; 3 : 982949 . [DOI] [PMC free article] [PubMed] [Google Scholar]
- 30. Casey P , Alasmar M , McLaughlin J , et al . The current use of ultrasound to measure skeletal muscle and its ability to predict clinical outcomes: a systematic review . J Cachexia Sarcopenia Muscle 2022. ; 13 ( 5 ): 2298 – 2309 . [DOI] [PMC free article] [PubMed] [Google Scholar]
- 31. Fu H , Wang L , Zhang W , Lu J , Yang M . Diagnostic test accuracy of ultrasound for sarcopenia diagnosis: a systematic review and meta-analysis . J Cachexia Sarcopenia Muscle 2023. ; 14 ( 1 ): 57 – 70 . [DOI] [PMC free article] [PubMed] [Google Scholar]
- 32. Wang JC , Wu WT , Chang KV , et al . Ultrasound imaging for the diagnosis and evaluation of sarcopenia: an umbrella review . Life (Basel) 2021. ; 12 ( 1 ): 9 . [DOI] [PMC free article] [PubMed] [Google Scholar]
- 33. Perkisas S , Baudry S , Bauer J , et al . The SARCUS project: evidence-based muscle assessment through ultrasound . Eur Geriatr Med 2019. ; 10 ( 1 ): 157 – 158 . [DOI] [PubMed] [Google Scholar]
- 34. Ticinesi A , Meschi T , Narici MV , Lauretani F , Maggio M . Muscle ultrasound and sarcopenia in older individuals: a clinical perspective . J Am Med Dir Assoc 2017. ; 18 ( 4 ): 290 – 300 . [DOI] [PubMed] [Google Scholar]
- 35. Naruse M , Trappe S , Trappe TA . Human skeletal muscle size with ultrasound imaging: a comprehensive review . J Appl Physiol (1985) 2022. ; 132 ( 5 ): 1267 – 1279 . [DOI] [PMC free article] [PubMed] [Google Scholar]
- 36. Nijholt W , Scafoglieri A , Jager-Wittenaar H , Hobbelen JSM , van der Schans CP . The reliability and validity of ultrasound to quantify muscles in older adults: a systematic review . J Cachexia Sarcopenia Muscle 2017. ; 8 ( 5 ): 702 – 712 . [DOI] [PMC free article] [PubMed] [Google Scholar]
- 37. Perkisas S , Baudry S , Bauer J , et al . Application of ultrasound for muscle assessment in sarcopenia: towards standardized measurements . Eur Geriatr Med 2018. ; 9 ( 6 ): 739 – 757 . [DOI] [PubMed] [Google Scholar]
- 38. Kara M , Kaymak B , Frontera W , et al . Diagnosing sarcopenia: functional perspectives and a new algorithm from the ISarcoPRM . J Rehabil Med 2021. ; 53 ( 6 ): jrm00209 . [DOI] [PMC free article] [PubMed] [Google Scholar]
- 39. Scott JM , Martin DS , Ploutz-Snyder R , et al . Panoramic ultrasound: a novel and valid tool for monitoring change in muscle mass . J Cachexia Sarcopenia Muscle 2017. ; 8 ( 3 ): 475 – 481 . [DOI] [PMC free article] [PubMed] [Google Scholar]
- 40. Harris-Love MO , Avila NA , Adams B , et al . The comparative associations of ultrasound and computed tomography estimates of muscle quality with physical performance and metabolic parameters in older men . J Clin Med 2018. ; 7 ( 10 ): 340 . [DOI] [PMC free article] [PubMed] [Google Scholar]
- 41. Isaka M , Sugimoto K , Yasunobe Y , et al . The usefulness of an alternative diagnostic method for sarcopenia using thickness and echo intensity of lower leg muscles in older males . J Am Med Dir Assoc 2019. ; 20 ( 9 ): 1185.e1 – 1185.e8 . [DOI] [PubMed] [Google Scholar]
- 42. Drakonaki EE , Allen GM , Wilson DJ . Ultrasound elastography for musculoskeletal applications . Br J Radiol 2012. ; 85 ( 1019 ): 1435 – 1445 . [DOI] [PMC free article] [PubMed] [Google Scholar]
- 43. McGregor RA , Cameron-Smith D , Poppitt SD . It is not just muscle mass: a review of muscle quality, composition and metabolism during ageing as determinants of muscle function and mobility in later life . Longev Healthspan 2014. ; 3 ( 1 ): 9 . [DOI] [PMC free article] [PubMed] [Google Scholar]
- 44. Perkisas S , Lamers S , Degerickx R , et al . The relation between mortality, intramuscular adipose tissue and sarcopenia in hospitalized geriatric patients . Eur Geriatr Med 2018. ; 9 ( 6 ): 801 – 807 . [DOI] [PubMed] [Google Scholar]
- 45. Bastijns S , De Cock AM , Vandewoude M , Perkisas S . Usability and pitfalls of shear-wave elastography for evaluation of muscle quality and its potential in assessing sarcopenia: a review . Ultrasound Med Biol 2020. ; 46 ( 11 ): 2891 – 2907 . [DOI] [PubMed] [Google Scholar]
- 46. Paris MT , Mourtzakis M , Day A , et al . Validation of bedside ultrasound of muscle layer thickness of the quadriceps in the critically ill patient (VALIDUM Study) . JPEN J Parenter Enteral Nutr 2017. ; 41 ( 2 ): 171 – 180 . [DOI] [PubMed] [Google Scholar]
- 47. O’brien TG , Cazares Gonzalez ML , Ghosh PS , Mandrekar J , Boon AJ . Reliability of a novel ultrasound system for gray-scale analysis of muscle . Muscle Nerve 2017. ; 56 ( 3 ): 408 – 412 . [DOI] [PubMed] [Google Scholar]
- 48. Wang J , Fleischmann D . Improving spatial resolution at CT: development, benefits, and pitfalls . Radiology 2018. ; 289 ( 1 ): 261 – 262 . [DOI] [PubMed] [Google Scholar]
- 49. Mattsson S , Thomas BJ . Development of methods for body composition studies . Phys Med Biol 2006. ; 51 ( 13 ): R203 – 228 . [DOI] [PubMed] [Google Scholar]
- 50. Mourtzakis M , Prado CMM , Lieffers JR , et al . A practical and precise approach to quantification of body composition in cancer patients using computed tomography images acquired during routine care . Appl Physiol Nutr Metab 2008. ; 33 ( 5 ): 997 – 1006 . [DOI] [PubMed] [Google Scholar]
- 51. Sah RP , Sharma A , Nagpal S , et al . Phases of metabolic and soft tissue changes in months preceding a diagnosis of pancreatic ductal adenocarcinoma . Gastroenterology 2019. ; 156 ( 6 ): 1742 – 1752 . [DOI] [PMC free article] [PubMed] [Google Scholar]
- 52. Babic A , Rosenthal MH , Sundaresan TK , et al . Adipose tissue and skeletal muscle wasting precede clinical diagnosis of pancreatic cancer . Nat Commun 2023. ; 14 ( 1 ): 4317 . [DOI] [PMC free article] [PubMed] [Google Scholar]
- 53. Rounis K , Makrakis D , Tsigkas AP , et al . Cancer cachexia syndrome and clinical outcome in patients with metastatic non–small cell lung cancer treated with PD-1/PD-L1 inhibitors: results from a prospective, observational study . Transl Lung Cancer Res 2021. ; 10 ( 8 ): 3538 – 3549 . [DOI] [PMC free article] [PubMed] [Google Scholar]
- 54. Nishimura JM , Ansari AZ , D’Souza DM , et al . Computed tomography-assessed skeletal muscle mass as a predictor of outcomes in lung cancer surgery . Ann Thorac Surg 2019. ; 108 ( 5 ): 1555 – 1564 . [DOI] [PubMed] [Google Scholar]
- 55. Recio-Boiles A , Galeas JN , Goldwasser B , et al . Enhancing evaluation of sarcopenia in patients with non–small cell lung cancer (NSCLC) by assessing skeletal muscle index (SMI) at the first lumbar (L1) level on routine chest computed tomography (CT) . Support Care Cancer 2018. ; 26 ( 7 ): 2353 – 2359 . [DOI] [PMC free article] [PubMed] [Google Scholar]
- 56. Kinsey CM , San José Estépar R , van der Velden J , et al . Lower pectoralis muscle area is associated with a worse overall survival in non–small cell lung cancer . Cancer Epidemiol Biomarkers Prev 2017. ; 26 ( 1 ): 38 – 43 . [DOI] [PMC free article] [PubMed] [Google Scholar]
- 57. Jogiat UM , Bédard ELR , Sasewich H , et al . Sarcopenia reduces overall survival in unresectable oesophageal cancer: a systematic review and meta-analysis . J Cachexia Sarcopenia Muscle 2022. ; 13 ( 6 ): 2630 – 2636 . [DOI] [PMC free article] [PubMed] [Google Scholar]
- 58. Choi MH , Oh SN , Lee IK , Oh ST , Won DD . Sarcopenia is negatively associated with long-term outcomes in locally advanced rectal cancer . J Cachexia Sarcopenia Muscle 2018. ; 9 ( 1 ): 53 – 59 . [DOI] [PMC free article] [PubMed] [Google Scholar]
- 59. Choi MH , Yoon SB , Lee K , et al . Preoperative sarcopenia and post-operative accelerated muscle loss negatively impact survival after resection of pancreatic cancer . J Cachexia Sarcopenia Muscle 2018. ; 9 ( 2 ): 326 – 334 . [DOI] [PMC free article] [PubMed] [Google Scholar]
- 60. Camus V , Lanic H , Kraut J , et al . Prognostic impact of fat tissue loss and cachexia assessed by computed tomography scan in elderly patients with diffuse large B-cell lymphoma treated with immunochemotherapy . Eur J Haematol 2014. ; 93 ( 1 ): 9 – 18 . [DOI] [PubMed] [Google Scholar]
- 61. Martin L , Birdsell L , Macdonald N , et al . Cancer cachexia in the age of obesity: skeletal muscle depletion is a powerful prognostic factor, independent of body mass index . J Clin Oncol 2013. ; 31 ( 12 ): 1539 – 1547 . [DOI] [PubMed] [Google Scholar]
- 62. Goodpaster BH , Kelley DE , Thaete FL , He J , Ross R . Skeletal muscle attenuation determined by computed tomography is associated with skeletal muscle lipid content . J Appl Physiol (1985) 2000. ; 89 ( 1 ): 104 – 110 . [DOI] [PubMed] [Google Scholar]
- 63. Aleixo GFP , Shachar SS , Nyrop KA , et al . Myosteatosis and prognosis in cancer: systematic review and meta-analysis . Crit Rev Oncol Hematol 2020. ; 145 : 102839 . [DOI] [PubMed] [Google Scholar]
- 64. Schneider M , Hübner M , Becce F , et al . Sarcopenia and major complications in patients undergoing oncologic colon surgery . J Cachexia Sarcopenia Muscle 2021. ; 12 ( 6 ): 1757 – 1763 . [DOI] [PMC free article] [PubMed] [Google Scholar]
- 65. Golder AM , Sin LKE , Alani F , et al . The relationship between the mode of presentation, CT-derived body composition, systemic inflammatory grade and survival in colon cancer . J Cachexia Sarcopenia Muscle 2022. ; 13 ( 6 ): 2863 – 2874 . [DOI] [PMC free article] [PubMed] [Google Scholar]
- 66. Chu MP , Lieffers J , Ghosh S , et al . Skeletal muscle density is an independent predictor of diffuse large B-cell lymphoma outcomes treated with rituximab-based chemoimmunotherapy . J Cachexia Sarcopenia Muscle 2017. ; 8 ( 2 ): 298 – 304 . [DOI] [PMC free article] [PubMed] [Google Scholar]
- 67. Lieffers JR , Mourtzakis M , Hall KD , et al . A viscerally driven cachexia syndrome in patients with advanced colorectal cancer: contributions of organ and tumor mass to whole-body energy demands . Am J Clin Nutr 2009. ; 89 ( 4 ): 1173 – 1179 . [DOI] [PMC free article] [PubMed] [Google Scholar]
- 68. Kazemi-Bajestani SMR , Mazurak VC , Baracos V . Computed tomography-defined muscle and fat wasting are associated with cancer clinical outcomes . Semin Cell Dev Biol 2016. ; 54 : 2 – 10 . [DOI] [PubMed] [Google Scholar]
- 69. Bhullar AS , Anoveros-Barrera A , Dunichand-Hoedl A , et al . Lipid is heterogeneously distributed in muscle and associates with low radiodensity in cancer patients . J Cachexia Sarcopenia Muscle 2020. ; 11 ( 3 ): 735 – 747 . [DOI] [PMC free article] [PubMed] [Google Scholar]
- 70. van Zijl PCM , Brindle K , Lu H , et al . Hyperpolarized MRI, functional MRI, MR spectroscopy and CEST to provide metabolic information in vivo . Curr Opin Chem Biol 2021. ; 63 : 209 – 218 . [DOI] [PMC free article] [PubMed] [Google Scholar]
- 71. Nelson SJ , Kurhanewicz J , Vigneron DB , et al . Metabolic imaging of patients with prostate cancer using hyperpolarized [1-13C]pyruvate . Sci Transl Med 2013. ; 5 ( 198 ): 198ra108 . [DOI] [PMC free article] [PubMed] [Google Scholar]
- 72. Chen HY , Aggarwal R , Bok RA , et al . Hyperpolarized 13C-pyruvate MRI detects real-time metabolic flux in prostate cancer metastases to bone and liver: a clinical feasibility study . Prostate Cancer Prostatic Dis 2020. ; 23 ( 2 ): 269 – 276 . [DOI] [PMC free article] [PubMed] [Google Scholar]
- 73. Haris M , Singh A , Cai K , et al . A technique for in vivo mapping of myocardial creatine kinase metabolism . Nat Med 2014. ; 20 ( 2 ): 209 – 214 . [DOI] [PMC free article] [PubMed] [Google Scholar]
- 74. Kogan F , Haris M , Debrosse C , et al . In vivo chemical exchange saturation transfer imaging of creatine (CrCEST) in skeletal muscle at 3T . J Magn Reson Imaging 2014. ; 40 ( 3 ): 596 – 602 . [DOI] [PMC free article] [PubMed] [Google Scholar]
- 75. Scheel M , von Roth P , Winkler T , et al . Fiber type characterization in skeletal muscle by diffusion tensor imaging . NMR Biomed 2013. ; 26 ( 10 ): 1220 – 1224 . [DOI] [PubMed] [Google Scholar]
- 76. Glaser KJ , Manduca A , Ehman RL . Review of MR elastography applications and recent developments . J Magn Reson Imaging 2012. ; 36 ( 4 ): 757 – 774 . [DOI] [PMC free article] [PubMed] [Google Scholar]
- 77. Giraudo C , Cavaliere A , Lupi A , Guglielmi G , Quaia E . Established paths and new avenues: a review of the main radiological techniques for investigating sarcopenia . Quant Imaging Med Surg 2020. ; 10 ( 8 ): 1602 – 1613 . [DOI] [PMC free article] [PubMed] [Google Scholar]
- 78. Prompers JJ , Jeneson JAL , Drost MR , et al . Dynamic MRS and MRI of skeletal muscle function and biomechanics . NMR Biomed 2006. ; 19 ( 7 ): 927 – 953 . [DOI] [PubMed] [Google Scholar]
- 79. Schwenzer NF , Machann J , Martirosian P , et al . Quantification of pancreatic lipomatosis and liver steatosis by MRI: comparison of in/opposed-phase and spectral-spatial excitation techniques . Invest Radiol 2008. ; 43 ( 5 ): 330 – 337 . [DOI] [PubMed] [Google Scholar]
- 80. Patzelt L , Junker D , Syväri J , et al . MRI-determined psoas muscle fat infiltration correlates with severity of weight loss during cancer cachexia . Cancers (Basel) 2021. ; 13 ( 17 ): 4433 . [DOI] [PMC free article] [PubMed] [Google Scholar]
- 81. Berriel Diaz M , Krones-Herzig A , Metzger D , et al . Nuclear receptor cofactor receptor interacting protein 140 controls hepatic triglyceride metabolism during wasting in mice . Hepatology 2008. ; 48 ( 3 ): 782 – 791 . [DOI] [PubMed] [Google Scholar]
- 82. Wang M , Luo Y , Cai H , et al . Prediction of type 2 diabetes mellitus using noninvasive MRI quantitation of visceral abdominal adiposity tissue volume . Quant Imaging Med Surg 2019. ; 9 ( 6 ): 1076 – 1086 . [DOI] [PMC free article] [PubMed] [Google Scholar]
- 83. Zhao Y , Dai J , Jiang Y , et al . Reducing white adipose tissue browning using p38α MAPK inhibitors ameliorates cancer-associated cachexia as assessed by magnetic resonance imaging . Nutrients 2022. ; 14 ( 15 ): 3013 . [DOI] [PMC free article] [PubMed] [Google Scholar]
- 84. Khanna A , Branca RT . Detecting brown adipose tissue activity with BOLD MRI in mice . Magn Reson Med 2012. ; 68 ( 4 ): 1285 – 1290 . [DOI] [PMC free article] [PubMed] [Google Scholar]
- 85. van der Lans AAJJ , Wierts R , Vosselman MJ , et al . Cold-activated brown adipose tissue in human adults: methodological issues . Am J Physiol Regul Integr Comp Physiol 2014. ; 307 ( 2 ): R103 – R113 . [DOI] [PubMed] [Google Scholar]
- 86. Karaman E , Hursoy N , Goksel S . The effect of sarcopenia and metabolic PET-CT parameters on survival in locally advanced non–small cell lung carcinoma . Nutr Cancer 2023. ; 75 ( 1 ): 286 – 295 . [DOI] [PubMed] [Google Scholar]
- 87. Foster B , Boutin RD , Lenchik L , et al . Skeletal muscle metrics on clinical 18F-FDG PET/CT predict health outcomes in patients with sarcoma . J Nat Sci 2018. ; 4 ( 5 ): e502 . [PMC free article] [PubMed] [Google Scholar]
- 88. Park JW , Jung KH , Lee JH , et al . 18F-FDG PET/CT monitoring of β3 agonist-stimulated brown adipocyte recruitment in white adipose tissue . J Nucl Med 2015. ; 56 ( 1 ): 153 – 158 . [DOI] [PubMed] [Google Scholar]
- 89. Jiang Y , Wu H , Zhao Y , et al . Abnormal [18F]FDG uptake in liver and adipose tissue: a potential imaging biomarker for cancer-associated cachexia . Eur Radiol 2023. ; 33 ( 4 ): 2561 – 2573 . [DOI] [PubMed] [Google Scholar]
- 90. Jiang Y , Huang M , Zhao Y , et al . A [18F]FDG PET based nomogram to predict cancer-associated cachexia and survival outcome: a multi-center study . Nutrition 2025. ; 129 : 112593 . [DOI] [PubMed] [Google Scholar]
- 91. Olaechea S , Gannavarapu BS , Gilmore A , et al . The influence of tumour fluorodeoxyglucose avidity and cachexia development on patient survival in oesophageal or gastroesophageal junction cancer . JCSM Clin Rep 2021. ; 6 ( 4 ): 128 – 136 . [DOI] [PMC free article] [PubMed] [Google Scholar]
- 92. Nakamoto R , Okuyama C , Ishizu K , et al . Diffusely decreased liver uptake on FDG PET and cancer-associated cachexia with reduced survival . Clin Nucl Med 2019. ; 44 ( 8 ): 634 – 642 . [DOI] [PubMed] [Google Scholar]
- 93. Hartimath SV , Khanapur S , Boominathan R , et al . Imaging adipose tissue browning using the TSPO-18kDa tracer [18F]FEPPA . Mol Metab 2019. ; 25 : 154 – 158 . [DOI] [PMC free article] [PubMed] [Google Scholar]
- 94. Niu N , Xing H , Wang X , et al . Comparative [18F]FDG and [18F]DPA714 PET imaging and time-dependent changes of brown adipose tissue in tumour-bearing mice . Adipocyte 2020. ; 9 ( 1 ): 542 – 549 . [DOI] [PMC free article] [PubMed] [Google Scholar]
- 95. Permuth JB , Clark Daly A , Jeong D , et al . Racial and ethnic disparities in a state-wide registry of patients with pancreatic cancer and an exploratory investigation of cancer cachexia as a contributor to observed inequities . Cancer Med 2019. ; 8 ( 6 ): 3314 – 3324 . [DOI] [PMC free article] [PubMed] [Google Scholar]
- 96. Molfino A , Iannace A , Colaiacomo MC , et al . Cancer anorexia: hypothalamic activity and its association with inflammation and appetite-regulating peptides in lung cancer . J Cachexia Sarcopenia Muscle 2017. ; 8 ( 1 ): 40 – 47 . [DOI] [PMC free article] [PubMed] [Google Scholar]
- 97. Penet MF , Gadiya MM , Krishnamachary B , et al . Metabolic signatures imaged in cancer-induced cachexia . Cancer Res 2011. ; 71 ( 22 ): 6948 – 6956 . [DOI] [PMC free article] [PubMed] [Google Scholar]
- 98. Gortan Cappellari G , Brasacchio C , Laudisio D , et al. ; Obesity Programs of Nutrition, Education, Research and Assessment (OPERA) group . Sarcopenic obesity: what about in the cancer setting? Nutrition 2022. ; 98 : 111624 . [DOI] [PubMed] [Google Scholar]
- 99. Kazemi-Bajestani SMR , Becher H , Fassbender K , Chu Q , Baracos VE . Concurrent evolution of cancer cachexia and heart failure: bilateral effects exist . J Cachexia Sarcopenia Muscle 2014. ; 5 ( 2 ): 95 – 104 . [DOI] [PMC free article] [PubMed] [Google Scholar]
- 100. Zwanenburg A . Radiomics in nuclear medicine: robustness, reproducibility, standardization, and how to avoid data analysis traps and replication crisis . Eur J Nucl Med Mol Imaging 2019. ; 46 ( 13 ): 2638 – 2655 . [DOI] [PubMed] [Google Scholar]
- 101. Yik V , Kok SSX , Chean E , et al . Diagnosing sarcopenia with AI-aided ultrasound (DINOSAUR)—a pilot study . Nutrients 2024. ; 16 ( 16 ): 2768 . [DOI] [PMC free article] [PubMed] [Google Scholar]
- 102. de Jong EEC , Sanders KJC , Deist TM , et al . Can radiomics help to predict skeletal muscle response to chemotherapy in stage IV non–small cell lung cancer? Eur J Cancer 2019. ; 120 : 107 – 113 . [DOI] [PubMed] [Google Scholar]
- 103. Mu W , Katsoulakis E , Whelan CJ , et al . Radiomics predicts risk of cachexia in advanced NSCLC patients treated with immune checkpoint inhibitors . Br J Cancer 2021. ; 125 ( 2 ): 229 – 239 . [DOI] [PMC free article] [PubMed] [Google Scholar]
- 104. Han J , Tang M , Lu C , et al . Subcutaneous, but not visceral, adipose tissue as a marker for prognosis in gastric cancer patients with cachexia . Clin Nutr 2021. ; 40 ( 9 ): 5156 – 5161 . [DOI] [PubMed] [Google Scholar]
- 105. Park HJ , Shin Y , Park J , et al . Development and validation of a deep learning system for segmentation of abdominal muscle and fat on computed tomography . Korean J Radiol 2020. ; 21 ( 1 ): 88 – 100 . [DOI] [PMC free article] [PubMed] [Google Scholar]
- 106. Petak S , Barbu CG , Yu EW , et al . The official positions of the international society for clinical densitometry: body composition analysis reporting . J Clin Densitom 2013. ; 16 ( 4 ): 508 – 519 . [DOI] [PubMed] [Google Scholar]
- 107. Boellaard R , Delgado-Bolton R , Oyen WJG , et al. ; European Association of Nuclear Medicine (EANM) . FDG PET/CT: EANM procedure guidelines for tumour imaging: version 2.0 . Eur J Nucl Med Mol Imaging 2015. ; 42 ( 2 ): 328 – 354 . [DOI] [PMC free article] [PubMed] [Google Scholar]
- 108. Ouellet V , Routhier-Labadie A , Bellemare W , et al . Outdoor temperature, age, sex, body mass index, and diabetic status determine the prevalence, mass, and glucose-uptake activity of 18F-FDG-detected BAT in humans . J Clin Endocrinol Metab 2011. ; 96 ( 1 ): 192 – 199 . [DOI] [PubMed] [Google Scholar]
- 109. Dabiri S , Popuri K , Cespedes Feliciano EM , et al . Muscle segmentation in axial computed tomography (CT) images at the lumbar (L3) and thoracic (T4) levels for body composition analysis . Comput Med Imaging Graph 2019. ; 75 : 47 – 55 . [DOI] [PMC free article] [PubMed] [Google Scholar]