

Abstract
Anchoring a ligand, such as a functional group or a cluster, on the active metal center is an effective strategy for regulating the electronic structure of single‐atom catalysts (SACs). Herein, we present a nitridation‐induced‐clustering strategy to produce not only SAC Fe‐N4 in N‐doped carbon nanorods, but also Fe2N cluster as a ligand anchored on the active Fe site (Fe2Nnc/Fe1‐N‐C). Unlike the conventional iron atomization process, the reactive nitridation process can generate thermodynamically stable Fe2N intermediates by nitriding the initially formed iron oxide, thereby impeding subsequent thermal atomization to fabricate Fe2Nnc/Fe1‐N‐C catalysts. Compared to the conventional SAC Fe1‐N‐C with Fe‐N4 active sites, the Fe2Nnc/Fe1‐N‐C nanorods are more active for oxygen reduction reaction (ORR), yielding a record high half‐wave potential of 0.957 V versus RHE in alkaline condition. The Fe2Nnc/Fe1‐N‐C nanorods can be utilized as air‐cathode catalysts for Zn‐air batteries with a charge‐discharge gap of only ∼0.658 V and outstanding cyclability up to 1000 h. Theoretical calculations show that the Fe2Nnc ligands indeed modified the electronic structures of Fe‐N4 sites, leading to a lower adsorption energy for the ORR intermediate OH* and facilitating the desorption of OH* and thus higher activity for ORR.
Keywords: Clusters, Fe‐N‐C, ORR, Single‐atom catalysts, Thermal atomization
Fe2N cluster liganded single‐atom Fe‐N‐C catalyst was made via impending the conventional thermal atomization process. The in situ generated Fe2N clusters can optimate the electronic structures of Fe‐N4 sites, thereby rendering Fe2Nnc/Fe1‐N‐C catalyst a record‐high oxygen reduction activity of 0.957 V versus RHE in alkali condition.

Introduction
Developing highly efficient and low‐cost electrocatalysts for the oxygen reduction reactions (ORRs) are highly desired for the deployment of advanced energy technologies, including fuel cells and metal‐air batteries.[ 1 , 2 , 3 ] Single‐atom catalysts (SACs) Fe‐N‐C (denoted as Fe1‐N‐C) with atomic Fe‐N4 active centers are widely viewed as promising candidates as efficient ORR catalysts to substitute the expensive and precious Pt/C catalysts, due in part to their desirable structural and functional properties, such as unique coordination micro‐environment and electronic structures.[ 4 , 5 , 6 ] Nevertheless, to achieve high catalytic activity required for practical applications in energy devices, improving the state‐of‐the‐art Fe1‐N‐C catalysts for ORRs is still required. To this end, under the guidance of Sabatier principle, optimal adsorption of the oxygen intermediates (e.g., O* and OH*) onto the active centers is needed for ORRs. It is known that the unfavorable electron distribution of the symmetric Fe‐N4 configuration in conventional Fe1‐N‐C SACs tends to strengthen adsorption of oxygen intermediates, compared to Pt/C, thereby leading to undesirable ORR performance.[ 7 , 8 , 9 , 10 ] Therefore, rational modulation of the electronic structure of the Fe‐ N4 active site for achieving higher ORR activities has received considerable attention over the past years.
Tailoring the electronic structures of classical Fe‐N4 configuration by introducing axial coordination ligands and creating dual‐atomic sites has been proven to be an effective strategy to optimize the binding strength with oxygen containing intermediates during the ORRs.[ 11 , 12 , 13 , 14 , 15 , 16 , 17 , 18 , 19 , 20 , 21 , 22 , 23 , 24 ] Several recent studies have shown that strong electronic interactions between Fe‐N4 and Fe containing clusters can result in favorable synergistic enhancement effect to improve the ORR activity of Fe1‐N‐C SACs.[ 25 , 26 , 27 , 28 , 29 , 30 ] However, few studies were reported on using the multinuclear clusters as ligands for optimizing the ORR activities of Fe1‐N‐C catalysts.[ 31 ] For example, Shui et al. reported an advanced electrocatalyst with the coexistence of atomic Fe‐N4 species and Fe clusters, which increased the activity and stability of ORR by increasing the intrinsic activity and reducing the energy barrier.[ 32 ] Liu et al. demonstrated that the non‐ORR‐active NiFe‐LDH nanodots can lower the d‐band center of Fe‐N4 sites and thus enhance the ORR activity of Fe1‐N‐C SACs.[ 33 ] In this regard, the synergistic effect of liganded clusters and single atoms not only enhances intrinsic ORR activity of SACs via the electron redistribution, but also optimizes the electron transfer at the active sites. Nevertheless, further in‐depth understanding the synergistic effect and developing new synthetical approaches to produce clusters liganded SACs are still highly demanded.
Recently, the thermal activation strategy has been adopted to fabricate carbon supported SACs, in which the metal oxide intermediates initially formed at low temperature would be redispersed with single metal atoms by forming covalent bonding between central metal and adjacent heteroatoms through thermal atomization.[ 6 , 34 , 35 , 36 , 37 , 38 ] Thus, one key point in generating cluster liganded SACs is to suppress the metal atomization process. In this work, using Fe1‐N‐C as the model SACs, a nitridation‐induced‐clustering strategy was developed to simultaneously implant both Fe2N clusters and atomic Fe‐N4 species into N‐doped carbon matrix to produce unique Fe2N cluster liganded Fe1‐N‐C (denoted as Fe2Nnc/Fe1‐N‐C) nanorods. The experimental observations and theoretical computation reveal that the generation of more thermodynamically stable Fe2N intermediates can impede the thermal atomization process, ultimately leading to the formation of Fe2Nnc ligand decorated Fe1‐N‐C structure. Compared to Fe1‐N‐C nanorods with same Fe content, the Fe2Nnc/Fe1‐N‐C nanorods exhibit significantly enhanced ORR performance, ranking top in reported Fe1‐N‐C based ORR catalysts in alkaline conditions. As a result, the Fe2Nnc/Fe1‐N‐C nanorods were further investigated as cathode catalysts for high‐performance Zn‐air batteries (ZABs) and anion exchange membrane fuel cells (AEMFCs). Theoretical calculations show that the decoration of Fe2Nnc ligands can modify the electronic structures of atomic Fe‐N4 sites and lower the energy barrier of OH* desorption, thereby enhancing the ORR performance.
Results and Discussion
Nitridation‐Induced Fabrication of Fe2Nnc/Fe1‐N‐C Nanorods
The schematic synthesis process of Fe2Nnc/Fe1‐N‐C nanorods is illustrated in Figures 1a and S1. In the first step, zeolitic imidazolate framework‐L (ZIF‐L) nanorods with length of ∼2 µm were fabricated by using a room‐temperature liquid‐phase method (as it is easy to scale up) (see Figures S2a and S2d). Subsequently, the thermodynamically unstable ZIF‐L phase can be converted into ZIF‐8 phase without obvious morphological alteration[ 39 ] verified by the scanning electron microscope (SEM) images (Figure S2b). X‐ray diffraction (XRD) patterns in Figure S3 confirm that the characteristic peaks of ZIF‐L completely disappears and strong characteristic peaks of ZIF‐8 emerges after the ZIF‐phase‐conversion procedure. Transmission electron microscope (TEM) image (Figure S2e) verified the generation of obvious cavities in the ZIF‐8 nanorods. The as‐obtained ZIF‐8 nanorods were subsequently carbonized at 1100 °C for 2 h to fabricate N‐doped carbon nanorods (Figure S4). SEM and TEM images (Figures S2c and S2f) showed that the rod‐like shape was perfectly preserved after high‐temperature carbonization. During the carbonization process, the low boiling point Zn in ZIF‐8 will be reduced and evaporate out through a decarbonization reaction, thus generating defect‐rich N‐doped carbon matrix.[ 5 , 40 , 41 ] Subsequently, different amounts of anhydrous FeCl3 were adsorbed on the N‐doped carbon nanorods, which are then subjected to thermal activation in inert argon and active 10% of NH3 balanced in argon to obtain Fe1‐N‐C and Fe2Nnc/Fe1‐N‐C nanorods, respectively. Note that the generation of nitride intermediates through nitridation treatment is the key step to obtain cluster liganded SACs (Figure 1a).
Figure 1.

Characterizations of Fe2Nnc/Fe1‐N‐C and Fe1‐N‐C nanorods. a) Formation process of Fe1‐N‐C and Fe2Nnc/Fe1‐N‐C catalysts in Ar and NH3 atmosphere, respectively, b) SEM image, c) TEM image, d) HRTEM image (inset is the contrast intensity profile of (002) lattice fringes), e) HAADF‐STEM image of Fe1‐N‐C nanorods, f, g) HAADF‐STEM image of Fe2Nnc/Fe1‐N‐C nanorods showing the co‐existence of both clusters (marked with red rectangles in (d and e) and isolated Fe atoms (marked with yellow circles in (e), h) HAADF‐STEM image and corresponding elemental mapping of C, N, and Fe.
SEM images (Figures 1b and S5) reveal that Fe2Nnc/Fe1‐N‐C nanorods are uniform with relative rough surface, which can promote the mass transfer of catalytic reactions. The low‐magnification TEM image (Figure 1c) of Fe2Nnc/Fe1‐N‐C nanorods verified that the rod‐like structure is well maintained, and many cavities can be found in nanorods. The high‐resolution TEM (HRTEM) image (Figure 1d) of Fe2Nnc/Fe1‐N‐C nanorods shows that the carbon matrix structure is partially graphitized due to the high‐temperature treatment. The lattice spacing of (002) plane is ∼0.389 nm, larger than the theoretical lattice spacing of 0.340 nm in graphite. The aberration‐corrected high‐angle annular dark‐field scanning transmission electron microscopy (AC‐HAADF‐STEM) of the samples obtained in both Ar and NH3 atmosphere revealed that both atmospheres could implant well‐dispersed Fe atoms into the carbon matrix. The obvious difference is that all the Fe atoms are isolated from each other in Fe1‐N‐C nanorods (Figure 1e), whereas the reactive nitriding treatment can bring about the coexistence of both clusters and single‐atoms in Fe2Nnc/Fe1‐N‐C nanorods. As shown in Figures 1f and S6, many bright areas around 2 nm (marked as red rectangles) belonging to the Fe‐containing clusters can be clearly observed. The high‐magnification AC‐HAADF‐STEM image (Figure 1g) also shows many isolated Fe single‐atoms (labeled as yellow circles) are distributed around the clusters to form single‐atom/cluster catalyst. XRD patterns of both Fe1‐N‐C and Fe2Nnc/Fe1‐N‐C nanorods (Figure S7) have two broad diffraction peaks at 23.5° and 44°, which can be assigned to the (002) and (100) planes of graphite, respectively. An additional weak diffraction peak at ∼43° appears in Fe2Nnc/Fe1‐N‐C nanorods, indicating the generation of small Fe‐containing clusters. Further increasing the Fe content in Fe2Nnc/Fe1‐N‐C nanorods is used to accurately clarify the crystal phase of Fe containing aggregates. As shown in Figure S8, a supplemental peak at 40.6° belonging to Fe2N phase (JCPDS card no. 50–0958) emerge, confirming the generation of Fe2N clusters in Fe1‐N‐C matrix after nitriding treatment. The above phase identification is consistent with the HAADF‐STEM results. The homogeneous distribution of C, N, and Fe elements in the elemental mapping images of Fe2Nnc/Fe1‐N‐C nanorods (Figure 1h) verify the Fe2N clusters and Fe single‐atoms are uniformly distributed in the N‐doped carbon matrix. The results of inductively coupled plasma optical emission spectrometer (ICP‐OES) revealed that the loading mass of Fe was ∼0.95%, a middle‐level content in previously reported Fe1‐N‐C catalysts (Table S1).
In the deconvoluted Raman spectra of Fe2Nnc/Fe1‐N‐C nanorods (Figure S9), the D band at 1354.4 cm−1 and the G band at 1599.1 cm−1 represent the disordered carbon and sp2 ‐type carbon, respectively. The I D/I G area ratio of Fe2Nnc/Fe1‐N‐C nanorods initially carbonized at 1100 °C is 2.98, while the ratio value is 3.47, 3.40, and 2.79 pyrolyzed at 900 °C, 1000 °C, and 1200 °C, respectively, indicating the highly disordered carbon matrix and a downward trend of carbon defects as the initial carbonization temperature rises. The specific surface area of Fe2Nnc/Fe1‐N‐C nanorods is high as ∼783.2 m2 g−1 and abundant pores with size below 3 nm can be observed in the pore distribution curve (Figure S10). The rich defects and high porosity of N‐doped carbon substrate can provide abundant sites for fully dispersing the Fe‐containing species, thereby enhancing the catalytic activity. The X‐ray photoelectron spectroscopy (XPS) survey spectrum confirmed the presence of Fe, N, and C in both Fe2Nnc/Fe1‐N‐C and Fe1‐N‐C nanorods (Figure S11). The peaks in high‐resolution N1s spectra in both Fe2Nnc/Fe1‐N‐C and Fe1‐N‐C nanorods can be mainly deconvoluted into pyridinic‐N, Fe‐N and graphitic‐N. Notably, compared to Fe1‐N‐C, the overall N1s peaks of Fe2Nnc/Fe1‐N‐C (Figure S12) negatively shift to lower binding energies, suggesting the increase in electron density at N sites donated from the Fe atoms. This reflects the strong electron transfer between Fe and nitrogen atoms in Fe2Nnc/Fe1‐N‐C catalysts. The structural parameters and coordination geometry of both Fe2Nnc/Fe1‐N‐C and Fe1‐N‐C nanorods at atomic level were further elucidated by X‐ray adsorption near‐edge spectroscopy (XANES). As shown by the normalized XANES in Figure 2a, the Fe K‐edge absorption energy of Fe2Nnc/Fe1‐N‐C is located between that of Fe and Fe2O3 and close to Fe3O4, indicating that Fe species in Fe2Nnc/Fe1‐N‐C have an oxidation state between +2 and +3. Besides, the Fe K‐edge absorption energy of Fe2Nnc/Fe1‐N‐C show a slightly negative shift compared to the Fe1‐N‐C, suggesting that the valence state of Fe element decreases after reducing NH3 treatment (inset in Figure 2a). The coordination microenvironment of Fe element was further analyzed by Fe K‐edge Fourier‐transformed extended X‐ray absorption fine structure (FT‐EXAFS). As shown in Figure 2b, a notable peak of ∼1.4 Å can be assigned to the Fe‐N bond in both Fe2Nnc/Fe1‐N‐C and Fe1‐N‐C nanorods. In addition, an obvious Fe‐Fe coordination peak at ∼2.2 Å similar to that of Fe foil was detected in Fe2Nnc/Fe1‐N‐C nanorods, demonstrating the formation of Fe‐containing clusters. The slightly negative shift for Fe2Nnc/Fe1‐N‐C (compared to Fe1‐N‐C) can be ascribed to the strong electronic interaction of Fe‐N and clusters. The EXAFS fitting analysis was conducted to quantitate the structural configuration of Fe atoms in Fe2Nnc/Fe1‐N‐C and Fe1‐N‐C. As displayed in Figure 2c, these atomically dispersed Fe atoms in both Fe2Nnc/Fe1‐N‐C and Fe1‐N‐C nanorods are isolated by neighboring four nitrogen atoms, thereby generating a typical Fe‐N4 configuration. Moreover, a small portion of Fe2N clusters containing Fe‐Fe coordination bonds can be also distinguish out in Fe2Nnc/Fe1‐N‐C nanorods distinguish out in Fe2Nnc/Fe1‐N‐C nanorods (Table S2). Furthermore, EXAFS wavelet transform (WT) oscillations were used to more clearly differentiate the coordination environment of Fe atoms, in which the k and R dependence of K‐edge absorption signals can be displayed simultaneously (Figure 2d). The contour intensity maximum of k space for Fe2Nnc/Fe1‐N‐C and Fe1‐N‐C occurs at ∼5.6 Å−1, suggesting the formation of Fe‐N bond, another maximum of contour feature is identified at ∼9.8 Å−1 for Fe2Nnc/Fe1‐N‐C nanorods, undoubtedly assigned to Fe‐Fe bond. Moreover, the slight position difference in contour intensity maximum of Fe─N bonds further confirms the strong electronic interaction between Fe‐N4 sites and Fe2N clusters. Therefore, these structural characterizations demonstrate that Fe2Nnc/Fe1‐N‐C nanorods contain both Fe‐N4 atomic sites and Fe2N clusters while Fe1‐N‐C nanorods only involve isolated Fe‐N4 atomic sites.
Figure 2.
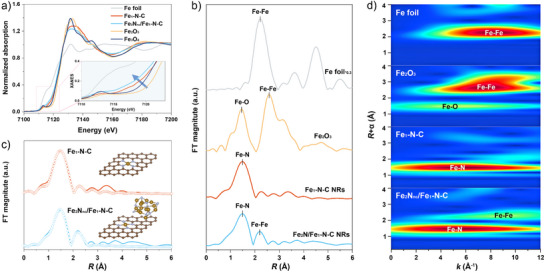
XAFS of Fe2Nnc/Fe1‐N‐C catalysts. a) Normalized Fe K‐edge XANES spectra (inset is the magnified pre‐edge region), b) Fourier‐transformed k 2‐weighted EXAFS spectra, c) The corresponding EXAFS R space fitting curves of Fe2Nnc/Fe1‐N‐C and Fe1‐N‐C nanorods (inset is corresponding schematic model), and d) WT oscillations with Fe2O3 and Fe foil as references.
Clustering Mechanism of Fe2Nnc/Fe1‐N‐C Structures
During the thermal activation process, the active nitridation process plays a key role on the formation of iron single‐atom/cluster structures, which is contrary to the formation of carbon based single‐atom catalysts through conventional thermal atomization process.[ 6 , 37 ] To unveil the formation mechanism of the Fe2Nnc liganded Fe1‐N‐C structures, the evolution process of Fe‐containing intermediate structure treated in both argon and NH3 atmosphere was evaluated by ex situ XRD and TEM analysis. Obvious crystalline Fe3O4 phase would be generated after the thermal activation at 500 °C in both inert argon and reactive NH3 atmosphere, which can be ascribed to the thermal decomposition of FeCl3·6H2O. And the Fe3O4 phase would be survived even heating to 700 °C. Further raising the thermal activation temperature to 800 °C and 900 °C, the diffraction peaks belonging to the Fe3O4 phase would gradually disappear in inert argon atmosphere (Figure S13), indicating the occurrence of thermal atomization process.[ 6 , 37 ] On the contrary, the Fe3O4 would be nitride to generate Fe2N in reactive NH3 atmosphere at 800 °C. Interestingly, the Fe2N phase can still survive at 900 °C, suggesting the atomization difficulty of Fe2N phase in N doped carbon matrix (Figure 3a). HRTEM images of intermediate nanorods produced in active NH3 atmosphere further confirmed the Fe3O4 nanoparticles generated before 700 °C (Figures 3b and S14) would be converted into Fe2N clusters after 800 °C (Figures 3c and S15). It is anticipated that the formation of intermediate nitride clusters plays a key role to block the conventional atomization during the thermal activation process.
Figure 3.

Nitridation‐induced‐clustering mechanism. a) Ex situ XRD patterns of Fe2Nnc/Fe1‐N‐C intermediate nanorods obtained at 500 °C, 700 °C, 800 °C, and 900 °C. HRTEM images of b) Fe3O4 and c) Fe2N nanoparticles obtained at 700 °C and 800 °C, respectively. The transition processes of Fe3O4 cluster (d) and Fe2N cluster (e) to single‐atom (IS: initial states; TS: transition states; FS: final states. The grey, blue, red, and orange balls indicate C, N, O, and Fe, respectively). f) Energy profiles based on CI‐NEB calculations.
To prove this conjecture, DFT calculations of thermal atomization process of Fe3O4 and Fe2N clusters on defect‐rich N‐C were conducted. As shown in Figure 3d,e, the formation process of Fe1‐N‐C is described as follows: i) The pre‐generated bulk Fe2N or Fe3O4 can thermally emit iron single‐atoms; ii) the iron atoms are subsequent trapped by the defects in N‐doped carbon substrate to form Fe1‐N‐C. The Fe single‐atom emitting energy (ΔEe ) from (002) and (211) surfaces of Fe2N intermediate are 5.18 and 5.85 eV, respectively. In contrast, the ΔEe for (220) and (331) surfaces of Fe3O4 are 4.87 and 1.40 eV, respectively (see Figure S16). These indicates that Fe atom is much easier to escape from Fe3O4, especially from (331) surface, to supply Fe atoms to form the isolated Fe‐N4 species. Moreover, diffusion activation energy for Fe single‐atom emitting and subsequent trapping were calculated by using climbing image nudged elastic band (CI‐NEB) method, as shown in Figure 3f. Although both are exothermic processes (Fe2N: ‐2.57 eV; Fe3O4: ‐2.92 eV), the diffusion energy barrier of Fe atom emitting from Fe2N is almost twice larger than that of Fe3O4 (Fe2N: 0.43 eV; Fe3O4: 0.26 eV). According to the DFT results, Fe2N not only hinders the formation of single Fe atom, but also defers the migration to form Fe1‐N‐C due to the stronger Fe‐ N bond.[ 42 ] Therefore, the formation of Fe2Nnc liganded Fe1‐N‐C structures can be ascribed as impeded thermal atomization of Fe2N intermediates. Interestingly, Ni and Co based nitride cluster‐liganded SACs (Figures S17 and S18) can be also fabricated, demonstrating the generality of the nitridation‐induced‐clustering strategy.
Electrochemical Performance of Fe2Nnc/Fe1‐N‐C Catalysts
The ORR performance of Fe2Nnc/Fe1‐N‐C nanorods was evaluated in 0.1 M KOH electrolyte using rotating disk electrode (RDE) and rotating ring disk electrode (RRDE) technologies with commercial 20% Pt/C and conventional Fe1‐N‐C nanorods as the comparison samples. According to the linear sweep voltammetry (LSV) curves (Figure 4a), the Fe2Nnc/Fe1‐N‐C nanorods exhibit a very positive onset potential (E onset) of 1.105 V versus RHE and an ultrahigh half‐wave potential (E 1/2) of 0.957 V versus RHE. While the E 1/2 of Fe1‐N‐C nanorods is only conventional 0.905 V versus RHE, indicating the presence of the liganded Fe2N cluster can boost the ORR activities of Fe1‐N‐C catalysts. Meanwhile, the Fe2Nnc/Fe1‐N‐C nanorods give rise to an ultrahigh kinetic current density (J k) of up to 93.4 and 224.3 mA cm−2 at 0.9 and 0.85 V, respectively, much higher than that of Fe1‐N‐C and commercial Pt/C (Figure S19). The Fe2Nnc/Fe1‐N‐C nanorods manifest the smallest Tafel slope of 54.2 mV dec−1 than Fe1‐N‐C (59.6 mV dec−1) and Pt/C (69.3 mV dec−1), revealing their outstanding ORR kinetics (Figure 4b). Notably, the ORR performance of Fe2Nnc/Fe1‐N‐C nanorods rank among the top in advanced Fe1‐N‐C based catalysts (Figure 4c and Table S1).[ 22 , 23 , 43 , 44 , 45 , 46 , 47 , 48 ] The E 1/2 value of Fe2Nnc/Fe1‐N‐C nanorods in acid is ∼0.77 V versus RHE, showing a comparable activity for Fe‐N‐C catalysts in acid (Figure S20). The carbonization temperature of N‐doped carbon carrier, reflecting the graphitization degree and defect density, also affects the ORR activities. The Fe2Nnc/Fe1‐N‐C nanorods carbonized at 1100 °C (Figure S21) exhibit the best ORR activity when compared to other carbonization temperatures, this is 900 °C (E 1/2: 0.926 V vs. RHE), 1000 °C (E 1/2: 0.931 V vs. RHE), and 1200 °C (E 1/2: 0.926 V vs. RHE). In addition, the nitriding temperature plays a key role on the ORR performance (Figure S22). We note that the Fe2Nnc@Fe1‐N‐C nanorods with 5 mg FeCl3 deliver the optimal ORR activity (Figure S23).
Figure 4.
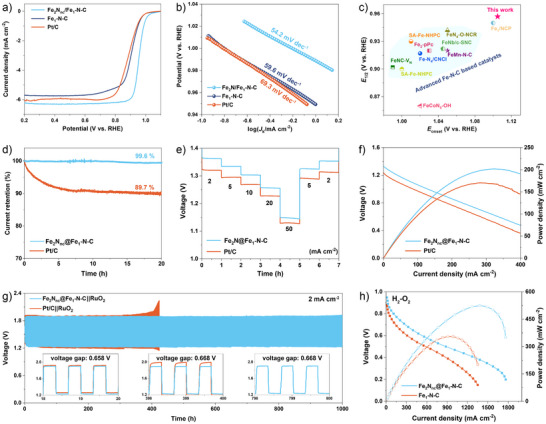
Electrocatalytic performance of Fe2Nnc/Fe1‐N‐C nanorods. a) LSV curves and b) corresponding Tafel plots of Fe2Nnc/Fe1‐N‐C, Fe1‐N‐C and Pt/C, c) comparison of ORR performance with advanced Fe‐N‐C based electrocatalysts in alkaline conditions. d) chronoamperometric stability test of Fe2Nnc/Fe1‐N‐C and Pt/C. e) Rate curves at different current density and f) curves of discharge polarization and the corresponding power density of Fe2Nnc/Fe1‐N‐C and Pt/C, g) charge‐discharge cycling curves of rechargeable ZABs using Fe2Nnc/Fe1‐N‐C + RuO2 and Pt/C + RuO2 mixtures as cathode catalysts. h) AEMFC performance obtained by using Fe2Nnc/Fe1‐N‐C and Fe1‐N‐C as cathode catalyst with a loading mass of 2 mg cm−2.
Determined by Koutecky‐Levich (K‐L) equation based on LSV curves at different rotating speeds ranging from 400 to 2500 rpm, the average electron transfer number (n) is very close to 4.0, demonstrating the typical four‐electron conversion of O2 to H2O catalyzed by the Fe2Nnc/Fe1‐N‐C nanorods (Figure S24). The n value and H2O2 production of Fe2Nnc/Fe1‐N‐C and Pt/C were determined by the RRDE test (Figure S25). The yield of H2O2 is less than 1% and the n of Fe2Nnc/Fe1‐N‐C fluctuates between 3.97 and 4.0 in the potential window between 0.4 and 0.8 V. Additionally, the Fe2Nnc/Fe1‐N‐C nanorods demonstrate robust stability with only 0.4% current decay after 20 hours of chrono‐current testing (Figure 4d) and high methanol tolerance (Figure S26), all of which surpass those of the Pt/C catalyst. The XPS and TEM results (Figures S27 and S28) after stability test further confirm the robust structural stability of Fe2Nnc/Fe1‐N‐C nanorods.
Considering the outstanding ORR performance, disposable ZABs are assembled using Fe2Nnc/Fe1‐N‐C nanorods as air‐cathode catalyst. The open circuit voltage (OCV) of Fe2Nnc/Fe1‐N‐C based ZAB is high up to 1.564 V (Figure S29). Impressively, the discharge voltage of Fe2Nnc/Fe1‐N‐C based battery is continuously higher than that of Pt/C at different current densities ranging from 2 to 50 mA cm−2, demonstrating its outstanding discharge performance arising from the remarkable ORR activity (Figure 4e). Fe2Nnc/Fe1‐N‐C based battery delivers a maximum power density of up to 202.0 mW cm−2, higher than the commercial Pt/C (170.4 mW cm−2, Figure 4f). The specific capacity of Fe2Nnc/Fe1‐N‐C is higher than that of Pt/C based electrode, which is up to 812.9 mAh g−1 at a discharge current density of 20 mA cm−2 (Figure S30). No obvious discharge voltage drop can be observed after 150 h continuous discharging at a high current density of 20 mA cm−2 (Figure S31). Moreover, mixture of Fe2Nnc/Fe1‐N‐C and commercial RuO2 was used as air‐cathode catalysts to assemble rechargeable ZABs, in which RuO2 was served as oxygen evolution catalyst during the charging process. As shown in Figure 4g, the battery demonstrated a narrow charge‐discharge gap of only∼0.658 V, corresponding to a round‐trip efficiency of up to 65%. Impressively, only ∼10 mV decay of charge‐discharge gap can be observed even after 1000 h of cycling (1500 cycles), demonstrating the remarkable long‐term catalytic stability of Fe2Nnc/Fe1‐N‐C nanorods. On the contrary, Pt/C||RuO2 based ZABs exhibited unsatisfied cycling stability in terms of severe degradation even after 400 h of cycling. As another practical application of this promising ORR catalyst, AEMFCs were also assembled using Fe2Nnc/Fe1‐N‐C and Fe1‐N‐C nanorods as the cathode catalysts. The preparation method of the membrane electrode and the AEMFC test parameters were expressed in the Experimental Section. As shown in Figure 4h, the Fe2Nnc/Fe1‐N‐C based AEMFC exhibited a higher peak power density of 524.1 mW cm−2 at 1.38 A cm−2, surpassing that of bare Fe1‐N‐C (355.1 mW cm−2 at 0.91 A cm−2).
ORR Enhancement Mechanism of Fe2Nnc/Fe1‐N‐C Catalysts
The remarkable ORR performance of Fe2Nnc/Fe1‐N‐C nanorods can be ascribed to syngenetic enhancement effect of liganded Fe2N clusters and Fe single‐atoms. To gain deeper insight into the underlying synergistic effect of Fe2N clusters and Fe1‐N‐C from orbital scale, density functional theory (DFT) computations were performed. Considering the different distance between Fe2N cluster and surrounding Fe‐N4 species, three possible models (Figure S32) were considered and compared, including axial Fe2Nnc/Fe1‐N‐C, non‐axial Fe2Nnc/Fe1‐N‐C and Fe1‐N‐C. To evaluate the four‐electron ORR catalytic activities of these models, the optimized configurations of OOH*, O* and OH* on axial Fe2Nnc/Fe1‐N‐C, non‐axial Fe2Nnc/Fe1‐N‐C and Fe1‐N‐C were first established (Figure S33). And the corresponding Gibbs free energy profiles of four‐electron pathway for each surface at alkaline conditions were investigated (Figure 5a). The potential determining step (PDS) for all considered systems were determined to be the last electron transferred step, in which OH* is desorbed from the surface to spare the active site for the following reaction. Due to excessively strong adsorption of OH* intermediate, the Fe1‐N‐C exhibits the lowest theoretical onset potential of 0.415 V. In comparison, introduction of liganded Fe2N clusters can significantly weaken the bonding of OH* and thus increase the onset potential from 0.415 to 0.616 V for axial configuration, and to 0.464 V for non‐axial configuration. Although the theoretical onset potential obtained by CHE model would be underestimated, the increment of onset potential induced by introduction of Fe2N clusters are well consistent with experimental results. In addition, the introduction of Fe2N clusters can also promote the dissociation of OOH* (Table S3). Importantly, compared with axial configuration and non‐axial configuration, the former outperforms the latter. This suggests that direct inductive effects of Fe2Nnc ligands on Fe1‐N‐C can further modulate the adsorption of intermediate with an optimal bonding strength. These results indicate the synergistic effects of the liganded Fe2N cluster and Fe1‐N‐C can enhance the ORR catalytic activity, which agrees well with the experimental results.
Figure 5.

DFT calculations. a) Energy profiles of ORR at U = 1.23 V. b) The relationship between dd and ΔG OH*. c) Schematic diagram of the hybridization of dz2−pz, dxz−px, and dyz−py. Calculated PCOHP of OH* adsorbed on axial Fe2Nnc/Fe1‐N‐C (d), non‐axial Fe2Nnc/Fe1‐N‐C (e) and bare Fe1‐N‐C (f) (The dashed lines indicate the Fermi level). Side view of differential charge density for OH* adsorbed on Fe2Nnc/Fe1‐N‐C (g), non‐axial Fe2Nnc/Fe1‐N‐C (h), and bare Fe1‐N‐C (i) (The orange, grey, blue, red, and white balls indicate Fe, N, O, and H, respectively. The yellow and blue colors represent charge accumulation and depletion).
The electronic properties, including population analysis, projected density of states (PDOS), projected crystal orbital Hamilton population (PCOHP),[ 49 ] and charge transfer analysis were conducted or calculated to further show the mechanism of liganded Fe2N clusters on enhanced ORR activity of Fe1‐N‐C catalysts. As the desorption of OH* is the PDS for all the considered systems, we focus on this step in the following discussions. In this work, active center Fe is coordinated four nitrogen atoms to form square‐planar Fe‐N4 configuration. Accordingly, Fe 3d orbital can split into dx2−y2, dz2, doubly degenerated dxz and dyz, and dxy energy levels. The interaction between active center Fe and OH* is dominated by dz2, dxz, and dyz of Fe and p orbitals of O in OH*, in which the Fe dz 2 orbital and O p z orbitals hybridize to form σ bond, while the Fe dxz/dyz orbital hybridizes with O p x/p y to form π bond (Figure 5c). These orbital hybridizations dictate the adsorption strength of OH*, and ultimately affect the ORR activity. After the introduction of Fe2Nnc ligand, a significant charge redistribution between Fe2Nnc ligand and Fe1‐N4‐C can be observed (Figure S34). The dz2 orbital of Fe in Fe1‐N4‐C hybridizes with dz2 orbital of Fe atom and p z orbital of N atom in Fe2Nnc ligand, leading to a marked electron delocalization of dz2 orbital of active site Fe in Fe1‐N4‐C (Figures S35–S38). This electron delocalization appears to weaken the Fe‐OH* adsorption.[ 50 , 51 , 52 ] In addition, we calculated the energy profiles and electronic properties of common iron nitride (Fe4N) and iron carbides (Fe2C and Fe3C) by using DFT method for comparison (see Figures S39–S42 and Table S4).
Based on above analysis, we introduced a descriptor dd to quantitively describe the delocalization extent of 3dz2 orbital. As shown in Figure 5b, dd exhibits a linear relationship between the adsorption strength of OH* (ΔG OH*). The underlying mechanism of this linear relationship can be explained by that the delocalization of Fe 3dz 2 orbital would deteriorate the overlapping with O p z orbitals, and make the bonding and antibonding orbitals upshift (Figure 5c). This explanation can be supported by COHP analysis, which is widely used to quantitatively investigate the bonding and anti‐bonding properties. As shown in Figure 5d–f, anti‐bonding of dz2− p z of spin up and all the anti‐bonding of spin down are located above the Ferm level, indicating that the orbitals mentioned above are half‐filled, while the rest are full‐filled. Clearly, both the bonding and anti‐bonding orbitals of axial Fe2Nnc/Fe1‐N‐C become more dispersed owing to delocalization of d orbital. And this dispersion of the bonding and anti‐bonding orbitals leads to more positive integrated COHP (ICOHP) values of Fe‐O bond (Table S5), especially hybridization of dz2− p z of both spin states (axial Fe2Nnc/Fe1‐N‐C, −0.46 and −0.41; non‐axial Fe2Nnc/Fe1‐N‐C, −0.54 and −0.65; Fe1‐N‐C, −0.57 and −0.67). This up‐shift of ICOHP suggests a weaker bonding affinity of OH*, and thus boosting the ORR activity. Bonding properties can be further clarified by the structural properties and charge analysis. From the Figure 5g–i and Mulliken charge analysis, the O atom of adsorbed OH* accepts less electron of 0.78 e with longer Fe‐O bond of 1.846 Å for axial Fe2Nnc/Fe1‐N‐C. On the contrary, the charge transfer and the bond length for non‐axial Fe2Nnc/Fe1‐N‐C and Fe1‐N‐C are larger and shorter (0.80 e and 1.822 Å; 0.83 e, 1.821 Å, respectively). Therefore, our DFT calculations show that synergistic effect between liganded Fe2N cluster and Fe1‐N‐C can break the localization of Fe‐3d orbitals, and then fine‐tune the OH* affinity, thereby boosting the intrinsic catalytic performance of Fe active site.
Conclusion
In summary, we developed a nitridation‐induced‐clustering method to produce Fe2N clusters liganded Fe1‐N‐C catalysts to boost sluggish ORRs. Using ZIF‐derived N‐doped carbon nanorods as substrate, Fe2Nnc/Fe1‐N‐C nanorods can be fabricated through a facile nitridation treatment. Comprehensive ex situ experiments and DFT calculations revealed that the generation of Fe2N intermediates would retard the conventional thermal atomization process, thus resulting in the co‐existence of Fe2N clusters and single‐atom FeN4 species. The synergistic effect between liganded Fe2N clusters and Fe1‐N‐C can effectively modulate the localization of Fe‐3d orbitals to optimize the OH* affinity, thus finally boosts the intrinsic ORR performance of Fe active site. As a result, the as‐obtained Fe2Nnc/Fe1‐N‐C nanorods exhibited superb ORR performance with a record‐high E 1/2 of 0.957 V versus RHE, which holds great potential for application in ZABs and AEMFCs. This work brings a new avenue on the preparation of highly active cluster liganded single‐atom catalysts through decoupling the thermal atomization process.
Conflict of Interests
The authors declare no conflict of interest.
Supporting information
Supporting Information
Acknowledgements
This work was supported by the National Natural Science Foundation of China (52302233), Shenzhen Science and Technology Innovation Committee (JCYJ20200109113212238 and GXWD20231129102231003), Guangdong Basic and Applied Basic Research Foundation (2021A1515111154, 2024A1515011108, 2024A1515012307, and 2023A1515110920), Talent Recruitment Project of Guangdong Province (2021QN02C900), and the Sichuan Science and Technology Program (2024NSFSC1141).
Ma F.‐X., Liang X., Liu Z.‐H., Chen Y., Liu Z.‐Q., Zhang W., Zhen L., Zeng X. C., Xu C.‐Y., Angew. Chem. Int. Ed.. 2025, 64, e202504935. 10.1002/anie.202504935
Contributor Information
Prof. Xiao Cheng Zeng, Email: xzeng26@cityu.edu.hk.
Prof. Cheng‐Yan Xu, Email: cy_xu@hit.edu.cn.
Data Availability Statement
The data that support the findings of this study are available in the Supporting Information of this article.
References
- 1. Huang L., Zaman S., Tian X., Wang Z., Fang W., Xia B. Y., Acc. Chem. Res. 2021, 54, 311–322. [DOI] [PubMed] [Google Scholar]
- 2. Tian X., Lu X. F., Xia B. Y., Lou X. W., Joule 2020, 4, 45–68. [Google Scholar]
- 3. Shao M., Chang Q., Dodelet J. P., Chenitz R., Chem. Rev. 2016, 116, 3594–3657. [DOI] [PubMed] [Google Scholar]
- 4. Asset T., Atanassov P., Joule 2020, 4, 33–44. [Google Scholar]
- 5. Zhang H., Hwang S., Wang M., Feng Z., Karakalos S., Luo L., Qiao Z., Xie X., Wang C., Su D., Shao Y., Wu G., J. Am. Chem. Soc. 2017, 139, 14143–14149. [DOI] [PubMed] [Google Scholar]
- 6. Zeng Y., Li C., Li B., Liang J., Zachman M. J., Cullen D. A., Hermann R. P., Alp E. E., Lavina B., Karakalos S., Lucero M., Zhang B., Wang M., Feng Z., Wang G., Xie J., Myers D. J., Dodelet J.‐P., Wu G., Nat. Catal. 2023, 6, 1215–1227. [Google Scholar]
- 7. Chen G., Lu R., Li C., Yu J., Li X., Ni L., Zhang Q., Zhu G., Liu S., Zhang J., Kramm U. I., Zhao Y., Wu G., Xie J., Feng X., Adv. Mater. 2023, 35, 2300907. [DOI] [PubMed] [Google Scholar]
- 8. Chen G., An Y., Liu S., Sun F., Qi H., Wu H., He Y., Liu P., Shi R., Zhang J., Kuc A., Kaiser U., Zhang T., Heine T., Wu G., Feng X., Energy Environ. Sci. 2022, 15, 2619–2628. [Google Scholar]
- 9. Jin Z., Li P., Meng Y., Fang Z., Xiao D., Yu G., Nat. Catal. 2021, 4, 615–622. [Google Scholar]
- 10. Zhao C. X., Liu J. N., Wang J., Wang C., Guo X., Li X. Y., Chen X., Song L., Li B. Q., Zhang Q., Sci. Adv. 2022, 8, eabn5091. [DOI] [PMC free article] [PubMed] [Google Scholar]
- 11. Ma F. X., Liu Z. Q., Zhang G., Fan H. S., Du Y., Zhen L., Xu C. Y., Small 2023, 19, 2207991. [DOI] [PubMed] [Google Scholar]
- 12. Gao Y., Liu B., Wang D., Adv. Mater. 2023, 35, e2209654. [DOI] [PubMed] [Google Scholar]
- 13. Xue W., Zhou Q., Cui X., Zhang J., Zuo S., Mo F., Jiang J., Zhu X., Lin Z., Angew. Chem. Int. Ed. 2023, 62, e202307504. [DOI] [PubMed] [Google Scholar]
- 14. Chen Z., Niu H., Ding J., Liu H., Chen P. H., Lu Y. H., Lu Y. R., Zuo W., Han L., Guo Y., Hung S. F., Zhai Y., Angew. Chem. Int. Ed. 2021, 60, 25404–25410. [DOI] [PubMed] [Google Scholar]
- 15. Zhang Y., Li C., Li J., Liu X., Li G., Li B., Wang L., J. Mater. Chem. A 2023, 11, 11326–11333. [Google Scholar]
- 16. Hu L., Dai C., Chen L., Zhu Y., Hao Y., Zhang Q., Gu L., Feng X., Yuan S., Wang L., Wang B., Angew. Chem. Int. Ed. 2021, 60, 27324–27329. [DOI] [PubMed] [Google Scholar]
- 17. Li L., Huang S., Cao R., Yuan K., Lu C., Huang B., Tang X., Hu T., Zhuang X., Chen Y., Small 2022, 18, 2105387. [DOI] [PubMed] [Google Scholar]
- 18. Zhang S., Hou M., Zhai Y., Liu H., Zhai D., Zhu Y., Ma L., Wei B., Huang J., Small 2023, 19, 2302739. [DOI] [PubMed] [Google Scholar]
- 19. Xiao M., Zhang H., Chen Y., Zhu J., Gao L., Jin Z., Ge J., Jiang Z., Chen S., Liu C., Xing W., Nano Energy 2018, 46, 396–403. [Google Scholar]
- 20. Cui T., Wang Y. P., Ye T., Wu J., Chen Z., Li J., Lei Y., Wang D., Li Y., Angew. Chem. Int. Ed. 2022, 61, e202115219. [DOI] [PubMed] [Google Scholar]
- 21. Ye W., Chen S., Lin Y., Yang L., Chen S., Zheng X., Qi Z., Wang C., Long R., Chen M., Zhu J., Gao P., Song L., Jiang J., Xiong Y., Chem 2019, 5, 2865–2878. [Google Scholar]
- 22. Wei S., Yang R., Wang Z., Zhang J., Bu X. H., Adv. Mater. 2024, 36, e2404692. [DOI] [PubMed] [Google Scholar]
- 23. Hu C., Xing G., Han W., Hao Y., Zhang C., Zhang Y., Kuo C. H., Chen H. Y., Hu F., Li L., Peng S., Adv. Mater. 2024, 36, e2405763. [DOI] [PubMed] [Google Scholar]
- 24. Qiao Z., Jiang R., Xu H., Cao D., Zeng X. C., Angew. Chem. Int. Ed. 2024, 63, e202407812. [DOI] [PubMed] [Google Scholar]
- 25. Zhao S. N., Li J. K., Wang R., Cai J., Zang S. Q., Adv. Mater. 2022, 34, 2107291. [DOI] [PubMed] [Google Scholar]
- 26. Wang Z., Jin X., Xu R., Yang Z., Ma S., Yan T., Zhu C., Fang J., Liu Y., Hwang S.‐J., Pan Z., Fan H. J., ACS Nano 2023, 17, 8622–8633. [DOI] [PubMed] [Google Scholar]
- 27. Huang H., Yu D., Hu F., Huang S. C., Song J., Chen H. Y., Li L. L., Peng S., Angew. Chem. Int. Ed. 2022, 61, e202116068. [DOI] [PubMed] [Google Scholar]
- 28. Liu H., Jiang L. Z., Sun Y. Y., Khan J., Feng B., Xiao J. M., Zhang H. D., Xie H. J., Li L. N., Wang S. Y., Han L., Adv. Energy Mater. 2023, 13, 2301223. [Google Scholar]
- 29. Ban J., Xu H., Cao G., Fan Y., Pang W. K., Shao G., Hu J., Adv. Funct. Mater. 2023, 33, 2300623. [Google Scholar]
- 30. Li Q., Zhao J., Li P., Xu Z., Feng J., Chen B., Liu R., ACS Nano 2024, 18, 21975–21984. [DOI] [PubMed] [Google Scholar]
- 31. Han A., Sun W., Wan X., Cai D., Wang X., Li F., Shui J., Wang D., Angew. Chem. Int. Ed. 2023, 62, e202303185. [DOI] [PubMed] [Google Scholar]
- 32. Wan X., Liu Q., Liu J., Liu S., Liu X., Zheng L., Shang J., Yu R., Shui J., Nat. Commun. 2022, 13, 2963. [DOI] [PMC free article] [PubMed] [Google Scholar]
- 33. Liu Z. Q., Liang X., Ma F. X., Xiong Y. X., Zhang G., Chen G., Zhen L., Xu C. Y., Adv. Energy Mater. 2023, 13, 2203609. [Google Scholar]
- 34. Chen Y., Wang P., Hao H., Hong J., Li H., Ji S., Li A., Gao R., Dong J., Han X., Liang M., Wang D., Li Y., J. Am. Chem. Soc. 2021, 143, 18643–18651. [DOI] [PubMed] [Google Scholar]
- 35. Al‐Hilfi S. H., Jiang X., Heuer J., Akula S., Tammeveski K., Hu G., Yang J., Wang H. I., Bonn M., Landfester K., Müllen K., Zhou Y., J. Am. Chem. Soc. 2024, 146, 19886–19895. [DOI] [PMC free article] [PubMed] [Google Scholar]
- 36. Wang S., Ding T., Liu T., Zhu Y., Tao Z., Pang B., Liu X., Luo Q., Sun M., Sheng H., Zhu M., Yao T., Angew. Chem. Int. Ed. 2023, 62, e202218630. [DOI] [PubMed] [Google Scholar]
- 37. Li J., Zhang H., Samarakoon W., Shan W., Cullen D. A., Karakalos S., Chen M., Gu D., More K. L., Wang G., Feng Z., Wang Z., Wu G., Angew. Chem. Int. Ed. 2019, 58, 18971–18980. [DOI] [PubMed] [Google Scholar]
- 38. Wei S., Li A., Liu J. C., Li Z., Chen W., Gong Y., Zhang Q., Cheong W. C., Wang Y., Zheng L., Xiao H., Chen C., Wang D., Peng Q., Gu L., Han X., Li J., Li Y., Nat. Nanotechnol. 2018, 13, 856–861. [DOI] [PubMed] [Google Scholar]
- 39. Ma F. X., Liu Z. Q., Zhang G. B., Xiong Y. X., Zhang M. T., Zheng L. R., Zhen L., Xu C. Y., Small 2022, 18, 2205033. [DOI] [PubMed] [Google Scholar]
- 40. Wang Q., Ina T., Chen W. T., Shang L., Sun F., Wei S., Sun‐Waterhouse D., Telfer S. G., Zhang T., Waterhouse G. I. N., Sci. Bull. 2020, 65, 1743–1751. [DOI] [PubMed] [Google Scholar]
- 41. Wu Q., Jia Y., Liu Q., Mao X., Guo Q., Yan X., Zhao J., Liu F., Du A., Yao X., Chem 2022, 8, 2715–2733. [Google Scholar]
- 42. Han G.‐F., Li F., Rykov A. I., Im Y.‐K., Yu S.‐Y., Jeon J.‐P., Kim S.‐J., Zhou W., Ge R., Ao Z., Nat. Nanotechnol. 2022, 17, 403–407. [DOI] [PubMed] [Google Scholar]
- 43. Xiao M., Chen Y., Zhu J., Zhang H., Zhao X., Gao L., Wang X., Zhao J., Ge J., Jiang Z., Chen S., Liu C., Xing W., J. Am. Chem. Soc. 2019, 141, 17763–17770. [DOI] [PubMed] [Google Scholar]
- 44. Ji S., Mou Y., Liu H., Lu X., Zhang Y., Guo C., Sun K., Liu D., Horton J. H., Wang C., Wang Y., Li Z., Adv. Mater. 2024, 36, 2410121. [DOI] [PubMed] [Google Scholar]
- 45. Peng L., Yang J., Yang Y., Qian F., Wang Q., Sun‐Waterhouse D., Shang L., Zhang T., Waterhouse G. I. N., Adv. Mater. 2022, 34, 2202544. [DOI] [PubMed] [Google Scholar]
- 46. Huang Z., Li M., Yang X., Zhang T., Wang X., Song W., Zhang J., Wang H., Chen Y., Ding J., Hu W., J. Am. Chem. Soc. 2024, 146, 24842–24854. [DOI] [PubMed] [Google Scholar]
- 47. Lyu L., Hu X., Lee S., Fan W., Kim G., Zhang J., Zhou Z., Kang Y.‐M., J. Am. Chem. Soc. 2024, 146, 4803–4813. [DOI] [PubMed] [Google Scholar]
- 48. Sui R., Liu B., Chen C., Tan X., He C., Xin D., Chen B., Xu Z., Li J., Chen W., Zhuang Z., Wang Z., Chen C., J. Am. Chem. Soc. 2024, 146, 26442–26453. [DOI] [PubMed] [Google Scholar]
- 49. Deringer V. L., Tchougréeff A. L., Dronskowski R., J. Phys. Chem. A 2011, 115, 5461–5466. [DOI] [PubMed] [Google Scholar]
- 50. Dai Y., Liu B., Zhang Z., Guo P., Liu C., Zhang Y., Zhao L., Wang Z., Adv. Mater. 2023, 35, 2210757. [DOI] [PubMed] [Google Scholar]
- 51. Yuan L. J., Liu B., Shen L. x., Dai Y. K., Li Q., Liu C., Gong W., Sui X. L., Wang Z. B., Adv. Mater. 2023, 35, 2305945. [DOI] [PubMed] [Google Scholar]
- 52. Liu Y., Yuan S., Sun C., Wang C., Liu X., Lv Z., Liu R., Meng Y., Yang W., Feng X., Adv. Energy Mater. 2023, 13, 2302719. [Google Scholar]
Associated Data
This section collects any data citations, data availability statements, or supplementary materials included in this article.
Supplementary Materials
Supporting Information
Data Availability Statement
The data that support the findings of this study are available in the Supporting Information of this article.