Abstract
Studies on monozygotic twins with concordant leukemia and retrospective scrutiny of neonatal blood spots of patients with leukemia indicate that chromosomal translocations characteristic of pediatric leukemia often arise prenatally, probably as initiating events. The modest concordance rate for leukemia in identical twins (≈5%), protracted latency, and transgenic modeling all suggest that additional postnatal exposure and/or genetic events are required for clinically overt leukemia development. This notion leads to the prediction that chromosome translocations, functional fusion genes, and preleukemic clones should be present in the blood of healthy newborns at a rate that is significantly greater than the cumulative risk of the corresponding leukemia. Using parallel reverse transcriptase–PCR and real-time PCR (Taqman) screening, we find that the common leukemia fusion genes, TEL-AML1 or AML1-ETO, are present in cord bloods at a frequency that is 100-fold greater than the risk of the corresponding leukemia. Single-cell analysis by cell enrichment and immunophenotype/fluorescence in situ hybridization multicolor staining confirmed the presence of translocations in restricted cell types corresponding to the B lymphoid or myeloid lineage of the leukemias that normally harbor these fusion genes. The frequency of positive cells (10−4 to 10−3) indicates substantial clonal expansion of a progenitor population. These data have significant implications for the pathogenesis, natural history, and etiology of childhood leukemia.
Chimeric fusion genes generated by chromosomal translocations are consistent genetic abnormalities in pediatric acute leukemia (1–3). DNA breaks and fusions occur in introns, and each patient's leukemic cells have a unique or clonotypic breakpoint, providing a specific, sensitive, and stable marker for tracking leukemic clones (4). Using this approach in identical twins with concordant leukemia (5–7) and, retrospectively, with neonatal blood spots (8–10), it was demonstrated that common fusion genes—MLL fusions in infants with acute lymphoblastic leukemia (ALL) and TEL-AML1 and AML1-ETO in children with ALL or acute myeloblastic leukaemia (AML), respectively—arise predominantly in utero, probably as initiating events, and are present before and at birth in circulating blood.
The evolutionary, clonal development of pediatric cancers involves a sequence of two or more independent genetic events (11), and it therefore is unlikely that fusion genes, initiating the disease, would be sufficient. This supposition is supported by the modest concordance rate for ALL in monozygotic twin children, 5–10% (12), by protracted postnatal latency (up to 14 years) (7) and by the absence of overt signs of leukemia in mice transgenic for AML1-ETO (13) or TEL-AML1 (14). This finding leads to the prediction that chromosomal translocations, functional fusion genes, and preleukemic clones should be generated in stem cells during fetal hemopoiesis, and present in blood at birth, at a rate that substantially exceeds the known incidence rate or cumulative risk of ALL or AML. The latter figures are ≈1 in 2,000 for any type of acute leukemia (0–15 years); ≈1 in 10,000 for ALL with TEL-AML1, and ≈1 in 80,000 for AML with AML1-ETO (calculated from reported frequencies for these fusion genes in leukemia and the overall incidence rates of ALL and AML in the United States and Europe).
We tested this prediction by screening a large series of newborn cord blood samples by two independent assays: reverse transcriptase (RT)-PCR using nested primers and Taqman real-time quantitative PCR (15). By screening aliquots of the cDNA product of small-sized samples (1 ml/≈106 cells) and setting thresholds of positivity calculated (by Taqman) to be 10−5 or above, we reasoned that positive samples would have functional, in-frame fusion genes with clonally expanded cells. At the same time, this conservative approach should filter out any low-frequency translocation products that were nonfunctional because they were either out of frame or had not arisen in the appropriate stem cell types to endow clonal advantage. We assume that such “silent” events occur much more frequently than functional rearrangements. We took all possible steps to avoid contamination in RT-PCR tests (16) but, in addition, we sought to confirm the presence of fusion gene positivity at the single-cell level by interphase fluorescence in situ hybridization (FISH). The latter approach also allowed us to make two further predictions. First, that if functional, fusion genes should be present predominantly, if not exclusively, in the same cell types or lineages, as in the corresponding leukemia—i.e., TEL-AML1 in the B cell lineage, AML1-ETO in myeloid cells. We assessed this prediction by cell enrichment and multicolor immunophenotyping/FISH analysis of single cells. Second, in contrast to ALL cells with TEL-AML1 fusion that frequently have deletions of the normal TEL allele as a secondary genetic abnormality (17, 18), all putative preleukemic cells in cord blood with TEL-AML1 fusion should retain the normal copy of the TEL allele on 12p.
Materials and Methods
Cord Blood Samples.
Cord blood samples, derived from umbilical cord, were collected from two centers (London Cord Blood Bank and Bristol Transplantation Unit) as part of a program for clinical research and transplantation. Ethical approval for use in this project was obtained. One-milliliter aliquots of mononuclear cells previously stored in liquid nitrogen were thawed for use.
RNA Isolation and cDNA Synthesis.
Total RNA was extracted by using TRIzol reagent (GIBCO/BRL) according to the instructions of the manufacturer. cDNA was generated from 4 μg of total RNA by using random hexamers in a final volume of 40 μl.
RT-PCR.
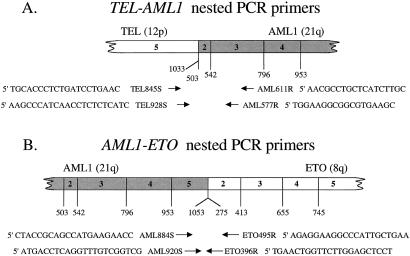
Integrity of cDNA was assessed by amplification of β2-microglobulin, and TEL-AML1 and AML1-ETO fusions were amplified by nested RT-PCR (see Fig. 1). For TEL-AML1, 2 μl of cDNA was amplified in 50 μl of PCR mixture with 1.25 units HotStar TaqDNA polymerase (Qiagen, Chatsworth, CA) and 50 pmol of each primer, as described by the manufacturer. The reaction conditions were an initial activation step at 95°C for 15 min, followed by 35 cycles of 30 s at 94°C, 30 s at 60°C, 60 s at 72°C, with a 10-min final extension at 72°C. One microliter of first-round PCR products was reamplified under the conditions described above. For AML1-ETO, 2 μl of cDNA was also amplified essentially as above. PCR products were separated on 2.0% agarose gels and sequenced directly with the same primers used in the PCR.
Figure 1.
Schematic diagram of fusion transcripts and the relative location of amplification primers (arrows) for TEL-AML1 (A) and AML1-ETO (B).
Taqman PCR.
The primers and probes for TEL-AML1 and AML1-ETO were designed with primer-express software (Applied Biosystems) as follows: TEL-AML1 forward, 5′-TGTCTCCCCGCCTGAAGA-3′; TEL-AML1 reverse, 5′-TCGTGGACGTCTCTAGAAGGATT-3′; TEL-AML1 detection probe, 5′-FAM CATTCCAAGTATGCATTCTGCTATTCTCCCAA-3′-TAM; AML1-ETO forward, 5′-CACCTACCACAGAGCCATCAAA-3′; AML1-ETO reverse, 5′-ATCCACAGGTGAGTCTGGCATT-3′; AML1-ETO detection probe, 5′-FAM CCCGAGAACCTCGAAATCGTACTGAGAAGC-3′-TAM. β2-microglobulin as an internal control was amplified by using a commercially available kit (β2-microglobulin primers and VIC-labeled probe, Applied Biosystems) at the same time. The PCR mix contained 1 μl cDNA template, 1× Taqman buffer A, 8% glycerol, 5 mM MgCl2, 200 μM each of dATP, dCTP, and dGTP, 400 μM dUTP, 1.25 units AmpliTaq Gold DNA polymerase, 0.25 units AmpErase UNG, 300 nM each of the primers for TEL-AML1 and 100 nM TEL-AML1 probe or 900 nM each of the primers for AML1-ETO and 200 nM AML1-ETO probe in a total volume of 25 μl. Standard reactions were performed by using an Applied Biosystems PRISM 7700 Sequence Detection System. All experiments were carried out in triplicate.
Isolation of Cell Populations from Cord Blood.
Subpopulations of cells were positively enriched by using either a flow sorter (Becton Dickinson, Facs Vantage) or standard immunomagnetic, MACS system protocol (Miltenyi Biotec, Bisley, Surrey, U.K.). For flow sorting, cells were labeled with one of the following fluorochrome-labeled primary antibodies of mouse IgG1 isotype (Dako): CD3 (UCHT1), CD19 (HD37), CD14 (UCHM-1), CD10 (SS2/36), and CD34 (QBend10). For immunomagnetic cell enrichment, the same unlabeled primary antibodies were used followed by magnetic labeling with rat anti-mouse IgG1 microbeads and enrichment on a positive section column. In the majority of cases the negative fraction of cells was also saved, subfractionated, and labeled with antibodies not used for the primary enrichment. Immunomagnetically selected cells were then used for combined or triple-color immunophenotype/FISH analysis.
Fluorescence Immunophenotype/FISH.
Cells were fixed in acetone. Cells already labeled with antibody for enrichment (CD10, CD19) were further labeled with anti-mouse biotin followed by AvidinDAMCA (for blue coloration). Cells enriched negatively as CD10− or CD19− were first stained with a CD13/CD33 mouse mAb mixture followed by biothylated anti-mouse Ig and AvidinDAMCA or with mouse mAbs to human κ light chain or human λ light chain. After antibody staining, slides were hybridized with commercial (Vysis, Downes Grove, IL) TEL-AML1 or AML1-ETO FISH probes by using the recommended protocol first verified as providing the expected signals on leukemic cell lines. Cells were analyzed with a Zeiss Axioskop fluorescence microscope equipped with epi-fluorescence and a triple band pass filter. Images were captured by using a charge-coupled device camera (Photometrics, Tucson, AZ) and smartcapture software (Digital Scientific, Cambridge, U.K.). With the LSI TEL-AML1 ES dual-color translocation probe (Vysis), the expected signal pattern for a normal cell nucleus is two green and two red signals, corresponding to two normal copies each of TEL and AML1. This probe set contains a 350-kb probe for the 5′ end of TEL (exons 1–4) and a ≈500-kb probe covering the entire AML1 gene. The expected signal pattern for a t(12;21) cell nucleus is one green (normal TEL), two red (normal AML1 and residual AML1), and one red-green (yellow) fusion signal. The two red signals are of different sizes, the larger one corresponding to the normal AML1 and the smaller to the 5′ portion of AML1 that is translocated to the der(12).
Using the LSI AML1 ETO dual-color, dual fusion translocation probe (Vysis), the expected normal pattern for a normal cell nucleus is two green and two red signals corresponding to two normal copies each of AML1 and ETO. In this probe mixture, both the AML1 and ETO probes span the entire gene. In a cell containing the t(8;21), this probe set therefore results in two fusion signals, corresponding to both the AML1-ETO and the reciprocal ETO-AML1 fusion, as well as one normal copy each of AML1 and ETO. The expected signal pattern for a t(8;21) cell nucleus is one red (normal ETO), one green (normal AML1), and two red-green (yellow) fusion signals.
Results
Presence of Bona Fide Fusion Gene mRNA in Normal Cord Samples.
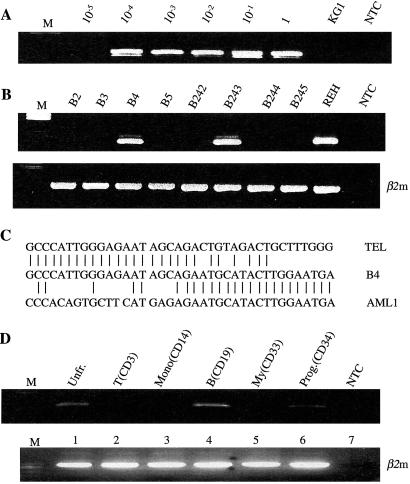
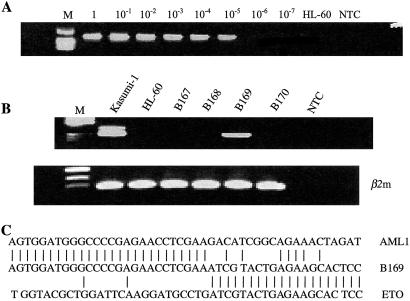
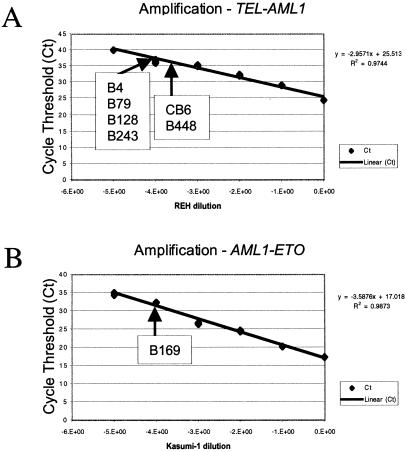
Cord blood cDNA samples were screened by RT-PCR for TEL-AML1 and AML1-ETO with the nested primers shown in Fig. 1. Of 567 samples screened for TEL-AML1, six (≈1%) were positive (Fig. 2B). A total of 496 samples were screened for AML1-ETO and one was positive (Fig. 3B). RT-PCR-generated amplicons were of the anticipated size for the major mRNA product of the in-frame fusion genes: 181 bp for TEL-AML1 and 260 bp for AML1-ETO, as observed in leukemic cells. They were verified as bona fide by sequencing (Figs. 2C and 3C). All samples were further assessed on a separate aliquot of the original cDNA preparation with Taqman probes. There were seven positive results in Taqman assays and these were the same seven samples (six for TEL-AML1, one for AML1-ETO) that scored positively by RT-PCR. From the standardized Taqman curves obtained with TEL-AML1 cell line (REH) and an AML1-ETO cell line (Kasumi 1), it was possible to determine the approximate frequency of cells in cord blood that were fusion gene mRNA positive (Fig. 4). This frequency was calculated to be between 10−3 and 10−4.
Figure 2.
Detection of TEL-AML1 fusion transcripts in normal cord blood samples by nested RT-PCR. (A) TEL-AML1-positive control cells (REH leukemic cell line) were serially diluted in negative cells (KG1 leukemic cell line). NTC was no template control. Sensitivity of detection of TEL-AML1 transcripts was 10−4. (B) Representative screening results (second-round RT-PCR) for TEL-AML1 fusion transcripts in cord blood. Two samples (B4, B243) were TEL-AML1 positive and six samples (B2, B3, B5, B242, B244, and B245) were negative. β2m, β2-microglobulin controls. (C) Representative fusion sequence of TEL-AML1-positive sample (B4). (D) RT-PCR analysis of different cell fractions from a TEL-AML1-positive cord blood (B4). β2-microglobulin (β2m) used as positive control. NTC was no template control.
Figure 3.
Detection of AML1-ETO fusion transcripts in normal cord blood samples by nested RT-PCR. (A) AML1-ETO-positive control cells (Kasumi-1 leukemic cell line) were serially diluted in negative cells (HL-60 cell line). NTC was no template control. Sensitivity of detection of AML1-ETO transcripts was 10−5. (B) Representative screening results (second-round RT-PCR) for AML1-ETO fusion transcripts. One cord blood sample (B169) was positive and three others shown here (B167, B168, B170) were negative. NTC was no template control. β2m, β2-microglobulin controls. (C) Sequence of AML1-ETO derived from B169 cord blood cells.
Figure 4.
Detection of TEL-AML1 and AML1-ETO fusion transcripts in normal cord blood samples by real-time quantitative PCR (Taqman). Shown is a linear detection of TEL-AML1 (A) and AML1-ETO (B) fusion transcripts (in REH and Kasumi-1 cell lines, respectively) over at least four and five logs, respectively. This assay could detect one TEL-AML1-positive cell in a background of 10,000 negative cells and one AML1-ETO-positive cell in a background of 100,000 negative cells. Cycle threshold values and positive cord bloods indicated with B or C numbers were used to calculate appropriate cell frequency (10−3 to 10−4) from standard.
Fusion Genes Are Present in Selective Cell Types and Lineages of Cord Blood.
In one TEL-AML1-positive cord blood (B4), the original frozen unit was accessed to fractionate mononuclear cells into major cell types and lineages by using mAbs and FACS. RT-PCR and Taqman screening confirmed positivity in the unfractionated mononuclear cell population. CD19+ (B cell lineage) and CD34+ (stem/progenitor) cells were also positive (Fig. 2D). In contrast, there were no detectable amplicons in replicate (3–6 in total) samples of myeloid (CD33+), T (CD3+), or monocytic (CD14+) cells. This pattern of selectivity is in accord with the early B lineage immunophenotype of leukemic cells with TEL-AML1.
In three additional TEL-AML1-positive cases and the one AML1-ETO-positive case, it was possible to retrieve sufficient viable cells from the remainder of the initial cord blood units to fractionate different cell types for analysis by FISH. Cells were separated with micromagnetic beads, antibody-fluorochrome stained, and then analyzed by FISH with dual-color probes for fusion genes.
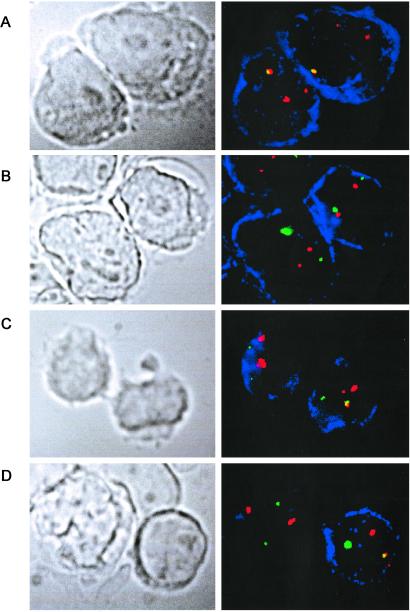
The pattern of FISH staining usually observed in leukemic blasts from patients with ALL is as shown in Fig. 5A. The REH cell line is typical of t(12;21) positive leukemias in having lost the normal TEL allele, giving the typical FISH pattern of one TEL-AML1 fusion (yellow) and two AML1 (red) signals only. The simultaneous presence of both the yellow fusion signal and the two different-sized red AML1 signals (representing the normal AML1 allele and the small 5′ region of AML1 translocated to chromosome 12) was taken as the most secure marker for TEL-AML1 positivity in normal cord blood. Table 1 lists the data obtained, and Fig. 5 illustrates examples of cells observed.
Figure 5.
Identification of TEL-AML1 fusion gene-positive cells in cord blood (B128) by immunophenotype/FISH analysis. In each case the fluorescent signal corresponding to the TEL probe is green, the AML1 probe is red, and the fused red-green signals corresponding to the TEL-AML1 fusion appear yellow. The cells positive for the corresponding immunophenotype are stained blue. (A) Positive control leukemic cell line REH, stained for CD10. Both CD10-positive cells show one fusion and two separate red signals. The smaller red signal corresponds to the translocated 5′ portion of the disrupted AML1 gene, and the larger red signal to the normal AML1 allele. Note that the green signal is absent because of deletion of the normal TEL allele in this cell line (as in most cases of ALL with TEL-AML1 fusion). (B) Negative control cell line Nalm 6, stained for CD10. Both CD10-positive cells show two green and two similar-size red signals, corresponding to two normal copies of TEL and AML1. (C) CD10-positive sorted cord blood (B128) cells. (Right) The cell shows one green, two different-sized red, and one (yellow) fusion signal, the expected signal configuration for a TEL-AML1-positive cell. The green (normal TEL) signal is present. (Left) The cell shows two green and two similar-sized red signals, corresponding to two normal copies of TEL and AML1. There is no fusion signal. (D) CD10−/CD34− cord blood cells stained for Ig κ. The κ-positive blue cell (Right) shows one yellow fusion, one green, and two different-sized red signals, the expected pattern for a TEL-AML1-positive cell. The normal TEL signal is present in this cell. The other cell (κ negative) shows two normal copies of TEL and AML1. (Magnifications: ×1,500.)
Table 1.
Identification of TEL-AML1 or AML1-ETO fusion by FISH
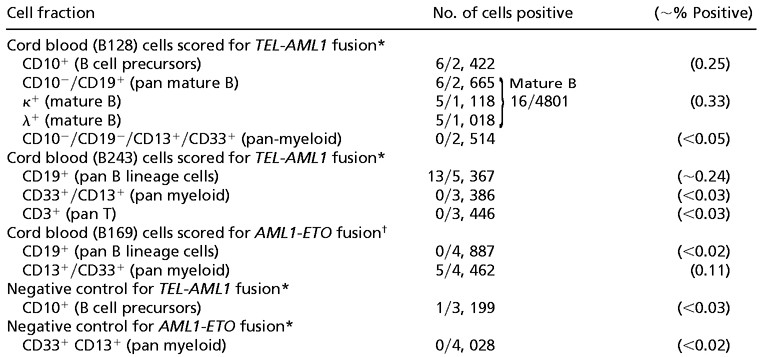 |
Only cells with a fusion and an extra AML1 signal (2R1G1F) were scored as TEL-AML1 fusion positive. A third TEL-AML1-positive cord blood (B79) was also assessed by immunophenotype/FISH. In this case, although 1% of CD10-positive B cell precursors had a TEL-AML1 fusion signal, the extra AML1 signal was not seen. This is a recognized problem with the TEL-AML1 ES probe (Vysis), which can be ascribed to the poorer hybridization efficiency for the smaller 5′ translocated AML1 segment (C. Harrison, personal communication). However, it means that we cannot unequivocally distinguish true “fusion positive” red-green fused signals from coincidental overlap that is observed at low levels in normal controls.
Only cells with two fusion signals (1R1G2F) were scored as AML1-ETO fusion positive.
In cord blood B128, both CD10+ B cell precursors (Fig. 5C) and κ or λ Ig light chain-positive mature B cells (CD10−/CD19+ κ/λ+) (Fig. 5D) were TEL-AML1 fusion positive at a level of 0.25–0.33%. These cells also had two different-sized (red) AML1 signals and retained the normal TEL allele (green signal in Fig. 5 C and D). No myeloid (CD13+/CD33+) cells were positive in 2,514 cells scored. Similarly, in sample B243, TEL-AML1-positive cells were present in the CD19-positive B cell lineage but absent from both T and myeloid cells (Table 1). In a control cord blood, negative for TEL-AML1 transcripts, 3,199 cells in a CD10-positive fraction were scored and only one cell had both a fused red-green TEL-AML1 signal plus two different-sized red (AML1) signals.
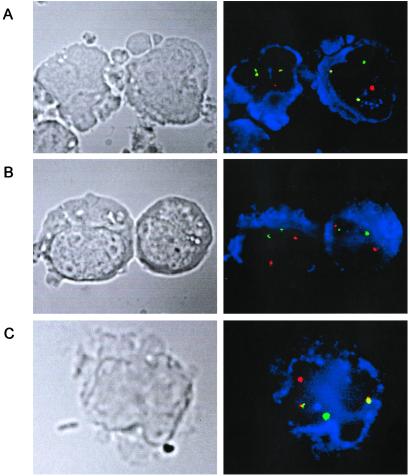
In cord blood B169 positive for AML1-ETO, the presence of fusion gene-positive cells at a level of ≈0.1% of CD33+/CD13+ myeloid cells was identified by immunophenotype/FISH analysis with each positive cell having two fusion signals—i.e., reciprocal translocations (Table 1; Fig. 6C). No CD19+ B lymphoid cells were AML1-ETO positive. In a control cord blood sample, negative for AML1-ETO transcripts, there were no cells in 4,028 CD33+/CD13+ cells assessed with two fusion gene signals.
Figure 6.
Identification of AML1-ETO fusion gene-positive cells in cord blood (B169) by immunophenotype FISH analysis. In each case the fluorescent signal corresponding to the AML1 probe is red and the ETO probe is green. The cells positive for the respective immunophenotypes are stained blue. (A) Positive t(8;21) cell line Kasumi. Both CD13/CD33-positive cells show two red-green (yellow) fusion signals, corresponding to the AML1-ETO and ETO-AML1 gene fusions, in addition to the single green and red signals of the normal AML1 and ETO alleles. (B) t(8;21) negative control: Epstein–Barr virus-transformed normal blood lymphocytes stained for CD19. Both cells show two normal copies each of AML1 and ETO. (C) Cord blood sorted mononuclear cells stained for CD13/CD33. The CD13/CD33-positive cell shown has one red, one green, and two yellow fusion signals, consistent with the presence of the t(8;21). (Magnifications: ×1,500.)
Discussion
These data confirm our prediction that cord blood cells in some individuals should express bona fide TEL-AML1 and AML1-ETO fusion genes derived via chromosome translocation and that the number of such positive samples should exceed by at least 10- to 20-fold the cumulative risk of leukemia. The frequency of fusion gene-positive cord bloods we find (1%) to be approximately 100 times the cumulative frequency of overt, clinically diagnosed leukemia with the same fusion gene. We favor the view that the fusion gene-positive cells represent expanded clones of preleukemic cells that will remain pathologically and clinically silent or covert in the absence of additional, postnatal genetic hits. This interpretation is endorsed by murine model systems in which TEL-AML1 or AML1-ETO transgenes are insufficient by themselves to produce leukemia (13, 14, 19) and by variable and protracted postnatal latency (up to 14 years) as revealed by studies on identical twins (6, 7, 9) and neonatal blood spots (9).
The possible preleukemic nature of the cells we identified with fusion genes in cord blood is supported by the finding that they are present at estimated frequencies (10−3 to 10−4) that suggest significant clonal expansion. A preleukemic cell frequency in a positive cord blood of 10−3 to 10−4 mononuclear cells is credible as it corresponds to the estimated range of fusion gene-positive cells in the archived neonatal blood spots of children with TEL-AML1-positive ALL (9). Additionally, the fusion gene products detected are all in-frame and therefore potentially producing functional protein. We assume, but have not attempted to show, that these fusion genes are functionally distilled (i.e., by clonal selection) from a far higher rate of breaks occurring in the same genes, in a higher proportion (if not all) of developing fetuses, but that do not generate functional chimaeric protein or arise in the “appropriate” cell context for leukemogenesis.
The leukemic blasts in ALL with TEL-AML1 fusion have B cell precursor phenotypes (CD10+/CD19+) in apparent differentiation arrest (20). Cells with TEL-AML1 fusion in normal cord blood were also exclusively B cell lineage that would accord with a preleukemic (pre-ALL) status but included both precursors (CD10+) and mature (κ/λ+) B cells. This finding suggests that putative preleukemic clones with TEL-AML1 fusion, in contrast to overtly leukemic cells, are still capable of terminal differentiation. The presence of both κ and λ light chain-positive cells might suggest that the TEL-AML1 fusion was nonclonal, but the data are also compatible with the more likely possibility that the chromosomal translocation occurred in a single B lineage progenitor or stem cell whose progeny cells could selectively rearrange either κ or λ genes. These data accord with an origin of childhood B cell precursor/common ALL in a B lineage restricted stem cell. However, we cannot exclude that the chromosome translocation, t(12;21) originates in a multipotential (lymphomyeloid) stem cell with preferential clonal expansion in the B lymphoid lineage. This same caveat applies to the selectivity we observed of AML1-ETO fusion for myeloid cells in cord blood. Indeed, there is evidence that AML1-ETO may arise in lymphomyeloid stem cells (21).
As anticipated, all putative preleukemic cells in normal cord blood with TEL-AML1 fusion retain the normal TEL allele. This finding accords with observations based on FISH and microsatellite loss of heterozygosity, indicating that TEL deletions are subclonal or secondary to TEL-AML1 fusion in ALL (17, 18, 22) and are probably postnatal events (18).
There have been earlier reports of leukemia fusions in normal individuals but their functional significance is doubtful. A study suggesting that MLL-AF4 fusion genes characteristic of infant ALL were detectable, by RT-PCR, in an exceptionally high frequency (≈25%) of newborn blood samples (23) was not subsequently confirmed by ourselves and others (24, 25). RT-PCR screening for infrequent cells or low copy number mRNA is vulnerable to problems with contamination. The test is generic and does not distinguish clone-specific products. In the current study, the use of isolated laboratory facilities, parallel RT-PCR, and Taqman screening followed by FISH effectively resolves this potential concern for TEL-AML1 and AML1-ETO fusions. Other examples of leukemia fusion gene products in normal individuals appear to be real but functionally trivial. BCR-ABL mRNA, the fusion gene product of the Philadelphia chromosome associated with chronic myelogenous leukemia and ALL, is detectable in the blood of a high proportion of normal adults (26, 27). However, the extraordinarily low copy number in positive samples [5–20 copies of BCR-ABL mRNA per 5 × 10⁷–108 cells or less than 10 positive cells per 108 (26, 27)] suggests that these rearrangements are almost certainly not arising in the stem cell compartment with consequent clonal expansion.
The t(14;18) BCL2-IGH translocation associated with follicular lymphoma is also detectable in the blood cells of a substantial fraction of normal adults, increasing in prevalence with age (28, 29). The functional relevance of these data to the natural history of lymphoma is unclear. In part, the remarkably common occurrence of this particular rearrangement may reflect the intrinsic genomic instability of mature lymphocytes (30) and the propensity of immunoglobulin/T cell receptor recombinases to promote illegitimate recombinants (31).
The frequency of newborn individuals we find with cells expressing a bona fide leukemia fusion gene may have parallels in other pediatric cancers. The frequency we find for TEL-AML1 is approximately the same (≈1%, 100 times the disease incidence rate) as that recorded for putative premalignant lesions, defined at autopsy by histopathology, resembling neuroblastoma (32), and Wilm's tumor (nephrogenetic rests) (33). This finding suggests that several common pediatric cancers may be initiated at a high rate but with a low risk (≈1 in 100) of penetrance to full malignancy. These data accord with the classical “two-hit” model of Knudson for noninheritable cancers in childhood (11), but additionally provide, perhaps surprising, insight into how often premalignant clones arise during normal fetal development. If our data were to apply to all subtypes of pediatric leukemia, then it follows that around 5% or 1 in 20 children are born with preleukemic clones—i.e., 100 times the cumulative frequency of 1 in 2,000 for leukemia before the age of 15 years (34). An important corollary is that major rate-limiting events in the emergence of pediatric cancer would appear to be later-stage promotional exposures and/or associated secondary genetic alterations.
There are other implications for etiological mechanisms in childhood leukemia. Genomic sequences of TEL-AML1 and AML1-ETO fusions suggest that they are probably generated by error-prone nonhomologous end-joining (4, 35), the prevalent normal repair process for double-stranded DNA breaks in mammalian chromosomes (36). Whatever exogenous or endogenous DNA damaging exposures actually initiate these chromosome translocations in the fetus, they are likely to be relatively common.
These insights derived from cord blood may also have important practical implications for clinical management of children with leukemia. Presumptive preleukemic cells might well coexist with overt leukemic blasts at diagnosis, survive chemotherapy (21), and occasionally spawn later relapses (22). If so, then this work has implications for PCR-based monitoring of minimal residual disease and for our understanding of the biological basis of cure and relapse in leukemia. Additionally, these data raise some safety concerns about the use of stored cord blood for transplantation purposes, particularly in an autologous setting for leukemia patients (37).
Acknowledgments
We thank Drs. M.-H. Kim for pilot studies, I. Titley for flow sorting, and L. Kearney for helpful criticisms of the manuscript. This work was supported by the Kay Kendall Leukaemia Fund (to H.M. and M.G.) and the Leukaemia Research Fund (to M.G., S.M.C., L.E.H., A.M.F., C.D., and J.M.H.).
Abbreviations
- ALL
acute lymphoblastic leukemia
- AML
acute myeloblastic leukemia
- RT
reverse transcriptase
- FISH
fluorescence in situ hybridization
References
- 1.Rowley J D. Annu Rev Genet. 1998;32:495–519. doi: 10.1146/annurev.genet.32.1.495. [DOI] [PubMed] [Google Scholar]
- 2.Rabbitts T H. Nature (London) 1994;372:143–149. doi: 10.1038/372143a0. [DOI] [PubMed] [Google Scholar]
- 3.Look A T. Science. 1997;278:1059–1064. doi: 10.1126/science.278.5340.1059. [DOI] [PubMed] [Google Scholar]
- 4.Wiemels J L, Greaves M. Cancer Res. 1999;59:4075–4082. [PubMed] [Google Scholar]
- 5.Ford A M, Ridge S A, Cabrera M E, Mahmoud H, Steel C M, Chan L C, Greaves M F. Nature (London) 1993;363:358–360. doi: 10.1038/363358a0. [DOI] [PubMed] [Google Scholar]
- 6.Ford A M, Bennett C A, Price C M, Bruin M C A, Van Wering E R, Greaves M. Proc Natl Acad Sci USA. 1998;95:4584–4588. doi: 10.1073/pnas.95.8.4584. [DOI] [PMC free article] [PubMed] [Google Scholar]
- 7.Wiemels J L, Ford A M, Van Wering E R, Postma A, Greaves M. Blood. 1999;94:1057–1062. [PubMed] [Google Scholar]
- 8.Gale K B, Ford A M, Repp R, Borkhardt A, Keller C, Eden O B, Greaves M F. Proc Natl Acad Sci USA. 1997;94:13950–13954. doi: 10.1073/pnas.94.25.13950. [DOI] [PMC free article] [PubMed] [Google Scholar]
- 9.Wiemels J L, Cazzaniga G, Daniotti M, Eden O B, Addison G M, Masera G, Saha V, Biondi A, Greaves M F. Lancet. 1999;354:1499–1503. doi: 10.1016/s0140-6736(99)09403-9. [DOI] [PubMed] [Google Scholar]
- 10.Wiemels J L, Xiao Z, Buffler P A, Maia A T, Ma X, Dicks B M, Smith M T, Feusner J, Wiencke J K, Pritchard-Jones K, et al. Blood. 2002;99:3801–3805. doi: 10.1182/blood.v99.10.3801. [DOI] [PubMed] [Google Scholar]
- 11.Knudson A G. Nat Rev Cancer. 2001;1:157–162. doi: 10.1038/35101031. [DOI] [PubMed] [Google Scholar]
- 12.Buckley J D, Buckley C M, Breslow N E, Draper G J, Roberson P K, Mack T M. Med Pediatr Oncol. 1996;26:223–229. doi: 10.1002/(SICI)1096-911X(199604)26:4<223::AID-MPO1>3.0.CO;2-L. [DOI] [PubMed] [Google Scholar]
- 13.Rhoades K L, Hetherington C J, Harakawa N, Yergeau D A, Zhou L, Liu L-Q, Little M-T, Tenen D G, Zhang D-E. Blood. 2000;96:2108–2115. [PubMed] [Google Scholar]
- 14.Andreasson P, Schwaller J, Anastasiadou E, Aster J, Gilliland D G. Cancer Genet Cytogenet. 2001;130:93–104. doi: 10.1016/s0165-4608(01)00518-0. [DOI] [PubMed] [Google Scholar]
- 15.Seeger K, Kreuzer K-A, Lass U, Taube T, Buchwald D, Eckert C, Körner G, Schmidt C-A, Henze G. Cancer Res. 2001;61:2517–2522. [PubMed] [Google Scholar]
- 16.Kwok S, Higuchi R. Nature (London) 1989;339:237–238. doi: 10.1038/339237a0. [DOI] [PubMed] [Google Scholar]
- 17.Raynaud S, Cavé H, Baens M, Bastard C, Cacheux V, Grosgeorge J, Guidal-Giroux C, Guo C, Vilmer E, Marynen P, Grandchamp B. Blood. 1996;87:2891–2899. [PubMed] [Google Scholar]
- 18.Maia A T, Ford A M, Jalali G R, Harrison C J, Taylor G M, Eden O B, Greaves M F. Blood. 2001;98:478–482. doi: 10.1182/blood.v98.2.478. [DOI] [PubMed] [Google Scholar]
- 19.Yuan Y, Zhou L, Miyamoto T, Iwasaki H, Harakawa N, Hetherington C J, Burel S A, Lagasse E, Weissman I L, Akashi K, Zhang D-E. Proc Natl Acad Sci USA. 2001;98:10398–10403. doi: 10.1073/pnas.171321298. [DOI] [PMC free article] [PubMed] [Google Scholar]
- 20.Romana S P, Poirel H, Leconiat M, Flexor M-A, Mauchauffe M, Jonveaux P, Macintyre E A, Berger R, Bernard O A. Blood. 1995;86:4263–4269. [PubMed] [Google Scholar]
- 21.Miyamoto T, Weissman I L, Akashi K. Proc Natl Acad Sci USA. 2000;97:7521–7526. doi: 10.1073/pnas.97.13.7521. [DOI] [PMC free article] [PubMed] [Google Scholar]
- 22.Ford A M, Fasching K, Panzer-Grümayer E R, Koenig M, Haas O A, Greaves M F. Blood. 2001;98:558–564. doi: 10.1182/blood.v98.3.558. [DOI] [PubMed] [Google Scholar]
- 23.Uckun F M, Herman-Hatten K, Crotty M-L, Sensel M G, Sather H N, Tuel-Ahlgren L, Sarquis M B, Bostrom B, Nachman J B, Steinherz P G, et al. Blood. 1998;92:810–821. [PubMed] [Google Scholar]
- 24.Trka J, Zuna J, Hrusák O, Michalová K, Muzíková K, Kalinová M, Starý J. Blood. 1999;93:1106–1107. [PubMed] [Google Scholar]
- 25.Kim-Rouille M-H, MacGregor A, Wiedemann L M, Greaves M F, Navarrete C. Blood. 1999;93:1107–1108. [PubMed] [Google Scholar]
- 26.Biernaux C, Loos M, Sels A, Huez G, Stryckmans P. Blood. 1995;86:3118–3122. [PubMed] [Google Scholar]
- 27.Bose S, Deininger M, Gora-Tybor J, Goldman J M, Melo J V. Blood. 1998;92:3362–3367. [PubMed] [Google Scholar]
- 28.Liu Y, Hernandez A M, Shibata D, Cortopassi G A. Proc Natl Acad Sci USA. 1994;91:8910–8914. doi: 10.1073/pnas.91.19.8910. [DOI] [PMC free article] [PubMed] [Google Scholar]
- 29.Summers K E, Goff L K, Wilson A G, Gupta R K, Lister T A, Fitzgibbon J. J Clin Oncol. 2001;19:420–424. doi: 10.1200/JCO.2001.19.2.420. [DOI] [PubMed] [Google Scholar]
- 30.de Nooij-van Dalen A G, Borolli B, van der Keur M, van der Marel A, Lohman P H M, Giphart-Gassler M. Genes Chromosomes Cancer. 2001;30:323–335. doi: 10.1002/gcc.1098. [DOI] [PubMed] [Google Scholar]
- 31.Küppers R, Dalla-Favera R. Oncogene. 2001;20:5580–5594. doi: 10.1038/sj.onc.1204640. [DOI] [PubMed] [Google Scholar]
- 32.Beckwith J B, Perrin E V. Am J Pathol. 1963;43:1089–1104. [PMC free article] [PubMed] [Google Scholar]
- 33.Bennington J L, Beckwith J B. Atlas of Tumor Pathology. Washington, DC: Armed Forces Institute of Pathology; 1975. [Google Scholar]
- 34.Draper G J, editor. The Geographical Epidemiology of Childhood Leukaemia and Non-Hodgkins Lymphoma in Great Britain, 1966–1983. London: Office of Population Censuses and Surveys; 1991. [Google Scholar]
- 35.Xiao Z, Greaves M F, Buffler P, Smith M T, Segal M R, Dicks B M, Wiencke J K, Wiemels J L. Leukemia. 2001;15:1906–1913. doi: 10.1038/sj.leu.2402318. [DOI] [PubMed] [Google Scholar]
- 36.Chu G. J Biol Chem. 1997;272:24097–24100. doi: 10.1074/jbc.272.39.24097. [DOI] [PubMed] [Google Scholar]
- 37.Zipursky A. Paediatr Res. 2000;47:574. doi: 10.1203/00006450-200005000-00002. [DOI] [PubMed] [Google Scholar]


