Abstract
Experimental analysis of the effects of individual components of complex mammalian systems is frequently impeded by compensatory adjustments that animals make to achieve homeostasis. We here introduce a genetic procedure for eliminating this type of impediment, by using as an example the development and testing of a transgene for “genetically clamping” the expression of renin, the major homeostatically responding component of the renin–angiotensin system, one of the most important regulators of blood pressure. To obtain a renin transgene whose expression is genetically clamped at a constant level, we have used single-copy chosen-site gene targeting to insert into a liver-specific locus a single copy of a modified mouse renin transgene driven by a liver-specific promoter/enhancer. The resulting transgene expresses renin ectopically at a constant high level in the liver and leads to elevated plasma levels of prorenin and active renin. The transgenic mice display high blood pressure, enhanced thirst, high urine output, proteinuria, and kidney damage. Treatment with the angiotensin II type I receptor antagonist, losartan, reduces the hypertension, albuminuria, and kidney damage, but does not affect expression of the transgene. This genetically clamped renin transgene can be used in models in which hypertension and its complications need to be investigated in a high prorenin/renin environment that is not subject to homeostatic compensations by the animal when other factors are changed.
Complex organisms maintain their internal environment constant by a variety of homeostatic adjustments that return the internal milieu to near normality when it is disturbed. These homeostatic adjustments help to maintain the normal status of an organism but present serious challenges to investigators wishing to dissect the individual components within complex systems. To overcome these obstacles, physiologists have for many years used sophisticated sensors and infusion pumps to “clamp” the level of metabolites or other variables that are normally subject to homeostasis (1). A prime example is the euglycemic clamp, the gold standard for research requiring measurements of insulin resistance in vivo (2).
Two alterations are required to achieve a comparable goal by genetic means. One alteration is to inactivate the endogenous gene that normally responds to homeostatic cues. The other alteration is to provide a new source of the protein of interest by introducing a transgene whose expression is of the desired strength but is not sensitive to homeostasis. “Genetic clamping” is obtained when the two alterations are combined by breeding.
The complex system we have chosen for developing our procedure is the renin–angiotensin system (RAS), one of the most potent regulators of blood pressure (BP). Renin is the major homeostatic responder of the RAS, and it is its gene that we propose to clamp. Inactivation of the endogenous renin gene has already been achieved by gene targeting (ref. 3 and our own unpublished experiments). The design and testing of the genetically clamped renin transgene is the subject of our present investigation.
There are several technical limitations to generating mice with active renin expression by conventional transgenic approaches. Many of these issues are discussed in detail in a recent review by Cvetkovic and Sigmund (4), but we summarize a few key points here. Active renin is the proteolytic product of prorenin after a cleavage reaction that is restricted to the juxtaglomerular cells of the kidney (5). Species differences affect renin specificity, as illustrated by the finding that human renin does not react with rodent angiotensinogen or vice versa (6). Transgenic mouse lines have been made with varying lengths of the human renin gene locus; they express human prorenin, which itself may have distinct and significant biological activity (7, 8), and human renin. Although the transgenic human renin does not cleave mouse angiotensinogen, these mice have been valuable for studies of human renin gene regulation and RAS physiology when they are crossed to transgenic mice that express human angiotensinogen (9, 10). However, the crossing of different transgenic lines inevitably results in complex genetic backgrounds. An additional complication is that, unlike rats and humans, wild mice and some (but not all) laboratory strains have two tandemly arranged biologically active renin genes, Ren1d and Ren2 (11, 12).
To circumvent some of the technical problems discussed above, we have developed a conceptually and genetically simple renin transgene that is expressed under the control of a liver-specific promoter and is targeted into the genome as a single copy in a locus that is active in the liver, an organ that is uninvolved in the regulation of blood pressure. In this way, the ectopic expression of the transgene is clamped and independent of the complex homeostatic compensations that occur with the natural renin gene in the kidney. An additional advantage of this targeted transgene is that it eliminates the uncertain copy number and variable position effects inherent in conventional transgenic approaches. This monogenic model of prorenin/active renin overexpression is proving of value in several contexts in addition to its future use for genetically clamping renin expression in the whole animal.
Materials and Methods
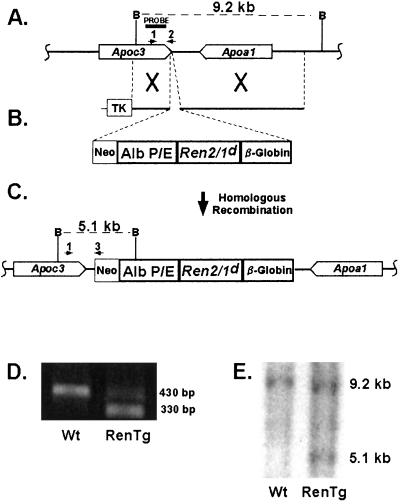
The targeting construct (Fig. 1) consisted of (i) a liver-specific albumin promoter/enhancer (13), (ii) a synthetic mouse renin cDNA that includes at its 3′ end a c-myc epitope tag, (iii) a rabbit β-globin 3′ untranslated region (UTR), (iv) 5′ and 3′ homologous regions for gene targeting at an apolipoprotein locus, and (v) neomycin resistance and thymidine kinase cassettes. The synthetic renin cDNA was constructed by using parts of the Ren-2 and Ren-1d genes assembled in a manner that enables expression of the synthetic renin to be discriminated from that of either endogenous renin gene by quantitative reverse transcription (RT)-PCR. The synthetic gene includes an N′ glycosylation site for increased stability, and was engineered so that processing from prorenin to renin can be efficiently achieved in hepatic or other cells by the ubiquitous enzyme furin (14). The sequence of the synthetic renin cDNA is provided as supporting information, which is published on the PNAS web site, www.pnas.org.
Figure 1.
Generation of RenTg mice. (A) Endogenous apolipoprotein Apoa1/Apoc3 locus. (B) Targeting vector. (C) Targeted allele after homologous recombination. (D) PCR-based strategy for selection of targeted ES cells and for routine genotyping of RenTg animals. Primers 1 and 2 (A) amplify a 430-bp band from the endogenous allele, whereas primers 1 and 3 (C) amplify a 330-bp band from the targeted allele. (E) Southern blot used to confirm correctly targeted ES cells. Digestion of genomic DNA with BamHI results in a 9.2-kb fragment for the Wt allele and a 5.1-kb fragment for the targeted allele when probed with the fragment depicted in A.
The transgene was targeted to the apolipoprotein locus between the Apoa1 and Apoc3 genes by using homologous recombination in 129-derived SvEv embryonic stem (ES) cells (TC-1, a gift from Dr. Phil Leder, Harvard University, Boston), as described (15). Two separate mouse lines were established that differed only in the presence or absence of a 20-bp oligonucleotide insert (16) in the 5′ UTR of the transgene. The overall physiological parameters of these two mouse lines were substantially identical and so vastly different from wild type (Wt) controls that the data from the two were combined.
For PCR-based genotyping (Fig. 1), we used three primers; primer 1: 5′- TGGGATTCTAACCCTGAGGACC-3′; primer 2: 5′-CACAGATTGTAACTGCAAATCTGTCG-3′; primer 3: 5′-GTTCTTCTGAGGGGATCGGC-3′.
Quantitative RT-PCR for renin was performed on the ABI 7700 Sequence Detection System using primers and a TaqMan probe as described (17).
For general histology, 5-μm-thick paraffin sections were stained with hematoxylin and eosin (H&E) and Masson's-Trichrome reagents. Immunohistochemistry for renin was performed as described (18). The total number of glomeruli (TG) and those with renin-positive juxtaglomerular apparatus (JGA) were counted in two sections per kidney. The percentage of renin-positive JGA was determined as (number of renin-positive JGA in all sections) × 100/TG (18).
Mice were placed in metabolic cages for 3 days with free access to food and water. For water-deprivation studies, water was denied for 20 h. Urine osmolality was determined by freezing point depression. Plasma and urine electrolytes, creatinine, glucose, urea, and protein were assayed in the University of North Carolina Pathology Core Animal Chemistry Facility. Blood pressure was measured by tail cuff as described (19). Losartan (Merck) (0.12g/liter; 15 mg per kg per day) was administered in the drinking water.
RIA for angiotensin I (Ang I) was performed as described (20) by using a commercially available kit from NEN Life Science Products. Albumin excretion rate [μg per 30 g body weight (BW) per day] was calculated from the urine albumin determined by ELISA using conventional methods.
All experiments were conducted with 3- to 6-month-old, F1 males, and were approved by the Institutional Animal Care and Use Committee of the University of North Carolina, Chapel Hill.
Statistical analyses were performed with jpm software (SAS, Cary, NC). Values are presented as mean ± SE. Significance was assessed by ANOVA.
Results
To generate mice that have elevated levels of circulating mouse renin not subject to homeostatic influences we used the single-copy chosen-site integration gene targeting procedure (15, 21) to insert a synthetic renin cDNA driven by a liver-specific promoter and enhancer into the liver-specific apolipoprotein Apoa1/Apoc3 locus. We chose this locus because of its liver-specific properties (15) and because targeting genes to this region can be achieved with high efficiency (22). Heterozygous or homozygous disruption of this locus results in viable, fertile, and otherwise normal animals so that the transgene can be obtained as either one (heterozygotes) or two (homozygotes) copies. As shown in Fig. 1 A–C, a cDNA fragment coding for a synthetic mouse prorenin gene, consisting of parts of the Ren-2 and Ren-1d mouse genes and designated Ren2/1d, was modified to include an N′-glycosylation site and a furin cleavage site. These modifications enable the cleavage and secretion of the prorenin transgene product by the liver. To ensure that the expression of the renin transgene is free from homeostatic regulation, the Ren2/1d cDNA was placed under the control of the liver-specific albumin promoter/enhancer (13). Its 3′ UTR was from a rabbit β-globin gene. Correctly targeted ES cells were first identified by PCR (Fig. 1D) and then confirmed by Southern blot analysis (Fig. 1E) as depicted. Male chimeric mice were mated to C57BL/6 females to generate the F1 male mice used in our present studies. They have one copy of the renin transgene (RenTg), are Wt at the natural renin gene locus and, because they are F1s, they are otherwise genetically identical.
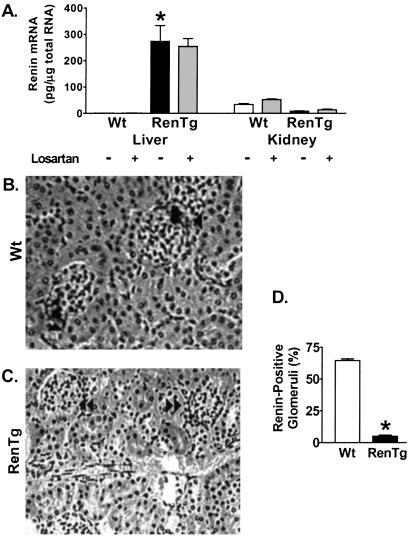
The albumin promoter/enhancer has been well characterized and used to direct transgene expression exclusively in the liver (23–27). Multiple-tissue Northern analysis confirmed that expression of our RenTg occurs in the liver but not in other representative tissues, including heart, brain, kidney, small intestine, and submandibular gland (data not shown). Quantitative RT-PCR determined that high levels of renin mRNA were present in the livers of RenTg mice (Fig. 2A). Endogenous renin mRNA levels in the kidneys of the RenTg mice were very suppressed compared with the Wt controls (Fig. 2A), and immunohistochemistry for renin in the kidney showed that only 5% ± 4% of the glomeruli stained for renin in the RenTg mice, compared with 65% ± 7% in Wt animals (P < 0.0001; Figs. 2 B–D). To test our expectation that the RenTg expression was free from homeostatic regulation, mice were treated for 4 weeks with the angiotensin II receptor 1a (AT1) antagonist, losartan and renin mRNA levels were measured with quantitative RT-PCR. As expected, losartan increased endogenous kidney renin levels in Wt mice, but it had no effect on renin levels in the RenTg liver although it modestly increased the levels of endogenous renin expression in the kidney of the transgenic mice (Fig. 2A).
Figure 2.
Renin Expression in Wt and RenTg mice. (A) Quantitative RT-PCR shows increased Ren2/1d expression in liver and decreased endogenous renin expression in kidney of RenTg mice. Losartan has no effect on the Ren2/1d expression in the RenTg mice. Immunostaining for renin in kidney sections from Wt (B) and RenTg (C) mice. Single arrows indicate positive staining in glomerular vascular poles. Double arrows identify unstained glomeruli. (Magnification, ×260.) (D) Quantitation of positively stained glomeruli. *, P < 0.001 vs. Wt, n = 6.
The RenTg mice had over six times Wt levels of total renin plasma concentration (628 ± 26 ng Ang I per ml per h vs. 95 ± 13 ng Ang I per ml per h, P < 0.0001). The ratio of prorenin to renin in the transgenic mice was similar to Wt (1.8 in RenTg vs 1.1 in Wt controls) establishing that cleavage of the synthetic prorenin in the liver was comparable in degree to the cleavage of natural prorenin in the kidney.
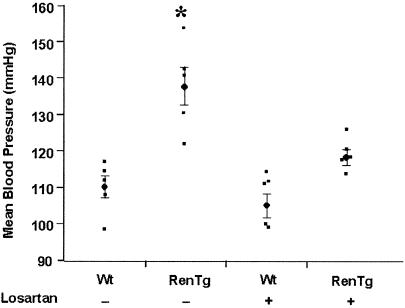
We used a computerized tail cuff system to show that the targeted mice had BPs more than 25 mmHg (1 mmHg = 133 Pa) higher than Wt mice (Fig. 3). To establish that the elevated BP resulted from an increase in angiotensin II (Ang II) signaling, we measured the BPs of the RenTg mice after a 2-week administration of losartan. As shown in Fig. 3, losartan treatment had little effect on the BP of the Wt mice (from 110 ± 3 mmHg to 105 ± 3 mmHg; P = 0.32), but it significantly reduced the BP of the RenTg mice (from 137 ± 5 mmHg to 118 ± 2; P = 0.01) to almost normal levels (Wt untreated vs Tg treated; P = 0.07). We conclude that the ectopic overexpression of a synthetic renin gene in the RenTg mice leads to chronic hypertension caused by an increase in Ang II acting through the AT1 receptor.
Figure 3.
Mean BPs of Wt and RenTg mice with or without losartan treatment as measured by computerized tail cuff method. *, P < 0.0001 vs. other groups; n = 5.
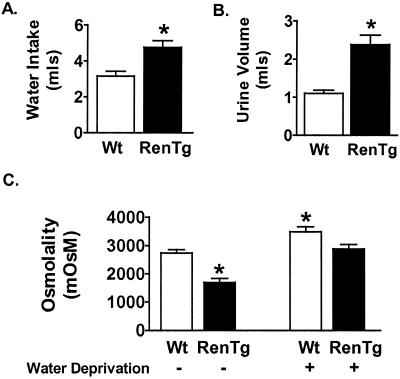
The RAS has a broad variety of physiological effects related to the maintenance of sodium and water balance. We therefore evaluated the effect of the increased plasma renin on drinking behavior and urine production in the RenTg mice. The targeted mice, compared with their Wt counterparts, consumed significantly more water (Wt = 2.9 ± 0.5 ml vs RenTg = 4.8 ± 0.3 ml; P = 0.02) and produced more urine (Wt = 1.1 ± 0.1 ml vs RenTg = 2.5 ± 0.4 ml; P = 0.03) of dilute osmolality (P = 0.01) (Fig. 4 A–C). To determine whether the production of dilute urine in the RenTg mice might be caused by an inherent inability of the renin-depleted kidneys to concentrate urine, mice were deprived of water for 20 h, and urine osmolality was measured. Although the urine osmolality remained significantly lower in RenTg mice after water deprivation (3,488 ± 178 mOsM in Wt vs. 2,886 ± 154 mOsM in RenTg, P = 0.03), there was a concomitant increase in urine osmolality for both Wt and RenTg mice of approximately 1,000 mOsM (before water deprivation, Wt = 2,737 ± 120 mOsM and RenTg = 1,748 ± 206 mOsM) (Fig. 4C), demonstrating that the kidneys in the transgenic mice are still capable of concentrating urine.
Figure 4.
Metabolic studies on Wt and RenTg mice. (A) Water consumption. (B) Urine production. (C) Urine osmolality. *, P < 0.05 vs. Wt; #, P ≤ 0.01 vs. Wt; n = 4.
There were no significant differences in BW, hematocrit, plasma electrolytes, or urine composition between RenTg and Wt littermates (Table 1). However, there was a significant increase in serum creatinine in RenTg mice (21 ± 6 mmol/liter in RenTg mice vs. 11 ± 4 mmol/liter in Wt; P = 0.01), indicating reduced kidney function.
Table 1.
Body weight, hematocrit, serum, and urine electrolytes in 4-month-old male RenTg and Wt mice
| Wt (n = 5) | RenTg (n = 6) | P value | |
|---|---|---|---|
| Body weight, g | 28.0 ± 1.9 | 30.4 ± 1.9 | 0.15 |
| Hematocrit, % | 48.9 ± 2.2 | 51.5 ± 2.5 | 0.08 |
| Serum | |||
| Glucose, mmol/liter | 5.5 ± 1.2 | 4.9 ± 0.8 | 0.32 |
| Sodium, mmol/liter | 169 ± 3 | 172 ± 2.0 | 0.10 |
| Potassium, mmol/liter | 5.5 ± 0.6 | 5.6 ± 0.2 | 0.42 |
| Creatinine, Cr, mmol/liter | 11 ± 4 | 21 ± 6 | 0.01* |
| Urea, mmol/liter | 8.5 ± 1.1 | 10.1 ± 2.2 | 0.12 |
| Urine (24 hours) | |||
| Sodium, mmol per g per BW | 4.6 ± 1.2 | 6.1 ± 1.4 | 0.20 |
| Potassium, mmol per g per BW | 11.3 ± 3.0 | 15.6 ± 2.9 | 0.11 |
| Chloride, mmol per g per BW | 9.1 ± 2.5 | 11.8 ± 2.5 | 0.22 |
Denotes a statistically significant difference between RenTg and Wt mice.
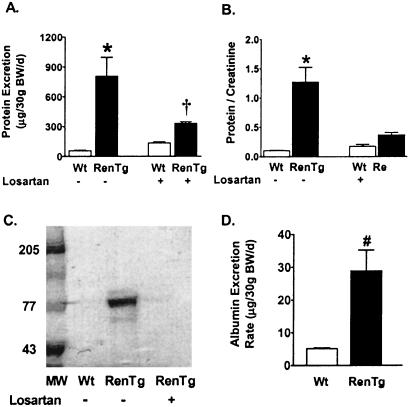
To further characterize the impact of chronic hypertension on the decreased kidney function, we measured total protein excretion rate and protein/creatinine ratio in Wt and RenTg mice. Measurement of total urinary protein revealed that RenTg mice have proteinuria (706 ± 71 μg per 30 g BW per day in RenTg vs 56 ± 6 μg per 30 g BW per day in Wt; P = 0.001) (Fig. 5A). Urine protein/creatinine ratios, which reliably reflect renal function and overcome urine collection errors (28), are shown in Fig. 5B. This ratio was significantly elevated in the RenTg mice as compared with their Wt littermates (0.10 ± 0.006 in RenTg vs 1.3 ± 0.3 in Wt; P = 0.01). SDS/PAGE of urine from targeted mice revealed the presence of an approximately 70-kDa protein, which is similar to the MW of mouse albumin (29) (Fig. 5C). We confirmed an increase in albumin excretion in RenTg mice (29 ± 11 μg per 30 g BW per day for RenTg vs 5.1 ± 0.3 μg per 30 g BW per day for Wt, P < 0.02) by using an ELISA for mouse albumin (Fig. 5D).
Figure 5.
Analysis of urine protein in Wt and RenTg mice. (A) Protein excretion. (B) Urine protein/creatinine ratio. (C) SDS/PAGE of urine. MW represents molecular weight markers. (D) Albumin excretion rate. *, P < 0.01 vs. Wt; †, P < 0.05 vs. untreated RenTG; #, P < 0.02 vs. Wt; n = 4.
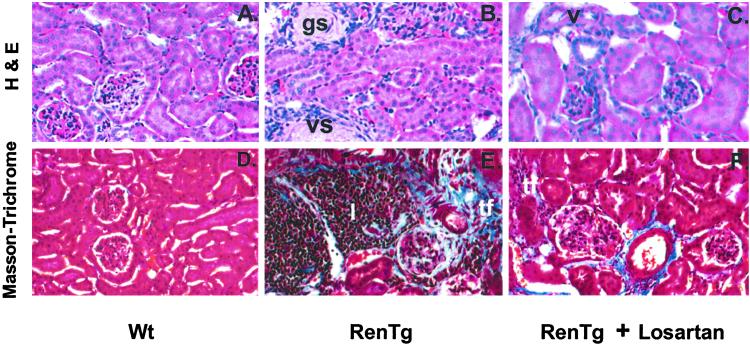
Histology of the kidneys revealed vascular, glomerular and tubulointerstitial changes indicative of hypertensive nephrosclerosis in the RenTg mice when compared with controls (Fig. 6 A, B, D, and E). The renal cortical sections from targeted mice showed inflammatory infiltrates, fibrinoid necrosis, and arterial disruption compatible with severe hypertension (Fig. 6 B and E).
Figure 6.
H&E and Masson's-Trichrome staining of renal tissue from Wt (A and D), RenTg (B and E), and RenTg treated with losartan for 4 weeks (C and F). gs, glomerular sclerosis; vs, vascular sclerosis; tf, tubulointerstitial fibrosis; I, inflammatory cell infiltrate. (Magnification, ×130.)
Treatment with losartan lowered the BP (Fig. 3) and improved the proteinuria in the RenTg mice (Fig. 5 A–C). In addition, a 4-week treatment of losartan substantially ameliorated the extent of the pathologic changes in the kidneys of the RenTg mice (Fig. 6 C and F).
Discussion
Chronic hypertension is an important risk factor for morbidity and mortality in cardiovascular diseases (30) and for the development and progression of glomerulosclerosis and hypertensive nephrosclerosis (31). Treatment of chronic hypertension and prevention of its secondary renal complications in humans often involves pharmacological manipulation of the RAS system. It is therefore not surprising that numerous animal models have been developed to better understand the genetics and physiology of the RAS and the pharmacological agents used to regulate it (4, 7, 32–34). However, a complication in these animal models is the uncontrolled homeostatic feedback that occurs subsequent to genetic or experimental manipulations. Developing a model in which the effector molecule renin is held at a constant level would be of great value. Because of the complex nature of the renin genes in the commonly used 129 mouse strain, it has been a challenge to generate mouse models that overexpress renin in a form that is active in mice or that delete both renin genes (3, 35, 36).
In this paper, we have used single-copy chosen-site gene targeting to generate a mouse line that produces genetically clamped high levels of mouse active renin in the liver. By choosing to express the RenTg in the liver, driven by a liver-specific promoter/enhancer, the ectopically produced active renin is completely freed from normal renal homeostatic adjustments, and is therefore clamped. Moreover, because the engineered transgene is of mouse origin, the resulting high circulating active renin is capable of interacting with the other components of the mouse RAS, and leads to a severe Ang II-mediated hypertension and to kidney damage. Treatment with the AT1 receptor antagonist, losartan, reduces the BP and partly ameliorates the renal damage, indicating that much of the damage is caused by Ang II and/or the high BP. The absence of complete protection against renal fibrosis is presumably related either to the limited duration of the treatment (4 weeks) or to the presence of irreversible damage at the onset of the treatment (6 months old). We stress, however, that the losartan treatment does not affect the expression of the clamped renin transgene even though it corrects much of its consequences.
In a related study, Véniant et al. (37) used a conventional transgenic approach to overexpress rat prorenin in the liver of rats. Despite a 400-fold increase in plasma prorenin levels, these transgenic rats did not have elevated BP, presumably because the circulating prorenin secreted from the liver could not be cleaved in the blood stream into active renin. Nevertheless, their transgenic model developed severe renal lesions even in the absence of hypertension. The authors concluded that prorenin itself can act locally to increase Ang II levels, a hypothesis that has been supported by other studies demonstrating enzymatic activity of prorenin in nonrenal tissues (8, 38, 39). Given these findings and because our RenTg mice also have circulating levels of prorenin, it is possible, although perhaps not likely (because our prorenin levels are only 8 times normal) that in addition to the hypertension, increased circulating prorenin levels are partly involved in the kidney damage.
In conclusion, our genetically clamped RenTg mouse produces physiologically active renin at a constant level that is insensitive to normal homeostatic signals and is expressed in an organ that is uninvolved in BP regulation. Therefore, the clamped renin transgene provides an uncomplicated means for generating animals in which to study the pathology of chronic hypertension and the pharmacologic action of drugs used to regulate the RAS. We are currently testing variants of the current RenTg so that the level of genetically clamped renin can be matched to different experimental situations.
Supplementary Material
Acknowledgments
We thank Dr. Richard D. Palmiter for the albumin promoter/enhancer and Drs. Thomas M. Coffman, Charles Jennette, Nobuyo Maeda, and Curt Sigmund for helpful advice and discussions and Lyuda Kadyrova for technical help. Supported by the National Institutes of Health Grants GM20069 and HL49277 (to O.S.), HL10344 (to K.M.C.), and DK 52612 (to R.A.G.), by a Biomedical Fellowship, Kidney Foundation of Canada (to L.R.J.), and by a Howard Hughes Medical Institute Fellowship (to M.L.S.L.).
Abbreviations
- RAS
renin–angiotensin system
- BP
blood pressure
- UTR
untranslated region
- H&E
hematoxylin and eosin
- Ang I
II, angiotensin I, II
- AT1
angiotensin II receptor 1a
- BW
body weight
- RenTg
renin transgene
- Wt
wild type
Footnotes
Data deposition: The sequence reported in this paper has been deposited in the GenBank database (accession no. AY102037).
References
- 1.Radziuk J. J Clin Endocrinol Metab. 2000;85:4426–4433. doi: 10.1210/jcem.85.12.7025. [DOI] [PubMed] [Google Scholar]
- 2.DeFronzo R A, Tobin J D, Andres R. Am J Physiol. 1979;237:E214–E223. doi: 10.1152/ajpendo.1979.237.3.E214. [DOI] [PubMed] [Google Scholar]
- 3.Yanai K, Saito T, Kakinuma Y, Kon Y, Hirota K, Taniguchi-Yanai K, Nishijo N, Shigematsu Y, Horiguchi H, Kasuya Y, et al. J Biol Chem. 2000;275:5–8. doi: 10.1074/jbc.275.1.5. [DOI] [PubMed] [Google Scholar]
- 4.Cvetkovic B, Sigmund C D. Kidney Int. 2000;57:863–874. doi: 10.1046/j.1523-1755.2000.057003863.x. [DOI] [PubMed] [Google Scholar]
- 5.Nagahama M, Nakayama K, Murakami K. Eur J Biochem. 1991;197:135–140. doi: 10.1111/j.1432-1033.1991.tb15891.x. [DOI] [PubMed] [Google Scholar]
- 6.Hatae T, Takimoto E, Murakami K, Fukamizu A. Mol Cell Biochem. 1994;131:43–47. doi: 10.1007/BF01075723. [DOI] [PubMed] [Google Scholar]
- 7.Sinn P L, Sigmund C D. Regul Pept. 2000;86:77–82. doi: 10.1016/s0167-0115(99)00097-x. [DOI] [PubMed] [Google Scholar]
- 8.Osmond D H, Sealey J E, McKenzie J K. Can J Physiol Pharmacol. 1991;69:1308–1314. doi: 10.1139/y91-193. [DOI] [PubMed] [Google Scholar]
- 9.Fukamizu A, Sugimura K, Takimoto E, Sugiyama F, Seo M S, Takahashi S, Hatae T, Kajiwara N, Yagami K, Murakami K. J Biol Chem. 1993;268:11617–11621. [PubMed] [Google Scholar]
- 10.Merrill D C, Thompson M W, Carney C L, Granwehr B P, Schlager G, Robillard J E, Sigmund C D. J Clin Invest. 1996;97:1047–1055. doi: 10.1172/JCI118497. [DOI] [PMC free article] [PubMed] [Google Scholar]
- 11.Piccini N, Knopf J L, Gross K W. Cell. 1982;30:205–213. doi: 10.1016/0092-8674(82)90026-5. [DOI] [PubMed] [Google Scholar]
- 12.Abel K J, Gross K W. Nucleic Acids Res. 1988;16:2111–2126. doi: 10.1093/nar/16.5.2111. [DOI] [PMC free article] [PubMed] [Google Scholar]
- 13.Pinkert C A, Ornitz D M, Brinster R L, Palmiter R D. Genes Dev. 1987;1:268–276. doi: 10.1101/gad.1.3.268. [DOI] [PubMed] [Google Scholar]
- 14.Methot D, vanKats J P, Lochard N, Tremblay F, Silversides D W, Reudelhuber T L. Am J Hypertens. 2001;14:38S–43S. doi: 10.1016/s0895-7061(01)02068-4. [DOI] [PubMed] [Google Scholar]
- 15.Hatada S, Kuziel W, Smithies O, Maeda N. J Biol Chem. 1999;274:948–955. doi: 10.1074/jbc.274.2.948. [DOI] [PubMed] [Google Scholar]
- 16.Kozak M. Gene Expr. 1991;1:117–125. [PMC free article] [PubMed] [Google Scholar]
- 17.Kim H S, Lee G, John S W M, Maeda N, Smithies O. Proc Natl Acad Sci USA. 2002;99:4602–4607. doi: 10.1073/pnas.072083799. [DOI] [PMC free article] [PubMed] [Google Scholar]
- 18.Gomez R A, Lynch K R, Sturgill B C, Elwood J P, Chevalier R L, Carey R M, Peach M J. Am J Physiol. 1989;257:F850–F858. doi: 10.1152/ajprenal.1989.257.5.F850. [DOI] [PubMed] [Google Scholar]
- 19.Krege J H, Hodgin J B, Hagaman J R, Smithies O. Hypertension. 1995;25:1111–1115. doi: 10.1161/01.hyp.25.5.1111. [DOI] [PubMed] [Google Scholar]
- 20.Sealey J E. Clin Chem. 1991;37:1811–1819. [PubMed] [Google Scholar]
- 21.Bronson S K, Plaehn E G, Kluckman K D, Hagaman J R, Maeda N, Smithies O. Proc Natl Acad Sci USA. 1996;93:9067–9072. doi: 10.1073/pnas.93.17.9067. [DOI] [PMC free article] [PubMed] [Google Scholar]
- 22.Williamson R, Lee D, Hagaman J, Maeda N. Proc Natl Acad Sci USA. 1992;89:7134–7138. doi: 10.1073/pnas.89.15.7134. [DOI] [PMC free article] [PubMed] [Google Scholar]
- 23.Sandgren E P, Quaife C J, Pinkert C A, Palmiter R D, Brinster R L. Oncogene. 1989;4:715–724. [PubMed] [Google Scholar]
- 24.Linhart H G, Ishimura-Oka K, DeMayo F, Kibe T, Repka D, Poindexter B, Bick R J, Darlington G J. Proc Natl Acad Sci USA. 2001;98:12532–12537. doi: 10.1073/pnas.211416898. [DOI] [PMC free article] [PubMed] [Google Scholar]
- 25.Heckel J L, Sandgren E P, Degen J L, Palmiter R D, Brinster R L. Cell. 1990;62:447–456. doi: 10.1016/0092-8674(90)90010-c. [DOI] [PubMed] [Google Scholar]
- 26.Kopp J B, Factor V M, Mozes M, Nagy P, Sanderson N, Bottinger E P, Klotman P E, Thorgeirsson S S. Lab Invest. 1996;74:991–1003. [PubMed] [Google Scholar]
- 27.Song Q, Chao J, Chao L. Immunopharmacology. 1996;32:105–107. doi: 10.1016/0162-3109(95)00065-8. [DOI] [PubMed] [Google Scholar]
- 28.Viswanathan V, Chamukuttan S, Kuniyil S, Ambady R. Diabetes Res Clin Pract. 2000;49:143–147. doi: 10.1016/s0168-8227(00)00153-4. [DOI] [PubMed] [Google Scholar]
- 29.MacLaren I A, Petras M L. Biochim Biophys Acta. 1976;427:238–250. doi: 10.1016/0005-2795(76)90300-7. [DOI] [PubMed] [Google Scholar]
- 30.He J, Whelton P K. J Hypertens Suppl. 1999;17:S7–S13. [PubMed] [Google Scholar]
- 31.Caetano E R, Zatz R, Saldanha L B, Praxedes J N. Hypertension. 2001;38:171–176. doi: 10.1161/01.hyp.38.2.171. [DOI] [PubMed] [Google Scholar]
- 32.Takahashi N, Smithies O. J Am Soc Nephrol. 1999;10:1598–1605. doi: 10.1681/ASN.V1071598. [DOI] [PubMed] [Google Scholar]
- 33.Lake-Bruse K D, Sigmund C D. Curr Hypertens Rep. 2000;2:211–216. doi: 10.1007/s11906-000-0084-1. [DOI] [PubMed] [Google Scholar]
- 34.Coffman T M. Am J Physiol. 1998;274:F999–F1005. doi: 10.1152/ajprenal.1998.274.6.F999. [DOI] [PubMed] [Google Scholar]
- 35.Clark A F, Sharp M G, Morley S D, Fleming S, Peters J, Mullins J J. J Biol Chem. 1997;272:18185–18190. doi: 10.1074/jbc.272.29.18185. [DOI] [PubMed] [Google Scholar]
- 36.Sharp M G, Fettes D, Brooker G, Clark A F, Peters J, Fleming S, Mullins J J. Hypertension. 1996;28:1126–1131. doi: 10.1161/01.hyp.28.6.1126. [DOI] [PubMed] [Google Scholar]
- 37.Veniant M, Menard J, Bruneval P, Morley S, Gonzales M F, Mullins J. J Clin Invest. 1996;98:1966–1970. doi: 10.1172/JCI119000. [DOI] [PMC free article] [PubMed] [Google Scholar]
- 38.Methot D, Silversides D W, Reudelhuber T L. Circ Res. 1999;84:1067–1072. doi: 10.1161/01.res.84.9.1067. [DOI] [PubMed] [Google Scholar]
- 39.Sealey J E, Rubattu S. Am J Hypertens. 1989;2:358–366. doi: 10.1093/ajh/2.5.358. [DOI] [PubMed] [Google Scholar]
Associated Data
This section collects any data citations, data availability statements, or supplementary materials included in this article.


