

Abstract
Influenza vaccination is particularly important for pregnant women. Using a test-negative, case-control design, we estimated the effectiveness of 2023-2024 seasonal influenza vaccination against influenza-associated emergency department and urgent care (ED/UC) encounters among pregnant and non-pregnant women of reproductive age using data from seven healthcare systems. Eligible encounters were among individuals aged 18-49 years with documented female sex. Vaccine effectiveness (VE) was estimated by comparing the odds of vaccination in influenza-positive cases versus influenza-negative controls, adjusting for site, age, race/ethnicity, calendar time, and gestational age at encounter (in pregnant women). Among pregnant women (N=3,539), VE against influenza-associated ED/UC encounters was 46% (95% CI: 36-55) and did not differ by gestational age at vaccination. Among non-pregnant women (N=57,709), VE against influenza-associated ED/UC encounters was 54% (95% CI: 51-56). Influenza vaccination during the 2023-2024 season was similarly effective in both pregnant and non-pregnant women and by timing of vaccine receipt during pregnancy.
Keywords: vaccine effectiveness, influenza, pregnancy
Background
Pregnant and postpartum women are at increased risk of severe illness and complications from influenza, particularly during the second and third trimesters of pregnancy.1–3 Influenza virus infection in pregnancy may be associated with adverse perinatal outcomes, including preterm birth, small for gestational age, low birth weight, and fetal loss.4,5 Infants are also at increased risk of severe influenza and have the highest hospitalization rates among children.6 Because infants are ineligible for influenza vaccination until 6 months of age, maternal vaccination provides the primary antibody protection against influenza during the first few months after birth. The United States Advisory Committee on Immunization Practices (ACIP) and the American College of Obstetricians and Gynecologists recommend influenza vaccination at any time during pregnancy for women who are or might become pregnant or postpartum during the influenza season.7,8
Influenza vaccination during pregnancy has a strong safety record,9 and previous studies have shown that influenza vaccination is effective against medically attended influenza in pregnant women.6 A multi-country study of pregnant women found a vaccine effectiveness (VE) of 40% against influenza-associated hospitalization from 2010-2016.10 Other studies have found similar effectiveness among pregnant women in hospital and emergency department settings. However, few recent data are available, and most studies are limited to hospitalizations without a non-pregnant comparator population.11,12 Additionally, few studies have addressed whether the timing of influenza vaccination during pregnancy impacts VE. A meta-analysis found that, compared to those vaccinated in early gestation, women vaccinated later in pregnancy had greater immunogenicity and their infants had higher influenza antibody levels, suggesting that influenza vaccination in later gestation could be associated with higher VE.13
To address these gaps in the literature, we estimated the effectiveness of 2023-2024 influenza vaccination against influenza-associated emergency department or urgent care (ED/UC) encounters among both pregnant and non-pregnant women, stratifying results by influenza type, encounter setting, time since vaccination, and timing of vaccination in pregnancy.
Methods
This analysis was conducted using data from the VIrtual SARS-CoV-2, Influenza, and Other respiratory viruses Network (VISION), a research collaboration between CDC and healthcare systems with integrated clinical, laboratory, and immunization records. Detailed VISION methods have been published previously.14 Briefly, participating healthcare systems capture electronic health record (EHR) data on medical encounters for acute respiratory illness (ARI) to evaluate the effectiveness of vaccines against influenza and other respiratory viruses using a test-negative, case-control design. Vaccination status is determined from EHRs, state or local immunization information systems, and/or claims data.
We included ED/UC encounters during October 15, 2023-April 30, 2024 from seven sites in eight states: Kaiser Permanente Northern California (California), Kaiser Permanente Southern California (California), UCHealth (Colorado), Regenstrief Institute (Indiana), HealthPartners (Minnesota and Wisconsin), Kaiser Permanente Center for Health Research (Oregon and Washington), and Intermountain Healthcare (Utah). Eligible encounters were patients aged 18-49 years with documented female sex and ≥1 ARI-associated ICD-10 diagnosis code. Pregnancy status was determined using either a modified Vaccine Safety Datalink (VSD) algorithm (3 sites),15 estimated delivery dates from EHRs (3 sites), or pregnancy-related ICD-10 codes within 30 days of the ARI encounter (1 site).
Case status was defined using molecular influenza test results within 10 days before to 72 h after the encounter date. Cases were defined as those with a positive influenza test, and controls were those testing negative. Vaccinated women received ≥1 dose of 2023-2024 influenza vaccine ≥14 days before the index date (defined as the earlier date of either the most recent influenza test or the encounter date). Unvaccinated women did not receive a dose of 2023-2024 influenza vaccine prior to the index date. The index date was used since data on symptom onset are not available in VISION. Encounters with no molecular influenza test, unknown influenza vaccination status, influenza vaccination <14 days before the index date, or missing gestational dating information (in pregnant women) were excluded. Encounters with a positive molecular SARS-CoV-2 test within 10 days before to 72 h after the encounter date were also excluded to reduce potential bias in VE estimates due to correlation between influenza and COVID-19 vaccination.16
Demographic and clinical characteristics were described by both case and vaccination status, with a standardized mean difference (SMD) of >0.20 considered a notable difference between groups. VE against influenza-associated ED/UC encounters was estimated among pregnant and non-pregnant women of reproductive age using multivariable logistic regression comparing the odds of vaccination in influenza-positive cases versus influenza-negative controls. VE was calculated as (1 – adjusted odds ratio) x 100% and adjusted for site, age, race/ethnicity, calendar time, and gestational age at encounter (in pregnant women). Calendar time, age, and gestational age were modeled as natural cubic splines with 4 degrees of freedom. VE estimates were stratified by influenza type, encounter setting, and time since vaccination. Among pregnant women, VE by time since vaccination was compared between those vaccinated at ≤13 weeks gestation (including pre-pregnancy vaccination during the 2023-2024 season) and >13 weeks gestation. Differences between VE estimates with non-overlapping 95% confidence intervals (CIs) were considered statistically significant. Analyses were conducted using R version 4.4.0 (R Foundation for Statistical Computing). This activity was reviewed by CDC and was conducted consistent with applicable federal law and CDC policy (See e.g., 45 C.F.R. part 46, 21 C.F.R. part 56; 42 U.S.C. §241(d); 5 U.S.C. §552a; 44 U.S.C. §3501 et seq).
Results
Of 82,729 eligible encounters identified, 21,481 (26.0%) were excluded, most commonly due to no molecular influenza testing (11,916 [14.4%]) or a positive molecular SARS-CoV-2 test (5,316 [6.4%]). Among 61,248 included encounters, 15,071 (24.6%) tested positive and 46,177 (75.4%) tested negative for influenza; 2,363 (15.7%) influenza-positive cases versus 12,708 (27.5%) influenza-negative controls were vaccinated. A total of 3,539 (5.8%) encounters occurred in pregnant women and 57,709 (94.2%) encounters occurred in non-pregnant women. Demographic characteristics were similar between pregnant and non-pregnant women. Median age was 30 years in pregnant women and 33 years in non-pregnant women. Most pregnant and non-pregnant women were White, non-Hispanic (41.9% and 46.7%) or Hispanic (34.2% and 29.3%), respectively. Overall, 13.6% of pregnant women and 19.6% of non-pregnant women had ≥1 underlying medical condition (Table 1).
Table 1.
Demographics among pregnant and non-pregnant women by vaccination status1
| Pregnant women (N=3,539) | Non-pregnant women (N=57,709) | |||||||
|---|---|---|---|---|---|---|---|---|
| Total (col %) | Vaccinated (row %) | Unvaccinated (row %) | SMD2 | Total (col %) | Vaccinated (row %) | Unvaccinated (row %) | SMD2 | |
| Influenza test status | 0.22 | 0.30 | ||||||
| Negative | 2,506 (70.8) | 862 (34.4) | 1,644 (65.6) | 43,671 (75.7) | 11,769 (26.9) | 31,902 (73.1) | ||
| Positive | 1,033 (29.2) | 249 (24.1) | 784 (75.9) | 14,038 (24.3) | 2,114 (15.1) | 11,924 (84.9) | ||
| Influenza A | 687 (66.5) | 193 (28.1) | 494 (71.9) | 9,490 (67.6) | 1,726 (18.2) | 7,764 (81.8) | ||
| Influenza B | 346 (33.5) | 56 (16.2) | 290 (83.8) | 4,548 (32.4) | 388 (8.5) | 4,160 (91.5) | ||
| Site | 0.33 | 0.44 | ||||||
| A | 88 (2.5) | 33 (37.5) | 55 (62.5) | 1,907 (3.3) | 540 (28.3) | 1,367 (71.7) | ||
| B | 852 (24.1) | 212 (24.9) | 640 (75.1) | 11,279 (19.5) | 2,028 (18.0) | 9,251 (82.0) | ||
| C | 359 (10.1) | 67 (18.7) | 292 (81.3) | 8,725 (15.1) | 966 (11.1) | 7,759 (88.9) | ||
| D | 622 (17.6) | 199 (32.0) | 423 (68.0) | 8,882 (15.4) | 2,064 (23.2) | 6,818 (76.8) | ||
| E | 239 (6.8) | 73 (30.5) | 166 (69.5) | 3,491 (6.0) | 882 (25.3) | 2,609 (74.7) | ||
| F | 994 (28.1) | 370 (37.2) | 624 (62.8) | 14,619 (25.3) | 4,891 (33.5) | 9,728 (66.5) | ||
| G | 385 (10.9) | 157 (40.8) | 228 (59.2) | 8,806 (15.3) | 2,512 (28.5) | 6,294 (71.5) | ||
| Setting | 0.19 | 0.21 | ||||||
| Emergency department | 2,069 (58.5) | 579 (28.0) | 1,490 (72.0) | 31,210 (54.1) | 6,404 (20.5) | 24,806 (79.5) | ||
| Urgent care | 1,470 (41.5) | 532 (36.2) | 938 (63.8) | 26,499 (45.9) | 7,479 (28.2) | 19,020 (71.8) | ||
| Age category | 0.31 | 0.23 | ||||||
| Median (IQR) | 30 (25-34) | 31 (27-35) | 29 (25-33) | 33 (26-41) | 36 (28-42) | 33 (25-40) | ||
| 18-24 years | 735 (20.8) | 160 (21.8) | 575 (78.2) | 12,083 (20.9) | 2,246 (18.6) | 9,837 (81.4) | ||
| 25-29 years | 998 (28.2) | 280 (28.1) | 718 (71.9) | 8,901 (15.4) | 1,810 (20.3) | 7,091 (79.7) | ||
| 30-34 years | 1,071 (30.3) | 376 (35.1) | 695 (64.9) | 10,216 (17.7) | 2,370 (23.2) | 7,846 (76.8) | ||
| 35-39 years | 578 (16.3) | 232 (40.1) | 346 (59.9) | 9,775 (16.9) | 2,495 (25.5) | 7,280 (74.5) | ||
| 40-49 years | 157 (4.4) | 63 (40.1) | 94 (59.9) | 16,734 (29.0) | 4,962 (29.7) | 11,772 (70.3) | ||
| Race/Ethnicity | 0.28 | 0.28 | ||||||
| American Indian or Alaska Native | 19 (0.5) | 5 (26.3) | 14 (73.7) | 253 (0.4) | 50 (19.8) | 203 (80.2) | ||
| Asian | 218 (6.2) | 109 (50.0) | 109 (50.0) | 2,928 (5.1) | 1,212 (41.4) | 1,716 (58.6) | ||
| Black non-Hispanic | 350 (9.9) | 71 (20.3) | 279 (79.7) | 6,636 (11.5) | 1,000 (15.1) | 5,636 (84.9) | ||
| Hawaiian or Other Pacific Islander | 39 (1.1) | 9 (23.1) | 30 (76.9) | 569 (1.0) | 105 (18.5) | 464 (81.5) | ||
| Hispanic | 1,210 (34.2) | 407 (33.6) | 803 (66.4) | 16,905 (29.3) | 4,462 (26.4) | 12,443 (73.6) | ||
| Multi-race | 60 (1.7) | 18 (30.0) | 42 (70.0) | 888 (1.5) | 182 (20.5) | 706 (79.5) | ||
| Other non-Hispanic | 29 (0.8) | 11 (37.9) | 18 (62.1) | 555 (1.0) | 148 (26.7) | 407 (73.3) | ||
| Unknown | 131 (3.7) | 40 (30.5) | 91 (69.5) | 2,035 (3.5) | 445 (21.9) | 1,590 (78.1) | ||
| White non-Hispanic | 1,483 (41.9) | 441 (29.7) | 1,042 (70.3) | 26,940 (46.7) | 6,279 (23.3) | 20,661 (76.7) | ||
| Underlying medical conditions 3 | 0.04 | 0.08 | ||||||
| None | 3,059 (86.4) | 950 (31.1) | 2,109 (68.9) | 46,373 (80.4) | 10,828 (23.3) | 35,545 (76.7) | ||
| ≥1 Underlying Condition | 480 (13.6) | 161 (33.5) | 319 (66.5) | 11,336 (19.6) | 3,055 (26.9) | 8,281 (73.1) | ||
| Gestational age at encounter | 0.29 | N/A | ||||||
| Median (IQR) | 19 (10-28) | 22 (13-30) | 17 (9-27) | -- | -- | -- | ||
| ≤13 weeks | 1,206 (34.1) | 280 (23.2) | 926 (76.8) | -- | -- | -- | ||
| 14-27 weeks | 1,368 (38.7) | 459 (33.6) | 909 (66.4) | -- | -- | -- | ||
| ≥28 weeks | 965 (27.3) | 372 (38.5) | 593 (61.5) | -- | -- | -- | ||
Abbreviation: IQR, interquartile range
Both pregnant and non-pregnant individuals were 18-49 years of age with documented female sex.
Standardized mean difference (SMD) >0.20 considered a meaningful difference between categorical variables.
Includes respiratory conditions (asthma, COPD, other lung conditions) and non-respiratory conditions (cardiovascular, neurological and musculoskeletal, hematologic, endocrine/metabolic, renal, gastrointestinal, hepatic disease, obesity, and underweight).
Among 3,539 encounters in pregnant women, 1,033 (29.2%) tested positive and 2,506 (70.8%) tested negative for influenza; 249 (24.1%) influenza-positive cases versus 862 (34.4%) influenza-negative controls were vaccinated. Of cases, 687 (66.5%) tested positive for influenza A and 346 (33.5%) for influenza B. A total of 2,069 (58.5%) encounters occurred in the ED and 1,470 (41.5%) in the UC (Table 1). Among vaccinated pregnant women, 314 (28.3%) were vaccinated 14-59 days before the index date, 464 (41.8%) were vaccinated 60-119 days before the index date, and 333 (30.0%) were vaccinated ≥120 days before the index date (Table 2). Median gestational age at encounter was 19 weeks (interquartile range [IQR]: 10-28). Among vaccinated pregnant women, 263 (23.7%) were vaccinated pre-pregnancy, 465 (41.9%) in the first trimester, 338 (30.4%) in the second trimester, and 45 (4.1%) in the third trimester (Table 2). The timeframe for influenza vaccination receipt was similar for pregnant and non-pregnant women, with most vaccines received during September and October 2023. (Figure 1).
Table 2.
Demographics of pregnant and non-pregnant women by influenza test status1
| Pregnant women (N=3,539) | Non-pregnant women (N=57,709) | |||||||
|---|---|---|---|---|---|---|---|---|
| Total (col %) | Positive (row %) | Negative (row %) | SMD2 | Total (col %) | Positive (row %) | Negative (row %) | SMD2 | |
| Influenza vaccination status | 0.23 | 0.30 | ||||||
| Unvaccinated | 2,428 (68.6) | 784 (32.3) | 1,644 (67.7) | 43,826 (75.9) | 11,924 (27.2) | 31,902 (72.8) | ||
| Vaccinated | 1,111 (31.4) | 249 (22.4) | 862 (77.6) | 13,883 (24.1) | 2,114 (15.2) | 11,769 (84.8) | ||
| Time since vaccination | 0.19 | 0.30 | ||||||
| Median days (IQR) | 87 (54-128) | 89 (60-120) | 86 (52-132) | 100 (61-143) | 96 (68-127) | 100 (60-146) | ||
| 14-59 days | 314 (28.3) | 62 (19.7) | 252 (80.3) | 3,291 (23.7) | 407 (12.4) | 2,884 (87.6) | ||
| 60-119 days | 464 (41.8) | 122 (26.3) | 342 (73.7) | 5,369 (38.7) | 1,083 (20.2) | 4,286 (79.8) | ||
| ≥120 days | 333 (30.0) | 65 (19.5) | 268 (80.5) | 5,223 (37.9) | 624 (11.9) | 4,599 (88.1) | ||
| gestational age at vaccination | 0.15 | N/A | ||||||
| Median weeks (IQR) | 10 (1-17) | 10 (3-16) | 10 (1-17) | -- | -- | -- | ||
| Pre-pregnancy | 263 (23.7) | 50 (19.0) | 213 (81.0) | -- | -- | -- | ||
| ≤13 weeks | 465 (41.9) | 109 (23.4) | 356 (76.6) | -- | -- | -- | ||
| 14-27 weeks | 338 (30.4) | 83 (24.6) | 255 (75.4) | -- | -- | -- | ||
| ≥28 weeks | 45 (4.1) | 7 (15.6) | 38 (84.4) | -- | -- | -- | ||
| Site | 0.23 | 0.19 | ||||||
| A | 88 (2.5) | 23 (26.1) | 65 (73.9) | 1,907 (3.3) | 297 (15.6) | 1,610 (84.4) | ||
| B | 852 (24.1) | 288 (33.8) | 564 (66.2) | 11,279 (19.5) | 3,167 (28.1) | 8,112 (71.9) | ||
| C | 359 (10.1) | 109 (30.4) | 250 (69.6) | 8,725 (15.1) | 2,385 (27.3) | 6,340 (72.7) | ||
| D | 622 (17.6) | 138 (22.2) | 484 (77.8) | 8,882 (15.4) | 1,724 (19.4) | 7,158 (80.6) | ||
| E | 239 (6.8) | 95 (39.7) | 144 (60.3) | 3,491 (6.0) | 1,005 (28.8) | 2,486 (71.2) | ||
| F | 994 (28.1) | 274 (27.6) | 720 (72.4) | 14,619 (25.3) | 3,489 (23.9) | 11,130 (76.1) | ||
| G | 385 (10.9) | 106 (27.5) | 279 (72.5) | 8,806 (15.3) | 1,971 (22.4) | 6,835 (77.6) | ||
| Setting | 0.03 | 0.02 | ||||||
| Emergency department | 2,069 (58.5) | 615 (29.7) | 1,454 (70.3) | 31,210 (54.1) | 7,483 (24.0) | 23,727 (76.0) | ||
| Urgent care | 1,470 (41.5) | 418 (28.4) | 1,052 (71.6) | 26,499 (45.9) | 6,555 (24.7) | 19,944 (75.3) | ||
| Age category | 0.13 | 0.06 | ||||||
| Median years (IQR) | 30 (25-34) | 30 (26-34) | 29 (25-34) | 33 (26-41) | 34 (27-41) | 33 (26-41) | ||
| 18-24 years | 735 (20.8) | 179 (24.4) | 556 (75.6) | 12,083 (20.9) | 2,737 (22.7) | 9,346 (77.3) | ||
| 25-29 years | 998 (28.2) | 295 (29.6) | 703 (70.4) | 8,901 (15.4) | 2,090 (23.5) | 6,811 (76.5) | ||
| 30-34 years | 1,071 (30.3) | 340 (31.7) | 731 (68.3) | 10,216 (17.7) | 2,638 (25.8) | 7,578 (74.2) | ||
| 35-39 years | 578 (16.3) | 175 (30.3) | 403 (69.7) | 9,775 (16.9) | 2,476 (25.3) | 7,299 (74.7) | ||
| 40-49 years | 157 (4.4) | 44 (28.0) | 113 (72.0) | 16,734 (29.0) | 4,097 (24.5) | 12,637 (75.5) | ||
| Race/ Ethnicity | 0.12 | 0.06 | ||||||
| American Indian or Alaska Native | 19 (0.5) | 5 (26.3) | 14 (73.7) | 253 (0.4) | 71 (28.1) | 182 (71.9) | ||
| Asian | 218 (6.2) | 54 (24.8) | 164 (75.2) | 2,928 (5.1) | 692 (23.6) | 2,236 (76.4) | ||
| Black non-Hispanic | 350 (9.9) | 94 (26.9) | 256 (73.1) | 6,636 (11.5) | 1,647 (24.8) | 4,989 (75.2) | ||
| Hawaiian or Other Pacific Islander | 39 (1.1) | 14 (35.9) | 25 (64.1) | 569 (1.0) | 177 (31.1) | 392 (68.9) | ||
| Hispanic | 1,210 (34.2) | 372 (30.7) | 838 (69.3) | 16,905 (29.3) | 4,273 (25.3) | 12,632 (74.7) | ||
| Multi-race | 60 (1.7) | 12 (20.0) | 48 (80.0) | 888 (1.5) | 240 (27.0) | 648 (73.0) | ||
| Other non-Hispanic | 29 (0.8) | 5 (17.2) | 24 (82.8) | 555 (1.0) | 124 (22.3) | 431 (77.7) | ||
| Unknown | 131 (3.7) | 42 (32.1) | 89 (67.9) | 2,035 (3.5) | 505 (24.8) | 1,530 (75.2) | ||
| White non-Hispanic | 1,483 (41.9) | 435 (29.3) | 1,048 (70.7) | 26,940 (46.7) | 6,309 (23.4) | 20,631 (76.6) | ||
| Underlying medical conditions 3 | 0.21 | 0.19 | ||||||
| None | 3,059 (86.4) | 942 (30.8) | 2,117 (69.2) | 46,373 (80.4) | 12,051 (26.0) | 34,322 (74.0) | ||
| ≥1 Underlying Condition | 480 (13.6) | 91 (19.0) | 389 (81.0) | 11,336 (19.6) | 1,987 (17.5) | 9,349 (82.5) | ||
| Gestational age at encounter | 0.07 | N/A | ||||||
| Median weeks (IQR) | 19 (10-28) | 19 (11-29) | 19 (10-28) | -- | -- | |||
| ≤13 weeks | 1,206 (34.1) | 330 (27.4) | 876 (72.6) | -- | -- | |||
| 14-27 weeks | 1,368 (38.7) | 406 (29.7) | 962 (70.3) | -- | -- | |||
| ≥28 weeks | 965 (27.3) | 297 (30.8) | 668 (69.2) | -- | -- | |||
Abbreviation: IQR, interquartile range
Both pregnant and non-pregnant individuals were 18-49 years of age with documented female sex.
Standardized mean difference (SMD) >0.20 considered a meaningful difference between categorical variables.
Includes respiratory conditions (asthma, COPD, other lung conditions) and non-respiratory conditions (cardiovascular, neurological and musculoskeletal, hematologic, endocrine/metabolic, renal, gastrointestinal, hepatic disease, obesity, and underweight).
Figure 1.
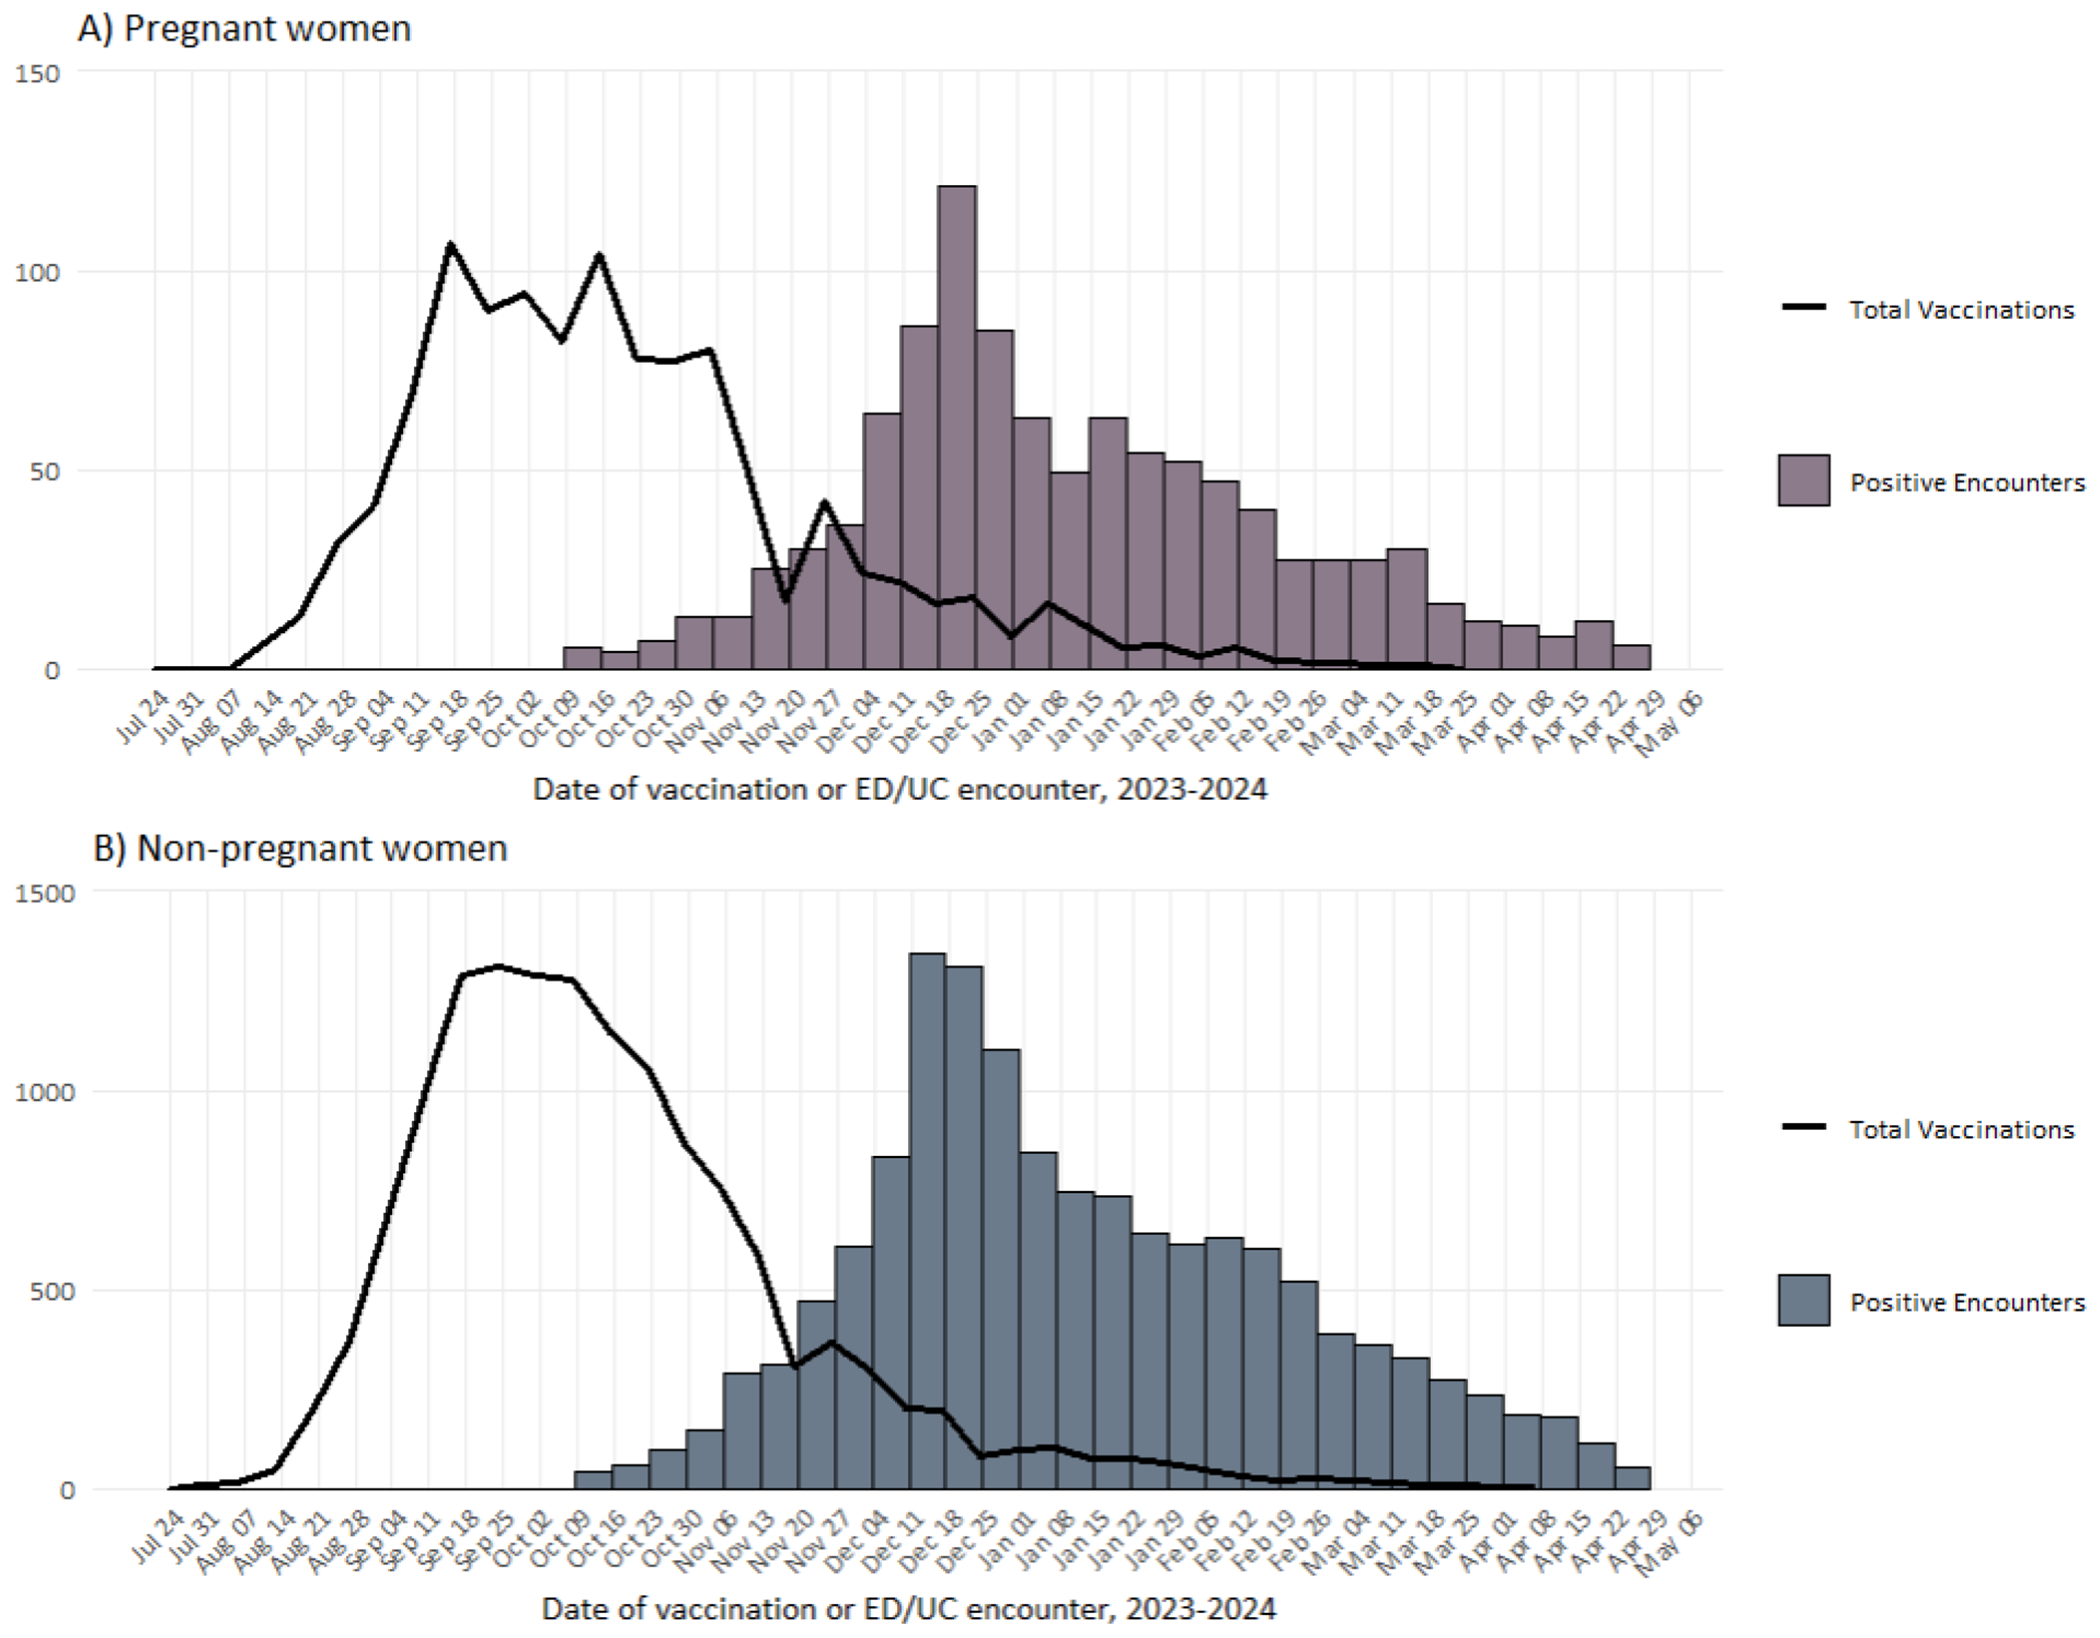
Total influenza vaccinations and counts of influenza-positive ED/UC encounters during the 2023-2024 influenza season by week among A) pregnant women and B) non-pregnant women.
Among 57,709 encounters in non-pregnant women, 14,038 (24.3%) tested positive and 43,671 (75.7%) tested negative for influenza; 2,114 (18.5%) influenza-positive cases versus 11,769 (26.9%) influenza-negative controls were vaccinated. Of cases, 9,490 (67.6%) tested positive for influenza A and 4,548 (32.4%) for influenza B. A total of 31,210 (54.1%) encounters occurred in the ED and 26,499 (45.9%) occurred in the UC (Table 1). Among vaccinated non-pregnant women, 3,291 (23.7%) were vaccinated 14-59 days before the index date, 5,369 (38.7%) were vaccinated 60-119 days before the index date, and 5,223 (37.9%) were vaccinated ≥120 days before the index date (Table 2).
VE against influenza-associated ED/UC encounters in all women, regardless of pregnancy status, was 53% (95% CI: 50-55).
Among pregnant women, VE was 46% (95% CI: 36-55) overall, 35% (95% CI: 20-47) against influenza A, and 65% (95% CI: 52-75) against influenza B. VE was 38% (95% CI: 21-52) against ED encounters and 54% (95% CI: 40-65) against UC encounters. When stratified by time since vaccination, VE was 48% (95% CI: 28-68) at 14-59 days, 48% (95% CI: 34-59) at 60-119 days, and 39% (95% CI: 16-56) at ≥120 days. VE among those vaccinated pre-pregnancy or at ≤13 weeks gestation was 45% (95% CI: 32-55) and 47% (95% CI: 30-61) among those vaccinated at >13 weeks gestation (Figure 2).
Figure 2.
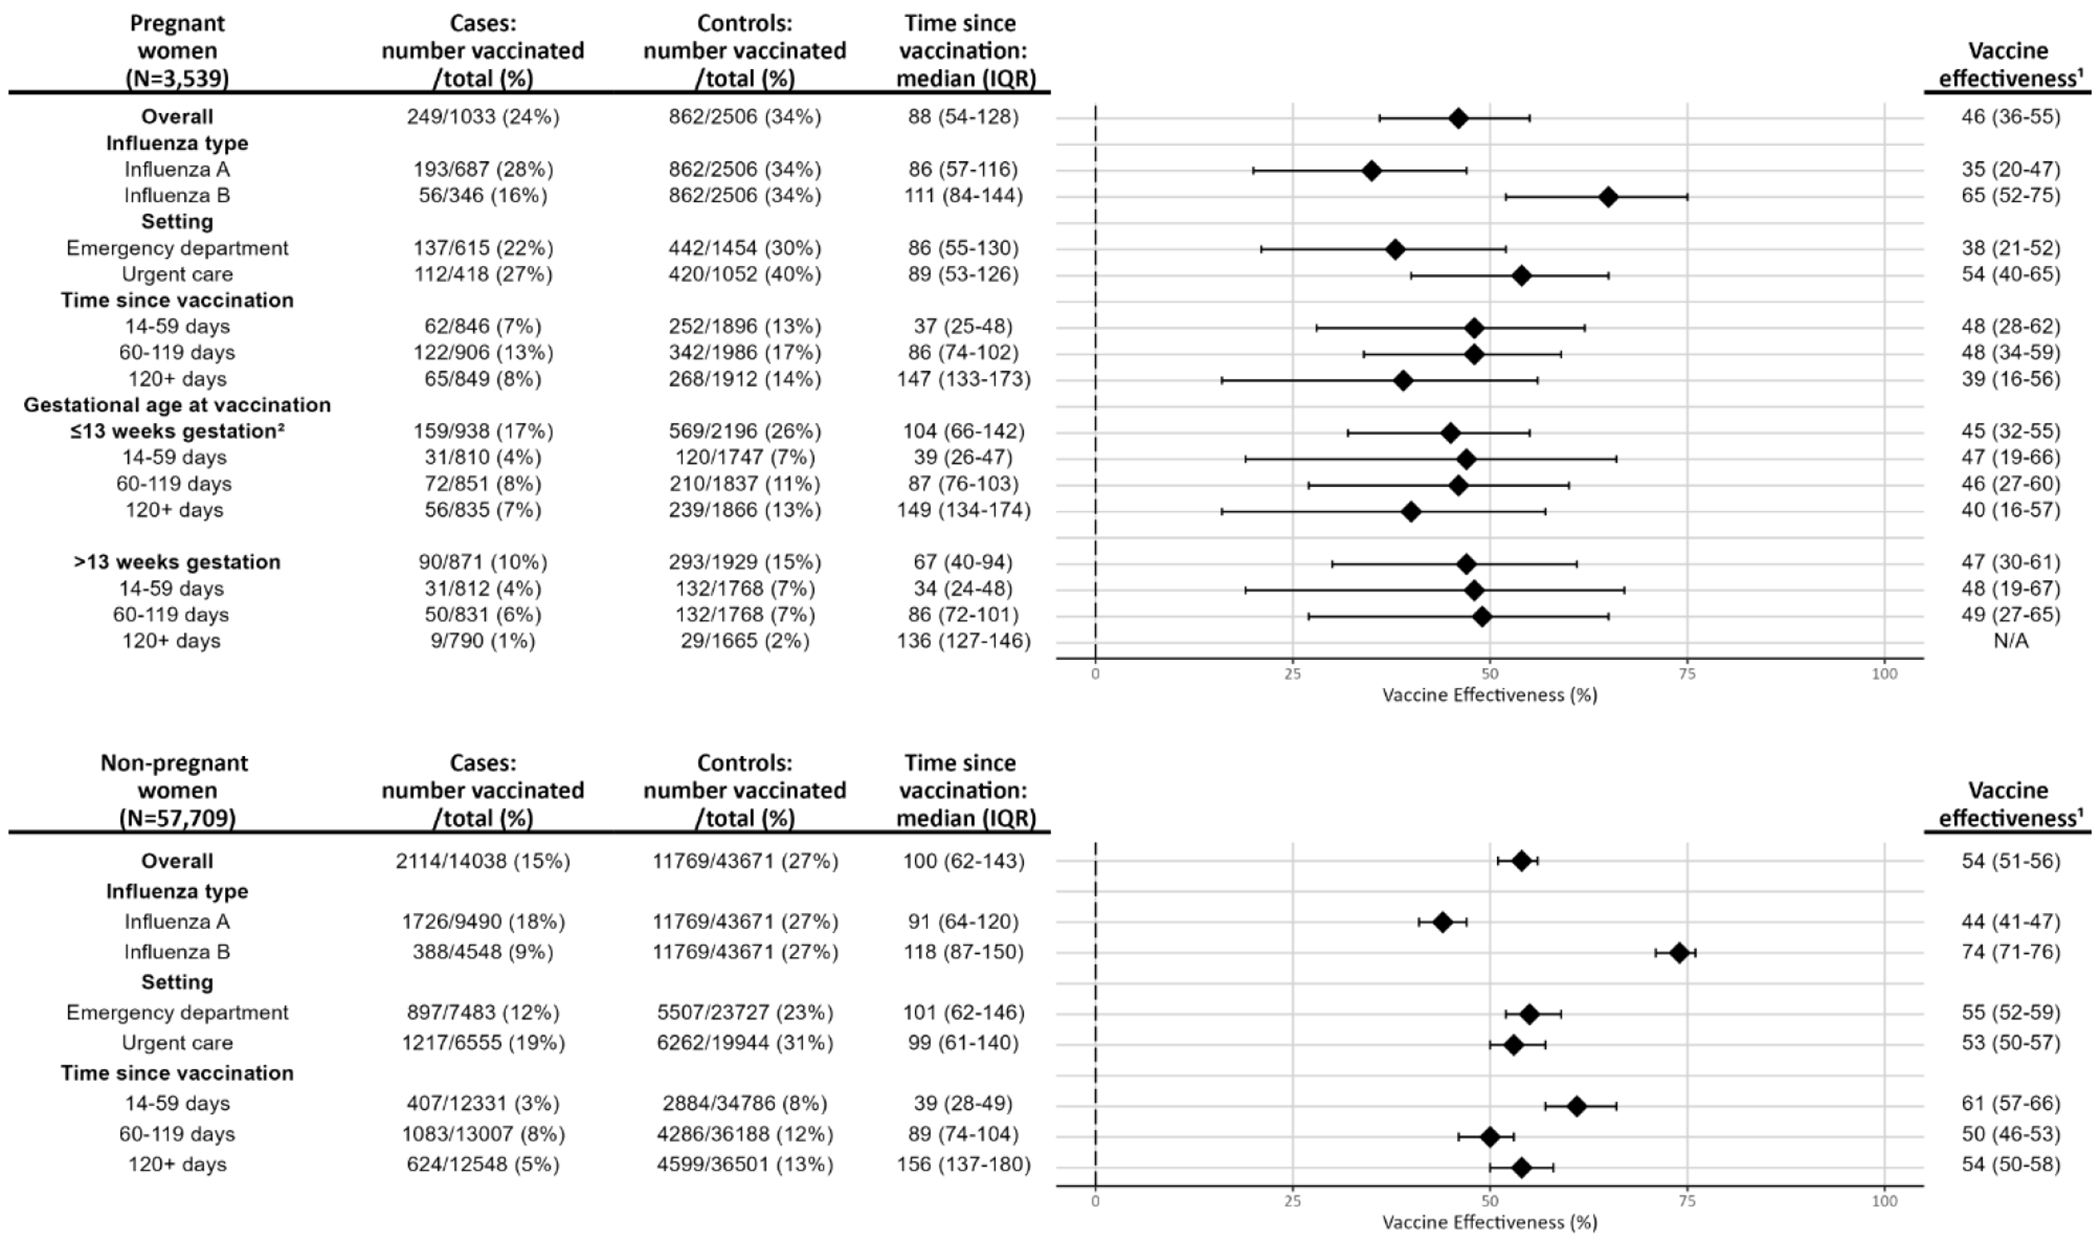
Influenza vaccine effectiveness for pregnant and non-pregnant women by influenza type, encounter setting, time since vaccination (in days), and gestational age at vaccination in pregnant women.
1VE (%) calculated as (1-adjusted odds ratio)*100 with 95% confidence intervals. Estimates were adjusted for age in years, calendar time in days, site, race/ethnicity, and gestational age at encounter (in pregnant women).
2Includes pre-pregnancy vaccination during the 2023-2024 influenza season.
Abbreviation: IQR, interquartile range
Among non-pregnant women, VE was 54% (95% CI: 51-56) overall, 44% (95% CI: 41-47) against influenza A, and 74% (95% CI: 71-76) against influenza B. VE was 55% (95% CI: 52-59) against ED encounters and 53% (95% CI: 50-57) against UC encounters. When stratified by time since vaccination, VE was 61% (95% CI: 57-66) at 14-59 days, 50% (95% CI: 46-53) at 60-119 days, and 54% (95% CI: 50-58) at ≥120 days (Figure 2).
Discussion
The 2023-2024 influenza vaccine provided similar protection against influenza-associated ED/UC encounters among pregnant and non-pregnant women, reducing the likelihood of ED/UC encounters by about half. VE point estimates were lower against ED encounters among pregnant versus non-pregnant women and for pregnant women vaccinated ≥120 days versus <120 days before the encounter, although these differences were not statistically significant. VE was similar for pregnant women who received influenza vaccination during pre-pregnancy or at ≤13 weeks gestation compared with those vaccinated at >13 weeks gestation.
Differences in VE point estimates against ED encounters among pregnant and non-pregnant women may be attributable to several factors. Pregnant women may be more likely than non-pregnant women to seek ED care,17 potentially capturing more mild ARI infections and leading to a lower VE in this group. Alternatively, differences may be due to imprecision in the VE estimate for pregnant women, given the smaller sample of pregnant women in the analysis. Multi-season analyses with larger sample sizes may be useful to assess whether VE differs against ED encounters among pregnant and non-pregnant women.
Our finding that influenza VE was similar by gestational age at vaccination suggests that vaccination at any time during pregnancy, as currently recommended, protected pregnant women from influenza-associated ED/UC encounters.7,8 However, given the potential decline in VE ≥120 days after vaccination, consideration should be given to possible waning of protection for those vaccinated before or early in the influenza season.18 Current ACIP guidance states that vaccination in July or August can be considered for pregnant women who are in the third trimester during those months, to provide protection for infants during their first few months of life.7 Although few pregnant women received influenza vaccination during July or August in this analysis, those who are vaccinated during these months might be subject to waning of protection against influenza-associated outcomes later in the season. Additional studies are needed to assess influenza VE and correlates of protection among pregnant women and infants after longer periods since vaccination to ensure that women are protected against influenza during pregnancy, in the postpartum period, and beyond.
Importantly, we found that only 34% of pregnant women testing negative for influenza in our analysis had received a 2023-2024 influenza vaccine before their ED/UC encounter. Other studies have found that influenza vaccination coverage has decreased in recent seasons as vaccine confidence has declined among pregnant women, with an estimated coverage of 38-47% among pregnant women for the 2023-2024 influenza season.19,20 The COVID-19 pandemic may have contributed to this decline, as higher influenza vaccination rates were observed in pregnant women prior to 2020.21 Studies have shown that a healthcare provider recommendation for vaccination in pregnancy increases the likelihood of uptake.6,19 Healthcare providers should continue to counsel pregnant patients on the risks and benefits of influenza vaccination for mother and baby.6,19
This analysis had several limitations. First, because the analysis relied on identification of current pregnancy through EHR data, we were unable to capture postpartum encounters. Late gestation vaccination was likely under ascertained due to the short timeframe for an ARI encounter. Second, some misclassification of pregnancy status and gestational age may have occurred due to the different methods used across sites. Third, pregnant women may exhibit a lower threshold to seek healthcare than non-pregnant women, and this study may have captured a higher frequency of pregnant women seeking care for ARI compared to the non-pregnant population. Fourth, this analysis included data from a single influenza season, and influenza A subtype data were not available. VE may vary by season and influenza A subtype.
Conclusions
Influenza vaccination during the U.S. 2023-2024 season was similarly effective against influenza-associated ED/UC encounters in pregnant and non-pregnant women. Among pregnant women, VE was not significantly different by gestational age at vaccination, which could suggest that VE depends more on timing of vaccination relative to the influenza season rather than gestational age at vaccination for the pregnant woman. Vaccination was effective in reducing the likelihood of influenza-associated ED/UC encounters by approximately half in both pregnant and non-pregnant women, yet only a third of those testing negative received the 2023-2024 influenza vaccine. Demonstrating that influenza vaccines are effective for pregnant women may lead to increased influenza vaccine uptake.
Disclaimer:
The findings and conclusions in this report are those of the authors and do not necessarily represent the official position of the Centers for Disease Control and Prevention.
Conflict of Interest Disclaimer:
All authors have completed and submitted the International Committee of Medical Journal Editors form for disclosure of potential conflicts of interest. During the conduct of the study, all Kaiser Permanente Southern California Department of Research and Evaluation and Kaiser Permanente Northern California Division of Research-affiliated authors reported receiving contractual support from the Centers for Disease Control and Prevention (CDC) via payments made to their respective institutions. Additionally, all authors affiliated with HealthPartners Institute, Intermountain Health, Kaiser Permanente Center for Health Research, Regenstrief Institute, and University of Colorado Anschutz Medical Campus reported receiving contractual support from the CDC during the conduct of the study, via subcontracts from Westat, Inc. with payments made to their respective institutions. Unrelated to the submitted work, the following disclosures were reported from the past 36 months: NPK reports support from Sanofi Pasteur, Merck, Pfizer, Seqirus, GlaxoSmithKline, Moderna, and Aztrazeneca. SYT reports contracts from Pfizer. SJG reports contracts with National Institutes of Health (NIH) National Center for Advancing Translational Sciences and NIH National Institute of Mental Health. TCO received consulting fees from Regenstrief Institute and support for travel from Patient-Centered Outcomes Research Institute (PCORI) and Regenstrief Institute and has a current patent, PCT/US2018/047961. GVB reports support from Sanofi Pasteur and Abbvie. TS is a member of CDC Advisory Committee on Immunization Practices Influenza Vaccine Work Group, chair of Utah Adult Immunization Coalition – volunteer vaccine quality improvement and advocacy group and a member of Utah Department of Health and Human Services Scientific Advisory Committee on Vaccines. OZ reports a contract with the National Institute of Allergy and Infectious Diseases. KBJ reports contracts with the National Institutes for Health and Pfizer. SBS reports a contract with Pfizer. LSS reports contracts with GlaxoSmithKline, Moderna, and Dynavax. BED, WFF, and MBD report contracts with Vaccine Safety Datalink Project. CR reports a grant from Indiana University Health. MAB was a speaker bureau participant – Innoviva Specialty Therapeutics -Oct 2023. SMO reports travel support from the Gates Foundation. No other disclosures were reported.
References
- 1.Callaghan WM, Creanga AA, Jamieson DJ. Pregnancy-Related Mortality Resulting From Influenza in the United States During the 2009-2010 Pandemic. Obstet Gynecol. 2015;126(3):486–490. doi: 10.1097/AOG.0000000000000996 [DOI] [PMC free article] [PubMed] [Google Scholar]
- 2.Mertz D, Geraci J, Winkup J, Gessner BD, Ortiz JR, Loeb M. Pregnancy as a risk factor for severe outcomes from influenza virus infection: A systematic review and meta-analysis of observational studies. Vaccine. 2017;35(4):521–528. doi: 10.1016/j.vaccine.2016.12.012 [DOI] [PMC free article] [PubMed] [Google Scholar]
- 3.Rasmussen SA, Jamieson DJ, Uyeki TM. Effects of influenza on pregnant women and infants. Am J Obstet Gynecol. 2012;207(3, Supplement):S3–S8. doi: 10.1016/j.ajog.2012.06.068 [DOI] [PubMed] [Google Scholar]
- 4.Mertz D, Kim TH, Johnstone J, et al. Populations at risk for severe or complicated influenza illness: systematic review and meta-analysis. BMJ. 2013;347:f5061. doi: 10.1136/bmj.f5061 [DOI] [PMC free article] [PubMed] [Google Scholar]
- 5.Dawood FS, Kittikraisak W, Patel A, et al. Incidence of influenza during pregnancy and association with pregnancy and perinatal outcomes in three middle-income countries: a multisite prospective longitudinal cohort study. Lancet Infect Dis. 2021;21(1):97–106. doi: 10.1016/S1473-3099(20)30592-2 [DOI] [PMC free article] [PubMed] [Google Scholar]
- 6.Olson SM, Dawood FS, Grohskopf LA, Ellington S. Preventing Influenza Virus Infection and Severe Influenza Among Pregnant People and Infants. J Women’s Heal. Published online November 4, 2024. doi: 10.1089/jwh.2024.0893 [DOI] [PMC free article] [PubMed] [Google Scholar]
- 7.Grohskopf LA, Ferdinands JM, Blanton LH, Broder KR, Loehr J. Prevention and Control of Seasonal Influenza with Vaccines: Recommendations of the Advisory Committee on Immunization Practices - United States, 2024-25 Influenza Season. MMWR Recomm Rep. 2024;73(5):1–25. doi: 10.15585/mmwr.rr7305a1 [DOI] [PMC free article] [PubMed] [Google Scholar]
- 8.Influenza in Pregnancy: Prevention and Treatment: ACOG Committee Statement No. 7. Obstet Gynecol. 2024;143(2):E24–E30. doi: 10.1097/AOG.0000000000005479 [DOI] [PubMed] [Google Scholar]
- 9.McMillan M, Porritt K, Kralik D, Costi L, Marshall H. Influenza vaccination during pregnancy: a systematic review of fetal death, spontaneous abortion, and congenital malformation safety outcomes. Vaccine. 2015;33(18):2108–2117. doi: 10.1016/j.vaccine.2015.02.068 [DOI] [PubMed] [Google Scholar]
- 10.Thompson MG, Kwong JC, Regan AK, et al. Influenza Vaccine Effectiveness in Preventing Influenza-associated Hospitalizations During Pregnancy: A Multi-country Retrospective Test Negative Design Study, 2010-2016. Clin Infect Dis. 2019;68(9):1444–1453. doi: 10.1093/cid/ciy737 [DOI] [PubMed] [Google Scholar]
- 11.Thompson MG, Li DK, Shifflett P, et al. Effectiveness of seasonal trivalent influenza vaccine for preventing influenza virus illness among pregnant women: a population-based case-control study during the 2010-2011 and 2011-2012 influenza seasons. Clin Infect Dis. 2014;58(4):449–457. doi: 10.1093/cid/cit750 [DOI] [PubMed] [Google Scholar]
- 12.Regan AK, Klerk N de, Moore HC, Omer SB, Shellam G, Effler PV. Effectiveness of seasonal trivalent influenza vaccination against hospital-attended acute respiratory infections in pregnant women: A retrospective cohort study. Vaccine. 2016;34(32):3649–3656. doi: 10.1016/j.vaccine.2016.05.032 [DOI] [PubMed] [Google Scholar]
- 13.Cuningham W, Geard N, Fielding JE, et al. Optimal timing of influenza vaccine during pregnancy: A systematic review and meta-analysis. Influenza Other Respi Viruses. 2019;13(5):438–452. doi: 10.1111/irv.12649 [DOI] [PMC free article] [PubMed] [Google Scholar]
- 14.Tenforde MW, Reeves EL, Weber ZA, et al. Influenza vaccine effectiveness against hospitalizations and emergency department or urgent care encounters for children, adolescents, and adults during the 2023-2024 season, United States. Clin Infect Dis. Published online December 4, 2024:ciae597. doi: 10.1093/cid/ciae597 [DOI] [PMC free article] [PubMed] [Google Scholar]
- 15.Naleway AL, Crane B, Irving SA, et al. Vaccine Safety Datalink infrastructure enhancements for evaluating the safety of maternal vaccination. Ther Adv drug Saf. 2021;12:20420986211021230. doi: 10.1177/20420986211021233 [DOI] [PMC free article] [PubMed] [Google Scholar]
- 16.Doll MK, Pettigrew SM, Ma J, Verma A. Effects of Confounding Bias in Coronavirus Disease 2019 (COVID-19) and Influenza Vaccine Effectiveness Test-Negative Designs Due to Correlated Influenza and COVID-19 Vaccination Behaviors. Clin Infect Dis. 2022;75(1):e564–e571. doi: 10.1093/cid/ciac234 [DOI] [PMC free article] [PubMed] [Google Scholar]
- 17.Preiksaitis C, Saxena M, Zhang J, Henkel A. Prevalence and Characteristics of Emergency Department Visits by Pregnant People: An Analysis of a National Emergency Department Sample (2010-2020). West J Emerg Med. 2024;25(3):436–443. doi: 10.5811/westjem.60461 [DOI] [PMC free article] [PubMed] [Google Scholar]
- 18.Olson SM, Sahni LC, Boom JA, Dawood FS, Muñoz FM, Ellington SR. Timing of influenza vaccination during pregnancy. Am J Obstet Gynecol MFM. 2024;6(8):101427. doi: 10.1016/j.ajogmf.2024.101427 [DOI] [PMC free article] [PubMed] [Google Scholar]
- 19.Calhoun K, Kahn KE, Razzaghi H, Garacci E, Lindley M, Black CL. Association of vaccine hesitancy with maternal influenza and Tdap vaccination coverage – United States, 2019–20 to 2022–23. Centers for Disease Control and Prevention. Published 2024. https://www.cdc.gov/fluvaxview/coverage-by-season/pregnant-2022-2023.html [Google Scholar]
- 20.Kahn KE, Garacci E, Razzaghi H, et al. Flu, Tdap, and COVID-19 Vaccination Coverage Among Pregnant Women – United States, April 2024. Published 2024. https://www.cdc.gov/fluvaxview/coverage-by-season/pregnant-april-2024.html [DOI] [PMC free article] [PubMed] [Google Scholar]
- 21.Irving SA, Crane B, Weintraub E, et al. Influenza Vaccination Among Pregnant People Before and During the Coronavirus Disease 2019 (COVID-19) Pandemic. Obstet Gynecol. 2023;142(3):636–639. doi: 10.1097/AOG.0000000000005285 [DOI] [PMC free article] [PubMed] [Google Scholar]