

Abstract
Background
Malnutrition is a prevalent issue in critically ill elderly patients and is closely linked to poor clinical outcomes. This study aimed to assess the prognostic value of four nutritional indices—modified nutrition risk in the critically ill (mNUTRIC), Geriatric Nutritional Risk Index (GNRI), hemoglobin, albumin, lymphocyte, and platelet (HALP), and neutrophil-to-lymphocyte ratio (NLR)—in predicting intensive care unit (ICU) outcomes.
Methods
This prospective cohort study included elderly patients (aged ≥ 65 years) who were admitted to the medical ICU of a tertiary care university hospital. Nutritional indices (mNUTRIC, GNRI, HALP, and NLR) were evaluated for their prognostic value in predicting 28-day mortality, ICU mortality, and ICU length of stay (LOS) using multivariable regression and receiver operating characteristic (ROC) curve analyses.
Results
Seventy-three patients were included, with a median age (interquartile range) of 74 (10) years and 56.2% male. The mNUTRIC score was identified as an independent risk factor for 28-day mortality (OR = 2.505, 95%CI: 1.164–5.391, p = 0.019) and ICU mortality (OR = 2.736, 95%CI: 1.350–5.545, p = 0.005), with strong predictive performance (AUC: 0.864 and 0.858, respectively). It was also associated with prolonged ICU LOS (RR = 1.117, 95% CI: 1.033–1.207, p = 0.005). While GNRI exhibited good predictive performance (AUC: 0.811 and 0.799 for 28-day mortality and ICU mortality, respectively), it was not an independent factor. In contrast, HALP and NLR showed limited prognostic value for mortality.
Conclusions
The mNUTRIC score was identified as the strongest prognostic tool, with GNRI also demonstrating considerable predictive value for mortality outcomes, enhancing nutritional risk screening and clinical decision-making in elderly ICU patients.
Supplementary Information
The online version contains supplementary material available at 10.1186/s12871-025-03232-6.
Keywords: Malnutrition, Older patients, Nutritional assessment, Clinical outcomes, Mortality, Intensive care unit
Introduction
Malnutrition is defined as the inadequate intake of macro- and micronutrients, resulting in a reduction of both fat and muscle mass, which negatively affects physical and mental performance, as well as overall clinical outcomes. Factors such as starvation, illness, or aging can contribute to the development of malnutrition [1].
In recent decades, malnutrition among elderly patients has become a significant concern, closely linked with increased mortality and morbidity. Nutritional deficiencies are prevalent among older adults, with studies indicating that 35–65% of hospitalized elderly individuals are malnourished [2, 3]. As with other hospital wards, malnutrition and its nutritional management are critical in the intensive care unit (ICU) [4]. Among critically ill patients, particularly the elderly, 38–78% experience varying severity of malnutrition [5]. A systematic review found that malnutrition in ICU patients is significantly associated with prolonged ICU length of stay (LOS), higher rates of ICU readmission, increased rates of infections, and increased hospital mortality [5].
There is no established diagnostic criteria for malnutrition [6]. Various nutrition screening tools are used to establish malnutrition risk, including the Nutritional Risk Screening 2002 (NRS-2002) [7], the Malnutrition Universal Screening Tool (MUST) [8], the Nutrition Risk in the Critically Ill (NUTRIC) or mNUTRIC (modified NUTRIC) [9, 10], Controlling Nutritional Status (CONUT) [11] and Prognostic Nutritional Index (PNI) [12]. The American Society for Parenteral and Enteral Nutrition (ASPEN) recommends using the NRS-2002 and the mNUTRIC to screen the nutritional status of ICU patients [13]. Among these tools, the mNUTRIC score was specifically developed for critically ill patients and is a widely used risk screening tool with strong predictive validity for mortality and vasopressor (VP) use [14, 15].
For the aging population, the Geriatric Nutritional Risk Index (GNRI) was developed to identify nutritional risk or malnutrition. Its calculation is based on readily available parameters, including actual body weight (BW), ideal BW, and serum albumin [16]. Previous research has established that lower GNRI scores were associated with poor prognosis in various populations, including patients with heart failure [17], chronic obstructive pulmonary disease [18], and malignancy [19].
Recently, the hemoglobin, albumin, lymphocyte, and platelet (HALP) score has gained recognition as an immune-nutritional marker for predicting clinical outcomes in various neoplasms. This score is derived from four laboratory parameters—hemoglobin, albumin, lymphocyte count, and platelet count—which reflect both nutritional and inflammatory status [20, 21]. The neutrophil-to-lymphocyte ratio (NLR) is an inflammatory marker that can be easily calculated from complete blood count results and reflects systemic inflammation [22]. Although research is limited, it has also been proposed as a useful marker for evaluating the nutritional status of geriatric patients [23].
Few nutritional screening instruments are available for elderly ICU patients despite their higher vulnerability to malnutrition. The primary aim of this study was to evaluate the prognostic value of mNUTRIC, GNRI, HALP, and NLR for 28-day mortality, ICU mortality, and ICU LOS in critically ill elderly patients. The secondary aims were to compare the utility, effectiveness, and prognostic value of these indices.
Methods
Study design
This cross-sectional, prospective, observational study was conducted in the 24-bed medical ICU of a tertiary care university hospital from June 2024 to December 2024. The inclusion criteria were: (1) age ≥ 65 years and (2) at least 24 h for ICU LOS. Patients who were discharged or died within the first 24 h of ICU admission were excluded. Additionally, those with hematological malignancies were excluded, as such conditions may affect NLR values. Patients were categorized into two groups in terms of their mortality status during the ICU hospitalization: survivors and non-survivors. For patients with multiple ICU hospitalizations, only data from their first admission were included to avoid duplication. The study was conducted in accordance with the Declaration of Helsinki and was approved by the University Ethics Committee (KA-24042). Informed consent was obtained from all patients included in the study.
Data collection
Throughout the study, a clinical pharmacist routinely attending the ICU prospectively collected data from patient medical records, focusing on the worst recorded values within the first 48 h of ICU admission. The collected data included (1) demographic characteristics (age, gender, height, weight, reason for ICU admission, and comorbidities); (2) illness severity scores such as Glasgow Coma Scale (GCS) score at admission, the Acute Physiology and Chronic Health Evaluation II (APACHE II) and Sequential Organ Failure Assessment (SOFA) at 24 h; (3) comorbidity score, Charlson comorbidity index (CCI); (4) vital signs (temperature, heart rate, respiratory rate, mean arterial pressure [MAP], and oxygen saturation); (5) laboratory parameters (creatinine, albumin, C-reactive protein [CRP], procalcitonin, hemoglobin, lactate, lymphocyte, NLR, platelet, sodium, potassium, magnesium, and phosphorus), (6) therapeutic interventions such as the use of VPs, vital organ support such as mechanical ventilation (MV) and renal replacement therapy (RRT), the initiation of nutritional support including enteral nutrition within the first 48 h, and (7) clinical outcomes including ICU LOS, 28-day mortality, and ICU mortality.
Nutritional risk screening
The NUTRIC score is the first nutritional risk screening tool specifically developed for ICU patients. In its original form, it incorporates multiple parameters—age, APACHE II, SOFA, number of comorbidities, days from hospital admission to ICU admission, and serum interleukin-6 (IL-6) levels—to estimate the risk of malnutrition [9]. Because IL-6 measurement may not be routinely feasible, a modified version known as the mNUTRIC score has been validated without the IL-6 component. The mNUTRIC scoring system ranges from 0 to 9, with values of 0–4 signifying a lower risk of malnutrition and 5–9 reflecting a higher risk [10].
The GNRI calculated was based on the formula: 1.489 × albumin (g/L) + 41.7 × actual BW (kg)/ideal BW (kg). If an individual’s actual weight is greater than their ideal weight, the ratio of actual to ideal weight is considered one. Patients were stratified into four malnutrition risk categories based on the GNRI as follows: major risk (GNRI < 82), moderate risk (GNRI 82 to < 92), low risk (GNRI 92 to ≤ 98), and no risk (GNRI > 98) [16].
The HALP score was calculated using the following formula: [hemoglobin (g/L) × albumin (g/L) × lymphocytes (/L)]/platelets (/L). The lower HALP score was associated with poor outcomes [20].
The NLR is automatically calculated and readily available within the laboratory results of the patients. Therefore, this ratio was directly retrieved from our hospital’s electronic medical record system.
Statistical analysis
Continuous variables were assessed for normality using the Kolmogorov-Smirnov test. Data following a normal distribution were expressed as mean ± standard deviation (SD), while non-normally distributed data were expressed as median with interquartile range (IQR). Comparisons of continuous variables between groups were performed using Student’s t-test for normally distributed data and Mann-Whitney U test for non-normally distributed data. Categorical variables were analyzed using the Pearson chi-squared test (χ²) or Fisher’s exact test.
A Cox regression analysis was conducted to evaluate the relation of the nutritional risk screening indices with 28-day mortality and mortality during ICU admission. The findings were reported as odds ratios (ORs) with 95% confidence intervals (CIs). Both crude and adjusted models were developed, incorporating variables with p < 0.05 in the bivariate analysis and those of clinical significance, including sex, ICU admission diagnosis (e.g., respiratory and circulatory), GCS, heart rate, invasive MV, and VP use. These variables were significantly associated with both 28-day mortality and mortality during ICU admission in the bivariate analysis and were therefore included in the adjusted models for both outcomes.
Receiver operating characteristic (ROC) curves were employed to evaluate the predictive performance of different scoring systems for 28-day mortality and mortality during ICU admission, quantified by the area under the curve (AUC). The optimal cutoff values were determined based on the highest combined sensitivity and specificity using Youden’s index.
Poisson regression analysis was employed to identify factors associated with ICU LOS. The model estimated rate ratios (RRs) with 95% CIs to evaluate the relationship between illness severity scores and nutritional indices with ICU LOS.
All statistical analyses were performed using IBM SPSS Statistics Version 27 (Chicago, IL, United States). A p-value of < 0.05 was considered statistically significant.
Results
Baseline patient characteristics
Throughout the study, 79 patients meeting the inclusion criteria were enrolled. However, six patients were excluded due to the presence of underlying hematological malignancies, including acute myeloid leukemia (n = 2), lymphoma (n = 3), and multiple myeloma (n = 1). Therefore, 73 patients (56.2% male) with a median (IQR) age of 74 (10) years were included and analyzed. The most common reasons for ICU admission were respiratory failure (43.8%), sepsis (15.1%), and circulatory failure (9.6%). As for comorbidities, the median (IQR) CCI among patients was 5 (3), with hypertension (63%) and diabetes mellitus (46.6%) being the most prevalent conditions (Table 1).
Table 1.
Clinical characteristics of non-survivor and survivor patients regarding ICU mortality
| Characteristics | ICU mortality | P | ||
|---|---|---|---|---|
|
Overall
(N = 73) |
Non-survivor
(N = 18) |
Survivor
(N = 55) |
||
| Age (years), median (IQR) | 74 (10) | 74 (12) | 74 (10) | 0.832 |
| Male, n (%) | 41 (56.2) | 14 (77.8) | 27 (49.1) | 0.033 |
| Weight (kg), mean (± SD) | 72.03 (± 19.05) | 73.16 (± 21.65) | 71.66 (± 18.33) | 0.985 |
| BMI (kg/m2), median (IQR) | 25.7 (8.7) | 24 (10.4) | 26 (8.2) | 0.381 |
| CCI, median (IQR) | 5 (3) | 6 (2) | 5 (2) | 0.264 |
| Comorbidities, n (%) | ||||
| Hypertension | 46 (63) | 10 (55.6) | 36 (65.5) | 0.450 |
| Diabetes mellitus | 34 (46.6) | 9 (50) | 25 (45.5) | 0.737 |
| Chronic artery disease | 32 (43.8) | 6 (33.3) | 26 (47.3) | 0.301 |
| COPD | 25 (34.2) | 3 (16.7) | 22 (34.2) | 0.070 |
| Atrial fibrillation | 22 (30.1) | 6 (33.3) | 16 (29.1) | 0.733 |
| Chronic heart failure | 19 (26) | 5 (27.8) | 14 (25.5) | 1.000 |
| Chronic kidney disease | 18 (24.7) | 5 (27.8) | 13 (23.6) | 0.758 |
| Solid organ malignancy | 17 (23.3) | 7 (38.9) | 10 (18.2) | 0.106 |
| Admission diagnosis, n (%) | ||||
| Respiratory failure | 32 (43.8) | 4 (22.2) | 28 (50.9) | 0.033 |
| Sepsis | 11 (15.1) | 3 (16.7) | 8 (14.5) | 1.000 |
| Circulatory failure | 7 (9.6) | 6 (33.3) | 1 (1.8) | < 0.001 |
| Gastrointestinal disorders | 6 (8.2) | 2 (11.1) | 4 (7.3) | 0.632 |
| Post-operative care | 6 (8.2) | 1 (5.6) | 5 (9.1) | 1.000 |
| Post-medical procedure care | 5 (6.8) | 0 (0) | 5 (9.1) | 0.324 |
| Cardiovascular disorders | 4 (5.5) | 1 (5.6) | 3 (5.5) | 1.000 |
| Renal disorders | 1 (1.4) | 0 (0) | 1 (1.8) | 1.000 |
| Other | 1 (1.4) | 1 (5.6) | 0 (0) | 0.247 |
| Admission GCS, median (IQR) | 15 (1) | 12 (11) | 15 (0) | < 0.001 |
| Vital signs, median (IQR) | ||||
| MAP (mmHg) | 84 (54) | 63 (69) | 94 (50) | 0.058 |
| Heart rate (beats/min) | 99 (54) | 110.5 (44) | 86 (50) | 0.014 |
| Respiratory rate (breaths/min) | 30 (6) | 30 (7) | 30 (6) | 0.267 |
| Temperature (oC) | 36.9 (1.2) | 37.2 (1.7) | 36.8 (1.2) | 0.191 |
| SaO2 (%) | 90 (4) | 89 (4) | 90 (4) | 0.576 |
| Vasopressor, n (%) | 14 (19.2) | 9 (50) | 5 (9.1) | < 0.001 |
| MV (IMV + NIMV), n (%) | 44 (60.3) | 13 (72.2) | 31 (56.4) | 0.233 |
| IMV, n (%) | 14 (19.2) | 10 (76.9) | 4 (12.9) | < 0.001 |
| RRT, n (%) | 8 (11) | 4 (22.2) | 4 (7.3) | 0.097 |
| Enteral nutrition, n (%) | 9 (12.3) | 4 (22.2) | 5 (9.1) | 0.211 |
| Laboratory values | ||||
| Creatinine (mg/dL), median (IQR) | 1.21 (1.36) | 1.97 (2.19) | 1 (1) | 0.008 |
| Albumin (g/dL), mean (± SD) | 3.03 (± 0.5) | 2.62 (± 0.52) | 3.16 (± 0.42) | < 0.001 |
| CRP (g/dL), median (IQR) | 78.41 (147.07) | 166.38 (215.93) | 66.29 (119.96) | 0.002 |
| Procalcitonin (ng/mL), median (IQR) | 0.35 (2.65) | 1.91 (23.65) | 0.15 (1.19) | 0.001 |
| Hemoglobin (g/dL), mean (± SD) | 9.92 (± 1.98) | 9.03 (± 2.12) | 10.21 (± 1.87) | 0.073 |
| Lactate (mmol/L), median (IQR) | 1.5 (1.7) | 2.25 (2.4) | 1.3 (1.4) | 0.002 |
| Lymphocyte (103/µL), median (IQR) | 0.78 (0.78) | 0.84 (1.27) | 0.76 (0.75) | 0.944 |
| Platelet (103/µL), mean (± SD) | 193.33 (± 110.43) | 127.78 (± 105.61) | 214.78 (± 104.15) | 0.002 |
| Sodium (mEq/L), median (IQR) | 137 (7) | 139 (14) | 137 (5) | 0.081 |
| Potassium (mEq/L), mean (± SD) | 4.08 (± 0.68) | 3.91 (± 0.95) | 4.14 (± 0.57) | 0.095 |
| Magnesium (mg/dL), median (IQR) | 1.84 (0.43) | 2.03 (0.43) | 1.75 (0.39) | 0.017 |
| Phosphorus (mg/dl), median (IQR) | 3.6 (1.57) | 3.79 (2.55) | 3.48 (1.37) | 0.139 |
| Severity of illness | ||||
| APACHE II, median (IQR) | 20 (9) | 30.5 (18) | 18.9 (5) | < 0.001 |
| SOFA, median (IQR) | 4 (5) | 12 (7) | 4 (3) | < 0.001 |
| Nutritional risk | ||||
| mNUTRIC, median (IQR) | 5 (2) | 7 (2) | 4 (2) | < 0.001 |
| mNUTRIC ≤ 5, n (%) | 44 (60.3) | 17 (94.4) | 27 (49.1) | < 0.001 |
| GNRI, mean (± SD) | 85.86 (± 7.66) | 79.4 (± 7.93) | 87.97 (± 6.32) | < 0.001 |
| GNRI risk classification, n (%) | 0.001 | |||
| Major risk (GNRI < 82) | 18 (24.7) | 10 (55.6) | 8 (14.5) | |
| Moderate risk (82 ≤ GNRI < 92) | 41 (56.2) | 7 (38.9) | 34 (61.8) | |
| Low risk (92 ≤ GNRI < 98) | 9 (12.3) | 1 (5.6) | 8 (14.5) | |
| No risk (GNRI > 98) | 5 (6.8) | 0 (0) | 5 (9.1) | |
| HALP score, median (IQR) | 12.22 (14.08) | 12.11 (28.49) | 12.22 (11.51) | 0.888 |
| NLR, median (IQR) | 11.82 (10.41) | 12.65 (23.75) | 11.18 (9.32) | 0.427 |
| ICU LOS, median (IQR) | 7 (12) | 14 (15) | 7 (8) | 0.018 |
APACHE II Acute Physiology and Chronic Health Evaluation II, BMI body mass index, CCI Charlson comorbidity index, COPD chronic obstructive pulmonary disease, CRP C-reactive protein, GCS Glasgow coma scale, GNRI geriatric nutritional risk index, HALP the hemoglobin, albumin, lymphocyte, platelet, ICU intensive care unit, IMV invasive mechanical ventilation, LOS length of stay, MAP mean arterial pressure, mNUTRIC modified nutrition risk in the critically ill, MV mechanical ventilation, NIMV non-invasive mechanical ventilation, NLR neutrophil-to-lymphocyte ratio, RRT renal replacement therapy, SaO2 oxygen saturation, SD standard deviation, SOFA Sequential Organ Failure Assessment
Bold values indicate statistical significance at p < 0.05
Significant differences were observed between non-survivors and survivors in terms of sex, ICU admission diagnosis including respiratory and circulatory failure, admission GCS, heart rate, and the use of VPs and invasive MV (p < 0.05). Several laboratory parameters—including creatinine, albumin, CRP, procalcitonin, lactate, platelets, and magnesium—also differed significantly between the two groups (p < 0.05). Non-survivors were characterized by significantly higher disease severity scores (APACHE II, SOFA) and longer ICU stays (p < 0.05).
In relation to ICU mortality, non-survivors (n = 18, 24.7%) had significantly higher mNUTRIC scores (p < 0.001) and lower GNRI scores (p < 0.001). In contrast, HALP scores (p = 0.888) and NLR values (p = 0.427) showed no statistically significant differences between the two groups (Table 1).
Consistent with ICU mortality outcomes, a comparable pattern was observed in the clinical characteristics of patients regarding 28-day mortality, where non-survivors (n = 14, 19.2%) had significantly higher mNUTRIC scores [non-survivor: 7 (2) vs. survivor: 5 (2), p < 0.001] and lower GNRI scores [non-survivor: 78.11 (± 7.76) vs. survivor: 87.7 (± 6.43), p < 0.001] compared to survivors. However, no significant differences were noted in HALP scores [non-survivor: 15.47 (28.53) vs. survivor: 12.14 (11.8), p = 0.933] or NLR values [non-survivor: 14.8 (24.91) vs. survivor: 10.75 (9.54), p = 0.145] between the two groups (Supplementary Table 1).
Regression analysis
Multivariable Cox regression models revealed the mNUTRIC score as an independent predictor of both 28-day mortality (OR = 2.505, 95%CI: 1.164–5.391, p = 0.019) and ICU mortality (OR = 2.736, 95%CI: 1.350–5.545, p = 0.005) even after adjusting sex, admission diagnosis (e.g., respiratory and circulatory failure), GCS, heart rate, invasive MV, and VP use. Additionally, the SOFA score demonstrated a significant association only with ICU mortality (OR = 1.622, 95%CI: 1.055–2.495, p = 0.028). In contrast, APACHE II, CCI, NLR, and HALP were not significant predictors for either 28-day or ICU mortality after adjustment for confounders (Table 2).
Table 2.
The regression analysis results to determine the relationship between prognostic indices and 28-day and ICU mortality
| Parameters | Crude regression | Adjusted regressiona | ||||
|---|---|---|---|---|---|---|
| OR | 95% CI | P | OR | 95% CI | P | |
| APACHE II Score | ||||||
| 28-day mortality | 1.070 | 1.013–1.130 | 0.016 | 1.092 | 0.966–1.234 | 0.160 |
| ICU mortality | 1.063 | 1.011–1.118 | 0.017 | 1.121 | 1.000-1.257 | 0.051 |
| SOFA Score | ||||||
| 28-day mortality | 1.241 | 1.094–1.407 | 0.001 | 1.445 | 0.937–2.228 | 0.096 |
| ICU mortality | 1.217 | 1.085–1.366 | 0.001 | 1.622 | 1.055–2.495 | 0.028 |
| CCI | ||||||
| 28-day mortality | 1.098 | 0.802–1.504 | 0.561 | 1.157 | 0.746–1.796 | 0.514 |
| ICU mortality | 1.149 | 0.851–1.551 | 0.366 | 1.223 | 0.802–1.863 | 0.350 |
| mNUTRIC Score | ||||||
| 28-day mortality | 1.451 | 1.058–1.991 | 0.021 | 2.505 | 1.164–5.391 | 0.019 |
| ICU mortality | 1.328 | 1.013–1.742 | 0.040 | 2.736 | 1.350–5.545 | 0.005 |
| GNRI | ||||||
| 28-day mortality | 0.898 | 0.837–0.963 | 0.002 | 0.971 | 0.883–1.067 | 0.539 |
| ICU mortality | 0.899 | 0.841–0.961 | 0.002 | 0.953 | 0.870–1.042 | 0.291 |
| HALP Score | ||||||
| 28-day mortality | 1.001 | 0.998–1.004 | 0.429 | 1.000 | 0.994–1.006 | 0.953 |
| ICU mortality | 1.002 | 0.999–1.005 | 0.304 | 1.003 | 0.998–1.008 | 0.300 |
| NLR | ||||||
| 28-day mortality | 1.017 | 1.001–1.034 | 0.035 | 1.005 | 0.983–1.027 | 0.669 |
| ICU mortality | 1.017 | 1.000-1.033 | 0.046 | 1.004 | 0.984–1.026 | 0.683 |
APACHE II Acute Physiology and Chronic Health Evaluation II, CCI Charlson comorbidity index, GNRI geriatric nutritional risk index, HALP the hemoglobin, albumin, lymphocyte, platelet, ICU intensive care unit, NLR neutrophil-to-lymphocyte ratio, SOFA Sequential Organ Failure Assessment.
aAdjusted for sex, ICU admission diagnosis (e.g., respiratory and circulatory), GCS, heart rate, invasive MV, and VP use
Bold values indicate statistical significance at p < 0.05
According to the Poisson regression analyses, each point increase in APACHE II, mNUTRIC, and HALP scores increases ICU LOS by 1.058 times (95% CI 1.037–1.080; p < 0.001), 1.117 times (95% CI 1.033–1.207; p = 0.005), and 1.001 times (95% CI 1.000-1.002; p = 0.026), respectively. At the same time, for each point decrease in SOFA and CCI score increases ICU LOS by 0.923 times (95% CI 0.889–0.958; p < 0.001) and 0.948 times (95% CI 0.909–0.989; p = 0.013), respectively.
Comparative analysis nutritional indices in predicting 28-day mortality and mortality during ICU admission
In the ROC analysis, APACHE II, SOFA, mNUTRIC, and GNRI were identified as significant prognostic indicators for both 28-day and mortality during ICU admission. Among these, SOFA demonstrated the highest predictive accuracy, achieving an AUC of 0.893 for 28-day mortality and 0.886 for ICU mortality. Regarding nutritional risk screening indices, mNUTRIC and GNRI demonstrated significant prognostic capabilities, with mNUTRIC showing an AUC of 0.864 for 28-day mortality and 0.858 for ICU mortality, while GNRI achieved an AUC of 0.811 and 0.799, respectively. Conversely, NLR and HALP were not found to be significant prognostic factors for either 28-day mortality or ICU mortality (Fig. 1; Table 3).
Fig. 1.
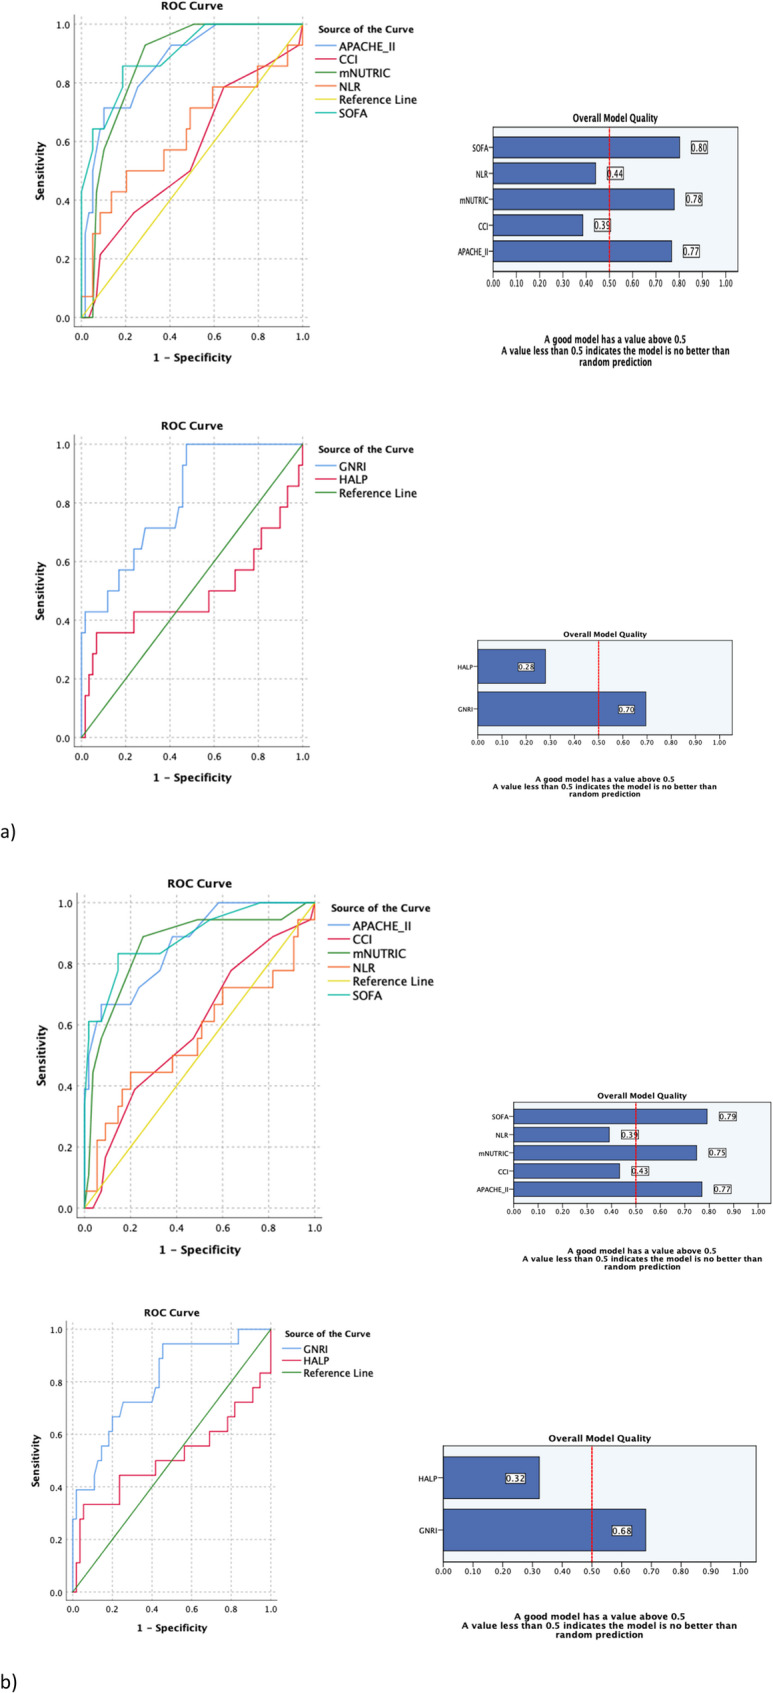
Receiver operating characteristics (ROC) curves demonstrating the accuracy of the predictive values of APACHE II, CCI, GNRI, HALP, mNUTRIC, NLR, and SOFA scores in determining mortality at 28-day (a) and ICU (b) mortality. *(a) 28-day mortality: APACHE II: AUC = 0.866 (95% CI: 0.767–0.964; p < 0.001), CCI: AUC = 0.560 (95% CI: 0.386–0.734; p = 0.501), GNRI: AUC = 0.811 (95% CI: 0.695–0.927; p < 0.001), HALP: AUC = 0.493 (95% CI: 0.280–0.705; p = 0.933), mNUTRIC: AUC = 0.864 (95% CI: 0.779–0.950, p < 0.001), NLR: AUC = 0.626 (95% CI: 0.440–0.811; p = 0.183), SOFA: AUC = 0.893 (95% CI: 0.802–0.985; p < 0.001). (b) ICU mortality: APACHE II: AUC = 0.865 (95% CI: 0.770–0.960; p < 0.001), CCI: AUC = 0.587 (95% CI: 0.433–0.741; p = 0.269), GNRI: AUC = 0.799 (95% CI: 0.681–0.918; p < 0.001), HALP: AUC = 0.511 (95% CI: 0.323–0.699; p = 0.888), mNUTRIC: AUC = 0.858 (95% CI: 0.749–0.967, p < 0.001), NLR: AUC = 0.563 (95% CI: 0.391–0.734; p = 0.475), SOFA: AUC = 0.886 (95% CI: 0.791–0.981; p < 0.001)
Table 3.
The ROC analysis results of the prognostic indices to predict 28-day and ICU mortality
| Parameters | AUC | Cut-off | Sensitivity | Specificity | PPV | NPV | P |
|---|---|---|---|---|---|---|---|
| APACHE II Score | |||||||
| 28-day mortality | 0.866 | > 26.50 | 0.714 | 0.898 | 0.700 | 0.904 | < 0.001 |
| ICU mortality | 0.865 | > 26.50 | 0.667 | 0.927 | 0.753 | 0.893 | < 0.001 |
| SOFA | |||||||
| 28-day mortality | 0.893 | > 6.50 | 0.857 | 0.186 | 0.260 | 0.796 | < 0.001 |
| ICU mortality | 0.886 | > 6.50 | 0.833 | 0.145 | 0.245 | 0.723 | < 0.001 |
| CCI | |||||||
| 28-day mortality | 0.560 | > 4.50 | 0.786 | 0.644 | 0.424 | 0.900 | 0.501 |
| ICU mortality | 0.587 | > 4.50 | 0.778 | 0.636 | 0.416 | 0.896 | 0.269 |
| mNUTRIC Score | |||||||
| 28-day mortality | 0.864 | > 5.50 | 0.929 | 0.288 | 0.303 | 0.924 | < 0.001 |
| ICU mortality | 0.858 | > 5.50 | 0.889 | 0.255 | 0.285 | 0.873 | < 0.001 |
| GNRI | |||||||
| 28-day mortality | 0.811 | < 86.00 | 0.929 | 0.458 | 0.364 | 0.951 | < 0.001 |
| ICU mortality | 0.799 | < 86.00 | 0.944 | 0.455 | 0.366 | 0.961 | < 0.001 |
| HALP Score | |||||||
| 28-day mortality | 0.493 | < 38.70 | 0.786 | 0.932 | 0.794 | 0.929 | 0.933 |
| ICU mortality | 0.511 | < 38.70 | 0.778 | 0.945 | 0.825 | 0.927 | 0.888 |
| NLR | |||||||
| 28-day mortality | 0.626 | > 16.00 | 0.500 | 0.223 | 0.177 | 0.572 | 0.183 |
| ICU mortality | 0.563 | > 16.00 | 0.444 | 0.200 | 0.156 | 0.519 | 0.475 |
APACHE II Acute Physiology and Chronic Health Evaluation II, CCI Charlson comorbidity index, GNRI geriatric nutritional risk index, HALP the hemoglobin, albumin, lymphocyte, platelet, ICU intensive care unit, NLR neutrophil-to-lymphocyte ratio, SOFA Sequential Organ Failure Assessment
Bold values indicate statistical significance at p < 0.05
Discussion
This study evaluated the prognostic value of mNUTRIC, GNRI, HALP, and NLR in predicting ICU LOS, 28-day, and ICU mortality among critically ill elderly patients. The findings revealed that higher mNUTRIC scores were significantly associated with prolonged ICU LOS, 28-day mortality, and ICU mortality, whereas lower HALP scores were only significantly negatively associated with ICU LOS. In contrast, other nutritional indices, including GNRI and NLR, did not demonstrate significant prognostic utility. Among nutritional indices, a good predictive performance of the mNUTRIC and GNRI was found regarding 28-day and mortality during ICU admission. These findings underlined the clinical significance of mNUTRIC in prognostic assessment of critically ill elderly patients, confirming its utility as a valuable nutritional risk screening tool even within this small study population.
Malnutrition is closely linked to higher mortality and morbidity rates among older adults [24]. In our study, the ICU mortality rate was 24.7%. A systematic review reported that ICU mortality rates among older adults ranged from 6 to 51% in single-center prospective studies [25]. We found that malnutrition was significantly common in non-survivor groups when evaluated using mNUTRIC and GNRI, but no such relation was observed with the HALP and NLR. More than half of the critically ill elderly patients were categorized as having a high nutritional risk according to the mNUTRIC score (mNUTRIC ≥ 5), with this rate rising significantly to 94.4% among non-survivors. These findings are consistent with recent data from a study on elderly ICU patients [26]. When assessed using the GNRI, 24.7% of critically ill elderly patients and 55.6% of non-survivors were identified as having a major risk. Another study reported that 28.6% of elderly ICU patients were classified as being at major risk according to the GNRI, with an ICU mortality rate of 24.3% in this group [27]. In the present study, the HALP score was not significantly different between survivor and non-survivor groups, consistent with findings from other studies [26, 28]. In contrast, another study on very elderly ICU patients (≥ 75 years) with ischemic stroke reported that the HALP score was significantly lower among non-survivors [29]. The NLR showed no significant difference between the two groups in our population concerning both 28-day and mortality during ICU admission. However, another study not specifically focused on elderly patients showed a significant relationship between NLR and both 1-week and 3-month mortality in ICU patients [28]. These results highlight the variability in malnutrition prevalence and its associated outcomes, depending on the patient’s status and the screening or assessment methods employed.
In this study, multivariable Cox regression analysis revealed that higher mNUTRIC scores were linked to an elevated risk of both 28-day and mortality during ICU admission. These results align with findings from previous studies [30–32]. Notably, while SOFA scores were only associated with ICU mortality, indices such as GNRI, HALP score, and NLR, were not identified as significant prognostic factors for either 28-day or mortality during ICU admission in our cohort. Previous studies have reported GNRI as an independent risk factor for 28-day and 30-day mortality in critically ill elderly patients [33, 34]. Regarding the HALP score, our study showed no significant relationship with both 28-day and mortality during ICU admission, consistent with other studies [26, 28]. Additionally, although our findings did not identify NLR as a significant prognostic marker, a regression analysis by Deniz et al. [35] demonstrated a significant association between higher NLR values and ICU mortality.
Malnutrition is also linked to a prolonged ICU stay [36]. In our study, a Poisson regression analysis showed that mNUTRIC was positively associated with ICU LOS. Similarly, a meta-analysis indicated that a high mNUTRIC score was associated with a prolonged ICU LOS [37]. In our population, a significant relationship was also observed between HALP and ICU LOS. However, other nutritional indices, including GNRI and NLR, did not exhibit any significant relationship with ICU LOS. Conversely, a study reported a weak negative significant association between GNRI and ICU LOS, while no observed association between HALP and ICU LOS [25]. In addition, another study reported a statistically significant but very weak positive correlation between NLR and ICU LOS [35].
In the ROC analysis, APACHE II, SOFA, mNUTRIC, and GNRI were identified as significant prognostic indices for predicting both 28-day and mortality during ICU admission, with the SOFA score demonstrating the highest performance (AUC for 28-day mortality = 0.893; AUC for ICU mortality = 0.886). Among the nutritional indices, mNUTRIC (AUC for 28-day mortality = 0.864; AUC for ICU mortality = 0.858) and GNRI (AUC for 28-day mortality = 0.811; AUC for ICU mortality = 0.799) exhibited good predictive performance in assessing prognosis in our cohort. Validation studies have also highlighted the predictive capability of mNUTRIC for 28-day mortality, with an AUC of 0.783 reported by Heyland et al. [9] and an AUC of 0.648 reported by Rahman et al. [10]. Moreover, Mahmoodpoor et al. [32] reported an AUC of 0.973, and Guliyeva et al. [38] reported an AUC of 0.729 for mNUTRIC in predicting ICU mortality. Additionally, consistent with our results regarding GNRI, Kollu et al. [26] showed the predictive value of the GNRI for ICU mortality (AUC = 0.633; p = 0.003). In contrast, we found that HALP was ineffective in predicting prognosis, aligning with previous studies [26, 28]. Regarding NLR, our analysis also did not identify it as a significant prognostic factor for 28-day and mortality during ICU admission, which contrasts with the findings of Deniz et al. [35] reporting a significant predictive value for NLR in ICU mortality (AUC = 0.685; p < 0.001). The variability in the prognostic value of these indices across studies could be influenced by differences in patient populations, the specific nutritional and inflammatory statuses of critically ill elderly patients, or variations in the methodological approaches used for assessment.
Our study has several limitations. First, its single-center design and relatively small sample size restrict the generalizability of the findings. Second, while data were collected prospectively, the study did not evaluate long-term outcomes, limiting the assessment of the nutritional indices’ prognostic value beyond the ICU setting or larger patient populations. Lastly, the mortality rates in our cohort were relatively low, which may have reduced the statistical power to detect significant associations between nutritional indices and mortality outcomes.
Future research should validate these findings in larger cohorts and explore how nutritional indices can guide targeted and individualized nutrition strategies to improve outcomes in critically ill elderly patients during their ICU stay and following ICU discharge.
Conclusions
Among the nutritional indices evaluated, the mNUTRIC score emerged as the most robust and clinically relevant prognostic tool, demonstrating strong associations with ICU LOS, 28-day mortality, and ICU mortality. While the GNRI showed good prognostic performance for mortality in ROC analysis, it was not identified as an independent risk factor in multivariable Cox regression analysis. Conversely, the HALP score and NLR exhibited limited prognostic value and were not significantly associated with mortality or ICU outcomes in this cohort. These findings emphasize the critical role of the mNUTRIC score in early risk stratification and management of critically ill elderly patients, with GNRI serving as a complementary tool for nutritional risk screening. Incorporating these indices into routine clinical practice has the potential to improve risk prediction and guide tailored interventions to improve outcomes in this vulnerable population.
Supplementary Information
Acknowledgements
None.
Abbreviations
- APACHE II
Acute Physiology and Chronic Health Evaluation II
- AUC
Area Under the Curve
- ASPEN
American Society for Parenteral and Enteral Nutrition
- BMI
Body Mass Index
- BW
Body Weight
- CCI
Charlson Comorbidity Index
- CONUT
Controlling Nutritional Status
- COPD
Chronic Obstructive Pulmonary Disease
- CRP
C-Reactive Protein
- GCS
Glasgow Coma Scale
- GNRI
Geriatric Nutritional Risk Index
- HALP
Hemoglobin, Albumin, Lymphocyte, Platelet
- ICU
Intensive Care Unit
- IL-6
Interleukin-6
- IMV
Invasive Mechanical Ventilation
- IQR
Interquartile Range
- LOS
Length of Stay
- MAP
Mean Arterial Pressure
- mNUTRIC
Modified Nutrition Risk in the Critically Ill
- MUST
Malnutrition Universal Screening Tool
- MV
Mechanical Ventilation
- NIMV
Non-Invasive Mechanical Ventilation
- NLR
Neutrophil-to-Lymphocyte Ratio
- NRS-2002
Nutritional Risk Screening 2002
- OR
Odds Ratio
- PNI
Prognostic Nutritional Index
- ROC
Receiver Operating Characteristic
- RR
Rate Ratio
- RRT
Renal Replacement Therapy
- SaO₂
Oxygen Saturation
- SD
Standard Deviation
- SOFA
Sequential Organ Failure Assessment
- VP
Vasopressor
Authors’ contributions
Ugur Balaban: Conceptualization, methodology, validation, formal analysis, investigation, data curation, writing– original draft, visualization. Nadir Yalcin: Methodology, Investigation, formal analysis, data curation, writing– review & editing. Esat Kivanc Kaya: Investigation, resources, writing– review & editing. Ebru Ortac Ersoy: Investigation, resources, writing– review & editing, supervision. Kutay Demirkan: Methodology, investigation, writing– review & editing, supervision. All authors read and approved the submitted version of the manuscript.
Funding
None.
Data availability
The datasets used and/or analysed during the current study are available from the corresponding author on reasonable request.
Declarations
Ethics approval and consent to participate
The study was conducted in accordance with the Declaration of Helsinki and was approved by the Hacettepe University Clinical Research Ethics Committee (KA-24042). Informed consent was obtained from all patients included in the study.
Consent for publication
Not applicable.
Competing interests
The authors declare no competing interests.
Footnotes
Publisher’s Note
Springer Nature remains neutral with regard to jurisdictional claims in published maps and institutional affiliations.
References
- 1.Cederholm T, Barazzoni R, Austin P, et al. ESPEN guidelines on definitions and terminology of clinical nutrition. Clin Nutr. 2017;36(1):49–64. 10.1016/j.clnu.2016.09.004. [DOI] [PubMed] [Google Scholar]
- 2.Posner BM, Jette AM, Smith KW, Miller DR. Nutrition and health risks in the elderly: the nutrition screening initiative. Am J Public Health. 1993;83(7):972–8. 10.2105/ajph.83.7.972. [DOI] [PMC free article] [PubMed] [Google Scholar]
- 3.Guyonnet S, Rolland Y. Screening for malnutrition in older people. Clin Geriatr Med. 2015;31(3):429–37. 10.1016/j.cger.2015.04.009. [DOI] [PubMed] [Google Scholar]
- 4.Singer P, Blaser AR, Berger MM, et al. ESPEN practical and partially revised guideline: clinical nutrition in the intensive care unit. Clin Nutr. 2023;42(9):1671–89. 10.1016/j.clnu.2023.07.011. [DOI] [PubMed] [Google Scholar]
- 5.Lew CCH, Yandell R, Fraser RJL, Chua AP, Chong MFF, Miller M. Association between malnutrition and clinical outcomes in the intensive care unit: A systematic review [Formula: see text]. JPEN J Parenter Enter Nutr. 2017;41(5):744–58. 10.1177/0148607115625638. [DOI] [PubMed] [Google Scholar]
- 6.McClave SA, Omer EM, Lowen CC, Martindale RG. The challenge of integrating a diagnosis of malnutrition in the practical application of nutrition care in the intensive care unit. Nutr Clin Pract. 2025;40(1):26–33. 10.1002/ncp.11260. [DOI] [PubMed] [Google Scholar]
- 7.Kondrup J, Rasmussen HH, Hamberg O, Stanga Z, Ad Hoc EWG. Nutritional risk screening (NRS 2002): a new method based on an analysis of controlled clinical trials. Clin Nutr. 2003;22(3):321–36. 10.1016/s0261-5614(02)00214-5. [DOI] [PubMed] [Google Scholar]
- 8.Stratton RJ, Hackston A, Longmore D, et al. Malnutrition in hospital outpatients and inpatients: prevalence, concurrent validity and ease of use of the ‘malnutrition universal screening tool’ (‘MUST’) for adults. Br J Nutr. 2004;92(5):799–808. 10.1079/bjn20041258. [DOI] [PubMed] [Google Scholar]
- 9.Heyland DK, Dhaliwal R, Jiang X, Day AG. Identifying critically ill patients who benefit the most from nutrition therapy: the development and initial validation of a novel risk assessment tool. Crit Care. 2011;15(6):R268. 10.1186/cc10546. [DOI] [PMC free article] [PubMed] [Google Scholar]
- 10.Rahman A, Hasan RM, Agarwala R, Martin C, Day AG, Heyland DK. Identifying critically-ill patients who will benefit most from nutritional therapy: further validation of the modified NUTRIC nutritional risk assessment tool. Clin Nutr. 2016;35(1):158–62. 10.1016/j.clnu.2015.01.015. [DOI] [PubMed] [Google Scholar]
- 11.de Ignacio J, Gonzalez-Madrono A, de Villar NG, et al. CONUT: a tool for controlling nutritional status. First validation in a hospital population. Nutr Hosp. 2005;20(1):38–45. [PubMed] [Google Scholar]
- 12.Onodera T, Goseki N, Kosaki G. [Prognostic nutritional index in Gastrointestinal surgery of malnourished cancer patients]. Nihon Geka Gakkai Zasshi. 1984;85(9):1001–5. [PubMed] [Google Scholar]
- 13.McClave SA, Taylor BE, Martindale RG, et al. Guidelines for the provision and assessment of nutrition support therapy in the adult critically ill patient: society of critical care medicine (SCCM) and American society for parenteral and enteral nutrition (A.S.P.E.N). JPEN J Parenter Enter Nutr. 2016;40(2):159–211. 10.1177/0148607115621863. [DOI] [PubMed] [Google Scholar]
- 14.Domenech-Briz V, Gea-Caballero V, Czapla M, et al. Importance of nutritional assessment tools in the critically ill patient: A systematic review. Front Nutr. 2023;9:1073782. 10.3389/fnut.2022.1073782. [DOI] [PMC free article] [PubMed] [Google Scholar]
- 15.Yildirim M, Yildirim ZS, Deniz M. Effect of the modified NUTRIC score in predicting the prognosis of patients admitted to intensive care units. BMC Anesthesiol. 2024;24(1):473. 10.1186/s12871-024-02866-2. Published 2024 Dec 23. [DOI] [PMC free article] [PubMed] [Google Scholar]
- 16.Bouillanne O, Morineau G, Dupont C, et al. Geriatric nutritional risk index: a new index for evaluating at-risk elderly medical patients. Am J Clin Nutr. 2005;82(4):777–83. 10.1093/ajcn/82.4.777. [DOI] [PubMed] [Google Scholar]
- 17.Li H, Cen K, Sun W, Feng B. Prognostic value of geriatric nutritional risk index in elderly patients with heart failure: a meta-analysis. Aging Clin Exp Res. 2021;33(6):1477–86. 10.1007/s40520-020-01656-3. [DOI] [PubMed] [Google Scholar]
- 18.Matsumura T, Mitani Y, Oki Y, et al. Comparison of geriatric nutritional risk index scores on physical performance among elderly patients with chronic obstructive pulmonary disease. Heart Lung. 2015;44(6):534–8. 10.1016/j.hrtlng.2015.08.004. [DOI] [PubMed] [Google Scholar]
- 19.Lv GY, An L, Sun DW. Geriatric nutritional risk index predicts adverse outcomes in human malignancy: A Meta-Analysis. Dis Markers. 2019;2019:4796598. 10.1155/2019/4796598. [DOI] [PMC free article] [PubMed] [Google Scholar]
- 20.Chen XL, Xue L, Wang W, et al. Prognostic significance of the combination of preoperative hemoglobin, albumin, lymphocyte and platelet in patients with gastric carcinoma: a retrospective cohort study. Oncotarget. 2015;6(38):41370–82. 10.18632/oncotarget.5629. [DOI] [PMC free article] [PubMed] [Google Scholar]
- 21.Farag CM, Antar R, Akosman S, Ng M, Whalen MJ. What is hemoglobin, albumin, lymphocyte, platelet (HALP) score? A comprehensive literature review of halp’s prognostic ability in different cancer types. Oncotarget. 2023;14:153–72. 10.18632/oncotarget.28367. [DOI] [PMC free article] [PubMed] [Google Scholar]
- 22.Zahorec R. Neutrophil-to-lymphocyte ratio, past, present and future perspectives. Bratisl Lek Listy. 2021;122(7):474–88. 10.4149/BLL_2021_078. [DOI] [PubMed] [Google Scholar]
- 23.Kaya T, Acikgoz SB, Yildirim M, Nalbant A, Altas AE, Cinemre H. Association between neutrophil-to-lymphocyte ratio and nutritional status in geriatric patients. J Clin Lab Anal. 2019;33(1):e22636. 10.1002/jcla.22636. [DOI] [PMC free article] [PubMed] [Google Scholar]
- 24.Dent E, Wright ORL, Woo J, Hoogendijk EO. Malnutrition in older adults. Lancet. 2023;401(10380):951–66. 10.1016/S0140-6736(22)02612-5. [DOI] [PubMed] [Google Scholar]
- 25.Vallet H, Schwarz GL, Flaatten H, de Lange DW, Guidet B, Dechartres A. Mortality of older patients admitted to an ICU: A systematic review. Crit Care Med. 2021;49(2):324–34. 10.1097/CCM.0000000000004772. [DOI] [PubMed] [Google Scholar]
- 26.Kollu K, Akbudak Yerdelen E, Duran S, Kabatas B, Karakas F, Kizilarslanoglu MC. Comparison of nutritional risk indices (PNI, GNRI, mNUTRIC) and HALP score in predicting adverse clinical outcomes in older patients staying in an intensive care unit. Med (Baltim). 2024;103(25):e38672. 10.1097/MD.0000000000038672. [DOI] [PMC free article] [PubMed] [Google Scholar]
- 27.Peng JC, Zhu YW, Xing SP, Li W, Gao Y, Gong WW. Association of geriatric nutritional risk index with all-cause hospital mortality among elderly patients in intensive care unit. Front Nutr. 2023;10:1117054. 10.3389/fnut.2023.1117054. [DOI] [PMC free article] [PubMed] [Google Scholar]
- 28.Kocaoğlu S, A T. The efficiency of HALP score, neutrophil-lymphocyte ratio, and platelet-lymphocyte ratio in predicting mortality in intensive care patients. J Health Sci Med. 2022;5(1):201–6. 10.32322/jhsm.1017889. [Google Scholar]
- 29.Soylu VG. Relationship between hemoglobin, albumin, lymphocyte, and platelet (HALP) score and 28-day mortality in very elderly geriatric critically ill patients with acute ischemic stroke. J Med Palliat Care. 2023;4(1):41–5. 10.47582/jompac.1209078. [Google Scholar]
- 30.Mendes R, Policarpo S, Fortuna P, et al. Nutritional risk assessment and cultural validation of the modified NUTRIC score in critically ill patients-A multicenter prospective cohort study. J Crit Care. 2017;37:249. 10.1016/j.jcrc.2016.09.007. [DOI] [PubMed] [Google Scholar]
- 31.Wang N, Wang MP, Jiang L, Du B, Zhu B, Xi XM. Association between the modified nutrition risk in critically ill (mNUTRIC) score and clinical outcomes in the intensive care unit: a secondary analysis of a large prospective observational study. BMC Anesthesiol. 2021;21(1):220. 10.1186/s12871-021-01439-x. [DOI] [PMC free article] [PubMed] [Google Scholar]
- 32.Mahmoodpoor A, Sanaie S, Sarfaraz T, et al. Prognostic values of modified NUTRIC score to assess outcomes in critically ill patients admitted to the intensive care units: prospective observational study. BMC Anesthesiol. 2023;23(1):131. 10.1186/s12871-023-02086-0. [DOI] [PMC free article] [PubMed] [Google Scholar]
- 33.Yenibertiz D, Cirik MO. The comparison of GNRI and other nutritional indexes on short-term survival in geriatric patients treated for respiratory failure. Aging Clin Exp Res. 2021;33(3):611–7. 10.1007/s40520-020-01740-8. [DOI] [PubMed] [Google Scholar]
- 34.Li L, Lu X, Qin S, Huang D. Association between geriatric nutritional risk index and 28 days mortality in elderly patients with sepsis: a retrospective cohort study. Front Med (Lausanne). 2023;10:1258037. 10.3389/fmed.2023.1258037. [DOI] [PMC free article] [PubMed] [Google Scholar]
- 35.Deniz M, Ozgun P, Ozdemir E. Relationships between RDW, NLR, CAR, and APACHE II scores in the context of predicting the prognosis and mortality in ICU patients. Eur Rev Med Pharmacol Sci. 2022;26(12):4258–67. 10.26355/eurrev_202206_29063. [DOI] [PubMed] [Google Scholar]
- 36.Sheean PM, Peterson SJ, Chen Y, Liu D, Lateef O, Braunschweig CA. Utilizing multiple methods to classify malnutrition among elderly patients admitted to the medical and surgical intensive care units (ICU). Clin Nutr. 2013;32(5):752–7. 10.1016/j.clnu.2012.12.012. [DOI] [PMC free article] [PubMed] [Google Scholar]
- 37.Ibrahim DA, Elkabarity RH, Moustafa ME, El-Gendy HA. Modified NUTRIC score and outcomes in critically ill patients: A meta-analysis. Egypt J Anaesth. 2020;36(1):288–96. 10.1080/11101849.2020.1848240. [Google Scholar]
- 38.Guliyeva M, Erdemir B, Halacli B, Guven G, Kaya EK, Topeli Iskit A, Ortac Ersoy NE. Determination of the relationship between NRS-2002, modified nutric scores and GLIM criteria with mortality used in malnutrition screening in intensive care patients. J Crit Care. 2024;81:154645. 10.1016/j.jcrc.2024.154645. [Google Scholar]
Associated Data
This section collects any data citations, data availability statements, or supplementary materials included in this article.
Supplementary Materials
Data Availability Statement
The datasets used and/or analysed during the current study are available from the corresponding author on reasonable request.