

Abstract
Objective:
Klinefelter syndrome (KS, 47, XXY), the most common sex chromosome aneuploidy in males, is characterized by testicular failure and testosterone deficiency as well as a variety of cognitive, social, and emotional challenges. In the current study, we aimed to clarify the cognitive-behavioral profile of peripubertal boys with KS using measures of cognition, academic achievement, adaptive behavior, and quality of life.
Method:
We compared 47 boys with KS (7–16 years of age) to 55 performance IQ-matched boys without KS on measures of cognition (WISC-V), executive function (BRIEF-2), academic achievement (KTEA-3), adaptive behavior (Vineland-3), and quality of life (PROMIS). In exploratory analyses, we examined associations among these measures, as well as potential associations with pubertal metrics.
Results:
Boys with KS demonstrated a significantly different profile of cognition, behavioral ratings of executive function, academic achievement, adaptive behavior, and quality of life compared to their typically developing (TD) peers, with, on average, lower functioning. The groups showed significantly different correlations between cognition and aspects of quality of life. No associations were observed between behavior and pubertal development.
Conclusions:
Taken together, these findings indicated that boys with KS are at increased risk for cognitive difficulties, which may impact academic achievement, adaptive behavior, and quality of life. While initial exploratory analyses indicated that the magnitude of these alterations was not correlated with severity of testicular failure, longitudinal analyses currently being conducted by our group may help clarify the trajectory of these difficulties through the pubertal transition and testosterone replacement.
Keywords: cognition, executive function, quality of life, puberty, children and adolescents
INTRODUCTION
Klinefelter syndrome (KS) is the most common sex chromosome aneuploidy, occurring in up to 1 in 450 males.1 Whereas typically developing males have one X chromosome and one Y chromosome, individuals with KS have an extra X chromosome (47, XXY). KS is characterized by testicular failure and testosterone deficiency as well as a variety of cognitive, social, and emotional characteristics. Boys with KS may be at increased risk for speech and language problems, learning difficulties, and executive function deficits despite having intact nonverbal reasoning skills.2
KS-associated cognitive difficulties may negatively affect academic and adaptive functioning.2 Inattention and language-based learning disabilities with deficits in phonological processing and verbal memory are common in KS.3 Because academic instruction is largely verbally based, these underlying deficits in verbal learning and reading can cause individuals with KS to fall behind in other subjects by late adolescence.4 Rovet and colleagues found that school-aged boys with KS were more likely to have failed one or more grades or to have received special education services than unaffected siblings.4 This cohort of boys demonstrated progressively declining scores on standardized testing throughout childhood such that, on average, they performed more than five grades below grade level by adulthood.
Adaptive behavior refers to a set of conceptual, social, and practical skills necessary to function independently in everyday life. Success depends not only on intact cognitive functioning but also on ability to employ these skills purposefully to adapt to dynamic social and work demands.2 While Nielsen and Pelsen found that adults with KS reported lower adaptive functioning (e.g., fewer friends, poorer family relationships, lower energy and initiative),5 Boada and colleagues (2009) described that a large percentage of adults with KS were successful in their personal lives and careers.2
Closely related to adaptive behavior, quality of life may be impacted by KS. Close and colleagues found that peripubertal boys with KS demonstrated lower quality of life, reduced self-esteem, and higher risk for depression relative to the normative group.6 Within this cohort, quality of life was inversely associated with physical manifestations of KS (e.g., tall stature, higher BMI, decreased testicular volume) such that more severe physical symptoms were predictive of lower quality of life. However, there was no significant difference in quality of life between the prepubertal and pubertal KS groups, suggesting quality of life may be impacted throughout the peripubertal timeframe. Additional studies comparing quality of life in peripubertal boys are needed to clarify potential discrepancies.
The neuropsychological profile of KS likely results from a complex interaction of genetic (e.g., gene dosage effects of the extra X chromosome), hormonal (e.g., decreased testosterone, elevated gonadotrophins), and environmental (e.g., socioeconomic status, access to therapies) factors. Current standard treatment for KS includes testosterone replacement therapy (TRT) initiated in the peripubertal period to address testosterone deficiency symptoms and initiate/continue development of secondary sex characteristics.7 Puberty is presumed to be a critical time for the emergence of physical and psychosocial issues associated with testicular failure and reduced production of testosterone.8 Few studies have directly assessed potential effects of testicular failure on the neuropsychological features of KS. We aim to fill this critical gap in the literature by assessing potential associations between testicular failure and selected outcome measures in peripubertal boys with KS.
This cross-sectional study is designed to elucidate cognition and, specifically, executive function in peripubertal boys with KS, particularly as they relate to academic achievement, adaptive behavior, and quality of life. To the best of our knowledge, this is the first study of peripubertal boys with KS utilizing these standardized neuropsychological assessments that includes a performance-IQ matched TD group. We compared 47 boys with KS (7–16 years of age) to 55 performance IQ-matched boys without KS on age-normed measures of cognition, behavioral ratings of executive function, academic achievement, adaptive behavior, and quality of life. Because verbal IQ deficits are common in KS,3 groups were matched based on performance IQ (i.e., visuospatial functioning) rather than overall IQ. In post-hoc analyses, we explored potential associations between cognition and selected outcomes (behavioral ratings of executive function, academic achievement, adaptive behavior, and quality of life) as well as potential associations between pubertal metrics and these outcomes.
METHOD
Participants
Data were collected as part of a longitudinal study examining cognition, mood, behavior, and neurodevelopment in school-aged boys with KS and their sex- and performance IQ-matched peers. Because verbal IQ deficits are common in KS,3 groups were matched based on visuospatial subtests of the WISC-V (Visual Spatial Index) rather than overall IQ (Full Scale IQ). Participants with KS were recruited through university- and community-based pediatricians, pediatric endocrinologists, and medical geneticists as well as through advertisements in local and national chapters of organizations serving individuals with KS and their families (e.g., the Association of X and Y Chromosome Variations/AXYS and the eXtraordinarY Kids Clinics at Nemours/Alfred I DuPont Hospital for Children and Stanford University). Within the KS group, 24 participants were diagnosed prenatally, one was diagnosed at birth, and 21 were diagnosed postnatally. For one participant in the KS group, timing of diagnosis was unknown. The typically developing control group was recruited through advertisements in internet bulletin boards, schools, and parent organizations. For each participant in the KS group, diagnosis was confirmed by karyotype analysis demonstrating non-mosaic KS. Participants in both groups were excluded if they had history of traumatic brain injury, hypoxic-ischemic encephalopathy, uncontrolled seizure disorder, or psychosis. English was the primary language spoken for all participants. A total of 102 participants (NKS=47, mean age=11.95 years, range=7.00–16.91; NTD=55, mean age=11.00 years, range=8.23–14.71) met inclusion criteria and underwent neuropsychological assessment at one of two testing sites.
Procedures
Study protocols were carried out in accordance with the Declaration of Helsinki and were approved by the Institutional Review Boards. Prior to participation, informed consent was obtained from the parent/guardian and informed assent was obtained from each participant. Trained assessors supervised by a psychologist administered all assessments. To assess a range of core areas potentially impacted by KS, each participant completed the following: Wechsler Intelligence Scale for Children, Fifth Edition (WISC-V),9 Kaufman Test of Educational Achievement, Third Edition, Brief Form (KTEA-3 Brief),10 Behavior Rating Inventory of Executive Function, Second Edition (BRIEF-2) parent-report,11 Vineland Adaptive Behavior Scales, Third Edition (Vineland-3) parent-report,12 and Patient Reported Outcomes Measurement Information System (PROMIS) self-report.13 For each participant, one parent completed the two subtest Wechsler Abbreviated Scale of Intelligence, Second Edition (WASI-II)14 for parental IQ estimate. All cognitive, parent-report, and self-report measures were completed across 2–3 days. For all study visits completed prior to March 2020 at both sites (and for visits completed at Nemours after March 2020), all cognitive and child self-report measures were completed in-person, with a trained assessor (NKS=32, NTD=32). For visits completed at Stanford after March 2020, cognitive and child self-report measures were completed via secure video visit, with a trained assessor (NKS=15, NTD=23). Throughout the entirety of the study at both sites, trained assessors read each item of self-report measures to the child, and the child verbally indicated their answer for each item to reduce reliance on the child’s reading abilities. All parent-report measures were completed by the parent independently on a computer or tablet.
The following measures were selected within each domain of interest:
Cognition: The WISC-V is a widely used measure of intellectual ability. This assessment yields five composite/index scores (Visual Spatial, Verbal Comprehension, Fluid Reasoning, Working Memory, and Processing Speed Indices) that represent specific cognitive domains and an overall IQ estimate (FSIQ). Index scores were used to capture a range of skills.
Behavioral ratings of executive function: The BRIEF-2 is a parent-report questionnaire that evaluates a child’s executive function. Ten scales measure the ability to control impulses, transition between situations, anticipate future events, and monitor impact of one’s behavior.11 Items from these scales yield three summary scores (Behavior Regulation Index, Emotion Regulation Index, and Cognitive Regulation Index), and summary scores were used.
Academic achievement: The KTEA-3 evaluates key reading, math, and written language skills that are important for academic functioning. Math Computation, Letter Word Identification, and Spelling subtests were used to capture a range of skills.
Adaptive behavior: The Vineland-3 Parent/Caregiver Form is a parent-report questionnaire that assesses the child’s behavior at home and in the community. It yields three domain scores for Socialization, Communication, and Daily Living Skills as well as an overall Adaptive Behavior Composite score. One parent completed the Vineland-3 online for each participant, and domain scores were used.
Quality of life: The PROMIS is a self-report questionnaire that measures physical, mental, and social health within eight domains. The Life Satisfaction, Physical Activity, Peer Relationships, and Family Relationships domains were used.
Pubertal Assessment
Pubertal development was assessed using testicular volume and total testosterone levels. Testicular volume was determined by endocrinologists using a Prader Orchidometer (Accurate Surgical and Scientific Instruments, New York). Serum testosterone levels were assessed using liquid chromatography and tandem mass spectrometry (LC/MS). Blood samples were collected in the early morning for all subjects (between 8:20 and 9:30 am).
Statistical Analyses
Analyses were completed in SPSS Version 27. One-way ANOVAs were used to evaluate between-group differences for age, performance IQ (WISC-V Visual Spatial Index), parental IQ (WASI-II FSIQ) and potential within-group differences in performance based on video versus in-person assessments. To test our a priori hypothesis that the KS group would show a distinct profile for cognition, executive function, adaptive behavior, academic achievement, and quality of life, separate MANOVAs were conducted for each domain. A significant omnibus F (Wilks’ Lambda) for the overall domain was followed by planned comparisons to examine between-group differences for each measure within the domain. Pearson correlations were conducted to explore within-group associations between significantly different cognitive domains (WISC-V Verbal Comprehension, Fluid Reasoning, and Working Memory Indices) and selected outcomes (behavioral ratings of executive function, adaptive behavior, academic achievement, and quality of life). Fisher r-to-z transformation was calculated to test between-group differences in the strength of correlations. Correlation methods were used to explore within-group associations between age-normed testicular volume,15 age-adjusted testosterone, and selected outcomes.
RESULTS
Participant Characteristics
Table 1 shows demographic information for the KS and TD groups. Supplementary Table S1 shows testicular volume z-score and Tanner pubic hair staging for each group, and supplementary Figure S1 shows testicular volume z-score by age within the KS and TD groups. There was no group difference for performance IQ (WISC-V Visual Spatial Index, KS = 101.39 ± 15.41, TD = 106.19 ± 11.47; p > 0.05). The groups differed in age (KS = 11.95 ± 2.13, TD = 11.00 ± 1.65; p = 0.01); therefore, age-corrected standardized scores were used instead of raw scores for all assessments in subsequent analyses. There was no group difference in parental IQ or annual household income (p’s > 0.05).
Table 1.
Demographic information for the KS and TD groups, reported as group means and standard deviations. For timing of KS diagnosis within the KS group, values are reported as the number (and percentage) of participants.
| KS N = 47 |
TD N = 55 |
|
|---|---|---|
|
| ||
| Age | 11.95 (2.13) | 11.00 (1.65) |
| WISC-V Visual Spatial Index (VSI) | 101.39 (15.41) | 106.19 (11.47) |
| Parental IQ (WASI-II FSIQ) | 113.95 (12.08) | 115.09 (9.73) |
| Timing of KS diagnosis | ||
| Prenatal | 24 (51.06%) | N/A |
| Postnatal | 21 (44.68%) | N/A |
| Information unavailable | 2 (4.26%) | N/A |
Comparisons of age-normed testicular volume using an Independent-Samples Mann-Whitney U Test indicated significantly lower testes size in the KS group relative to the TD group (Mann-Whitney U = 1765.0, p < 0.001). Because of the positive skew to testosterone, a log transformation was performed on these values prior to statistical analysis. No differences were observed between groups for total testosterone when controlling for age (t (2,86) = 0.204, p = 0.839).
Cognition
The groups showed significantly different cognitive profiles (F (5,89) = 9.61, p < 0.001). The KS group demonstrated poorer performance, on average, than the TD group for WISC-V Fluid Reasoning (F (1,93) = 11.06, p = 0.001), Working Memory (F (1, 93) = 20.66, p < 0.001), and Verbal Comprehension (F (1, 93) = 37.08, p < 0.001). There were no significant between-group differences for WISC-V Visual Spatial (F (1, 93) = 2.78, p = 0.099) or Processing Speed (F (1, 93) = 0.31, p = 0.579). See Figure 1 for box plots for each index and Table 2 for group means and standard deviations for each subtest across all domains. Behavioral Ratings of Executive Function
Figure 1.
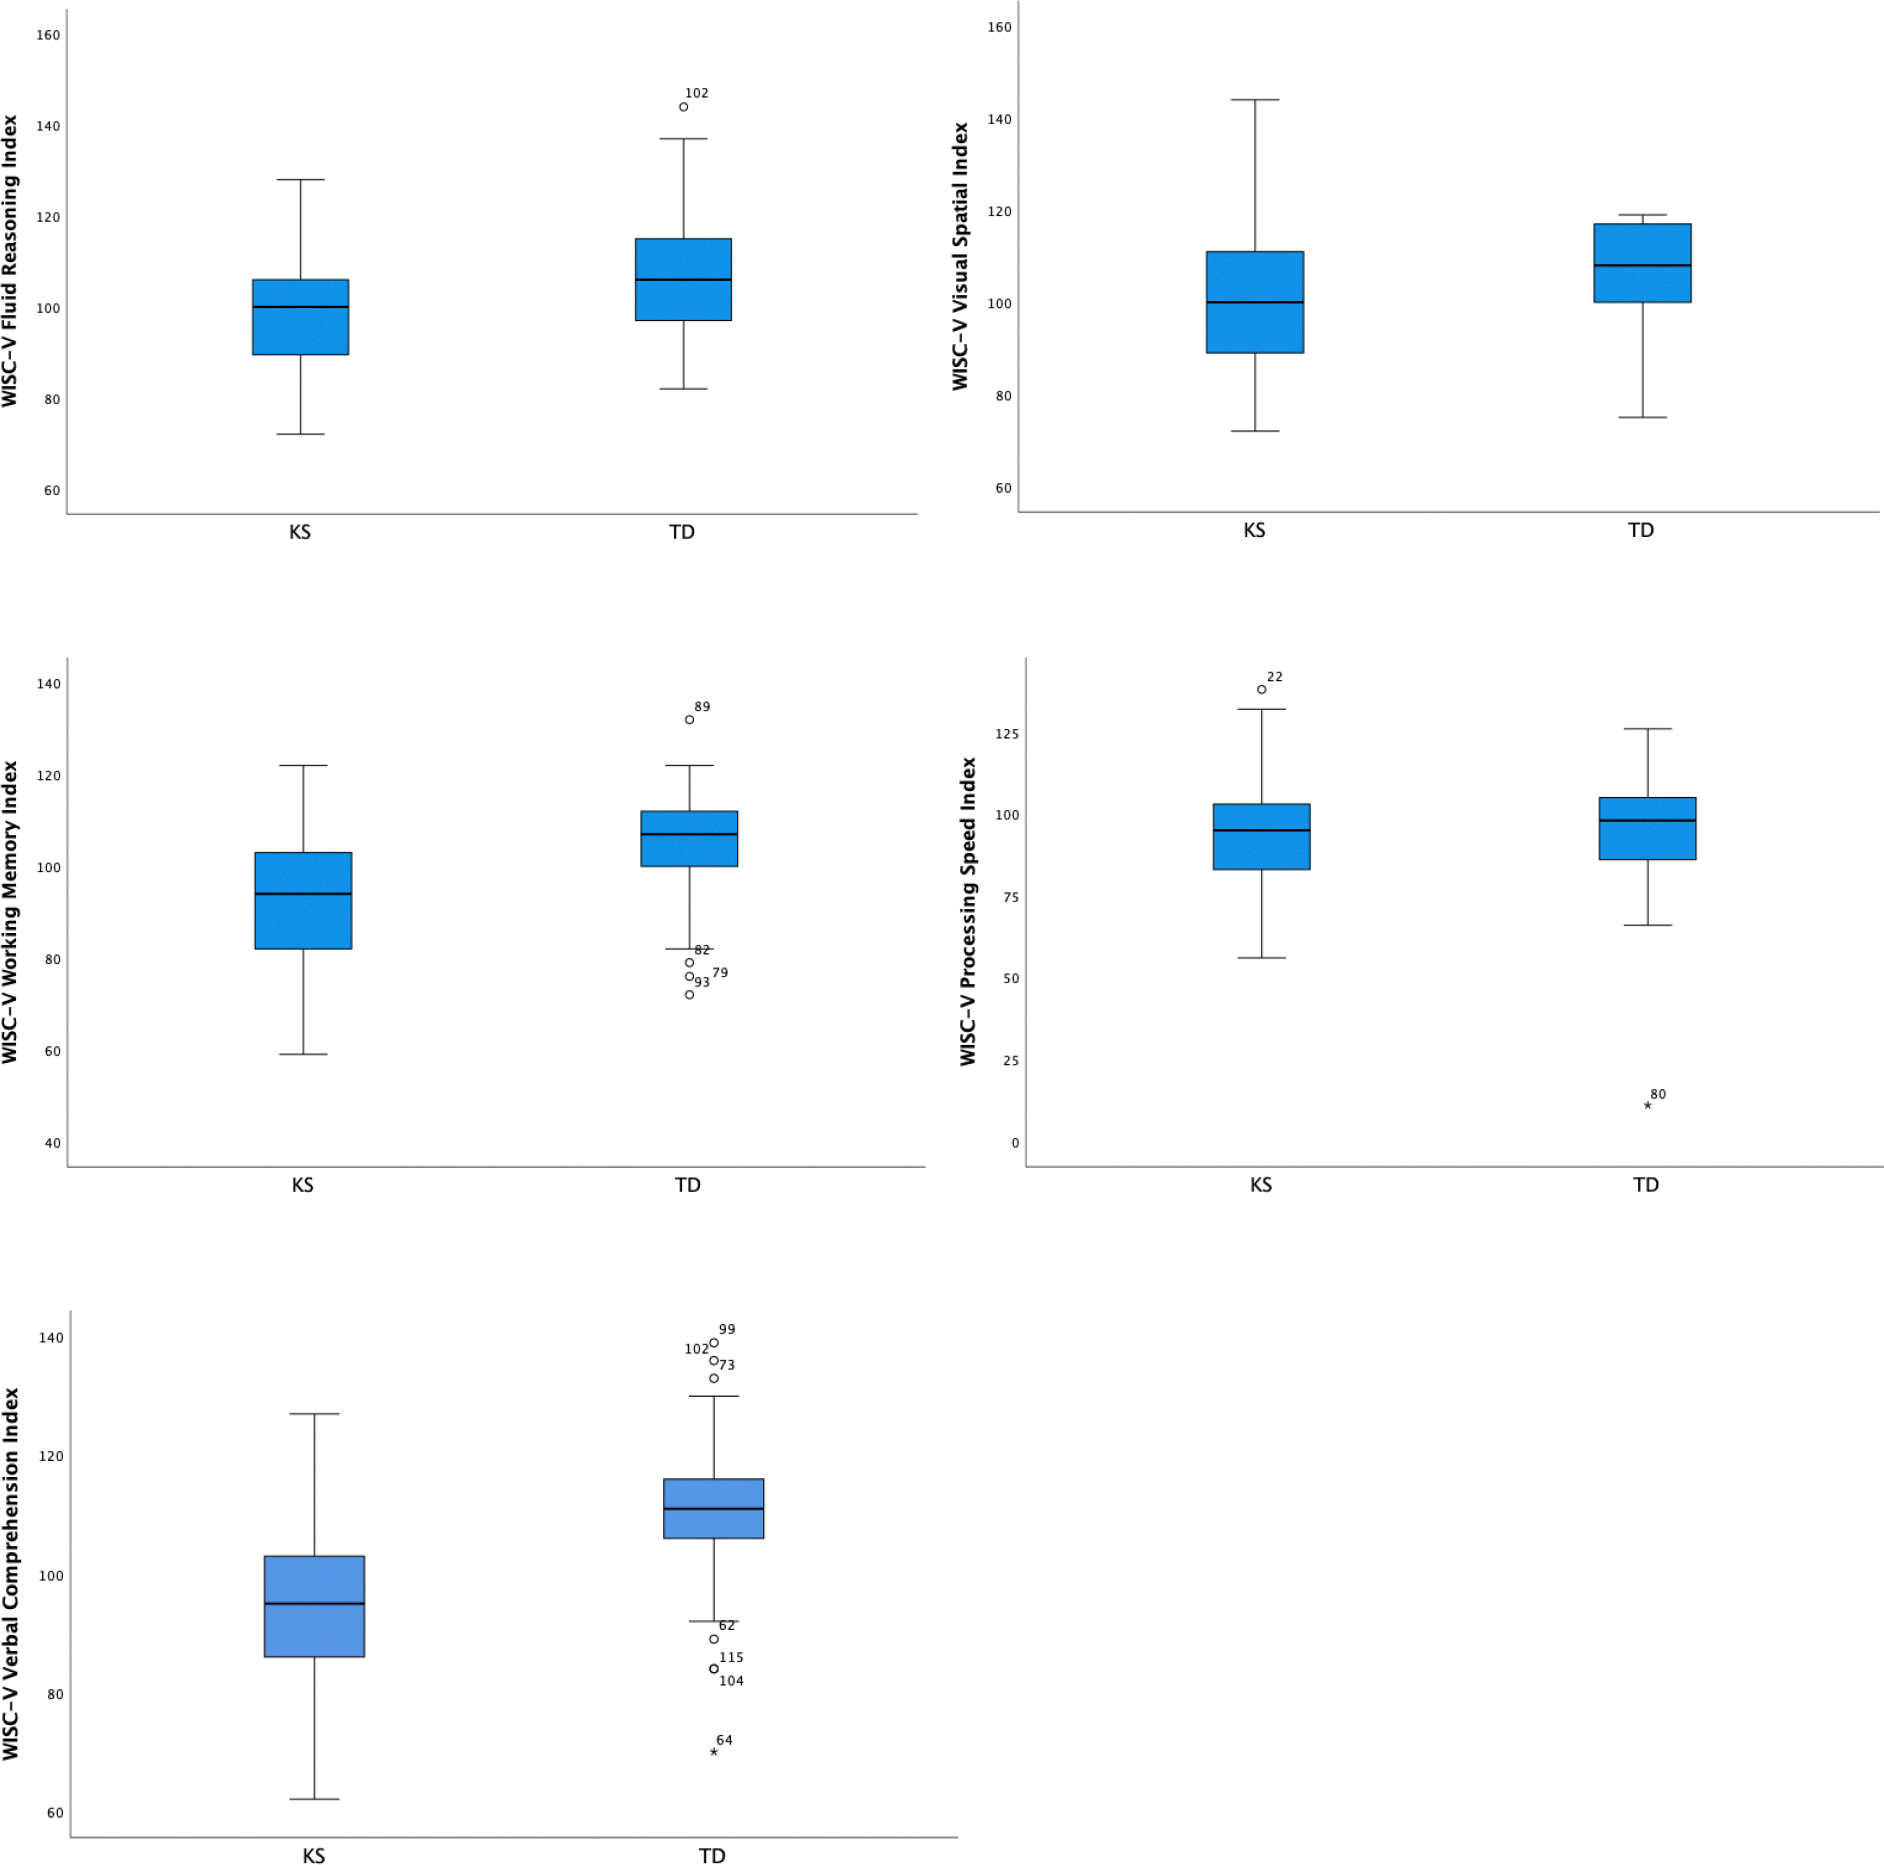
Box plots for WISC-V index scores (reported as standard scores with a mean of 100 and standard deviation of 15 in the normative sample) by group.
Table 2.
Group means and standard deviations for each subtest or subdomain for the KS group and TD group.
| KS mean (SD) |
TD mean (SD) |
|
|---|---|---|
|
| ||
| Cognition (WISC-V) | N = 47 | N = 55 |
|
| ||
| Visual Spatial Index | 101.39 (15.41) | 106.19 (11.47) |
| Fluid Reasoning Index | 97.55 (14.45) | 107.63 (13.64) |
| Working Memory Index | 92.94 (15.11) | 104.31 (12.11) |
| Processing Speed Index | 93.60 (16.73) | 94.00 (18.06) |
| Verbal Comprehension Index | 94.00 (12.53) | 110.13 (12.99) |
| Full Scale IQ (FSIQ) | 94.74 (13.35) | 107.67 (13.35) |
|
| ||
| Executive Function (BRIEF-2) | N = 47 | N = 51 |
|
| ||
| Emotion Regulation | 63.21 (13.25) | 49.41 (9.32) |
| Behavior Regulation | 58.02 (11.26) | 47.90 (9.99) |
| Cognitive Regulation | 64.19 (9.55) | 50.67 (10.92) |
| Global Executive Composite | 64.91 (10.79) | 50.18 (10.48) |
|
| ||
| Academic Achievement (KTEA-3) | N = 45 | N = 54 |
|
| ||
| Letter Word Identification | 94.04 (15.02) | 104.74 (10.93) |
| Math Computation | 92.62 (13.75) | 105.09 (16.50) |
| Spelling | 88.53 (14.88) | 101.07 (14.36) |
| Brief Achievement Composite | 93.39 (17.48) | 109.03 (12.87) |
|
| ||
| Adaptive Behavior (Vineland-3) | N = 50 | N = 53 |
|
| ||
| Communication | 86.82 (11.28) | 102.94 (8.74) |
| Socialization | 85.24 (11.95) | 100.38 (9.81) |
| Daily Living Skills | 89.00 (10.97) | 100.26 (11.11) |
| Adaptive Behavior Composite | 85.00 (10.19) | 100.79 (9.97) |
|
| ||
| Quality of Life (PROMIS) | N = 52 | N = 55 |
|
| ||
| Life Satisfaction | 47.21 (7.70) | 48.60 (7.74) |
| Physical Activity | 47.67 (9.98) | 51.00 (8.96) |
| Peer Relationships | 45.15 (10.21) | 50.15 (8.26) |
| Family Relationships | 51.28 (10.57) | 52.24 (8.90) |
| Global Health | 48.20 (9.04) | 49.56 (8.23) |
The groups were significantly different for overall executive function (F (3,94) = 18.00, p < 0.001). On average, parents of children in the KS group rated their children as having greater impairment for BRIEF-2 Behavioral Regulation (F (1,96) = 22.22, p < 0.001), Emotion Regulation (F (1,96) = 36.01, p < 0.001), and Cognitive Regulation (F (1,96) = 42.30, p < 0.001) relative to parents of children in the TD group.
Academic Achievement
The groups demonstrated significantly different profiles of academic achievement (F (3,95) = 7.90, p < 0.001). The KS group showed significantly poorer performance, on average, than the TD group for KTEA-3 Math Computation (F (1, 97) = 16.28, p < 0.001), Letter Word Identification (F (1, 97) = 16.75, p < 0.001), and Spelling (F (1,97) = 18.12, p < 0.001).
Adaptive Behavior
The groups were significantly different for overall adaptive behavior (F (3,99) = 23.69, p < 0.001). On average, parents of children in the KS group rated their children lower on Vineland-3 Socialization (F (1,101) = 49.59, p < 0.001), Daily Living Skills (F (1,101) = 26.77, p < 0.001), and Communication (F (1,101) = 66.19, p < 0.001) relative to the TD group.
Quality of Life
The groups were significantly different for overall quality of life (F (4,102) = 2.69, p = 0.035). On average, parents of children in the KS group rated their children as lower for PROMIS Peer Relationships (F (1,105) = 7.80, p = 0.006) compared to parents of children in the TD group. There were no significant between-group differences for PROMIS Life Satisfaction, Physical Activity, or Family Relationships (p’s > 0.05).
Associations between Cognition and Selected Outcomes
Within both groups, WISC-V Verbal Comprehension (VCI) was significantly correlated with KTEA-3 Letter-Word Identification, Math Computation, and Spelling (p’s < 0.05). See Table 3 for Pearson correlations and r-to-z transformation values. Within the KS group, VCI was also significantly correlated with BRIEF-2 Emotion Regulation and Behavior Regulation, Vineland-3 Socialization and Communication, KTEA-3 Letter Word Identification, Math Computation, and Spelling, and PROMIS Life Satisfaction (p’s < 0.05).
Table 3.
Pearson correlations (r) between WISC-V Verbal Comprehension Index, Fluid Reasoning Index, and Working Memory Index and outcomes. Fisher r-to-z-transformation value indicates significantly different correlation coefficients between groups (two-tailed).
| KS N = 47 |
TD N = 55 |
Fisher r-to-z Transformation |
|
|---|---|---|---|
|
| |||
| Correlations with Verbal Comprehension Index | Pearson r | Pearson r | p-value |
|
| |||
| BRIEF-2 Emotion Regulation Index | −0.30* | −0.01 | 0.16 |
| BRIEF-2 Behavior Regulation Index | −0.30* | 0.02 | 0.12 |
| Vineland-3 Socialization | 0.38** | 0.23 | 0.43 |
| Vineland-3 Communication | 0.50** | 0.21 | 0.11 |
| KTEA-3 Letter Word Identification | 0.54** | 0.63** | 0.52 |
| KTEA-3 Math Computation | 0.55** | 0.47** | 0.61 |
| KTEA-3 Spelling | 0.49** | 0.39** | 0.55 |
| PROMIS Life Satisfaction | 0.31* | 0.19 | 0.54 |
|
| |||
| Correlations with Fluid Reasoning Index | Pearson r | Pearson r | p-value |
|
| |||
| BRIEF-2 Emotion Regulation Index | −0.32* | −0.18 | 0.47 |
| BRIEF-2 Behavior Regulation Index | −0.36* | −0.11 | 0.20 |
| Vineland-3 Communication | 0.35* | 0.32* | 0.87 |
| KTEA-3 Letter Word Identification | 0.32* | 0.51** | 0.26 |
| KTEA-3 Math Computation | 0.45** | 0.67** | 0.11 |
| KTEA-3 Spelling | 0.34* | 0.32* | 0.91 |
| PROMIS Life Satisfaction | 0.47** | −0.09 | < 0.01** |
| PROMIS Physical Activity | 0.30* | 0.11 | 0.33 |
| PROMIS Peer Relationships | 0.41** | −0.13 | < 0.01** |
| PROMIS Family Relationships | 0.29** | −0.09 | 0.06 |
|
| |||
| Correlations with Working Memory Index | Pearson r | Pearson r | p-value |
|
| |||
| BRIEF-2 Emotion Regulation Index | −0.39** | −0.12 | 0.16 |
| BRIEF-2 Behavior Regulation Index | −0.34* | 0.01 | 0.08 |
| KTEA-3 Letter Word Identification | 0.43** | 0.36** | 0.68 |
| KTEA-3 Math Computation | 0.44** | 0.08 | 0.06 |
| KTEA-3 Spelling | 0.43** | 0.30* | 0.47 |
| PROMIS Life Satisfaction | 0.42** | −0.20 | < 0.01** |
| PROMIS Peer Relationships | 0.32* | −0.23 | < 0.01** |
indicates p < 0.05
indicates p < 0.01
WISC-V Fluid Reasoning (FRI) was significantly correlated with Vineland-3 Communication and KTEA-3 Letter Word Identification, Math Computation, and Spelling (p’s < 0.05) within both groups. FRI was significantly correlated with BRIEF-2 Emotion Regulation and Behavior Regulation as well as PROMIS Life Satisfaction, Physical Activity, Peer Relationships, and Family Relationships in only the KS group (p’s < 0.05).
Within both groups, WISC-V Working Memory (WMI) was significantly correlated with KTEA-3 Letter Word Identification and Spelling (p’s < 0.05). Within only the KS group, WMI was also significantly correlated with BRIEF-2 Emotion Regulation and Behavior Regulation and PROMIS Life Satisfaction and Peer Relationships (p’s < 0.05).
Fisher r-to-z transformation revealed significant group differences in the strength of correlations between WISC-V FRI and PROMIS Life Satisfaction, WISC-V FRI and PROMIS Peer Relationships, WISC-V WMI and PROMIS Life Satisfaction, WISC-V WMI and PROMIS Peer Relationships, and WISC-V WMI and PROMIS Physical Activity (p’s < 0.01, Table 3 and Figure 2).
Figure 2.
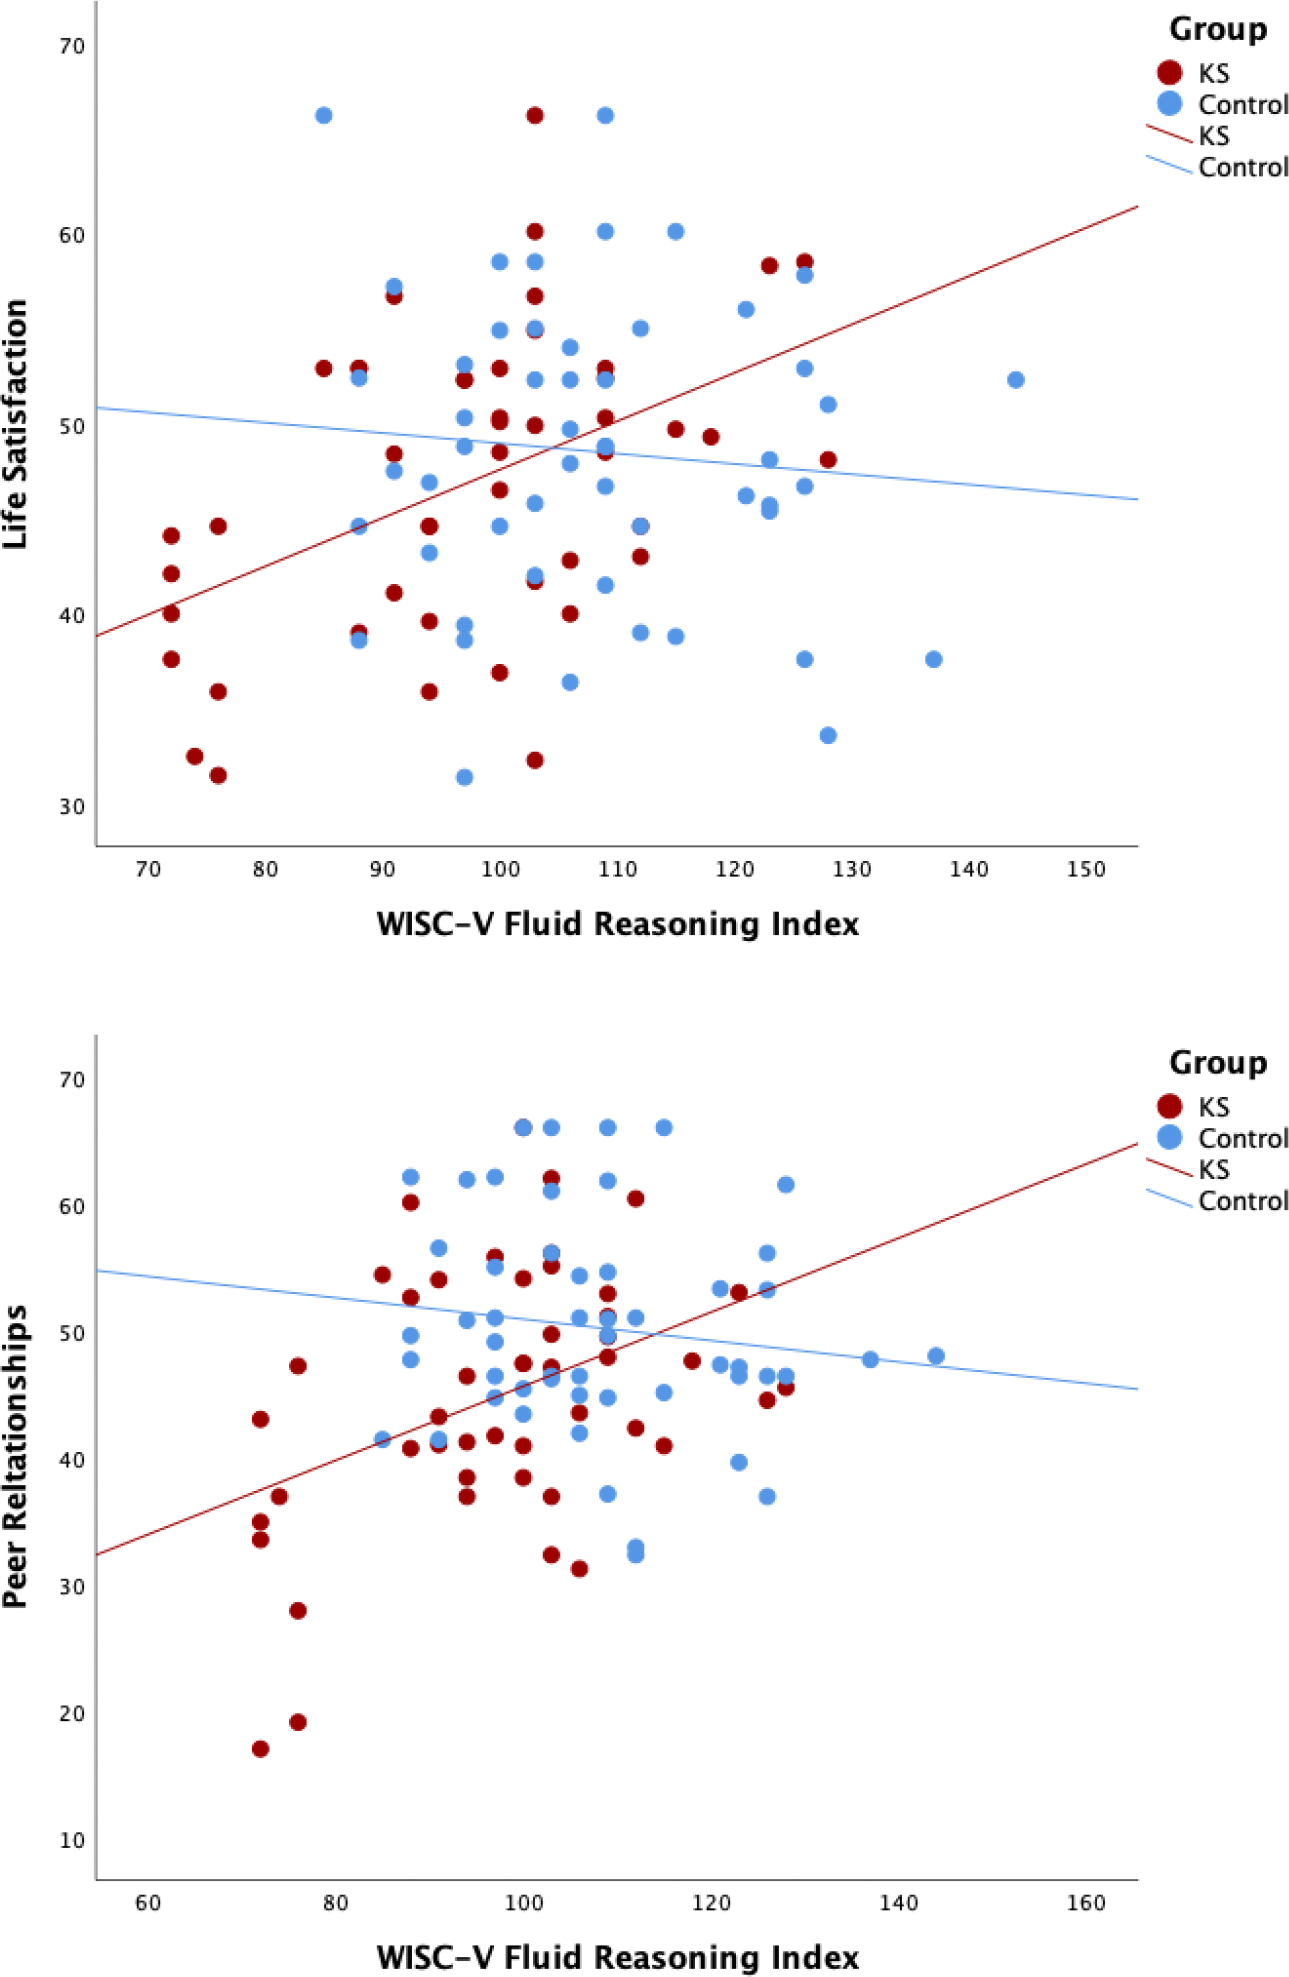
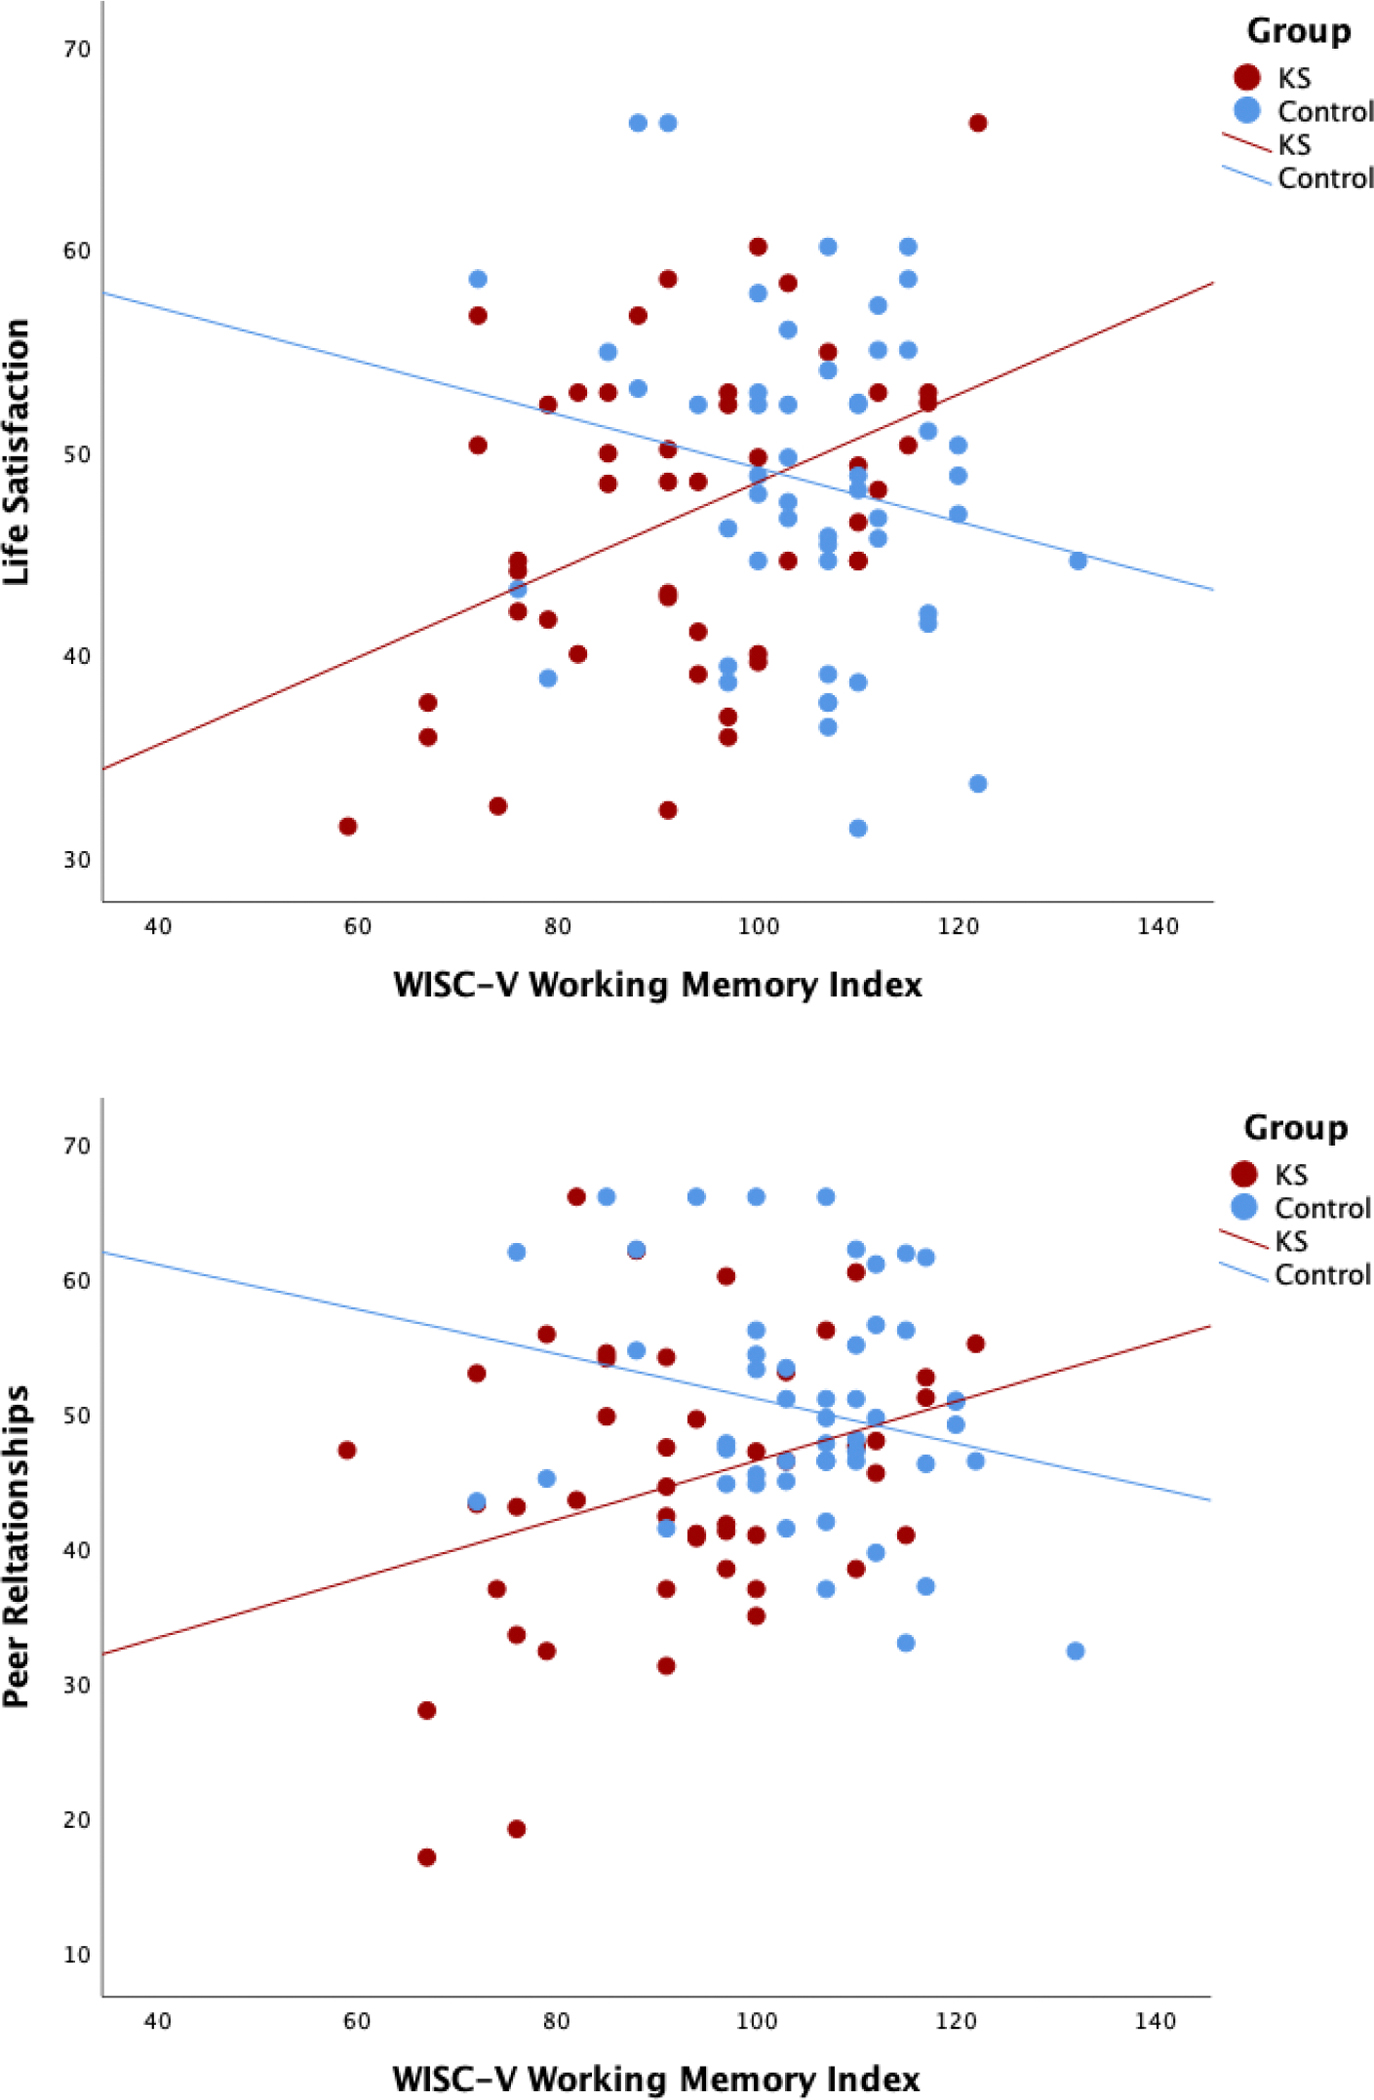
Pearson correlations between (a) WISC-V Fluid Reasoning Index and PROMIS Life Satisfaction as well as PROMIS Peer Relationships and (b) WISC-V Working Memory Index and PROMIS Life Satisfaction as well as PROMIS Peer Relationships.
Associations with Testicular Volume and Testosterone
There were no significant correlations between age-adjusted testicular volume or total testosterone and selected outcomes for either group (p’s > 0.05).
DISCUSSION
We examined cognition, academic achievement, adaptive behavior, and quality of life in a cross-sectional cohort of boys with and without KS. Our study substantially builds upon existing literature by including a performance IQ-matched TD group and integrating performance based, parent-report, self-report, and pubertal measures. Relative to the TD group, the KS group demonstrated a distinct profile for cognition, behavioral ratings of executive function, academic achievement, adaptive behavior, and quality of life. Across all domains, boys with KS exhibited poorer performance, on average, than the TD group. In addition, the KS group showed unique patterns of associations between cognition and quality of life, which has not been previously described in the literature.
The KS group scored in the average range (standard scores ranging from 85–115) across all cognitive domains including nonverbal reasoning, visual spatial skills, processing speed, working memory, and verbal comprehension. Compared to the TD group, the KS group showed a distinct cognitive profile. Consistent with previous studies documenting language and working memory weaknesses in KS,2,16 the KS group demonstrated poorer verbal skills and working memory relative to the TD group. Contrary to expectation, the KS group also demonstrated poorer nonverbal reasoning skills than the TD group. In addition to intact visual perception, tasks in this domain required inductive and quantitative reasoning, simultaneous processing, perception of part-whole relationships, and abstract reasoning.9 Although nonverbal skills are generally preserved among individuals with KS, the complexity of the selected tasks may require greater reliance on executive function, which is a known weakness in KS.17
Consistent with previous studies, the KS group demonstrated a significantly different profile of parent-reported behavioral ratings of executive function compared to the TD group. Unlike most performance-based measures, parent-report questionnaires allow an opportunity to examine how potential executive function deficits manifest in daily life. In this study, parents of children in the KS group rated their children, on average, as having significantly more challenges with all aspects of executive function including behavioral, cognitive, and emotional regulation. Deficits in behavioral regulation often manifest as difficulty inhibiting impulses and monitoring the impact of one’s behavior on others, whereas weaknesses in cognitive regulation refer to difficulty with initiating activities, planning multiple-step projects, and staying organized. These challenges may impact interpersonal relationships and academic achievement, respectively. Our results relate to previous findings that behavioral challenges, including emotion regulation and interpersonal difficulties, are among the greatest clinical concerns for parents of children with KS.18
The KS group performed in the average range (mean standard scores from 88.53 to 94.04) across age-normed measures of academic achievement. Relative to the TD group, the KS group showed a distinct profile of academic achievement with poorer math computation, sight word reading, and spelling. Results are consistent with previous studies documenting widespread academic challenges across subjects in KS by early to mid-adolescence,4 rather than deficits in only reading. Rovet and colleagues suggest that underlying auditory processing difficulties may affect the amount and accuracy of information processed by individuals with KS. Our findings, in conjunction with existing literature, highlight the importance of boys with KS receiving educational support in early childhood to address language-based and executive function deficits.
As expected, the KS group showed a distinct profile of adaptive behavior compared to the TD group. Consistent with previous studies describing social challenges19,20 and language-based deficits16,21 in KS children in the KS group were rated by their parents as having less developed socialization and communication skills compared to the TD group. Additionally, the KS group was rated as having poorer daily living skills than the TD group in the personal (e.g., hygiene and health care), domestic (e.g., household chores), and community (e.g., personal safety and managing money) realms. Findings emphasize the importance of providing boys with KS opportunities and interventions to further develop adaptive skills. This may include explicit instruction through speech/language therapy, occupational therapy, and social skills training as well as repeated supervised practice in daily life.
Parent ratings in the KS group were significantly different than the TD group for overall quality of life and peer relationships. Specifically, parents in the KS group rated their children as having poorer peer relationships than the TD group. Improving effectiveness of interactions with peers is a therapeutic target that is likely to be important for social adaptation in boys with KS.
In exploratory analyses, the groups showed distinct patterns of associations between cognition and selected outcomes. When evaluating between-group differences in the direction and strength of associations, the groups differed in the observed correlations between nonverbal reasoning and life satisfaction as well as nonverbal reasoning and peer relationships. Stronger nonverbal reasoning skills were linked to greater life satisfaction and improved peer relationships in the KS group, whereas stronger nonverbal reasoning skills were linked to poorer life satisfaction and peer relationships in the TD group. Similarly, the groups differed in the association between working memory and life satisfaction, physical activity, and peer relationships. Within the KS group, stronger working memory abilities were linked to improved life satisfaction, physical activity, and peer relationships, while no such pattern was observed in the TD group. Taken together, findings suggest that some aspects of cognition may be predictive of life satisfaction and peer relationships in KS to a greater extent than in TD boys. As such, nonverbal reasoning and working memory deficits may be good targets for improving quality of life in KS.
Lastly, neither testicular volume nor testosterone levels were significantly associated with selected outcomes in either group. Such markers of pubertal development are often impacted in KS, yet were not linked to cognition, behavioral ratings of executive function, academic achievement, adaptive behavior, or quality of life. Since testicular failure often becomes apparent in mid-puberty in KS, our cohort may have been too young to detect relevant hormonal deficiency effects. Future longitudinal studies that follow boys with KS through the pubertal transition and into early adulthood could clarify the potential impact of testicular failure on behavioral outcomes.
There are some limitations to this study, which may impact the generalizability of findings. First, although recent studies suggest results from telehealth (i.e., secure video) assessment are comparable to those from in-person assessments,22,23,24 the telehealth format may have influenced results. Within the KS group, there is inherent selection bias given that these participants were recruited through clinical referrals and advocacy groups. Despite KS being relatively common, many individuals with KS are unaware of their genetic condition; in fact, one epidemiologic study suggests that more than 75 percent of individuals with KS are not diagnosed25 and diagnosis is significantly delayed into adulthood for those who do receive the diagnosis.26 We cannot exclude the possibility of ascertainment bias in our cohort, as postnatal diagnoses of KS occurred in about half of our subjects and are generally performed for delayed pubertal development. Lastly, the directionality of the associations between cognition and selected outcomes cannot be determined based on this cross-sectional study.
CONCLUSIONS
We examined cognition, executive function, academic achievement, adaptive behavior, and quality of life in boys with KS. Relative to the performance IQ matched TD group, the KS group demonstrated a distinct profile for all domains. As expected, there was a trend that the KS group, on average, demonstrated poorer cognition, behavioral ratings of executive function, academic achievement, adaptive behavior, and quality of life than the TD group. The KS group showed a distinct pattern of associations between cognition and selected outcomes compared to the TD group. Interestingly, secondary exploratory analyses did not indicate an association between pubertal measures (testicular volume and testosterone levels) and selected outcomes. Future studies examining the influence of TRT on cognitive and behavioral outcomes in KS over time are of great interest to the medical community and families of affected individuals.
Supplementary Material
References
- 1.Herlihy AS, Halliday JL, Cock ML, McLachlan RI. The prevalence and diagnosis rates of Klinefelter syndrome: An Australian comparison. Medical Journal of Australia. 2011; 194(1): 24–28. doi: 10.5694/j.1326-5377.2011.tb04141.x [DOI] [PubMed] [Google Scholar]
- 2.Boada R, Janusz J, Hutaff-Lee C, Tartaglia N. The cognitive phenotype in Klinefelter syndrome: a review of the literature including genetic and hormonal factors. Developmental Disabilities Research Reviews. 2009; 15(4):284–94. doi: 10.1002/ddrr.83 [DOI] [PMC free article] [PubMed] [Google Scholar]
- 3.Graham JM, Bashir AS, Stark RE, Silbert A, Walzer S. Oral and written language abilities of XXY boys: implications for anticipatory guidance. Pediatrics. 1988; 81(6): 795–806. doi: 10.1542/peds.81.6.795 [DOI] [PubMed] [Google Scholar]
- 4.Rovet J, Netley C, Keenan M, Bailey J, Stewart D. The Psychoeducational Profile of Boys with Klinefelter Syndrome. Journal of Learning Disabilities. 1996; 29(2): 180–196. doi: 10.1177/002221949602900208 [DOI] [PubMed] [Google Scholar]
- 5.Nielsen J, Pelsen B. Follow-up 20 years later of 34 Klinefelter males with karyotype 47,XXY and 16 hypogonadal males with karyotype 46,XY. Human Genetics. 1987; 77:188–192. doi: 10.1007/BF00272390 [DOI] [PubMed] [Google Scholar]
- 6.Close S, Fennoy I, Smaldone A, Reame N. Phenotype and adverse quality of life in boys with Klinefelter syndrome. Journal of Pediatrics. 2015;167(3): 650–657. doi: 10.1016/j.jpeds.2015.06.037 [DOI] [PMC free article] [PubMed] [Google Scholar]
- 7.Radicioni A, Ferlin A, Balercia G, et al. Consensus statement on diagnosis and clinical management of Klinefelter syndrome. Journal of Endocrinological Investigation. 2010; 33(11): 839–850. doi: 10.1007/BF03350351 [DOI] [PubMed] [Google Scholar]
- 8.Wikström AM, Dunkel L. Testicular function in Klinefelter syndrome. Hormone Research in Paediatrics. 2008; 69(6):317–26. doi: 10.1159/000117387 [DOI] [PubMed] [Google Scholar]
- 9.Wechsler D Wechsler intelligence scale for children, fifth edition. Bloomington, MN: NCS Pearson; 2014. [Google Scholar]
- 10.Kaufman AS, Kaufman NL. Kaufman test of educational achievement, third edition. Bloomington, MN: NCS Pearson; 2014. [Google Scholar]
- 11.Gioia GA, Isquith PK, Guy SC, Kenworthy L. Behavior rating inventory of executive function, second edition (BRIEF-2). Lutz, FL: PAR Inc; 2015. [Google Scholar]
- 12.Sparrow SS, Cicchetti DV, Saulnier CA. Vineland adaptive behavior scales, third edition (Vineland-3). San Antonio, TX: Pearson; 2016. [Google Scholar]
- 13.Reeve BB, Hays RD, Bjorner JB, et al. Psychometric evaluation and calibration of health-related quality of life item banks: plans for the Patient-Reported Outcomes Measurement Information System (PROMIS). Medical Care. 2017; 45(5): S22–S31. doi: 10.1097/01.mlr/0000250483.85507.04 [DOI] [PubMed] [Google Scholar]
- 14.Wechsler D Wechsler Abbreviated Scale of Intelligence–Second Edition (WASI-II). San Antonio, TX: NCS Pearson; 2011. [Google Scholar]
- 15.Hall JG, Froster-Iskenius UG, Allanson JE. Handbook of normal physical measurements. Oxford: Oxford University Press; 1995. [Google Scholar]
- 16.Ross JL, Roeltgen DP, Stefanatos G, et al. Cognitive and motor development during childhood in boys with Klinefelter syndrome. American Journal of Medical Genetics Part A. 2008;146A(6): 708–719. doi: 10.1002/ajmg.a.32232 [DOI] [PubMed] [Google Scholar]
- 17.Janusz J, Harrison C, Boada C, et al. Executive function in XXY: Comparison of performance-based measures and rating scales. American Journal of Medical Genetics Part C: Seminars in Medical Genetics. 2020; 184(2): 469–481. doi: 10.1002/ajmg.c.31804 [DOI] [PMC free article] [PubMed] [Google Scholar]
- 18.Bourke E, Snow P, Herlihy A, Amor D, Metcalfe S. A qualitative exploration of mothers’ and fathers’ experiences of having a child with Klinefelter syndrome and the process of reaching this diagnosis. European Journal of Human Genetics. 2014;22(1): 18–24. doi: 10.1038/ejhg.2013.102 [DOI] [PMC free article] [PubMed] [Google Scholar]
- 19.van Rijn S, Swaab H, Aleman A, Kahn RS. Social Behavior and Autism Traits in a Sex Chromosomal Disorder: Klinefelter (47XXY) Syndrome. Journal of Autism and Developmental Disorders. 2008; 38(9): 1634–1641. doi: 10.1007/s10803-008-0542-1 [DOI] [PubMed] [Google Scholar]
- 20.van Rijn S, Stockmann L, van Buggenhout G, van Ravenswaaij-Arts C, Swaab H. Social cognition and underlying cognitive mechanisms in children with an extra X chromosome: A comparison with autism spectrum disorder: Social cognition and an extra X chromosome. Genes, Brain and Behavior. 2014; 13(5): 459–467. doi: 10.1111/gbb.12134 [DOI] [PubMed] [Google Scholar]
- 21.Samango-Sprouse CA, Stapleton EJ, Mitchell FL, Sadeghin T, Donahue TP, Gropman, AL. Expanding the phenotypic profile of boys with 47, XXY: The impact of familial learning disabilities. American Journal of Medical Genetics Part A. 2014; 164(6): 1464–1469. doi: 10.1002/ajmg.a.36483 [DOI] [PubMed] [Google Scholar]
- 22.Carotenuto A, Traini E, Fasanaro AM, Battineni G, Amenta F. Tele-neuropsychological assessment of Alzheimer’s disease. Journal of Personalized Medicine. 2021;11(8):688. doi: 10.3390/jpm11080688 [DOI] [PMC free article] [PubMed] [Google Scholar]
- 23.Hewitt KC, Loring DW. Emory university telehealth neuropsychology development and implementation in response to the COVID-19 pandemic. The Clinical Neuropsychologist. 2020; 34(7–8): 1352–1366. doi: 10.1080/13854046.2020.1791960 [DOI] [PubMed] [Google Scholar]
- 24.Pritchard AE, Sweeney K, Salorio CF, Jacobson LA. Pediatric neuropsychological evaluation via telehealth: Novel models of care. The Clinical Neuropsychologist. 2020; 34(7–8): 1367–1379. doi: 10.1080/13854046.2020.1806359 [DOI] [PMC free article] [PubMed] [Google Scholar]
- 25.Bojesen A, Juul S, Gravholt CH. Prenatal and postnatal prevalence of Klinefelter syndrome: a national registry study. Journal of Clinical Endocrinology and Metabolism. 2003; 88(2): 622–626. doi: 10.1210/jc.2002-021491 [DOI] [PubMed] [Google Scholar]
- 26.Geschwind DH, Dykens E. Neurobehavioral and psychosocial issues in Klinefelter syndrome. Learning Disabilities Research and Practice. 2004;19(3): 166–173. doi: 10.1111/j.1540-5826.2004.00100.x [DOI] [Google Scholar]
Associated Data
This section collects any data citations, data availability statements, or supplementary materials included in this article.