

Abstract
Background and aims:
Metabolic dysfunction-associated steatotic liver disease (MASLD) ranges from Metabolic dysfunction-associated steatotic liver (MASL) to Metabolic dysfunction-associated steatohepatitis (MASH) with fibrosis. Activation of Hepatic Stellate Cells (HSCs) into fibrogenic myofibroblasts plays a critical role in the pathogenesis of MASH liver fibrosis. We compared transcriptome and chromatin accessibility of human HSCs from NORMAL, MASL, and MASH livers at single cell resolution. We aimed to identify genes that are upregulated in activated HSCs and to determine which of these genes are key in the pathogenesis of MASH fibrosis.
Methods:
18 human livers were profiled using single-nucleus (sn)RNA-seq and snATAC-seq. High priority targets were identified, then tested in 2D human HSC cultures, 3D human liver spheroids, and HSC-specific gene knockout mice.
Results:
MASH-enriched activated (A) HSC subclusters are the major source of extracellular matrix proteins. We identified a set of concurrently upregulated and more accessible core genes (GAS7, SPON1, SERPINE1, LTBP2, KLF9, EFEMP1) that drive activation of (A) HSC subclusters. Expression of these genes was regulated via crosstalk between lineage-specific (JUNB/AP1), cluster-specific (RUNX1/2) and signal-specific (FOXA1/2) transcription factors. The pathological relevance of the selected targets, such as SERPINE1 (PAI-1), was demonstrated using dsiRNA-based HSC-specific gene knockdown or pharmacological inhibition of PAI-1 in 3D human MASH liver spheroids, and HSC-specific Serpine1 knockout mice.
Conclusion:
This study identified novel gene targets and regulatory mechanisms underlying activation of MASH fibrogenic HSCs, and demonstrated that genetic or pharmacological inhibition of select genes suppressed liver fibrosis.
Keywords: MASH, liver fibrosis, activation of human HSCs, snRNA-seq and snATAC-seq
Introduction
Metabolic dysfunction-associated steatotic liver disease is a spectrum of liver disease ranging from steatosis (Metabolic dysfunction-associated steatotic liver, MASL) to Metabolic dysfunction-associated steatohepatitis (MASH) with fibrosis[1]. MASH is driven by chronic toxic injury of hepatocytes, upregulation of inflammatory and fibrogenic cytokines (IL-6, TNFα, IL-1β, TGFβ1), and activation of Hepatic Stellate Cells (aHSCs)/myofibroblasts that produce the extracellular matrix (ECM)[1, 2].
HSCs possess unique plasticity[2]. In the healthy liver, quiescent HSCs (qHSCs) reside in the space of Disse, store Vitamin A, and express neural and lipogenic (Lrat, Ngfr, and Pparg) markers[3]. In response to toxic liver injury, qHSCs activate into Col1a1, Acta2, Timp1, Loxl1-expressing aHSCs/myofibroblasts[2], and produce fibrous scar. Upon regression of liver fibrosis, aHSCs can inactivate (iHSCs), downregulate expression of fibrogenic genes and re-express some (Pparg, Apoe, and Bambi) but not all (Gfap or Adipor1) quiescence-associated genes[3]. In addition, an inflammatory HSC phenotype (INF) has been described in MASH mice[3].
HSC phenotypes are regulated by changes in their epigenome[2], including chromatin modifications that alter accessibility at promoters and enhancers of regulatory transcription factors (TFs) leading to transcriptional activation or repression of their target genes[4]. Single-nucleus-based chromatin accessibility techniques, including snATAC-seq (Single Nucleus Assay for Transposase-Accessible Chromatin using sequencing), and single nucleus (sn)RNA-seq allow the identification of cellular states, gene regulatory networks, and enhancer/promoter dynamics in the liver at single cell resolution.
There are no antifibrotic therapies for liver diseases. Our study aimed to identify genes and their regulatory mechanisms in human activated HSCs which play a key role in the pathogenesis of MASH fibrosis. The gene expression profiles and chromatin accessibility landscapes of human HSCs from NORMAL (n=5), MASL (n=4), and MASH (n=9) livers were compared. We characterized a fibrogenic population of human MASH-activated HSCs (designated “A” HSCs) that serve as the major source of ECM gene expression in MASH livers. We determined the pathways of HSC activation and transcriptional regulation and developed a rational strategy for gene targeting. Using dicer substrate interfering (dsi)RNAs-based gene knockdown[5], the role of selected genes in HSC activation was evaluated using human 2D HSC cultures, 3D human liver spheroids[6], and HSC-specific knockout mice. Our study suggests that selective targeting of SPON1 and SERPINE1 (PAI-1) in aHSCs may suppress the development of MASH fibrosis.
Results
Human NORMAL, MASL, and MASH livers.
De-identified human donor livers were characterized by a liver pathologist: The MASH/Clinical Research Network (CRN) score criteria <3 diagnosed NORMAL livers. Livers with steatosis were identified as MASL, while livers with scores ≥ 5 (with steatosis, inflammation, and fibrosis) were diagnosed as MASH (FigureS1A)[7, 8]. Liver diagnoses of NORMAL (n=5), MASL (n=4), MASH (n=9, fibrosis stage 2–4) were defined by a combination of patient history and liver histology (FigureS1A–B). To study the pathogenesis of MASH liver fibrosis, we isolated nuclei from snap-frozen livers, and performed snATAC-seq and snRNA-seq (Figure1A).
Figure 1. Characterization of human NORMAL, MASL, and MASH HSCs across platforms.

(A) Sample size, data types, number of cells across platforms per condition. (B) Heatmap: relative marker gene expression averaged by cell type in snRNA-seq. (C) Regions of open chromatin in cell type marker genes in snATAC-seq. (D-E) snRNA-seq: (D) UMAP plot showing identified cell types, (E) composition plot and table showing distribution of cells per condition. (F-G) snATAC-seq: (F) UMAP plot showing identified cell types, (G) composition plot and table showing distribution of cells per condition. (H) Principal component analysis of HSCs per condition. (I-K) snRNA-seq: (I) Relative expression (averaged by condition for nominally significant genes, p<0.05) which distinguish NORMAL, MASL, and MASH HSCs. (J) Heatmap: correlation between differential gene expression in HSCs across conditions. NORMAL and MASL tend to upregulate the same genes, Pearson R=0.51. NORMAL and MASL HSCs negatively correlated with genes induced in MASH HSCs. (K) Pathways which most distinguish gene expression of NORMAL, MASL, and MASH HSCs. (L-N) snATAC-seq: (L) Relative accessibility (averaged by condition for nominally significant peaks, p<0.05) distinguish NORMAL, MASL, and MASH HSCs. (M) Heatmap: correlation between differential accessibility peaks in HSCs across conditions. NORMAL and MASL upregulate similar genes, R=0.63. NORMAL and MASL negatively correlated with MASH. (N) Selected pathways which most distinguish chromatin accessibility in NORMAL, MASL, and MASH. (K, N) Size of the circle represents significance of the enrichment, with larger circles indicating a smaller p-value.
Defining human liver cell populations.
NORMAL, MASL, and MASH liver datasets were integrated and clustered (FigureS2). Liver cell types in snRNA-seq and snATAC-seq[9] were annotated using markers from the Panglao database[10] alongside the following known marker genes: HNF4A+ hepatocytes, NGFR+ HSCs, Myh11+ mesothelial cells, PECAM1+ endothelial cells, CD69+ T cells, CD19+ B cells, CD163+ myeloid cells, and KRT19+ cholangiocytes (Figure1B–C, FigureS3). In MASH livers, NGFR+ HSCs co-expressed COL1A2 and TIMP1 (FigureS4A). HSCs contributed to NORMAL and MASL livers (4–5% and 5–8% of total liver cells, respectively) but expanded in MASH livers to 13–20% (Figure1D–G). Principal component analysis of average gene expression by sample revealed that MASH HSCs were distinct from NORMAL and MASL HSCs (Figure1H), suggesting that MASH HSCs were the most transcriptionally distinct, while NORMAL and MASL had similar patterns of gene expression.
snRNA-seq and snATAC-seq analysis identified differences between bulk MASH vs NORMAL and MASL HSCs.
Correlating the fold changes of the HSC genes differentially expressed in each condition demonstrated that MASH HSCs significantly differ from NORMAL and MASL HSCs (Figure1I–J, TableS3). MASH HSCs downregulated quiescence-associated genes (LRAT, SYNM, SYP, FigureS4B)[3] and upregulated fibrogenic genes (COL1A2, LOX, TIMP1, FigureS4A)[3]. Pathway analysis revealed that MASH HSCs were highly enriched in ECM pathways, whereas NORMAL HSCs were linked to responses to Vitamin A and neuron-associated development (Figure1K, FigureS4C, TableS4). Similarly, MASH and NORMAL HSCs exhibited distinct patterns of chromatin accessibility (Figure1L–M, TableS5). Although MASL and NORMAL HSCs gene expression patterns mainly overlapped (Figure1J,M, Pearson R=0.51 and R=0.63 for snRNA-seq and snATAC-seq respectively), MASL HSCs acquired some unique features such as regulation of protein and lamellipodium organization pathways, which drive HSC motility[Suppl. Reference1](Figure1N, FigureS4D, TableS6), suggesting that hepatic steatosis alone can affect the HSC phenotype (TableS4, 6).
Epigenomic and transcriptional alterations per condition correlated in NORMAL, MASL, or MASH HSCs.
Changes in open chromatin and corresponding gene expression were significantly and largely conserved between snRNA-seq and snATAC-seq (FigureS4E). Gene expression and chromatin accessibility at gene bodies, promoter, and enhancer regions were concurrently increased in HSCs (69% of NORMAL, 63% of MASL, and 68% of MASH, FigureS4E). Moreover, the genes identified by the two modalities strongly co-localized in NORMAL, MASL, and MASH HSC molecular interaction networks (p=1E-12, p=9E-3, and p=7E-16, respectively, FigureS4F). The degree of network co-localization (black bars) was significantly higher than expected if the two gene sets were not related (gray bars, FigureS4F), confirming that gene accessibility directly correlates with gene transcription in HSCs.
Molecular interaction networks identified condition-specific HSC “signature genes”.
To gain further insight into co-regulated gene functions, the molecular interaction networks of NORMAL, MASL, and MASH HSCs were constructed from genes which were either transcriptionally upregulated (log FC>0.25, p<0.05) and/or associated with chromatin accessibility in gene body, promoter or enhancer regions (log FC>0.1, p<0.05) per condition, and with known interactions between those genes from the STRING database[11] (Figure2A–C). In each condition, genes which were concurrently upregulated and epigenetically accessible were identified as HSC “signature genes”.
Figure 2. Integration of sequencing modalities through molecular interaction networks.

(A-C) Molecular interaction networks in (A) NORMAL (B) MASL, and (C) MASH HSCs (p<0.05). Genes identified by both platforms are shown in large half-circles. (D) ECM organization subnetwork of genes accessible/upregulated in MASH HSCs. (E) Heatmap: relative expression of selected genes specific for NORMAL, MASL, and MASH HSCs.
The NORMAL HSC network was comprised of 36 “signature genes” and included quiescence-associated genes (LRAT, MBOAT2, SYT1, COLEC10, CAV2, ERCC1, Figure2A)[3]. 10 “signature genes” were uniquely induced in the MASL HSC network, including quiescence-associated genes (VIPR1, LRAT, NFKBIA, Figure2B)[3]. While significant, MASL HSCs had a smaller overlap than MASH or NORMAL between genes that were concurrently upregulated and epigenetically accessible, suggesting that epigenetic changes might precede gene transcription. “Signature genes” of MASH HSC network induced 71 genes, which showed limited overlap with NORMAL or MASL networks. The MASH network was particularly strongly enriched for genes associated with fibrogenic responses and ECM organization (p=1E-16; containing SERPINE1, THBS2, EFEMP1, FBLN5, LAMC3, LAMA2, PRELP, COL4A1, COL1A2, Figure2C–E). Our data indicate that phenotypes of human HSCs vary significantly dependent on the severity of metabolic liver injury (TableS7).
HSC phenotypes vary per condition.
To study the composition of NORMAL, MASL, and MASH HSCs (Figure3A–D), we subclustered HSCs using a previously identified set of “marker genes” identified in mice ± MASH[3] (Figure3E, FigureS5). Based on the marker gene overlap, human HSC subclusters significantly recapitulated mouse HSC subclusters. Human qHSCs (Q), aHSCs (A), and inflammatory (INF) HSC clusters were detected in each condition using both sequencing modalities, with the only difference that snRNA-seq identified two activated (A1, A2) HSC subclusters (Figure3A–D, TableS8, 9). Specifically, NORMAL and MASL HSCs consisted predominantly of LRAT+SYNM+NGFR+ qHSCs, and a few aHSCs. In contrast, MASH HSCs contained a very small number of qHSCs, but were highly enriched in COL1A2+LOX+SPP1+TIMP1+ aHSCs, especially the A2 subcluster (Figure3A–D, FigureS4A–B, FigureS6A–D). INF cluster represented a small, 4.9 % fraction of CD36+CLEC+CREM+ HSCs[3] and was found in all conditions, indicating that Q, A, and INF clusters of HSCs are present in every human liver (FigureS6E–F).
Figure 3. Subclusters of NORMAL, MASL, and MASH HSCs.
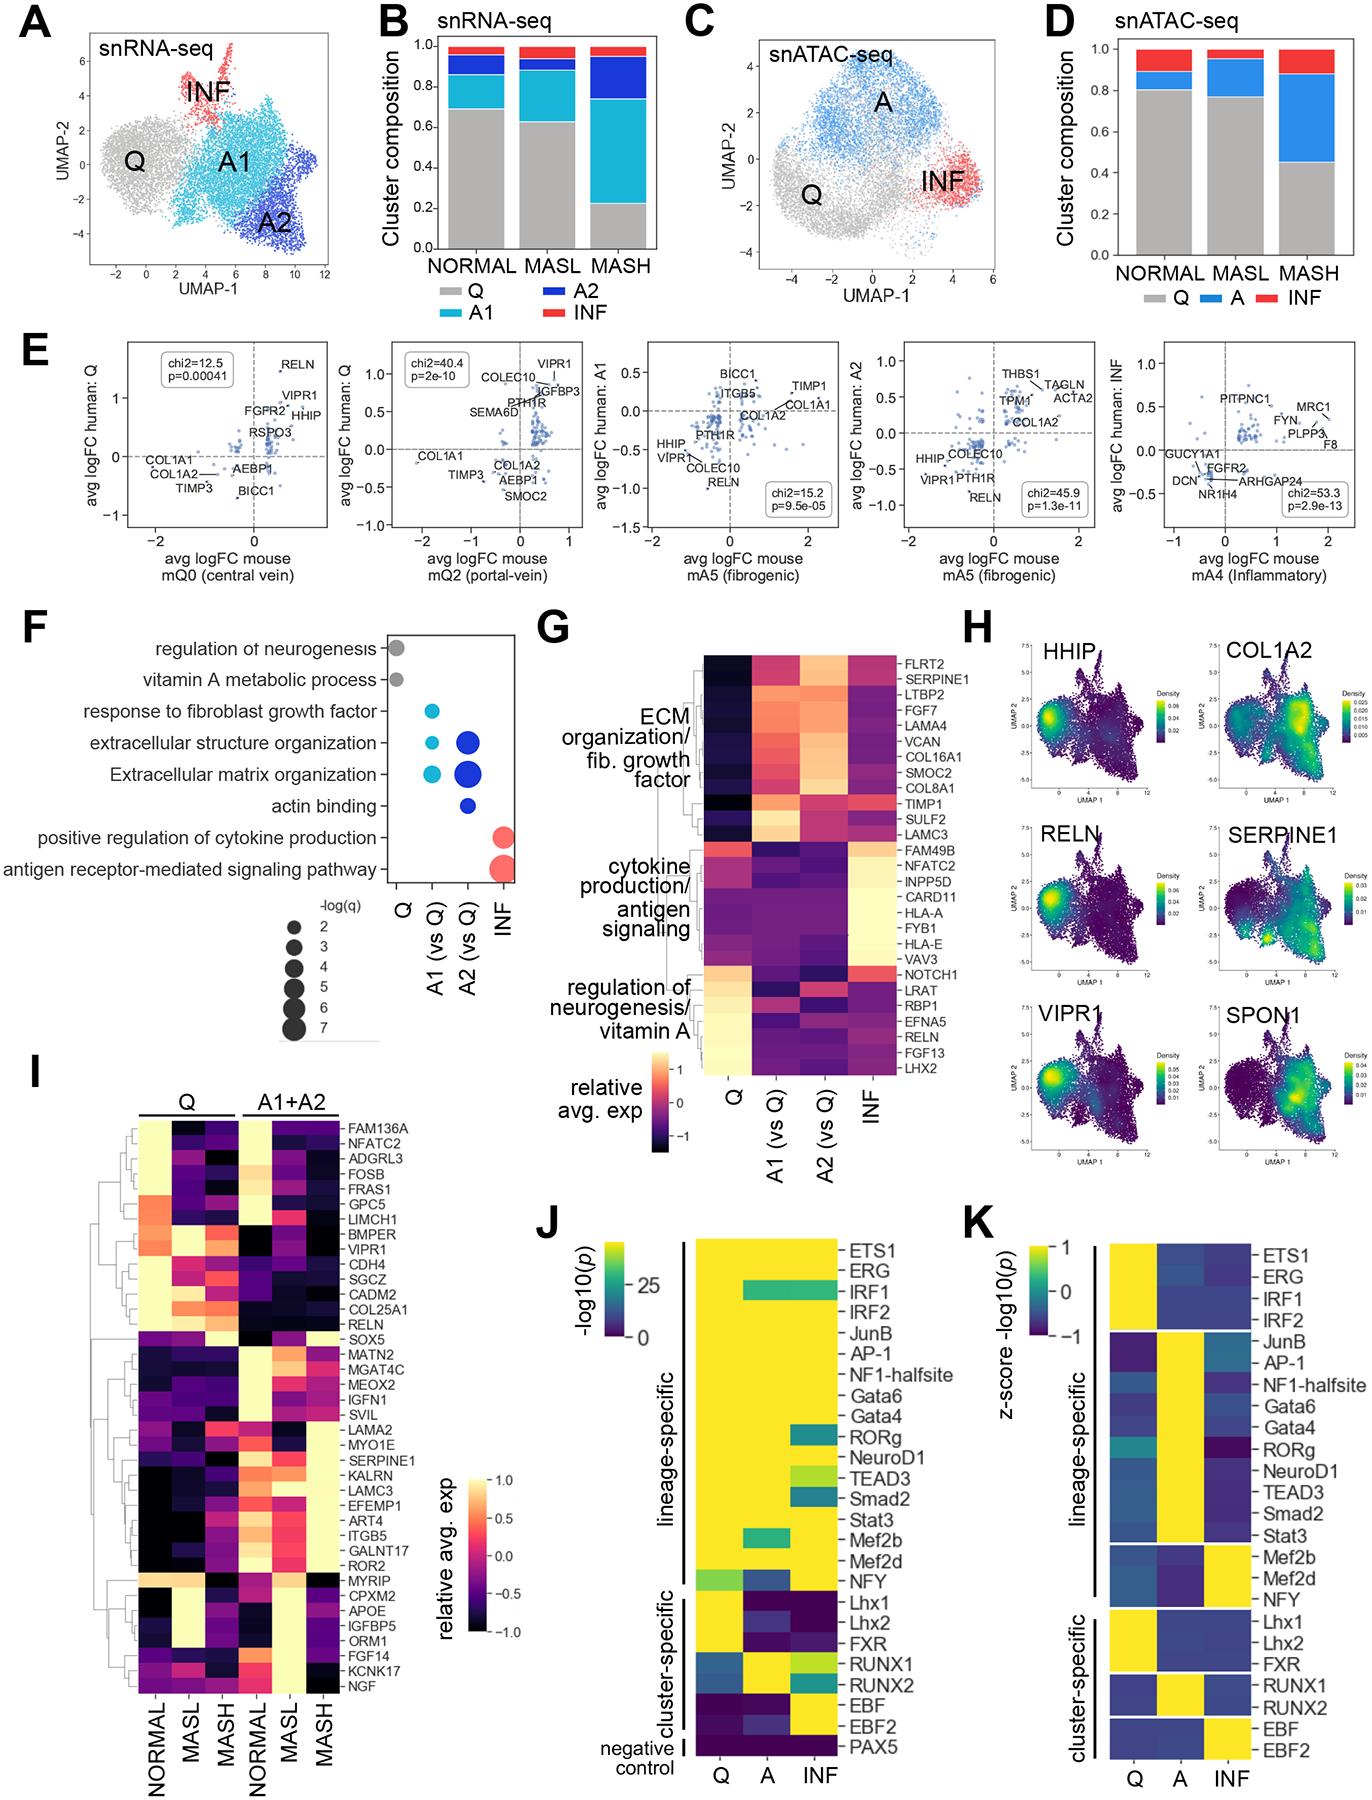
(A-B) snRNA-seq: (A) UMAP dimensionality reduction plot and (B) composition plot depicting subclusters by condition. (C-D) snATAC-seq: (C) UMAP dimensionality reduction plot and (D) composition plot showing subclusters by condition. (E-I) snRNA-seq: (E) Scatter plots demonstrating overlapping expression of the “marker genes” between mouse and human HSC subclusters. A χ2 test shows significance in direction of up/downregulation between mouse and human marker genes. (F) Dotplot: representative pathways distinguishing each HSC subcluster. A1 and A2 were compared to quiescent cells to highlight the fibrogenic pathways upregulated in both. Dot size reflects significance. (G) Heatmap: relative expression of genes from cluster-specific pathways in panel F. (H) UMAP density plots showing expression of selected quiescent and activated genes. (I) Heatmap of relative expression of selected genes in qHSC (Q) or aHSCs (A1+A2) per condition. (J-K) snATAC-seq: (J) Absolute and (K) relative motif enrichment and binding TFs for differentially accessible peaks/cluster are shown in heatmaps.
Specifically, cluster Q can be distinguished from other clusters by expression of quiescent genes (RELN, LRAT, RBP1, LHX2)[3] and upregulation of the neurogenesis/vitamin A metabolic pathways (Figure3F–G, TableS7–8). A1 and A2 subclusters both expressed highly fibrogenic genes, many of which play a role in ECM organization (COL1A2, LAMA4, VCAN, COL8A1, TIMP1, SERPINE1, SPON1, LAMC3, and others)[3] (Figure3G–H, TableS10). In general, the A1 cluster had intermediate levels of expression of many fibrogenic and ECM genes and pathways (higher than Q, but lower than A2; FigureS7A–D). The A1 cluster did uniquely upregulate some genes and pathways, including pathways related to protein phosphorylation, and cell surface signaling (FigureS7E–G). Additionally, some genes and pathways related to circulatory system development were evenly upregulated in both A1 and A2 (FigureS7H–J). Finally, HLA-A, HLA-E, NFATC2, VAV3, SYTL3, YES1, MYO1F, FTL, FOSL2, and BTG1[3, 12] genes related to regulation of immune responses, cytokine production, actin cytoskeletal rearrangements and transcriptional alterations, cell surface receptor signaling were induced exclusively in the immune-activated INF cluster (Figure3F–G, FigureS8). NORMAL- and MASL-specific HSC genes were found predominantly in cluster Q, while MASH-specific genes were most highly expressed in clusters A1/2 (FigureS9, TableS3).
NORMAL, MASL, and MASH qHSCs and aHSCs exhibit unique characteristics.
Remarkably, not only did the HSC composition vary per condition, but also the gene expression profiles of Q and A clusters changed between NORMAL, MASL or MASH HSCs (Figure3I, FigureS10), implying that populations of HSCs are heterogeneous. For example, expression of KALRN, SERPINE1 LAMA2, EFEMP1, and ITGB5 distinguished MASH aHSCs from MASL or NORMAL aHSCs (Figure3I, FigureS10D). MASL qHSCs and aHSCs uniquely upregulated expression of CPXM2, APOE, IGFBP5, ORM1 genes (Figure3I, FigureS10F). These novel findings may identify potential biomarkers specific for progression of MASL to MASH.
Lineage-determining and cluster-specific TFs co-regulate HSC phenotypes.
To investigate the mechanisms of HSC regulation, we first identified snATAC-seq peaks/candidate cis-regulatory elements (cCREs) that were specifically enriched in each HSC subcluster followed by TF motif enrichment analysis[13] (Figure3J–K, FigureS11A–B, TableS11). The absolute enrichment of subcluster-specific cCREs identified ≈19 TF motifs, which were highly induced in all HSC clusters (vs PAX5 TF, which was not expressed in HSCs and served as negative control, Figure3J). Unexpectedly, some of these TFs were previously described as associated with activation (JUNB, AP-1, RUNX1, TEAD, SMAD, STAT, MEF)[Suppl. Reference2], while others (ETS, IRF, GATA) were implicated in lineage determination and maintenance of quiescent HSC phenotype[2]. Lineage-determining TFs are abundant in specific cell types, bind enhancers in a cell-specific manner, and their deletion may lead to the development of alternative cellular fate[4]. Due to their high and ubiquitous motif enrichment, these ≈19 TFs likely fall into a category of lineage-determining TFs (Figure3J)[4], suggesting that differentially accessible lineage-determining TFs modulate HSC phenotypes.
In turn, relative enrichment of TF motifs revealed preferential enrichment for each lineage-determining TF in cluster-enriched cCREs (Figure3K). For example, the activation-associated JUNB/AP1 motif was distinctly enriched in cCREs associated with the A cluster (Figure3K), ETS1 and IRF1/2[2] in Q cluster, while cCREs associated with the INF cluster were enriched for MEF2 and NFY [Suppl. Reference2–3].
Furthermore, strong correlation between high enrichment of selected cluster-specific TFs and lineage-determining TFs was observed only in cCREs from specific HSC clusters (Figure3J–K). Cluster-specific TFs are defined as a group of TFs that are upregulated only in functionally distinct HSC subpopulations [Suppl. Reference2–3]. We hypothesized that cluster-specific TFs may determine phenotype of each cellular subset. For example, RUNX1/2 was most highly enriched in cCREs associated with A, Lhx1/2 and FXR in Q, and EBF in INF (Figure3J–K). Since binding sites of cluster-specific TFs are often located within cCREs of HSC-lineage-determining TFs[Suppl. Reference2–3], a cluster-specific TF may regulate the transcription of lineage-determining TFs. In support, analysis of motifs detected in cCREs linked to promoters (CICERO)[14] revealed that lineage-specific IRF1 can be co-regulated by RUNX1/2 and FXR, while JUNB and GATA6 may be co-regulated via crosstalk between ETS1/2-RUNX1/2 (FigureS11C–E). Overall, different combinations of cluster- and lineage-determining TFs can produce a variety of signals to control HSC phenotypes in response to disease. To further corroborate this finding, we tested if the stage of liver fibrosis affects the heterogeneity of HSC subclusters.
HSC activation is linked to the severity of liver fibrosis.
When HSC cluster composition was compared in different donors using snRNA-seq data, it directly correlated with the stage of liver fibrosis (Figure4A–C). NORMAL and MASL donors had the highest proportion of cells in the quiescent Q cluster. As expected, the MASH donors with severe fibrosis (stage 4) had the largest proportion of cells in the fibrogenic A1 and A2 clusters, and relatively fewer cells in the Q cluster (Figure4A–B). MASH donors with stage 2–3 fibrosis were more likely to have HSCs in the A1 and Q clusters than the A2 cluster (Figure4B–C). Pseudotime trajectory analysis with Slingshot[15] identified a single path of HSC differentiation starting at the Q cluster and progressing through A1 towards cluster A2 (Figure4D–E), suggesting that quiescent HSCs progressively activate into A1 and A2 HSCs. When plotted along binned pseudotime, expression of activated-specific genes (SERPINE1, EFEMP1, ACTA2, COL1A2) was upregulated in the A1 to A2 clusters while expression of typical quiescent markers (RELN, VIPR1, RBP1) was downregulated (Figure4F).
Figure 4. Unique characteristics of Q, A1, and A2 subclusters of MASH HSCs.

(A) Boxplots: subcluster composition distribution within condition revealed cluster heterogeneity of NORMAL, MASL, and MASH HSCs. Data are mean ± SD; *p<0.05 and **p<0.01, Wilcoxon rank-sum test. (B) Stacked bar-chart showing the composition of Q, A1 and A2 HSCs by fibrosis score. (C) Table: severity of liver disease correlated with predominant cluster. A1 mostly aligned with stage 3 fibrosis (donors D14, D16); A2 mostly aligned with stage 4 (D12). Three donors had cells equally distributed between A1 and A2 (D11, D15, and D18, with stage 4 fibrosis). Three MASH HSCs (D10, D13, and D17 with stage 2 or 3 fibrosis) had a high proportion of cells in Q, demonstrating that some qHSCs may be transitioning to A1. (D) Pseudotime trajectory mapped to HSC UMAP coordinates. Direction of arrow indicates predicted cell state progression from Q to A1 to A2. (E) Distribution of HSCs by condition along the pseudotime coordinates. (F) Average expression of select activated (top row) and quiescent (bottom row) HSC marker genes plotted along binned pseudotime. Points: average expression of cells in bin, error bars: 3×SE. Point colors correspond to predominant subcluster within each pseudotime bin.
Prioritization of novel targets for anti-fibrotic therapy.
We hypothesized that potential candidates for anti-fibrotic therapy would be upregulated and more accessible in MASH and in activated HSCs. In order to address this question, all genes whose expression and chromatin accessibility distinguished MASH from NORMAL+MASL HSCs and aHSCs from qHSCs (p<0.05, log fold change>0) were intersected (TableS12–13). 146 genes were more accessible and upregulated in MASH aHSCs (TableS12). 13 of these genes belonged to the actin filament organization pathway, while 23 genes belonged to the ECM pathway, consistent with our observation that the ECM pathway was strongly enriched in MASH HSCs (Figure5A). Based on their involvement in biologically relevant pathways, we selected six genes for experimental validation; SERPINE1, GAS7, EFEMP1, SPON1, KLF9, and LTBP2 (Figure5A–D).
Figure 5. Genes that mediate ECM organization network in MASH HSCs.

(A) Network of genes accessible and upregulated in MASH aHSCs, enriched in ECM organization pathway (blue), and actin filament organization (pink) (p<0.05). Selected genes for follow-up are highlighted in yellow. (B) Average expression of selected 6 core MASH aHSC genes by cluster (top) and condition (bottom); error bars: 95% confidence interval. (C) Differential expression/accessibility statistics. (D) Normalized accessibility peaks. (E) Accessibility plot for the regions surrounding SERPINE1. (F) Network of TFs which are known to target ≥2 prioritized aHSC genes. The networks of the master regulator RUNX1/2 are highlighted in red. (G) Network constructed from predicted regulatory relationships between signal-, cluster-, and lineage-specific TFs and selected core aHSC genes. Arrows indicate a significant motif binding event (adj. p<0.1; FIMO). (H) Proposed regulation of HSC activation via crosstalk between TFs. (I) EMSA assay demonstrated specific binding of RUNX1 from the lysates of CMV-RUNX1/2-Flag-transfected HEK293 (vs CMV-Flag-transfected HEK293) to the Serpine1 enhancer probe. Addition of anti-Flag Ab resulted in probe super-shift. (J) RUNX2 locus-specific ChIP analysis was performed using human HSC ± TGFβ1 (5 ng/ml, 24 h). Data are mean ± SD; ***p< 0.001, one-way ANOVA followed by Tukey’s test.
TF regulons of SERPINE1, LTBP2, GAS7, EFEMP1, SPON1, and KLF9.
The potential cis-regulatory relationships of the selected 6 core genes were assessed using CICERO[14]. For example, in the genetic locus of SERPINE1, co-accessible peaks/cCREs (visualized by connecting lines) between putative enhancer-promoter elements of SERPINE1 and neighboring TRIM56 were identified (Figure5E), suggesting that these genes may be co-regulated. The upstream and downstream accessible chromatin regions of SERPINE1 gene were highly enriched for motifs JUNB/AP1, RUNX1/2 (activation-associated TFs) and ETS1 (which most likely suppressed SERPINE1 expression). Consistently, in vitro knockdown of ETS1/2 isoforms in mouse aHSCs resulted in strong upregulation of SERPINE1, LTBP2, GAS7, EFEMP1, and SPON1 genes (FigureS12A)[2], indicating that these genes might be activated by a common signaling pathway. We queried a database of TF-target gene relationships[16]. SERPINE1, LTBP2, GAS7, EFEMP1, SPON1, and KLF9 (blue circles) were co-regulated by a small group of TFs (red triangles)[Suppl. Reference2–3], including FOX, RUNX, SREBP1, ELF3, FOXA1, HOXA13 and other TFs (Figure5F). Some of these TFs were implicated in regulation of TGFβ1-mediated fibrogenic responses[Suppl. Reference4–6], and were considered as “signal-dependent” TFs[Suppl. Reference2–3]. These TFs each co-regulated several target MASH aHSC-specific genes and were interconnected with the cluster- and lineage-specific TFs[Suppl. Reference4–6]. Interactions between TFs and genes of interest are shown by motif enrichment using Find Individual Motif Occurrences (FIMO, Figure5G)[13]. RUNX1/2 was identified as a potential co-activator of lineage-, cluster-, and ECM-specific TFs throughout our analysis (Figure5G), suggesting that RUNX1/2 may serve as a master regulator of fibrogenic responses. We hypothesize that TGFβ1-responsive FOXP1 and FOXA1/2 regulate activation of RUNX1/2 which in turn induce JUNB/AP-1 transcription above basal level, leading to suppression of ETS1/2 (Figure5H). In support, dsiRNA-based knockdown of RUNX1 or RUNX2 suppressed TGFβ1-induced fibrogenic activation and SERPINE1 expression in human HSCs (FigureS12B–F). Using electrophoretic mobility shift assay (EMSA) and locus-specific Chromatin Immunoprecipitation (ChIP) analysis, we confirmed that RUNX1/2 can directly bind to SERPINE1 enhancer cCRE (Suppl. Methods17–18) and drive its transcription, suggesting that blocking RUNX1/2-SERPINE1 in HSCs decreases liver fibrosis (Figure5I–J).
GAS7, SERPINE1, SPON1, LTBP2 were identified as TGFβ1-responsive genes in HSCs.
Functional properties of the 6 core MASH-specific fibrogenic HSC genes SERPINE, LTBP2, GAS7, EFEMP1, SPON1, and KLF9 were further evaluated in vitro using 2D human HSC cultures. Expression of GAS7, SERPINE1, SPON1, LTBP2 (but not EFEMP1 or KLF9) was upregulated in TGFβ1 (5 ng/ml)-stimulated human HSCs (Figure6A), demonstrating that these genes were responsive to TGFβ1. The role of GAS7, SERPINE1, SPON1, and LTBP2 genes in HSC activation was further assessed using dsiRNA knockdown[5]. >85% gene knockdown was achieved in HSCs transfected with gene targeting-dsiRNA (vs scrambled-dsiRNA, Figure6B–C, FigureS13). Knockdown of SERPINE1, GAS7, SPON1, and LTBP2 resulted in significant downregulation of the fibrogenic genes in TGFβ1-stimulated human HSCs. Knockdown of SERPINE1 also suppressed expression of GAS7, SPON1, and LTBP2 genes, indicating that SERPINE1 plays an important role in HSC activation. Moreover, knockdown of GAS7, SPON1, or LTBP2 in isolated human HSCs inhibited SERPINE1 induction (Figure6C, FigureS14), suggesting that these genes may be co-regulated.
Figure 6. HSC-specific knockdown of SERPINE1 suppressed fibrogenic responses in human liver spheroids with MASH.

(A-C) Cultured human MASH HSCs (donor n=2, D21 and D23, triplicates) were analyzed by qRT-PCR: (A) HSCs were stimulated ± human TGFβ1 (5 ng/ml, 24 h). (B) HSCs were transfected with gene-targeting (or scrambled) dsiRNA, the efficiency of gene knockdown was measured by qRT-PCR. Data are mean ± SD; *p<0.05 and ***p<0.001, unpaired two-tailed student t-test. (C) Expression of fibrogenic genes was assessed in gene-targeted (vs control) HSCs ±TGFβ1. (D) Human liver spheroids±MASH were generated using hepatocytes (D19) + NPCs (D22) + HSCs (D23), harvested, and immunostained. (scale bar=200 μm or 250 μm). (E-H) Expression of fibrogenic genes in control and MASH liver spheroids containing dsiRNA gene targeted HSCs was assessed using (E) qRT-PCR, (F-G) Western blotting, or (H) immunohistochemistry. (scale bar=200 μm). (I-J) Control and MASH liver spheroids containing RELN-knocked down HSCs were assessed using (I) qRT-PCR, and (J) Western blotting. (K-M) The effect of PAI-1 inhibitor TM5441 (0, 20, and 40 μM) on expression of fibrogenic genes was tested using (K) human HSCs ± TGFβ1 (24 h); or MASH (vs control) liver spheroids using (L) qRT-PCR or (M) Western blotting. (C-L) Data are mean ± SD; *p<0.05, **p<0.01, and ***p<0.001, one-way ANOVA followed by Tukey’s test.
Knockdown of SERPINE1 and SPON1 prevented fibrosis in human liver spheroids with MASH.
Human liver spheroids were generated by co-culturing all liver cell types (hepatocytes, non-parenchymal cells, and HSCs at the ratio observed in the liver), followed by stimulation with a MASH cocktail for an additional 7 days[6, 8]. Upregulation of hepatotoxic injury (G6PC and CYP2E1, FigureS15), lipid droplets (BODIPY), and fibrogenic genes (COL1A1 and ACTA2) was detected in MASH liver spheroids and was associated with increased SERPINE1 and SPON1 expression in activated Vimentin+αSMA+ aHSCs/myofibroblasts, indicating that human MASH liver spheroids recapitulate responses of human liver to metabolic injury (Figure6D–E).
Next, expression of GAS7, SERPINE1, SPON1, or LTBP2 was knocked down in human HSCs[5] prior to spheroid generation. HSC-specific knockdown of SERPINE1 and SPON1 (but not GAS7 or LTBP2) suppressed COL1A1 and ACTA2 mRNA and protein expression in MASH spheroids (Figure6E–H). Expression of PAI-I was also suppressed in SPON1 knocked down HSCs in MASH spheroids (Figure6G). In contrast, HSC-specific knockdown of the quiescence-associated gene RELN induced expression of SERPINE1 and exacerbated liver fibrosis upregulation of SERPINE1 in MASH spheroids (Figure6I–J). We propose that HSC expression of SERPINE1 is critical for HSC activation. In accord, pharmacological inhibition of PAI-1 activity with inhibitor TM5441 (20 or 40 μM) suppressed COL1A1 production in human HSCs ± TGFβ1, or in human MASH liver spheroids in a dose-dependent manner, suggesting that SERPINE1 can become a target for anti-fibrotic therapy (Figure6K–M).
Genetic deletion of Serpine1 prevented CCl4-induced HSC activation.
To investigate the role of Serpine1 in liver fibrosis, LratCre mice were crossed with Serpine1f/f mice. HSCΔSerpine1 (HSC-specific Serpine1 knockout), heterozygous HSCSerpine1f/-, and wild type (wt) Serpine1f/f mice were treated ± CCl4 for 2 weeks (Figure7A–C) or 6 weeks (Figure7D–F). HSCs were isolated from these mice and analyzed. In comparison with wt qHSCs, expression of Serpine1 was strongly induced in wt aHSCs in response to CCl4 injury (Figure7A, D). As expected, expression of Serpine1 was abolished in aHSCs from CCl4-injured HSCΔSerpine1 mice. Remarkably, expression of Serpne1 was >70% reduced in aHSCs from HSCSerpine1f/- mice after 2 weeks of CCl4, and even further >93% downregulated after 6 weeks of CCl4 (Figure7A, D), indicating that genetic ablation of a single Serpine1 allele can significantly suppress HSC activation (Figure7A–F). qHSCs isolated from HSCΔSerpine1 mice failed to respond to TGFβ1 in vitro (vs wt qHSCs, FigureS16A).
Figure 7. HSC-specific genetic ablation of Serpine1 suppresses CCl4 liver fibrosis in mice.

HSCs were isolated from Serpine1f/f, HSCSerpine1f/-, and HSCΔSerpine1 mice (n=3–4/group) treated with CCl4- or corn oil (A-C) for 2 weeks: expression of (A) Serpine1 and (B) fibrogenic genes was analyzed by qRT-PCR and (C) Western blotting. (D-F) for 6 weeks: expression of (D) Serpine1 and (E) fibrogenic genes was analyzed by qRT-PCR and (F) Western blotting. (G) HSCΔSerpine1 and Serpine1f/f mice ± CCl4 (6 weeks): Serpine1 mRNA was measured in livers, (H) PAI-1 levels were measured in plasma. (I-L) Livers from CCl4 and control Serpine1f/f and HSCΔSerpine1 mice (n=5–10/group) were stained (I) with H&E, Sirius Red, and anti-ɑSMA antibody (scale bar=200 μm), positive area was calculated as percent. (J) Liver/body weight ratio and (K) fibrogenic gene expression were assessed. (L) Liver fibrosis was assessed in CCl4-injured Serpine1f/f and HSCΔSerpine1 mice using Second Harmonic Generation microscopy (scale bar=1mm or 200 μm), fibrillar collagen-positive area was calculated as percent. Data are mean ± SD; *p<0.05, **p<0.01, and ***p< 0.001, one-way ANOVA followed by Tukey’s test.
Genetic deletion of Serpine1 in HSCs inhibits liver fibrosis in mice.
The development of liver fibrosis was compared in CCl4 (6 weeks)-injured HSCΔSerpine1 and wt mice (Figure 7G–L). Based on snRNA-seq analysis, human SERPINE1 was mainly expressed in HSCs and hepatocytes in human MASH livers (FigureS16B–C). Thus, expression of mouse Serpine1 mRNA was >50% reduced in the whole livers of CCl4-HSCΔSerpine1 mice and caused significant depletion of plasma levels of secreted PAI-1 (Figure7G–H), suggesting that hepatocyte-derived Serpine1 did not compensate for the loss of Serpine1 in aHSCs of CCl4-HSCΔSerpine1 mice (FigureS16D).
The development of liver fibrosis was strongly suppressed in CCl4-injured HSCΔSerpine1 mice (vs wt mice), as shown by reduced Sirius Red and αSMA-positive staining, decreased fibrillar collagen density, and downregulation of Col1a1, Col1a2, Col3a1, Acta2, Tgfb1, Timp1, and other fibrogenic markers (Figure 7I–L) but not inflammation (Figure S16E). Overall, our data demonstrate that HSC-specific targeting of Serpine1 ameliorated liver fibrosis development. Targeting of RUNX1/2-SERPINE1 axis may provide a novel strategy for treatment of liver fibrosis in patients.
Discussion
This study characterizes human HSCs in NORMAL, MASL, and MASH livers using snRNA-seq and snATAC-seq. We identified a population of highly fibrogenic aHSCs that plays a key role in the pathogenesis of MASH liver fibrosis, identified their “signature genes” and pathological role in liver fibrosis using 2D HSC cultures, 3D liver spheroids, and HSC-specific knockout mice.
We mapped the atlas of all human liver cells from NORMAL, MASL, and MASH livers, and focused on the characterization of HSCs. Chromatin accessibility landscapes and gene expression profiles of MASH HSCs/myofibroblasts differed from that in NORMAL and MASL HSCs. Surprisingly, despite strong similarities between MASL and NORMAL HSCs, MASL HSCs exhibited unique characteristics, suggesting that hepatic steatosis is not a benign condition, and can affect HSC phenotype in the absence of inflammation. Moreover, significant changes in epigenetic landscape were observed in MASL HSCs, while the transcriptional profile of MASL HSCs mainly resembled NORMAL HSCs. We can propose that early epigenetic alterations may predict transcriptional responses in HSCs. Specifically, MASL HSCs selectively upregulated activation-specific (NFKB1 and AP1) and quiescence-specific (ETS1, VIPR1, and RELN)[2, 3] genes, suggesting that MASL HSCs might be primed for or protected from activation. RELN glycoprotein was originally identified as a neural and glial marker[1]. Cell fate mapping has determined that Reln+ HSCs were less fibrogenic and exhibited low migratory and proliferative capability compared to Reln− HSCs in CCl4-injured mice[17]. Our data revealed that knockdown of RELN facilitates activation of human HSCs, suggesting that overexpression of RELN in HSCs can prevent the development of MASH liver fibrosis in MASL patients.
In NORMAL, MASL, and MASH human livers, HSCs are highly heterogeneous and contain qHSCs, aHSCs, and INF HSCs in all disease conditions. qHSCs (Q) predominated in NORMAL and MASL HSCs, while aHSCs expanded only in MASH HSCs. aHSCs were composed of two populations: fibrogenic ECM-producing A1 and A2 clusters; A1 HSCs seem to transition into A2. Inflammatory INF HSCs were detected in NORMAL, MASL, and MASH livers. INF HSCs did not express fibrogenic markers, but upregulated cytokine receptors (CD247, PTPRC, and IL4R) and inflammatory chemokines (MRC1, CD96, and others)[1], that partly overlapped with the “senescence-associated secreted protein” phenotype[18] and upregulated some (TNFRSF10B, PTPRC, and RPS19) but lacked expression of conventional senescent genes (CDKN2A, CDKN1A), suggesting that INF HSCs may contain senescent HSCs[18].
Targeting of activated HSCs is a potential approach to halt liver fibrosis in MASH patients (while treating the underlying causes of MASH). Activation of HSCs can be prevented by suppression of the cluster-specific proteins such as SERPINE1 and SPON1, or the key TFs that regulate their transcription. SERPINE1 (PAI-1) may drive HSC activation by dual mechanisms: inhibition of fibrinolysis (via binding to the tissue urokinase/plasminogen activator/plasmin and suppression of plasmin-dependent MMP activities), and prevention of ECM degradation (via binding to vitronectin, and regulation of TGFβ1 signaling)[Suppl. Reference7]. In support, HSC-targeted genetic deletion of Serpine1 or pharmacological inhibition of PAI-1 strongly reduced HSC activation and ameliorated the development of MASH liver fibrosis in 3D human liver spheroids and CCl4-inducd toxic liver fibrosis in mice. Hence, the role of Serpine1 in metabolic liver fibrosis remains unresolved. Global deletion of Serpine1 in metabolically injured mice ameliorated the development of steatosis but had no effect on liver fibrosis[Suppl. Reference8]. Moreover, hepatocyte-specific Serpine1 expression was implicated in the pathogenesis of atherosclerosis[Suppl. Reference9]. Since both aHSCs and hepatocytes are the major source of SERPINE1 in human MASH livers, PAI-1 may synergistically contribute to MASH-induced liver injury or regulate distinct functions in aHSCs and metabolically injured hepatocytes.
Here we introduce a conceptually novel paradigm of HSC regulation on multiple levels via the crosstalk between HSC lineage-determining, cluster-specific, and “TGFβ/ECM/signal-specific” TFs (Figure 5H). TFs orchestrate differentiation of the Q, A1/2, and INF HSC phenotypes. A similar mechanism was recently proposed for myeloid cells[19]. Specifically, high epigenetic/transcriptional induction of ETS, IRF, JUNB, AP-1, NF1, GATA, TEAD, STAT3, MEF in all HSC clusters revealed that there is a broader network of HSC lineage-determining TFs than was previously anticipated.
We hypothesize that fibrogenic activation HSCs is driven by small epigenetic/transcriptional changes in the activity of lineage-determining TFs (such as increased induction of JUNB/AP-1 over ETS) that are tightly controlled by cluster-specific TFs (such as increased induction of RUNX1/2 over LHX1/2, FXR[2])[Suppl. Reference2] and, TGFβ1-dependent FOXA, RUNX, and FOXP1 TFs. Remarkably, induction of RUNX1/2 was observed among lineage-determining, cluster-specific, and signal-dependent groups of TFs[Suppl. Reference3], suggesting that RUNX1/2 may be an essential master regulator of HSC activation. In accord, HSC-specific Runx2 knockout mice were protected from liver fibrosis[Suppl. Reference10]. Knockdown of RUNX1/2 prevented activation and SERPINE1 expression in human aHSC activation, indicating that RUNX1/2-SERPINE1 axis might become a target for anti-fibrotic therapy.
In summary, here we unraveled some of the previously unknown mechanisms of human HSC activation and regulation and outlined potential strategies for anti-fibrotic therapy.
Supplementary Material
Supporting Document contains supplemental materials and methods, 16 supplemental figures and figure legends, 15 supplemental tables and table legends, and supplemental references.
Acknowledgment:
The authors thank Lifesharing OPO, Drs. Rohit Loomba and Kristin Mekeel for support. HYK was supported by basic science research program through the National Research Foundation of Korea funded by the Ministry of Education RS-2023-00245179. The authors used biorender.com to create the illustrations.
Grant support:
This research was supported by the National Institutes of Health R01DK111866, R56DK088837, DK099205, AA028550, DK101737, AA011999, DK120515, AA029019, DK091183, P42ES010337, R44DK115242 (TK and DAB), R01CA285997 (DAB), and by Sanford Stem Cell Fitness and Space Medicine Center at Sanford Stem Cell Institute (UCSD) (TK). This work was partially supported by Altman Clinical & Translational Research Institute (ACTRI) at the University of California, San Diego, which is funded by National Institutes of Health UL1TR001442. Work at the Center for Epigenomics was supported in part by the UC San Diego School of Medicine.
Abbreviations:
- MASH
metabolic dysfunction-associated steatohepatitis
- HSCs
Hepatic Stellate Cells
- qHSCs
quiescent HSCs
- activated HSCs
activated aHSCs/myofibroblasts
- CICERO
cCREs linked to promoters
- TFs
transcription factors
- snATAC-seq
single nucleus assay for transposase-accessible chromatin using sequencing
- snRNA-seq
single nucleus RNA sequencing
- cCREs
cis-regulatory elements
- ECM
extracellular matrix
- EMSA
electrophoretic mobility shift assay
- ChIP
chromatin immunoprecipitation
- PAI-1
plasminogen activator inhibitor-1
- GAS7
Growth arrest-specific 7
- EFEMP1
Epidermal growth factor-containing fibulin-like extracellular matrix protein 1
- SPON1
Spondin 1
- KLF9
Kruppel Like Factor 9
- LTBP2
Latent Transforming Growth Factor Beta Binding Protein 2
- FIMO
Find Individual Motif Occurrences
Footnotes
Conflict of interests: nothing to declare
Data transparency statement:
Sequencing data will be hosted on the gene expression omnibus (GEO) under accession number GSE224688.
References
- [1].Kisseleva T, Brenner D. Molecular and cellular mechanisms of liver fibrosis and its regression. Nature Reviews Gastroenterology & Hepatology 2021;18:151–166. [DOI] [PubMed] [Google Scholar]
- [2].Liu X, Xu J, Rosenthal S, Zhang L-j, McCubbin R, Meshgin N, et al. Identification of Lineage-Specific Transcription Factors That Prevent Activation of Hepatic Stellate Cells and Promote Fibrosis Resolution. Gastroenterology 2020;158:1728–1744.e1714. [DOI] [PMC free article] [PubMed] [Google Scholar]
- [3].Rosenthal SB, Liu X, Ganguly S, Dhar D, Pasillas MP, Ricciardelli E, et al. Heterogeneity of HSCs in a Mouse Model of NASH. Hepatology 2021;74:667–685. [DOI] [PMC free article] [PubMed] [Google Scholar]
- [4].Heinz S, Benner C, Spann N, Bertolino E, Lin YC, Laslo P, et al. Simple Combinations of Lineage-Determining Transcription Factors Prime cis-Regulatory Elements Required for Macrophage and B Cell Identities. Molecular Cell 2010;38:576–589. [DOI] [PMC free article] [PubMed] [Google Scholar]
- [5].Song M-S, Alluin J, Rossi JJ. The Effect of Dicer Knockout on RNA Interference Using Various Dicer Substrate Small Interfering RNA (DsiRNA) Structures. Genes 2022;13:436. [DOI] [PMC free article] [PubMed] [Google Scholar]
- [6].Kim HY, Lee W, Liu X, Jang H, Sakane S, Carvalho-Gontijo Weber R, et al. Protocol to generate human liver spheroids to study liver fibrosis induced by metabolic stress. STAR Protocols 2024;5:103111. [DOI] [PMC free article] [PubMed] [Google Scholar]
- [7].Kleiner DE, Brunt EM, Van Natta M, Behling C, Contos MJ, Cummings OW, et al. Design and validation of a histological scoring system for nonalcoholic fatty liver disease. Hepatology 2005;41:1313–1321. [DOI] [PubMed] [Google Scholar]
- [8].Liu X, Lam K, Zhao H, Sakane S, Kim HY, Eguileor A, et al. Isolation of primary human liver cells from normal and nonalcoholic steatohepatitis livers. STAR Protocols 2023;4:102391. [DOI] [PMC free article] [PubMed] [Google Scholar]
- [9].Ramachandran P, Dobie R, Wilson-Kanamori JR, Dora EF, Henderson BEP, Luu NT, et al. Resolving the fibrotic niche of human liver cirrhosis at single-cell level. Nature 2019;575:512–518. [DOI] [PMC free article] [PubMed] [Google Scholar]
- [10].Franzén O, Gan LM, Björkegren JLM. PanglaoDB: a web server for exploration of mouse and human single-cell RNA sequencing data. Database (Oxford) 2019;2019. [DOI] [PMC free article] [PubMed] [Google Scholar]
- [11].Szklarczyk D, Morris JH, Cook H, Kuhn M, Wyder S, Simonovic M, et al. The STRING database in 2017: quality-controlled protein–protein association networks, made broadly accessible. Nucleic Acids Research 2016;45:D362–D368. [DOI] [PMC free article] [PubMed] [Google Scholar]
- [12].Turner M, Billadeau DD. VAV proteins as signal integrators for multi-subunit immune-recognition receptors. Nature Reviews Immunology 2002;2:476–486. [DOI] [PubMed] [Google Scholar]
- [13].Grant CE, Bailey TL, Noble WS. FIMO: scanning for occurrences of a given motif. Bioinformatics 2011;27:1017–1018. [DOI] [PMC free article] [PubMed] [Google Scholar]
- [14].Pliner HA, Packer JS, McFaline-Figueroa JL, Cusanovich DA, Daza RM, Aghamirzaie D, et al. Cicero Predicts cis-Regulatory DNA Interactions from Single-Cell Chromatin Accessibility Data. Mol Cell 2018;71:858–871.e858. [DOI] [PMC free article] [PubMed] [Google Scholar]
- [15].Street K, Risso D, Fletcher RB, Das D, Ngai J, Yosef N, et al. Slingshot: cell lineage and pseudotime inference for single-cell transcriptomics. BMC Genomics 2018;19:477. [DOI] [PMC free article] [PubMed] [Google Scholar]
- [16].Plaisier CL, O’Brien S, Bernard B, Reynolds S, Simon Z, Toledo CM, et al. Causal Mechanistic Regulatory Network for Glioblastoma Deciphered Using Systems Genetics Network Analysis. Cell Syst 2016;3:172–186. [DOI] [PMC free article] [PubMed] [Google Scholar]
- [17].Chen N, Liu S, Qin D, Guan D, Chen Y, Hou C, et al. Fate tracking reveals differences between Reelin(+) hepatic stellate cells (HSCs) and Desmin(+) HSCs in activation, migration and proliferation. Cell Prolif 2023;56:e13500. [DOI] [PMC free article] [PubMed] [Google Scholar]
- [18].Krizhanovsky V, Yon M, Dickins RA, Hearn S, Simon J, Miething C, et al. Senescence of activated stellate cells limits liver fibrosis. Cell 2008;134:657–667. [DOI] [PMC free article] [PubMed] [Google Scholar]
- [19].Bennett H, Troutman TD, Sakai M, Glass CK. Epigenetic Regulation of Kupffer Cell Function in Health and Disease. Front Immunol 2020;11:609618. [DOI] [PMC free article] [PubMed] [Google Scholar]
Associated Data
This section collects any data citations, data availability statements, or supplementary materials included in this article.
Supplementary Materials
Data Availability Statement
Sequencing data will be hosted on the gene expression omnibus (GEO) under accession number GSE224688.