

SUMMARY
Despite ocular immune privilege, circulating retina-specific T cells can trigger autoimmune uveitis, yet intraocular bleeding—a relatively common event—rarely leads to disease. Using an in vivo immune privilege model, we previously reported that all naive retina-specific T cells entering the eye become primed in situ; about 30% become Foxp3+ regulatory T cells (Tregs), while the rest fail to induce pathology. Here, single-cell transcriptomics and functional validation revealed distinct phenotypes in both populations: ocular Tregs were highly suppressive, whereas non-Tregs expressed suppression- and anergy-associated genes and lacked regulatory function. Trajectory analyses suggested that Tregs and anergic cells arise from a common proliferative precursor in parallel, rather than sequentially. Our data indicate a key checkpoint governing the divergence of anergic and regulatory fates. These findings provide molecular-level insights into ocular immune privilege and may inform strategies to silence autoimmune effector cells or reverse T cell unresponsiveness in cancer, vaccination, or chronic infection.
In brief
Peng et al. show that naive retina-specific T cells encountering antigen in the immune-privileged eye differentiate into distinct regulatory vs. anergic phenotypes from a common precursor. These findings reveal a key checkpoint and provide novel insights into ocular immune privilege, suggesting strategies for immunomodulation in autoimmunity, cancer, and beyond.
Graphical abstract

INTRODUCTION
The eye has developed evolutionary adaptations that limit local inflammation to protect vision and collectively form the complex phenomenon known as ocular immune privilege.1,2 In addition to the physical blood-tissue barriers that separate the eye from the immune system, multiple studies have described that the intraocular environment, composed of ocular fluids and ocular resident cells, is immunosuppressive and can inhibit the activity of immunocompetent cells.3–5 Aqueous humor has been shown to reduce proinflammatory cytokine production by T cells in culture and to promote the induction of regulatory T cells (Tregs).6,7 Soluble factors involved in these processes include transforming growth factor β (TGF-β), α-melanocyte-stimulating hormone, vasoactive intestinal peptide, retinoic acid (RA), and others.2,5 Retinal glial Müller cells were the first ocular resident cells shown to inhibit T cells in co-culture.8 Since then, many reports have described the induction of Tregs by pigmented epithelia in the front and back of the eye.3,9 Immunomodulatory molecules expressed by these cells include CD8610 and programmed cell death ligand 1 (PD-L1)11 that engage the inhibitory receptors CTLA-4 and PD-1, respectively, on T cells, as well as membrane-bound or soluble TGF-β and CTLA-2α.12 Retinal microglia and dendritic-like cells also have been reported to inhibit antigen (Ag)-specific T cell responses and to induce Tregs, in part through aberrant Ag presentation.13–16 However, these studies were conducted largely in vitro, and could not represent the complexity of the living eye. Furthermore, many predated the discovery of Forkhead box P3 (Foxp3) as a marker for Tregs, making it difficult to distinguish de novo induction of Tregs from expansion of a preexisting Treg population.
Immune sequestration of unique retinal Ags, which are absent in the periphery, behind a blood-retinal barrier impedes the development of peripheral tolerance in autoreactive T cells that have escaped thymic negative selection.2,17 Such cells can be easily triggered to become pathogenic effectors, but nevertheless, autoimmune uveitis remains a relatively rare disease.18 To address the question of how the eye maintains immune homeostasis, we established a mouse model in which naive retina-specific T cells,19,20 capable of inducing autoimmune uveitis, are injected into the eyes of healthy wild-type (WT) mice.21 The injected cells express a transgenic T cell receptor (TCR) specific for the retinal Ag, interphotoreceptor retinoid-binding protein (IRBP). This model thus exposes the eye to naive but non-tolerant T cells, as would occur in the case of intraocular bleeding, whether major, as a result of trauma, or minor, as a result of vascular abnormalities (e.g., macular degeneration, diabetic retinopathy, neovascular glaucoma).22,23 Interestingly, the injected T cells acquired an Ag-experienced (primed) phenotype within the eye, but failed to induce uveitis. While ~30% converted to Foxp3+ functionally competent Tregs, the majority did not, and produced detectable levels of interferon-γ (IFN-γ) and interleukin-17A (IL-17A).21 However, the fate and function of these eye-primed non-Tregs could not be determined due to the lack of appropriate technology.
In the present study, we utilized single-cell RNA sequencing (scRNA-seq) to comprehensively define the transcriptome of retina-specific T cells responding to their cognate Ag in the privileged intraocular environment. We present evidence that the non-Foxp3-converted population is not effectors being kept in check by the Tregs but rather represents a novel anergic phenotype unique to the eye that differentiates in parallel with Foxp3+ Tregs from naive retina-specific T cells. Our findings are the first to dissect the phenomenon of ocular immune privilege at the molecular level.
RESULTS
Naive retina-specific T cells differentiate into several distinct subtypes within the ocular environment
To gain better insight into the transcriptomic landscape that naive retina-specific T cells acquire within the eye, we performed scRNA-seq using the in vivo ocular immune privilege model. In this model, naive retina-specific T cells collected from R161H19 mice on the TCRα−/− background, which express a transgenic IRBP-specific TCR on 100% of their T cells, are injected into the eyes of healthy WT mice. The donors are also Foxp3-GFP reporters,24 which permits them to exclude preexisting Tregs and to identify cells that acquire the Treg phenotype in vivo. The recipient hosts are CD90.1 allotype congenic, which permits them to distinguish the donor T cells (that carry the 90.2 marker) from recruited T cells of the host.21 Briefly, the naive T cells sorted from the Tcra−/− R161H Foxp3GFP CD90.2 mice were injected intravitreally into the eyes of CD90.1-congenic WT recipients (Figure 1A). The gating strategy for obtaining naive retina-specific non-Tregs from donors is depicted in Figure 1B. One week after the injection, CD4+ CD90.2+ donor-derived T cells were retrieved from the eyes of CD90.1 congenic recipients. As we reported previously, about one-third (31.8%) of the cells converted to the Foxp3+ phenotype (Figure 1C), and represent functionally competent Tregs.21 The naive retina-specific T cells before intravitreal injection and the injected cells retrieved from the recipient’s eyes were labeled by hashtag oligos before pooling and being subjected to scRNA-seq (Figure 1A; Table S1).
Figure 1. Naive retina-specific T cells differentiate into several distinct subtypes within the ocular environment.

(A) Retina-specific naive T cells were sorted from peripheral lymphoid tissues (spleens and lymph nodes) of Tcra−/− R161H Foxp3GFP reporter donor mice and injected into the eyes of CD90.1-congenic WT recipients. One week later, the injected CD90.2 donor T cells (eye-primed T cells) were retrieved from both eyes of four recipients. Naive and eye-primed T cells were subjected to scRNA-seq. See also Table S1.
(B) Gating strategy for the naive donor cell sorting (CD4+CD44low Foxp3GFP−).
(C) CD90.2+ CD4+ T cells retrieved from eyes of recipients were analyzed for the Foxp3 expression by flow cytometry.
(D) UMAP showing donor T cells before injection (naive), and the donor T cells retrieved from recipients’ eyes 1 week after injection.
(E) Feature plots showing expression of antigen-primed T cell phenotype (CD44+CD62L−), Treg marker (Foxp3), and proliferation marker (Mki67) in eye-primed T cells, indicated by purple color.
(F and G) (F) Cluster identification and (G) ratios of T cell subtypes of eye-primed T cells.
Using standard scRNA-seq analysis pipelines,25 cells that passed quality control were used for downstream analyses. Naive cells representing the population before injection and cells retrieved from the eye on day 7 after injection showed a clear division in the uniform manifold approximation and projection (UMAP) (Figure 1D). A distinct pattern of high Cd44 and almost no CD62L (Sell) expression was confirmed in all cells recovered from the eyes, indicating that they had been primed (Figure 1E). The great majority of Foxp3+ Tregs formed one separate cluster, while a few Foxp3+ Tregs were detected in the neighboring cluster, having high levels of the proliferation marker Mki67 (Figure 1E). This was in line with our previous finding that acquisition of Foxp3 expression in the ocular environment was accompanied by proliferation.21 Unsupervised clustering further uncovered five major populations (Figure 1F) based on their differentially expressed genes (DEGs; Figure S1A). Among them, naive (Foxp1, Lef1, Satb1), Treg (Foxp3 and Il10), and proliferative (Mki67, Stmn1, Top2a) clusters were straightforward to annotate (Figures 1E and S1A). However, we did not find a clear pattern of gene expression to help classify the other two Foxp3− clusters as known lineages (Figure S1A). Therefore, for lack of a better definition, they are designated as “non-Foxp3 converted” (nfc1 and nfc2) in the interim. The proportions of the T cell subpopulations recovered from recipients’ eyes are shown in Figure 1G). The scRNA-seq data revealed that the naive T cells exposed to their cognate Ag within the ocular environment differentiated from a homogeneous population into diverse subtypes, with Tregs constituting one of several discrete populations.
nfc clusters do not conform to canonical gene patterns of known effector Th lineages
To assess the phenotype of the nfc cells, we screened defining gene sets, including master transcription factors (TFs), signature cytokines, chemokines, and surface molecules characteristic of the known major T effector lineages.
The levels of T helper 1 (Th1) and Th17 lineage-defining TFs, Tbx21 for Th1 and Rorc for Th17, respectively, were relatively low across all four eye-primed clusters and not restricted to any particular cluster (Figures 2A and 2B). Th1-associated surface markers (Ccr5 and Cxcr3)26 were confined to the Treg cluster but absent in the nfc clusters (Figure 2B). Additionally, Ifng and Csf2, key pro-inflammatory Th1 cytokines, were undetectable in both nfc clusters (Figure 2A), suggesting there is no Th1 induction. Although a moderate Il17a was present in the nfc2 cluster (Figure 2A), other Th17 signature genes (Csf2, Il17f, Il22, Il23r)27,28 were not detected (Figures 2A and S1B). The Th17 surface marker Ccr6 was also not prominently expressed in nfc2 (Figure 2B), making it inconsistent with a canonical Th17 profile. The nfc1 cluster exhibited modest expression of TF Gata3 for Th2 and Bcl6 for T follicular helper (Tfh) cells (Figure 2A), yet it lacked other Th2-associated (Ccr3, Ccr8, Il4, Il5, Il9) or Tfh-associated (Cxcr5, Cxcl13, Il21) genes (Figure S1B), suggesting that nfc1 does not align with either Th2 or Tfh lineage. Th9-related (Spi1, Il4ra, Il9) and Th22-related (Ahr, Ccr4, Ccl7, Il13, Il22) genes were not observed either (Figure S1B), so these two lineages have no similarity with the nfc clusters. Interestingly, the nfc1 and a part of the nfc2 populations shared several T cell markers with naive or resting cells (Ccr7, Lef1, Tcf7)29 (Figure 2C).
Figure 2. Non-Foxp3-converted (nfc) clusters do not conform to canonical gene patterns of effector Th lineages.

(A) Violin plots showing the expression of Th lineage-specific transcription factors (TFs) and cytokines in each cluster. See also Figure S1.
(B) Feature plots showing the distribution of selected Th lineage-specific markers, including TFs, cytokines, and chemokine receptors.
(C) Feature plots showing distribution of markers associated with a naive-like phenotype (Ccr7, Lef1, Tcf7).
(D) Fluorescence-activated cell sorting (FACS) plots showing LAP-1 (encoded by the Tgfb1 gene) and IL-10 expression in Foxp3-converted vs. nfc recovered from the eyes of recipient mice after 1 week. LT, lymphoid tissue T cells from Tcra−/− R161H Foxp3GFP mice.
We next considered Foxp3− regulatory phenotypes. Type 1 Tregs (Tr1s) are featured as IL-10 producers independent of Foxp3,30 but the nfc cells showed little to no Il10 expression or IL-10 production (Figures 2A, 2B, and 2D), and this would argue against them being Tr1 cells. Instead, both nfc clusters showed high expression of Tgfb1 (Figures 2A and 2B), consistent with a Th3 phenotype involved in mucosal immune regulation and oral tolerance.31 While they expressed latency-associated peptide (LAP-1, a product of Tgfb1), unlike some gut Tregs, they did not express IL-1032 (Figure 2D). Of note, Tgfb2, Tgfb3, and the immunosuppressive cytokine IL-35 (Il12a and Ebi3) were undetectable in all eye-primed clusters (Figure S1C).
These data support the conclusion that the nfc clusters are Th lineage negative, and as such, they are unlikely to represent known pathogenic effector cells or canonical Tregs.
nfc clusters exhibit a combination of regulatory/anergic gene signature
To better characterize the nfc clusters, we then investigated their global transcription profile. Gene signatures of each subset in the eye were defined by comparing their transcriptomes to that of naive T cells as baseline (Figure 3A; Table S2). Both nfc clusters expressed high levels of anergy-associated genes as Nrgn,33,34 Cblb,35 Dgkz,36 Nr4a1–3,37,38 Nrp1, Tox, and Tox2.17,39,40 They also expressed canonical Treg-related genes, including inhibitory checkpoint molecules (Nt5e, Maf, Itgav, Il2rb, Tnfrsf4, Tgfb1, Ctla4, Lag3)41–45 (Figure 3A), and these were shared with the Treg cluster. Of note, Ccl5, S100a4, S100a6, Tbx21, and Gzmb, which characterize activated, highly suppressive Tregs42–44 and were present in the Treg cluster, were not shared with the nfc populations (Figure 3A).
Figure 3. Intraocular environment induces regulatory and anergy signatures.

(A) Volcano plots showing the differential gene expression of each cluster (baseline: naive cluster). Differentially expressed genes with more than 2-fold changes are highlighted in red (upregulated) or blue (downregulated). Representative signature genes are shown. See also Table S2.
(B–E) Representative GSEA enrichment results mapping the signatures of each cluster against the Molecular Signatures Database (MSigDB). Normalized enrichment score (NES) indicates the similarity of the current gene signatures with predefined gene sets. Nominal p value lower than 0.05 denotes significant similarity to the corresponding to the predefined gene set in (B)–(E). (B) Signature of in vitro polarized Th17 cells. (C) Signature of de novo converted Tregs in vivo (also known as peripherally induced Tregs). (D) Signature of in vivo Tregs in lymphoid tissues (spleen, thymus, and lymph nodes). (E) Curated anergy signature from canonical in vitro anergy-inducing conditions.
We then performed gene set enrichment analysis (GSEA) to align the signatures of eye-primed T cell clusters with predefined gene sets in the Molecular Signatures Database (MSigDB)46 (Figures 3B–3E). In spite of upregulated Il17a (Figure 3A, center), the nfc2 cluster did not have a characteristic Th17 signature47 (Figure 3B). Rather, the two nfc clusters appeared to share characteristics with Tregs that had been de novo differentiated in non-ocular tissues in vivo41 (Figure 3C), Tregs isolated from lymphoid tissues (LTs) of healthy mice48 (Figure 3D), and to in vitro-induced anergic T cells49 (Figure 3E). The Treg cluster also shared genes with the anergic signature (Figure 3E), supporting the notion that many phenotypic and mechanistic traits are shared between Tregs and anergic T cells defined by other studies.50–52 Given that the nfc clusters lacked the defining Treg gene Foxp3, in the aggregate, they conformed best to the T lymphocyte anergy gene set.
nfc clusters are hyporesponsive to antigenic stimulation but lack suppressive function
The results above suggested that the nfcs were more reminiscent of Tregs than of other Th cell lineages and strongly resembled anergic T cells. Previous studies had demonstrated that a functional characteristic of anergy is hyporesponsiveness to antigenic stimulation, which can be rescued by IL-2.17 To examine whether this was true of our nfc populations, we separated Foxp3+ and Foxp3− cells retrieved from the eye by flow sorting. Tregs and naive T cells from peripheral LTs of Tcra−/− R161H Foxp3GFP transgenic mice were used for comparison. Proliferation was measured by [3H]-thymidine incorporation in a co-culture system with Ag-presenting cells (APCs) and IRBP peptide as the cognate Ag (Figure 4A). Eye-induced nfc cells exhibited minimal proliferation, which was considerably enhanced in the presence of IL-2, although it remained markedly lower than that of the naive cells (Figure 4B). As expected,53 Tregs also responded to IL-2 supplementation. Together with Figure 3, we interpret our data to mean that (1) the phenotype of the nfc T cells is consistent with anergy and that (2) these cells remain hyporesponsive to their cognate Ag independent of the continued presence of Foxp3+ Tregs and of the ocular environment.
Figure 4. nfc cells are functionally hyporesponsive to cognate antigen but not suppressive.
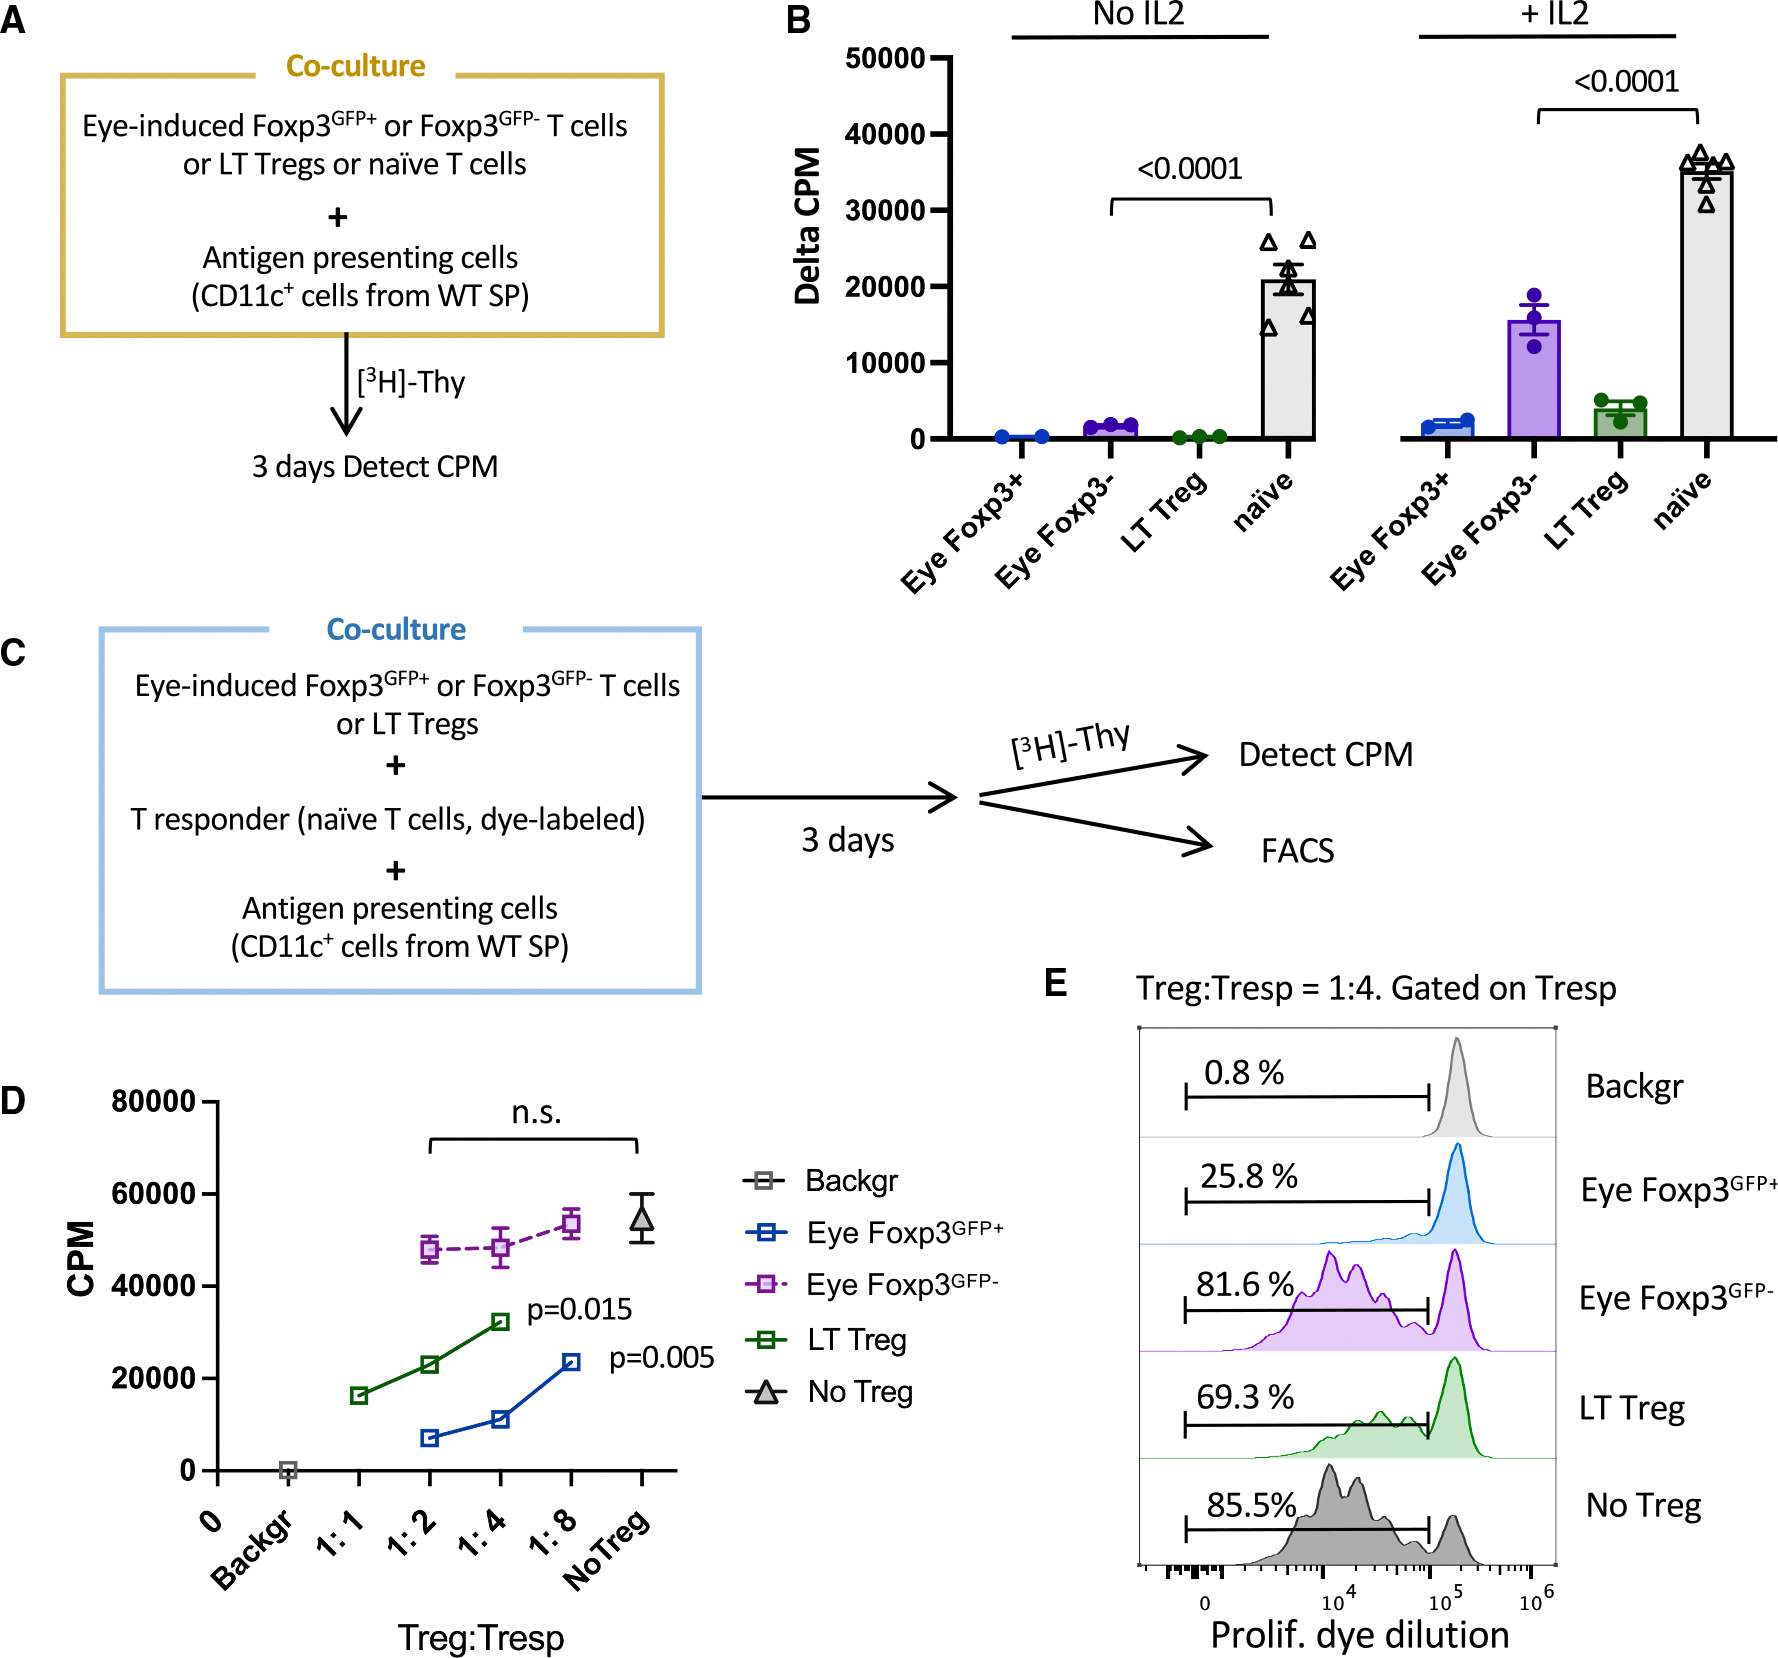
(A) Diagram of co-culture system in (B). Naive T cells or Tregs from peripheral LTs were sorted from Tcra−/− R161H Foxp3GFP mice. Donor-derived Tcra−/− R161H Foxp3GFP+ and Foxp3GFP− cells were sorted from recipients’ eyes. CD11c+ APCs were magnetically enriched from the spleens of WT B10.RIII mice.
(B) Proliferation to the cognate antigen IRBP161–180 in the presence or absence of IL-2. Cells without antigen served as background. Only one or two wells of eye-induced Tregs could be set up per experiment. Shown is one representative experiment of three. Data are shown as mean ± SEM.
(C) Scheme for antigen-specific suppression assay by [3H]-thymidine uptake and dye dilution methods for (D) and (E).
(D) Dose-dependent suppression of T responder cells by putative suppressors with antigen stimulation (triplicate). One representative experiment of two. Results are represented as mean ± SEM.
(E) FACS plots of proliferation dye dilution. Tresp without antigen served as background.
Hyporesponsiveness to Ags that can be rescued by IL-2 is consistent with anergy, but it is not necessarily a distinguishing attribute from Tregs. To resolve this, we compared the ability of eye-induced Treg and nfc (Foxp3GFP−) T cells to suppress proliferation of naive responders (Tresp) to their cognate Ag (IRBP peptide presented on splenic APC; Figure 4C). We used two complementary methods, [3H]-thymidine uptake and proliferation dye dilution, to exclude interference from possible proliferation of the Tregs themselves. Eye-induced Tregs and LT Tregs suppressed thymidine uptake by Tresp in a dose-dependent fashion. In contrast, the eye Foxp3GFP− cells failed to significantly inhibit Tresp proliferation even at a 1:2 Treg:Tresp ratio (Figure 4D). Dye dilution analysis confirmed that the proliferation rate of Tresp in the presence of anergic cells did not differ from control, indicating that Foxp3GFP− cells lacked appreciable suppressor function in vitro (Figure 4E).
Therefore, from this point forward, the nfc1 and nfc2 clusters will be referred to as “anergic1” and “anergic2,” respectively.
Distinct genes contribute to dampened TCR signaling in eye-induced anergic and regulatory cells
To address the question of what signaling molecules and pathways were involved in the induction of the anergic and regulatory phenotypes, we performed an Ingenuity Pathway Analysis (IPA). Compared to the naive cluster, pathways related to T cell suppression (T cell exhaustion, immunogenic cell death, and tumor necrosis factor receptor 2 signals) and deficient TCR signaling (downregulated TCR, CD28, and ICOS signals) that restrain effector differentiation were prominent in both Treg and anergic T cell clusters (Figure 5A). Co-inhibitory genes that may feed into this pattern—Ctla4 and Lag354,55—were significantly upregulated in all eye-primed cell clusters, and their expression was highest in the Treg cluster, whereas Pdcd1 (encoding PD-1), Fasl, and Cd200 were increased mainly in anergic clusters (Figure 5B). Activation of TGF-β signaling in the anergic clusters (Figure 5A) aligns with increased expression of TGF-β receptors (Tgbr1–3) (Figure 5C), suggesting a connection between TGF-β signaling and the anergic state.
Figure 5. Suboptimal TCR signaling and inhibitory signals are involved in eye-induced tolerance.

(A) Heatmap of differentially regulated immune-related signaling pathways in each T cell population compared to the naive baseline. Z score was calculated by Ingenuity Pathway Analysis (IPA).
(B and C) Violin plots showing expression of canonical inhibitory markers (B) and TGF-β receptors (C).
(D) Violin plots displaying gene expression of anergy-associated factors.
(E) Bubble plot showing frequency of positive cells (size of bubble) and expression levels (color gradient) of genes involved in TCR/CD28 and mitogen-activated protein kinase signaling pathways.
Compared to Tregs, the anergic populations expressed higher levels of anergy-inducing factors such as NFAT (nuclear factor of activated T cells, encoded by Nfatc1/2) family members,56,57 NR4A (nuclear receptor subfamily 4A, encoded by Nr4a1–3) family members,37,38 CBL-B (an E3 ubiquitin ligase, encoded by Cblb),35 and DGKζ (diacylglycerol kinase zeta, encoded by Dgkz),36 which are causally related to hyporesponsiveness, by affecting multiple components participating in TCR signal transduction17,58 (Figure 5D). This is consistent with the low expression of molecules downstream of TCR/CD28 pathways, such as pyruvate dehydrogenase kinase 1 (Pdk1), phosphatidylinositol 3-kinases (Pik3r5, Pik3cd), and protein kinase C family (Prkcb, Prkcq) (Figure 5E), supporting dampened TCR/CD28 signaling.
Distinct and shared tolerance-inducing regulons are enriched in anergic and Treg clusters
To identify potential key TFs regulating anergic and Treg subsets, we used the SCENIC (single-cell regulatory network inference and clustering) pipeline, which infers TF activity from the co-expression of its direct target genes, collectively forming a regulon59 (Figure 6A). This provides a more precise readout of a cell’s state of differentiation than TF mRNA expression alone.
Figure 6. Distinct tolerance-inducing regulons and markers identify anergic and Tregs.
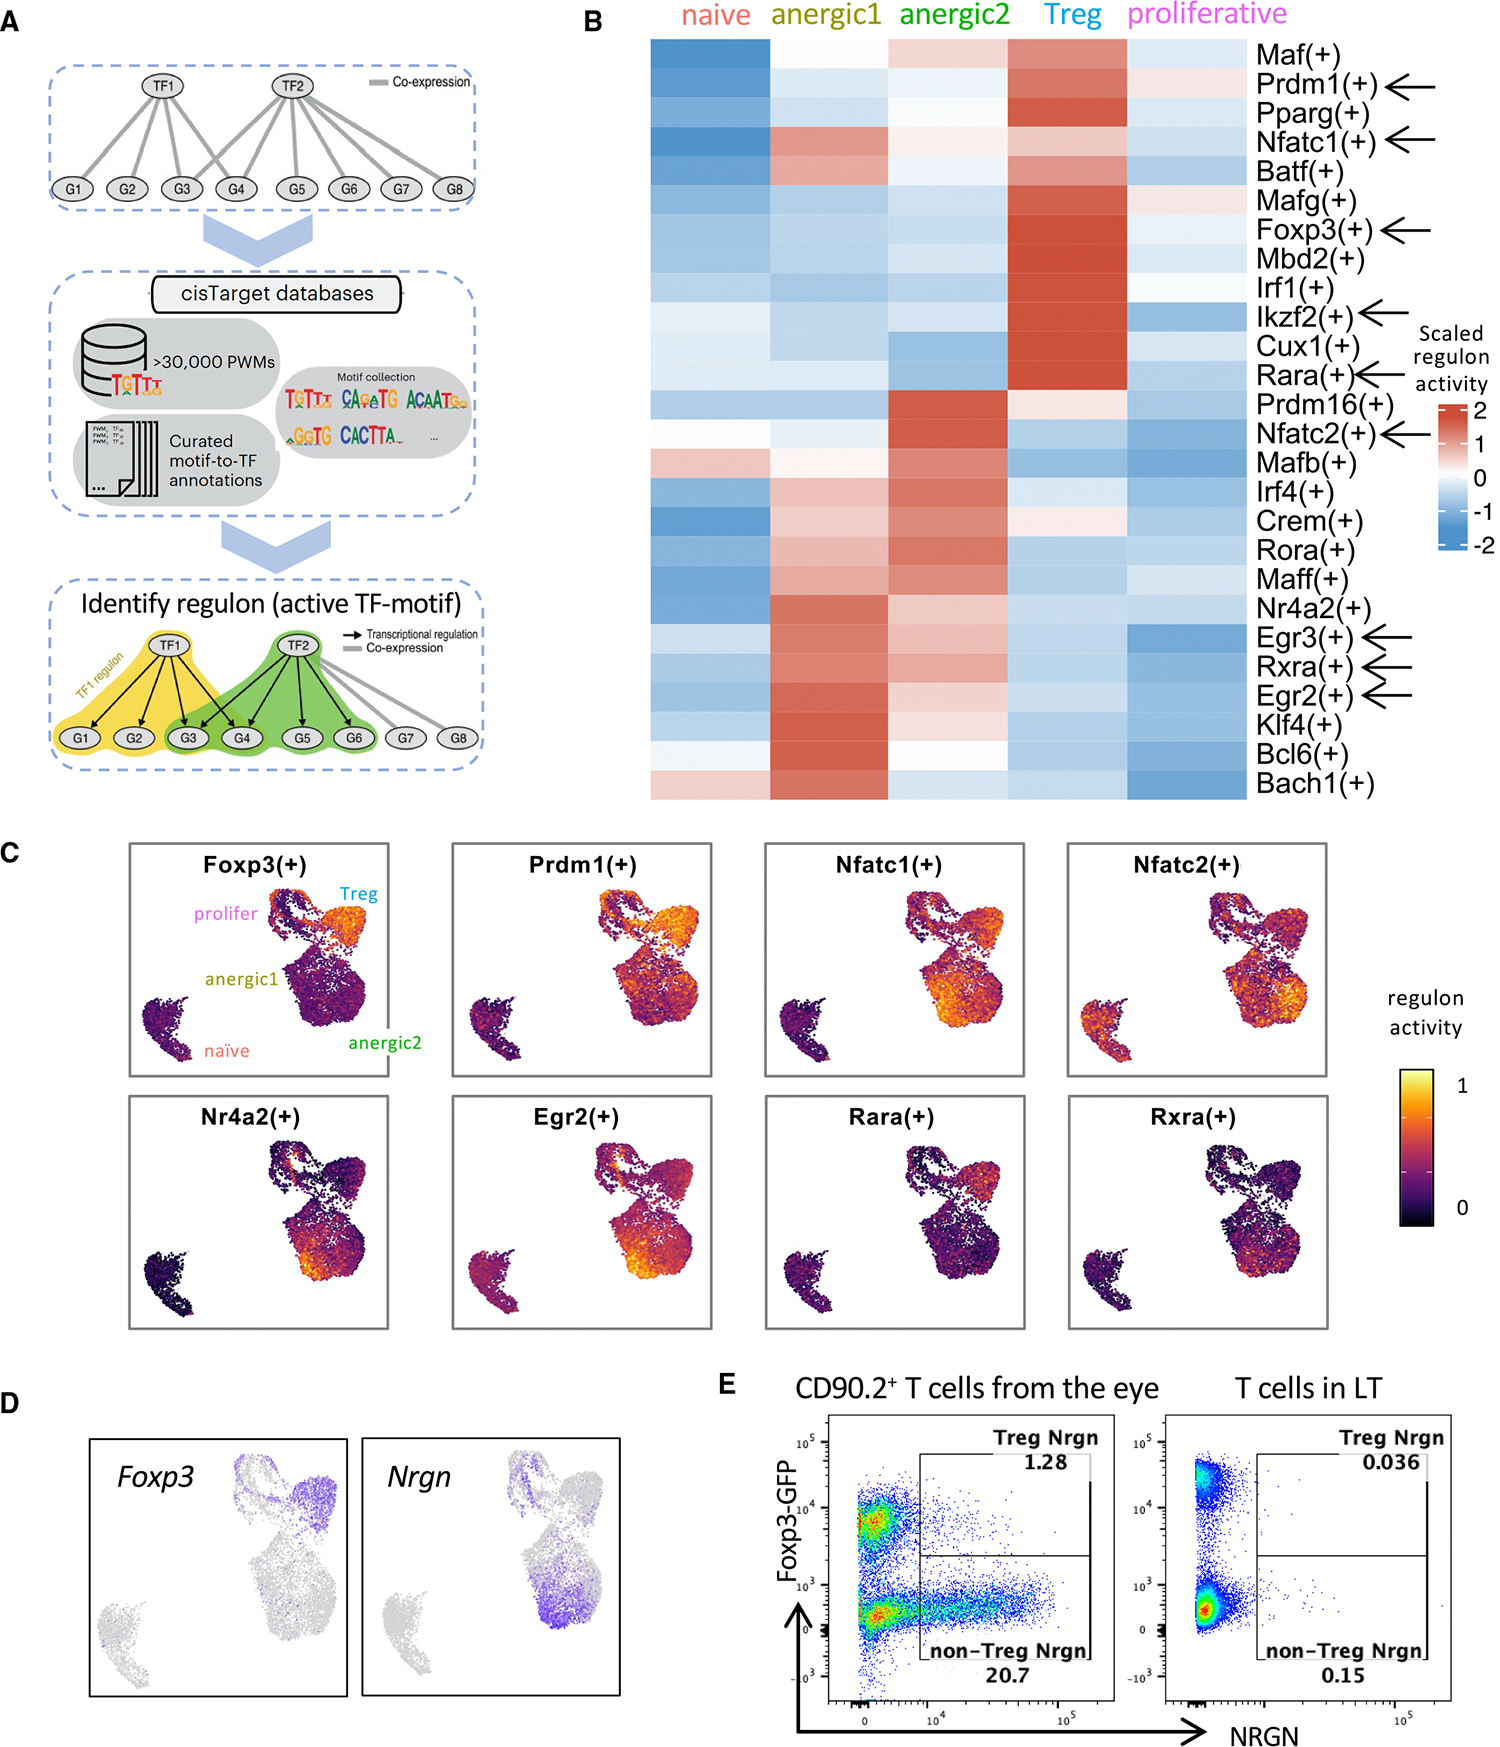
(A) Workflow of regulon identification by single-cell regulatory network inference and clustering (SCENIC) analysis.
(B) Representative regulons enriched in eye-primed T cell subpopulations and naive T cells are marked with arrows in the heatmap. The full list can be found in Table S3.
(C) Visualization of the regulon activity overlaid on the UMAP.
(D and E) Reciprocal expression of Foxp3 and Nrgn in Treg and non-Treg (anergic) clusters by RNA (D) and protein (E).
Each of the anergic T clusters exhibited enrichment of distinct regulon activity. However, both clusters showed enrichment of regulons Egr2, Egr3,49 Nr4a2, and Klf460 (Figure 6B). These TFs have been implicated in attenuating pathogenic T cell responses.37 Egr-2 in particular is considered a master TF of anergy that directly upregulates CBL-B, DGKζ, and other anergy-associated genes.35,49,61
In the Treg cluster, Foxp3 and its “accessory” TFs Prdm1 (encoding Blimp1), Ikzf2 (Helios), and Mbd2 (Mbd2), which are known to promote and stabilize Treg function,62–65 exhibited increased regulon activities62 (Figure 6B). Enrichment of those Foxp3 accessory regulons is compatible with the high suppressive function of the eye-induced Tregs that we observed (Figure 4D). A total of 255 regulons were identified as active within our dataset (Table S3). Of note, regulons corresponding to T-bet and RORγt were not enriched, confirming that eye-primed populations did not appear to be Th1 or Th17 effectors.
The regulons active in both anergic and Treg clusters were Nfatc1 and Nfatc2 (Figure 6C), which aligns with the known tolerogenic role of the NFAT family in both anergic cells and Tregs. In the former, they cooperate with NR4A and EGR2/3 to repress effector cytokines (IFN-γ, granulocyte-macrophage colony-stimulating factor) and to induce inhibitory regulators CTLA-4, PD-1, LAG3, CBL-B, and DGKζ61,66;in the latter, NFAT-Foxp3 interaction upregulates Treg markers CTLA-4 and CD25, contributing to suppressor function.57,67 Moreover, we noticed the presence of regulons for the nuclear receptors for RA, Rara and Rxra. Of note, Rara regulon was highly activated in Tregs, whereas Rxra regulon was preferentially activated in anergic cells (Figures 6B and 6C), suggesting that although RA regulates both Tregs and anergic cells, they rely on different receptors for RA-mediated functions.
RARA is associated with Foxp3+ Treg development68; however, since the anergic cluster lacks Foxp3, we looked for molecules downstream of the RXRA receptor. One gene known to be downstream of Rxra, Nrgn,69 was among the most highly expressed genes in the anergic clusters (Figures 3A and 6D) and the top gene in the anergic1 cluster. Notably, its expression closely matched the distribution of Rxra regulon activity (Figures 6C and 6D) and was mutually exclusive with Foxp3 expression (Figure 6D). Control LT CD4+ cells, whether Foxp3+ or Foxp3−, lacked neurogranin (encoded by Nrgn) expression (Figure 6E). Nrgn has normally been associated with neurons70; here, we demonstrate high expression of Nrgn as well as its protein product, neurogranin, restricted to the eye-derived Foxp3− (i.e., anergic cells).
Eye-induced Tregs and anergic cells seem to differentiate in parallel rather than sequentially
An important question in understanding the development of Treg and anergic cell fates is whether they differentiate as separate lineages or whether one derives from the other. To address this question, we performed trajectory analyses using RNA velocity71,72 and Monocle pseudotime trajectory analyses.73
RNA velocity can infer the direction of cellular state changes and estimate the future state based on the relative abundance of spliced and un-spliced transcripts.71 After excluding the naive population and reclustering the eye-primed cells, we projected the RNA velocity vectors onto a new UMAP (Figure 7A). The trajectories originated from the proliferative cell cluster and diverged in distinct directions. The Treg and anergic1 cluster appeared to be independent fates, with the arrows pointing in opposite directions, while a part of the anergic2 population appeared to transition toward the anergic1 stage (Figure 7A). Based on the estimated latent time by the scVelo algorithm,72 which reflects the internal clock of a cell (Figure 7B), the anergic2 cluster seems to represent a less differentiated state with lower latent time, whereas the Treg and anergic1 populations may be more terminally differentiated.
Figure 7. Trajectory analyses indicate parallel differentiation of Treg and anergic populations from an initial proliferative precursor.

(A and B) RNA velocity analysis. Eye-primed cells were extracted and re-clustered for a new UMAP. (A) RNA velocity (arrowheads) projected onto this UMAP reflect the direction of cell state transitions. (B) The latent time is the calculated progression from the origin (proliferative cluster) to the end states (anergic1 and Treg), represented by color code.
(C–F) Monocle pseudotime analysis. Monocle analysis ordered the cells along the pseudotime trajectories, displaying a branched pattern of two paths. (C) Color represents each cluster. (D) Color represents pseudotime, from the initial phase (0) to the late stage (1). (E) Heatmap showing the bifurcation of gene expression dynamics along pseudotime. See also Table S4. (F) Kinetic patterns of specific canonical genes of the two paths. Color-coded by cluster.
As a complementary approach, we reconstructed the trajectories using the Monocle algorithm.73 The inferred state of cell transition revealed the emergence of two branches, arising from the common proliferative population and bifurcating at the branchpoint (Figure 7C). Notably, one path was populated mainly by anergic1 cells, and the other path was dominantly occupied by the Tregs. The distribution of anergic2 cells in both branches may point to the plasticity of this cluster (Figure 7C). The branched pseudotime results supported the fact that the anergic1 and Treg clusters had reached their final stages (Figure 7D).
Figure 7E and Table S4 depict the genes undergoing the most pronounced dynamic changes when progressing along each of the two branched paths. Resting/quiescent state markers (Ccr7, Il7r, Tcf7) and anergy-associated genes (Nfatc1/3, Nr4a2/3, Tox, Tox2, Cblb) were progressively upregulated along the anergic path (Figure 7E), suggesting that these cells gradually lost their effector potential. Conversely, higher levels of canonical Treg-associated genes (Foxp3, Il10, Ikzf2, Prdm1) along the Treg path were consistent with progressive differentiation of Tregs (Figure 7E). Furthermore, while representative anergy-associated genes, such as Tcf7, Nr4a3, and Tox2, progressively increased in the anergic path, they progressively decreased in the Treg path (Figure 7F), recapitulating the dynamic acquisition of the respective phenotypes.
In summary, the trajectory analysis reveals a branched pattern in which naive T cells primed within the eye differentiate largely in parallel, rather than in tandem, into Tregs and anergic T cells from a common proliferative precursor.
DISCUSSION
We provide the first study that resolves at the single-cell level how the living eye actively “disarms” the pathogenic potential of retina-specific T cells in vivo. Within the eye, incoming T cells encounter high levels of TGF-β (mainly the TGF-β2 isoform).74 RA is also abundant in the eye, owing to its function in the visual cycle. This creates a unique environment that has a central role in ocular immune privilege.21 Outside the eye, RA is made by CD103+ dendritic cells (DCs) in the gut, where it enhances Treg differentiation and may contribute to food tolerance.75 Within the eye, in addition to the Foxp3+ Treg fate adopted by a minority of the naive T cells, we show that the remaining majority adopts a phenotype consistent with anergy. This finding fills a major gap in understanding that was left by our previous data,21 which revealed a dampened expression of effector cytokines and TFs at the population level, but could not distinguish effectors being kept in check by Foxp3+ Tregs from an alternative cell fate(s), nor could it resolve possible subset(s). Our current data dissect this in detail at the molecular level and resolve the cell fates and their differentiation trajectory.
Anergy vs. regulation: Unique gene expression in ocular tolerance
The induction of anergic T cells in the living eye is a novel and little-explored aspect of ocular immune privilege. As mentioned in the introduction, previous concepts of ocular immune privilege were based largely on in vitro studies with isolated cell populations or ocular fluids, and most of those studies dealt with the induction of Tregs.3,4,9 Although one study suggested that the interaction of T cells with RPE cells in vitro can result in anergy, for obvious reasons this does not reproduce the complexity of the actual intraocular environment.9 Moreover, the transcriptome of the affected T cells was not characterized. The present study identifies many anergy-associated genes (Ctla4, Lag3, Pdcd1, Cblb, Dgkz), as well as activated anergy-promoting TFs (NFAT, EGR2/3, NR4A, TOX families), that are shared with other models of T cell anergy.17,58,76 However, we also identify multiple genes whose expression pattern appears characteristic to eye-induced anergy. Prominent examples are as follows:
Nrgn (neurogranin), which was in our hands restricted to the anergic T cell population, as was Egr-2, a known Nrgn inducer.33 Nrgn is constitutively expressed in neuronal cells, where it regulates synaptic plasticity.70 While a few studies reported Nrgn mRNA in lymphocytes,26,33,34 its functional contribution remains to be unraveled. The role of Nrgn is to modulate intracellular Ca2+ levels through its interaction with calmodulin.77 Specifically, Nrgn sequesters calmodulin by physically binding to it, and makes it unavailable for binding with Ca2+. RA promotes Nrgn gene expression by upregulating RA receptors, particularly RXR, which binds to the RA response elements in the Nrgn promoter.69,78 Nrgn in turn binds to and sequesters calmodulin, lowering available free calcium.77 We hypothesize that as this process occurs in the T cells that are undergoing differentiation in the eye, RA-driven RAR/RXR upregulation increases Nrgn, sequestering calmodulin and reducing intracellular calcium and inhibiting calcineurin and NFAT.56,79 Because Treg differentiation and functional activation requires high Ca2+ levels,56 these conditions should skew the balance of Tregs and anergic T cells toward anergy. We propose that Nrgn, by regulating intracellular Ca2+ availability, acts as a key checkpoint in the choice of anergic vs. regulatory cell fate by newly primed T cells differentiating from a common precursor in the TGF-β and RA-rich ocular environment. The validation of this central hypothesis in the regulation of ocular immune privilege and T cell anergy is the subject of a separate ongoing study.
Although anergic T cells are generally thought to lack cytokine expression, the ocular anergic cells expressed a high level of Tgfb1. Tgfb1 was also expressed by ocular Tregs, and about 40% of both populations expressed the TGF-β protein. To our knowledge, Tgfb1 expression had not been previously reported in any model of anergic T cells, and it may be a distinguishing feature of eye-induced anergy. Nevertheless, judging by the functional data, its expression did not confer regulatory function on the ocular anergic T cells.
An anergy-associated gene that was not significantly expressed in ocular anergic T cells is Izumo1r (encoding FR4), which, together with the expression of Nt5e (encoding CD73) and absence of Foxp3, is considered a defining phenotype of anergic T cells, but its function in anergy has not been elucidated. Our data suggest that it may not have a functional role in eye-induced anergy or that its role is redundant with that of a DEG(s) in eye-derived vs. other anergic cells, such as Dgkz, Cblb, Rgs1, Maf, Lgals7, and Furin.58
Eye-induced anergic state differs from exhaustion
Although T cell anergy and exhaustion share many transcriptional features, the development of the eye-induced anergic T cells is inconsistent with exhaustion for several reasons. Exhaustion occurs in environments with strong antigenic stimulation and efficient Ag presentation.80 The healthy eye has few and quiescent professional APCs.81–83 Inefficient Ag presentation is conducive to T cell anergy induction rather than exhaustion. In addition, exhaustion typically requires chronic Ag stimulation and follows full activation for effector function, whereas the cells here were analyzed after only 1 week of Ag exposure, and the retina had minimal pathology.21 Finally, many exhaustion-associated genes, such as Tigit, Havcr2, Shp1–2, Ptpn2, Blimp1, and Irf439,80 were undetectable or minimally expressed in eye-induced anergic cells.
Effector Treg characteristics define the ocular Treg population
The gene expression profile of eye-induced Tregs (Il10, Tgfb1, Ctla4, Lag3, and Nt5e) is consistent with a highly suppressive “effector Treg” phenotype.42–45 This was confirmed functionally by comparison with Tregs from spleen and lymph node tissues of the same animals (note that all T cells are IRBP specific). Regulon analysis also revealed that many “Foxp3 accessory TFs,” such as Blimp1, Helios, and Mbd2, are activated. These TFs help maintain Treg stability,62–65 suggesting that Tregs differentiated within the eye may have a stable phenotype. Of interest, eye-induced Tregs also displayed some Th1-like genes, as indicated by higher levels of Tbx21, Cxcr3, and Ccr5 compared to non-Foxp3 anergic cells, whereas the anergic2 population shared the lineage-specific marker Il17a with the Th17 effector phenotype. Expression of lineage-specific genes shared with Th1 and Th17 effector cells by Tregs is thought to facilitate interaction with the target effector population(s).84–86 Uveitogenic effector T cells are a mixture of Th1 and Th17.87 It is therefore tempting to speculate that the ocular microenvironment diverts would-be Th17 effectors to anergy, whereas would-be Th1 effectors are diverted to Foxp3+ Treg fate. Investigation of this hypothesis and of the unique eye-induced Treg phenotype is part of a separate ongoing study.
Limitations of the study
While the in vivo model of immune privilege is a powerful tool to dissect eye-specific control of immune cell differentiation, the system also has limitations, both objective and subjective. The level of complexity of an in vivo system precludes analysis of the individual contributions of the array of signals from multiple components, which integrate to produce the final phenotypic and molecular events. In part, this could be addressed by including various ocular resident cells in the analysis. Additionally, RNA-seq performed at multiple time points could provide further insight into the kinetics of the differentiation process that could have strengthened our conclusions from the trajectory analysis. However, technical and logistic aspects inherent to this experimental model precluded addressing this more comprehensively in the present study.
Conclusion
Our findings shed new light on the concepts of ocular immune privilege and the molecular mechanisms that actively maintain immunological homeostasis. The results lead to a model in which the ocular environment limits pathology by instructing the conversion of conventional T cells to Tregs or to an alternative fate of T cell anergy, rather than a scenario where a population of Tregs keeps a population of T effector cells in check. The identification of unique eye-induced regulatory and anergic signatures offers a valuable foundation for future research and may suggest therapeutic strategies for ocular inflammatory diseases. Furthermore, these signatures may inform approaches to reversing undesirable T cell unresponsiveness in contexts such as cancer, vaccination, and chronic infection.
RESOURCE AVAILABILITY
Lead contact
Further information and requests for resources and reagents should be directed to and will be fulfilled by the lead contact, Rachel R. Caspi (caspir@nei.nih.gov).
Materials availability
This study did not generate new unique reagents.
Data and code availability
scRNA-seq data have been deposited at GEO under accession no. GSE281410 and are publicly available as of the date of publication.
This study did not develop any new codes. The code used for analysis can be found in GitHub https://github.com/NIH-NEI/Privilege_Treg_Anergy_scRNA and also in Zenodo https://doi.org/10.5281/zenodo.15053415.
Any additional information required to reanalyze the data reported in this paper is available from the lead contact upon request.
STAR★METHODS
EXPERIMENTAL MODEL AND STUDY PARTICIPANT DETAILS
Mice
Interphotoreceptor retinoid-binding protein (IRBP)-specific T cell receptor (TCR) transgenic (R161H), Tcra knockout mice (Tcra−/−) on the B10.RIII background were generated as previously described19,20 and were crossed to B10.RIII Foxp3GFP strain.24 Tcra−/− R161H Foxp3GFP reporter mice were used as donors for naive retina-specific T cells. CD90.1 congenic wildtype (WT) B10.RIII mice were used as recipients. Both male and female mice 6–10 weeks old were used in this study. All animals were maintained under specific-pathogen-free conditions at National Eye Institute (NEI) animal facility on standard chow and water ad libitum. All animal procedures were approved by the Animal Care and Use Committee (ACUC) of NEI/NIH.
METHOD DETAILS
Ocular immune privilege model
The ocular privilege model was established and described in our previous study,21 except that we used R161H TCR Tg Foxp3GFP reporter mice on Tcra−/− background as donor mice, rather than on the Rag2−/− background. TCR Tg T cells originating from Tcra−/−TCR Tg donors have the advantage that, unlike in a Rag2−/− donor, the transgenic T cells develop in a non-lymphopenic environment, and the donor mice are more robust and easier to breed. Briefly, retina-specific T cells, enriched from peripheral lymphoid tissues of Tcra−/− R161H Foxp3GFP donor mice using CD3+ T cell enrichment columns (R&D Systems) or CD4+ T cell isolation kit (Miltenyi Biotec), were FACS sorted to obtain the naive population depleted of preexisting Tregs (CD44low CD25− Foxp3GFP−). WT CD90.1-congenic recipient mice were injected intravitreally with 500,000 of these naive T cells in 1.5 μL PBS into each eye, using a 33G needle and Hamilton syringe. The cells were retrieved from donor eyes 7–8 days later and prepared for analysis, as described ahead.
Flow cytometry and cell sorting
Single-cell suspensions from spleens and lymph nodes (submandibular, axillary, inguinal, and mesenteric lymph nodes) collected from Tcra−/− R161H Foxp3GFP CD90.2 donor mice were used for isolation of retina-specific T cells. Cells were stained with surface antibodies and sorted for live CD4+ CD44low Foxp3GFP− CD25− Dump− cells to ~99% purity using FACSAria II and AriaIII/Fusion sorters (BD Biosciences). Non-CD4 markers (CD8, NK1.1, B220, CD11b, DX5, and Gr1) were used for the dump channel. To retrieve retina-specific T cells from the eyes of CD90.1 congenic recipients, eyes were minced and treated with 1 mg/mL collagenase D for 30 min at 37°C. Donor-derived retina-specific T cells were sorted as live CD4+ CD90.2+ CD90.1− cells. Propidium Iodide or 7-AAD (for sorting) and ViaKrome 808 (for flow analysis on CytoFlex LX, Beckman Coulter) were used to exclude dead cells. For intracellular staining of cytokine, cells were stimulated with PMA (10 ng/mL) and ionomycin (500 ng/mL) in the presence of brefeldin A (GolgiPlug; BD) for 4 h, following staining for surface marker and live/dead cells. Cells were then fixed with 4% paraformaldehyde for 30 min and stained for intracellular proteins in 1x BD perm/wash buffer for 1 h. For Nrgn staining, cells were stained with surface maker antibodies and then fixed with 4% paraformaldehyde, followed by permeabilization and staining with Nrgn antibody at 4°C for 30 min, and AF-647 conjugated anti-Rabbit secondary antibody for 20 min. Antibodies used for cell sorting and flow cytometry analysis were from BD Biosciences, BioLegend, and eBioscience/ThermoFisher. Detailed antibody and clone information is listed in Table S1.
Sample processing and scRNA-seq
Fresh naive donor T cells, or donor cells retrieved from recipient mouse eyes one week after intravitreal injection, were collected for scRNA-seq. Donor T cells in the eyes retrieved from each of the four recipient mice were individually labeled with anti-mouse TotalSeqB hashtags (BioLegend, Table S1). Individual samples were incubated with unique hashtags and sorting antibodies before FACS sorting, per manufacturer’s protocol. The viability of sorted cells was greater than 90%. Sorted single-cell suspensions were adjusted to 700–1200 cells/μl before loading the 10X chromium chip. Samples were processed with the Chromium Next GEM Single Cell 3′ reagent kit in the Chromium X platform following the standard protocol for 3′ Gene Expression assay (10X genomics). The gene expression and cell surface libraries were sequenced on NovaSeq 6000 platform (Illumina).
Quality control and clustering of scRNA-seq data
Sequencing reads were demultiplexed and aligned using CellRanger (7.1.0) with the default parameters. The output matrix files were converted into a Seurat object for quality control and clustering. Standard scRNA-seq analysis (quality control, clustering, and marker gene detection) was performed using Seurat (v4.3.0).25 Cells were excluded from analysis if they met any one of the following criteria: transcript counts less than 1000 or more than 40000, fewer than 400 genes, more than 8% mitochondrial fraction, ribosomal fraction less than 10% or more than 45%. Highly variable features between individual cells were identified, and linear dimensional reduction was performed using principal component analysis (PCA). Unsupervised clusters were determined using the ‘FindNeighbors’ and ‘FindClusters’ functions based on the first 20 principal components (PCs). The clustering result was visualized using 2D uniform manifold approximation and projection (UMAP). Clustering was done at 0.2 resolution to keep the naive T cells as one “homogeneous” cluster. The ‘FindAllMarkers’ function was used to identify marker genes of each cluster within the dataset.
Signature identification and GSEA analysis
To characterize the phenotypes of donor T cells retrieved from recipient eyes, we defined their gene-expression signatures and performed Gene Set Enrichment Analysis (GSEA). The gene signatures were defined by comparing each cluster with the naive cluster using the ‘FindMarkers’ function. Genes were considered differentially expressed using the default Wilcoxon Rank-Sum test and log fold-change (FC) threshold (Table S2). The full list of differentially expressed genes (DEGs) was ranked based on log FC and then mapped to the Molecular Signature Database (MSigDB) via GSEA software (v4.3.2).46
Antigen-specific proliferation assay
Ocular immune privilege model was conducted as described above, after one week, Foxp3GFP+ or Foxp3GFP− CD4+ CD90.2+ CD90.1− cells were sorted out from the recipients’ eyes (50,000 cells/well) and co-cultured with human IRBP161–180 peptide (50 ng/mL) and CD11c+ dendritic cells (at a 1:5 ratio to T cells), with or without 100 IU/mL recombinant human IL-2. Dendritic cells were obtained by digesting spleens from WT CD90.1 mice in spleen dissociation medium (Stem Cell) for 30 min, followed by ammonium-chloride-potassium (ACK) lysis and CD11c+ enrichment using Micro Beads (Miltenyi Biotec). Sorted naive T cells (CD44low CD25− Foxp3GFP− CD4+) and Treg cells (Foxp3GFP+ CD4+) from spleens and lymph nodes of Tcra−/− R161H Foxp3GFP CD90.2 mice were used as positive and negative controls, separately. Cell proliferation was determined using [3H]-Thymidine incorporation by adding 1mCi/well after a 48-h culture and further incubated for 16 h. Samples were harvested and counted using liquid scintillation (PerkinElmer, MA). Unpaired Student t-tests were performed for statistics.
Antigen-specific Treg suppression assays
Sorted Foxp3GFP+ or Foxp3GFP− CD4+ CD90.2+ CD90.1− cells from recipients’ eyes were co-cultured with naive retina-specific T cells (serve as T responder cells, Tresp; 50,000 cells/well) and CD11c+ dendritic cells (at a 1:5 ratio to Tresp). Treg cells (Foxp3GFP+ CD4+) from spleens and lymph nodes of Tcra−/− R161H Foxp3GFP CD90.2 mice were used as positive control of suppressor. Varying numbers of putative suppressor T cell populations were sorted and added to the cultures at the indicated Treg:Tresp ratios. Cell co-cultures were stimulated with 50 ng/ml human IRBP161–180 without adding IL-2. The inhibitory effect was assessed using either [3H]-Thymidine incorporation or proliferation dye dilution independently. For the dye dilution method, naive T cells were labeled with proliferation dye - CellTracker DeepRed or CellTrace FarRed (Invitrogen/ThermoFisher Scientific) before setting up the culture. After 3 days, cells were stained for FACS analysis, and cell division of Tresp was quantified using FlowJo (10.8.0). Unpaired Student t-tests were performed for statistics.
Ingenuity Pathway Analysis
Pathway analysis was performed using Ingenuity Pathway Analysis (IPA, www.qiagen.com/ingenuity). DEGs of each eye-primed cluster with corresponding log FC and adjusted p values were imported into IPA software for deciphering upregulated or downregulated functional pathways based on ingenuity knowledge base. After performing ‘core analysis’ of each T cell cluster independently, visualization across different clusters was achieved by ‘comparison analysis’ function. IPA’s Z score indicates a predicted activation or inhibition of a pathway, where a positive z value denotes an overall pathway’s activation and vice versa.
The transcriptional factor activity (regulon) analysis
The python implementation of SCENIC (single-cell regulatory network inference and clustering, pySCENIC, v0.12.1)59 was used to predict the active transcriptional factor (TF). Starting from the normalized matrix data, the pySCENIC workflow consists of three stages. Initially, co-expression modules were inferred using a regression per-target approach. Then, the regulons (TF-target gene motifs) were refined from these modules based on cisTarget databases. Lastly, the ‘aucell’ algorithm was utilized to quantify the regulon activity score and find the significantly enriched regulon independently for each cell with default parameters. The statistically significant regulons identified by SCENIC analysis were considered as active TFs, which reflected the upstream transcriptional drivers of the observed cellular identities.59 Regulon activity score was then scaled to plot heatmap or projected onto the UMAP. Information on software tools, cisTarget databases, and the full list of enriched Regulons can be found in Table S3.
RNA velocity analysis
Velocyto71 and scVelo72 packages were used to perform RNA velocity analysis. First, RNA velocity (comprising spliced/un-spliced counts) for each cell was computed using the matrices generated by CellRanger and stored in the loom format. The velocity vectors were integrated into the Seurat object as a new data file. From the following file, we extracted the cells retrieved from recipient eyes and re-plotted the UMAP. The ‘latent time’ and ‘latent time facilitated RNA velocity’ were estimated using the likelihood-based dynamical model in scVelo. The velocity graph was visualized as streamlines overlaid by embedding in UMAP.
Pseudotime analysis
Monocle (v2.26.0)73 was applied to determine the potential lineage differentiation trajectory, keeping the default parameters. The matrix data of eye-primed clusters were imported as input for creating the Monocle ‘CellDataSet’. The ‘DDRTree’ method was utilized for dimensionality reduction and cell ordering along the pseudotime trajectory. To identify the genes that separate cells into branches, we performed the Branch Expression Analysis Modeling (BEAM) approach in Monocle 2. The dynamic expression of genes was visualized by the ‘plot_genes_branched_heatmap’ or ‘plot_genes_branched_pseudotime’ function. See also Table S4.
QUANTIFICATION AND STATISTICAL ANALYSIS
Quantitative data in the Figures 4B and 4D were assembled and analyzed using GraphPad Prism 10. Results are presented as mean ± standard error of the mean (SEM). Statistical comparisons between two conditions were performed using unpaired Student’s t-test. Statistical significance was defined by p-value, and p > 0.05 was considered as not significant (n.s.). Statistical analysis of scRNA-seq data were performed using R, IPA software, and GSEA software with default settings, as detailed in the corresponding methods. The number of biological replicates or independent experiments is indicated in the respective figure legends.
Supplementary Material
SUPPLEMENTAL INFORMATION
Supplemental information can be found online at https://doi.org/10.1016/j.celrep.2025.115780.
KEY RESOURCES TABLE.
| REAGENT or RESOURCE | SOURCE | IDENTIFIER |
|---|---|---|
|
| ||
| Antibodies | ||
|
| ||
| Anti-mouse CD44 | BD Biosciences | RRID: AB_2738395 |
| Anti-mouse CD25 (IL2R) | BD Biosciences | RRID: AB_398623 |
| Anti-mouse CD90.1 | BioLegend | RRID: AB_1595470 |
| Anti-mouse CD90.2 | BioLegend | RRID: AB_2894662 |
| Anti-mouse CD4 | BioLegend | RRID: AB_2564587 |
| Anti-mouse CD8a | BioLegend | RRID: AB_312751 |
| Anti-mouse NK1.1 | BD Biosciences | RRID: AB_398463 |
| Anti-mouse CD45R (B220) | BD Biosciences | RRID: AB_398531 |
| Anti-mouse CD11b | BioLegend | RRID: AB_312795 |
| Anti-mouse CD49b (DX5) | BD Biosciences | RRID: AB_398658 |
| Anti-mouse Gr1 (Ly6C/Ly6G) | BioLegend | RRID: AB_313377 |
| Anti-mouse Neurogranin | Invitrogen/Thermofisher | RRID: AB_2720119 |
| Anti-mouse IL-10 | BioLegend | RRID: AB_2566329 |
| Anti-mouse LAP-1 | BD Biosciences | RRID: AB_2739315 |
| Goat anti-Rabbit Antibody AF-647 | Invitrogen/Thermofisher | RRID: AB_2535812 |
| Fc Block | BD Biosciences | RRID: AB_394656 |
| Trustain FcX PLUS (anti-mouse CD16/32) | BioLegend | RRID: AB_2783137 |
| TotalSeq™-B anti-mouse Hashtag (#1 – #4) antibodies | BioLegend | RRID: AB_2814067, AB_2814068, AB_2814069, and AB_2814070 |
|
| ||
| Chemicals, peptides, and recombinant proteins | ||
|
| ||
| Mouse CD3+ T cell enrichment columns | R&D Systems | MTCC-10 |
| CD4+ T cell isolation kit | Miltenyi Biotec | 130-104-454 |
| CD11c+ enrichment using Micro Beads | Miltenyi Biotec | 130-125-835 |
| MS Columns | Miltenyi Biotec | 130-042-201 |
| LS Columns | Miltenyi Biotec | 130-042-401 |
| Human IL-2 (Proleukin) | Novartis | BT-002-100 |
| Collagenase D | Roche | 45-11088866001 |
| Propidium Iodide | Millipore Sigma | 25535-16-4 |
| 7-AAD | eBioscience/Thermofisher | 00-6993-50 |
| ViaKrome 808 | Beckman Coulter | C36628 |
| IRBP161–180 peptide (SGIPYIISYLHPGNTILHVD) | Bio Basic Inc. | Custom synthesis |
| 3H Thymidine | Perkin Elmer Health Sciences, Inc | NET027A005MC |
| CellTracker Deep Red | ThermoFisher Scientific | C34565 |
| CellTrace FarRed | ThermoFisher Scientific | C34564 |
| SPRIselect Reagent kit | Beckman Coulter | B23318 |
|
| ||
| Critical commercial assays | ||
|
| ||
| Chromium Next GEM Single Cell 3′ Reagent kit v3.1 | 10X Genomics | PN-1000121 |
| Chromium Single Cell 3′ Feature Barcode Library kit | 10X Genomics | PN-1000079 |
| Chromium Next GEM Chip G Single Cell Kit | 10X Genomics | PN-1000127 |
| Single Index Kit T Set A | 10X Genomics | PN-1000213 |
|
| ||
| Deposited data | ||
|
| ||
| Raw and analyzed data | This paper and Gene Expression Omnibus | GEO: GSE281410 |
| R code for analysis | Submitted to Github and Zendo | https://github.com/NIH-NEI/Privilege_Treg_Anergy_scRNA and https://doi.org/10.5281/zenodo.15053415 |
|
| ||
| Experimental models: Organisms/strains | ||
|
| ||
| Tora−/− R161H Foxp3GFP CD90.2 mice | This paper | N/A |
| CD90.1 congenic B10.RIII mice | In house bred | N/A |
|
| ||
| Software and algorithms | ||
|
| ||
| Cell Ranger (7.1.0) | 10X Genomics | https://www.10xgenomics.com/support/software/cell-ranger/latest |
| Seurat R package (v4.3.0) | https://doi.org/10.1016/j.cell.2021.04.048 | https://satijalab.org/seurat/ |
| R package | R development core team | http://www.R-project.org |
| Gene Set Enrichment Analysis (GSEA) (v4.3.2) | https://doi.org/10.1073/pnas.0506580102 | https://www.gsea-msigdb.org/gsea/index.jsp |
| Molecular Signature Database (MSigDB) | https://doi.org/10.1016/j.cels.2015.12.004 | https://www.gsea-msigdb.org/gsea/msigdb |
| pySCENIC vO.12.1 | https://doi.org/10.1038/s41596-020-0336-2 | https://pypi.org/project/pyscenic/ |
| Velocyto | https://doi.org/10.1038/s41586-018-0414-6 | http://velocyto.org |
| scVelo | https://doi.org/10.1038/s41587-020-0591-3 | https://scvelo.org |
| Monocle V2.26.0 (R package) | https://doi.org/10.1038/nmeth.4150 | https://www.bioconductor.org/packages/release/bioc/html/monocle.html |
| Flowjo 10 | BD Bioscience | https://www.flowjo.com/solutions/flowjo/downloads |
| GraphPad prism 10 | GraphPad by Dotmatics | https://www.graphpad.com/resources |
| Ingenuity Pathway Analysis | Qiagen | www.qiagen.com/ingenuity |
| Python 3 | Python.org | https://www.python.org/download/releases/3.0/ |
|
| ||
| Other | ||
|
| ||
| Hamilton Syringe 62RN | Hamilton company | 7632–01 |
| 33G Hamilton Needle (0.375″ Point style 4, 60° bevel angle) | Hamilton company | 7803–05 Custom modified |
| FACS Aria II | BD Bioscience | N/A |
| FACS Aria III/FUSION | BD Bioscience | N/A |
| CytoFlex LX | Beckman Coulter | N/A |
| Chromium X | 10X Genomics | 1000331 |
| NovaSeq 6000 | Illumina | N/A |
| Scintillation counter | Perkin Elmer | N/A |
Highlights.
Eye-primed retina-specific T cells develop distinct tolerance-associated phenotypes
Regulatory and anergic T cells differentiate in parallel from a common precursor
Eye-induced anergic T cells remain hyporesponsive to antigen re-stimulation
Induction of T cell anergy is a previously unappreciated feature of ocular immune privilege
ACKNOWLEDGMENTS
The authors sincerely thank the National Eye Institute (NEI) and National Heart, Lung, and Blood Institute Flow Cytometry Core facilities for assistance in conducting cell sorting, the NEI Genetic Engineering Core Facility for the generation of R161H TCR transgenic mice and genotyping service, and the National Cancer Institute CCR Genomics Core facility for sequencing. This study utilized the high-performance computational capabilities of the Biowulf Linux cluster at the NIH. We gratefully acknowledge the NIH Fellows Editorial Board for their valuable assistance in editing the manuscript for language and clarity. We thank Dr. Guangpu Shi (NEI Laboratory of Immunology) for his comments and Dr. Han-Yu Shih for critically reviewing the manuscript. We are grateful to Drs. Nilisha Fernando and Jaanam Gopalakrishnan (NEI Neuro-Immune Regulome Unit) for their assistance with scRNA-seq sample preparation. We would also like to express our gratitude to all the members of the Caspi lab for their support and contributions. This study was supported by NEI/NIH intramural funding (project no. EY000184).
Footnotes
DECLARATION OF INTERESTS
The authors declare no competing interests.
REFERENCES
- 1.Stein-Streilein J, and Caspi RR (2014). Immune privilege and the philosophy of immunology. Front. Immunol. 5, 110. 10.3389/fimmu.2014.00110. [DOI] [PMC free article] [PubMed] [Google Scholar]
- 2.Taylor AW, and Ng TF (2018). Negative regulators that mediate ocular immune privilege. J. Leukoc. Biol. 103, 1179–1187. 10.1002/Jlb.3mir0817-337r. [DOI] [PMC free article] [PubMed] [Google Scholar]
- 3.Mochizuki M, Sugita S, and Kamoi K (2013). Immunological homeostasis of the eye. Prog. Retin. Eye Res. 33, 10–27. 10.1016/j.preteyeres.2012.10.002. [DOI] [PubMed] [Google Scholar]
- 4.Gery I, and Caspi RR (2018). Tolerance Induction in Relation to the Eye. Front. Immunol. 9, 2304. 10.3389/fimmu.2018.02304. [DOI] [PMC free article] [PubMed] [Google Scholar]
- 5.Keino H, Horie S, and Sugita S (2018). Immune Privilege and Eye-Derived T-Regulatory Cells. J. Immunol. Res. 2018, 1679197. 10.1155/2018/1679197. [DOI] [PMC free article] [PubMed] [Google Scholar]
- 6.Taylor AW, Alard P, Yee DG, and Streilein JW (2007). Aqueous humor induces transforming growth factor-beta (TGF-beta)-producing regulatory T-cells. 1997. Ocul. Immunol. Inflamm. 15, 215–224. 10.1080/09273940701382234. [DOI] [PubMed] [Google Scholar]
- 7.Zhou R, Horai R, Mattapallil MJ, and Caspi RR (2011). A new look at immune privilege of the eye: dual role for the vision-related molecule retinoic acid. J. Immunol. 187, 4170–4177. 10.4049/jimmunol.1101634. [DOI] [PMC free article] [PubMed] [Google Scholar]
- 8.Caspi RR, Roberge FG, and Nussenblatt RB (1987). Organ-resident, nonlymphoid cells suppress proliferation of autoimmune T-helper lymphocytes. Science 237, 1029–1032. 10.1126/science.2956685. [DOI] [PubMed] [Google Scholar]
- 9.Gregerson DS, Heuss ND, Lew KL, McPherson SW, and Ferrington DA (2007). Interaction of retinal pigmented epithelial cells and CD4 T cells leads to T-cell anergy. Investig. Ophthalmol. Vis. Sci. 48, 4654–4663. 10.1167/iovs.07-0286. [DOI] [PubMed] [Google Scholar]
- 10.Usui Y, Okunuki Y, Hattori T, Kezuka T, Keino H, Ebihara N, Sugita S, Usui M, Goto H, and Takeuchi M (2008). Functional expression of B7H1 on retinal pigment epithelial cells. Exp. Eye Res. 86, 52–59. 10.1016/j.exer.2007.09.007. [DOI] [PubMed] [Google Scholar]
- 11.Sugita S, Usui Y, Horie S, Futagami Y, Aburatani H, Okazaki T, Honjo T, Takeuchi M, and Mochizuki M (2009). T-cell suppression by programmed cell death 1 ligand 1 on retinal pigment epithelium during inflammatory conditions. Investig. Ophthalmol. Vis. Sci. 50, 2862–2870. 10.1167/iovs.08-2846. [DOI] [PubMed] [Google Scholar]
- 12.Sugita S, Horie S, Nakamura O, Futagami Y, Takase H, Keino H, Aburatani H, Katunuma N, Ishidoh K, Yamamoto Y, and Mochizuki M (2008). Retinal pigment epithelium-derived CTLA-2alpha induces TGFbeta-producing T regulatory cells. J. Immunol. 181, 7525–7536. 10.4049/jimmunol.181.11.7525. [DOI] [PubMed] [Google Scholar]
- 13.Hsu SM, Mathew R, Taylor AW, and Stein-Streilein J (2014). Ex-vivo tolerogenic F4/80(+) antigen-presenting cells (APC) induce efferent CD8(+) regulatory T cell-dependent suppression of experimental autoimmune uveitis. Clin. Exp. Immunol. 176, 37–48. 10.1111/cei.12243. [DOI] [PMC free article] [PubMed] [Google Scholar]
- 14.Heuss ND, Lehmann U, Norbury CC, McPherson SW, and Gregerson DS (2012). Local activation of dendritic cells alters the pathogenesis of autoimmune disease in the retina. J. Immunol. 188, 1191–1200. 10.4049/jimmunol.1101621. [DOI] [PMC free article] [PubMed] [Google Scholar]
- 15.McPherson SW, Heuss ND, Pierson MJ, and Gregerson DS (2014). Retinal antigen-specific regulatory T cells protect against spontaneous and induced autoimmunity and require local dendritic cells. J. Neuroinflammation 11, 205. 10.1186/s12974-014-0205-4. [DOI] [PMC free article] [PubMed] [Google Scholar]
- 16.Reyes NJ, O’Koren EG, and Saban DR (2017). New insights into mononuclear phagocyte biology from the visual system. Nat. Rev. Immunol. 17, 322–332. 10.1038/nri.2017.13. [DOI] [PMC free article] [PubMed] [Google Scholar]
- 17.ElTanbouly MA, and Noelle RJ (2021). Rethinking peripheral T cell tolerance: checkpoints across a T cell’s journey. Nat. Rev. Immunol. 21, 257–267. 10.1038/s41577-020-00454-2. [DOI] [PubMed] [Google Scholar]
- 18.Garcia-Aparicio A, Garcia de Yebenes MJ, Oton T, and Munoz-Fernandez S (2021). Prevalence and Incidence of Uveitis: A Systematic Review and Meta-analysis. Ophthalmic Epidemiol. 28, 461–468. 10.1080/09286586.2021.1882506. [DOI] [PubMed] [Google Scholar]
- 19.Horai R, Silver PB, Chen J, Agarwal RK, Chong WP, Jittayasothorn Y, Mattapallil MJ, Nguyen S, Natarajan K, Villasmil R, et al. (2013). Breakdown of immune privilege and spontaneous autoimmunity in mice expressing a transgenic T cell receptor specific for a retinal autoantigen. J. Autoimmun. 44, 21–33. 10.1016/j.jaut.2013.06.003. [DOI] [PMC free article] [PubMed] [Google Scholar]
- 20.Horai R, Zárate-Bladés CR, Dillenburg-Pilla P, Chen J, Kielczewski JL, Silver PB, Jittayasothorn Y, Chan CC, Yamane H, Honda K, and Caspi RR (2015). Microbiota-Dependent Activation of an Autoreactive T Cell Receptor Provokes Autoimmunity in an Immunologically Privileged Site. Immunity 43, 343–353. 10.1016/j.immuni.2015.07.014. [DOI] [PMC free article] [PubMed] [Google Scholar]
- 21.Zhou R, Horai R, Silver PB, Mattapallil MJ, Zárate-Bladés CR, Chong WP, Chen J, Rigden RC, Villasmil R, and Caspi RR (2012). The living eye “disarms” uncommitted autoreactive T cells by converting them to Foxp3(+) regulatory cells following local antigen recognition. J. Immunol. 188, 1742–1750. 10.4049/jimmunol.1102415. [DOI] [PMC free article] [PubMed] [Google Scholar]
- 22.Rein DB, Wittenborn JS, Burke-Conte Z, Gulia R, Robalik T, Ehrlich JR, Lundeen EA, and Flaxman AD (2022). Prevalence of Age-Related Macular Degeneration in the US in 2019. JAMA Ophthalmol. 140, 1202–1208. 10.1001/jamaophthalmol.2022.4401. [DOI] [PMC free article] [PubMed] [Google Scholar]
- 23.Choovuthayakorn J, Worakriangkrai V, Patikulsila D, Watanachai N, Kunavisarut P, Chaikitmongkol V, Luewattananont D, and Tananuvat N (2020). Epidemiology of Eye Injuries Resulting in Hospitalization, a Referral Hospital-Based Study. Clin. Ophthalmol. 14, 1–6. 10.2147/OPTH.S234035. [DOI] [PMC free article] [PubMed] [Google Scholar]
- 24.Fontenot JD, Rasmussen JP, Gavin MA, and Rudensky AY (2005). A function for interleukin 2 in Foxp3-expressing regulatory T cells. Nat. Immunol. 6, 1142–1151. 10.1038/ni1263. [DOI] [PubMed] [Google Scholar]
- 25.Butler A, Hoffman P, Smibert P, Papalexi E, and Satija R (2018). Integrating single-cell transcriptomic data across different conditions, technologies, and species. Nat. Biotechnol. 36, 411–420. 10.1038/nbt.4096. [DOI] [PMC free article] [PubMed] [Google Scholar]
- 26.Kiner E, Willie E, Vijaykumar B, Chowdhary K, Schmutz H, Chandler J, Schnell A, Thakore PI, LeGros G, Mostafavi S, et al. (2021). Gut CD4(+) T cell phenotypes are a continuum molded by microbes, not by T(H) archetypes. Nat. Immunol. 22, 216–228. 10.1038/s41590-020-00836-7. [DOI] [PMC free article] [PubMed] [Google Scholar]
- 27.Lee Y, Awasthi A, Yosef N, Quintana FJ, Xiao S, Peters A, Wu C, Kleinewietfeld M, Kunder S, Hafler DA, et al. (2012). Induction and molecular signature of pathogenic TH17 cells. Nat. Immunol. 13, 991–999. 10.1038/ni.2416. [DOI] [PMC free article] [PubMed] [Google Scholar]
- 28.van der Veeken J, Campbell C, Pritykin Y, Schizas M, Verter J, Hu W, Wang ZM, Matheis F, Mucida D, Charbonnier LM, et al. (2022). Genetic tracing reveals transcription factor Foxp3-dependent and Foxp3-independent functionality of peripherally induced Treg cells. Immunity 55, 1173–1184.e7. 10.1016/j.immuni.2022.05.010. [DOI] [PMC free article] [PubMed] [Google Scholar]
- 29.Elyahu Y, Hekselman I, Eizenberg-Magar I, Berner O, Strominger I, Schiller M, Mittal K, Nemirovsky A, Eremenko E, Vital A, et al. (2019). Aging promotes reorganization of the CD4 T cell landscape toward extreme regulatory and effector phenotypes. Sci. Adv. 5, eaaw8330. 10.1126/sciadv.aaw8330. [DOI] [PMC free article] [PubMed] [Google Scholar]
- 30.Roncarolo MG, Gregori S, Bacchetta R, Battaglia M, and Gagliani N (2018). The Biology of T Regulatory Type 1 Cells and Their Therapeutic Application in Immune-Mediated Diseases. Immunity 49, 1004–1019. 10.1016/j.immuni.2018.12.001. [DOI] [PubMed] [Google Scholar]
- 31.Ochi H, Abraham M, Ishikawa H, Frenkel D, Yang K, Basso AS, Wu H, Chen ML, Gandhi R, Miller A, et al. (2006). Oral CD3-specific antibody suppresses autoimmune encephalomyelitis by inducing CD4+ CD25− LAP+ T cells. Nat. Med. 12, 627–635. 10.1038/nm1408. [DOI] [PubMed] [Google Scholar]
- 32.Branchett WJ, Saraiva M, and O’Garra A (2024). Regulation of inflammation by Interleukin-10 in the intestinal and respiratory mucosa. Curr. Opin. Immunol. 91, 102495. 10.1016/j.coi.2024.102495. [DOI] [PubMed] [Google Scholar]
- 33.Zheng Y, Zha Y, Spaapen RM, Mathew R, Barr K, Bendelac A, and Gajewski TF (2013). Egr2-dependent gene expression profiling and ChIP-Seq reveal novel biologic targets in T cell anergy. Mol. Immunol. 55, 283–291. 10.1016/j.molimm.2013.03.006. [DOI] [PMC free article] [PubMed] [Google Scholar]
- 34.Merrell KT, Benschop RJ, Gauld SB, Aviszus K, Decote-Ricardo D, Wysocki LJ, and Cambier JC (2006). Identification of anergic B cells within a wild-type repertoire. Immunity 25, 953–962. 10.1016/j.immuni.2006.10.017. [DOI] [PubMed] [Google Scholar]
- 35.Nguyen TTT, Wang ZE, Shen L, Schroeder A, Eckalbar W, and Weiss A (2021). Cbl-b deficiency prevents functional but not phenotypic T cell anergy. J. Exp. Med. 218, e20202477. 10.1084/jem.20202477. [DOI] [PMC free article] [PubMed] [Google Scholar]
- 36.Olenchock BA, Guo R, Carpenter JH, Jordan M, Topham MK, Koretzky GA, and Zhong XP (2006). Disruption of diacylglycerol metabolism impairs the induction of T cell anergy. Nat. Immunol. 7, 1174–1181. 10.1038/ni1400. [DOI] [PubMed] [Google Scholar]
- 37.Hiwa R, Nielsen HV, Mueller JL, Mandla R, and Zikherman J (2021). NR4A family members regulate T cell tolerance to preserve immune homeostasis and suppress autoimmunity. JCI Insight 6, e151005. 10.1172/jci.insight.151005. [DOI] [PMC free article] [PubMed] [Google Scholar]
- 38.Liu X, Wang Y, Lu H, Li J, Yan X, Xiao M, Hao J, Alekseev A, Khong H, Chen T, et al. (2019). Genome-wide analysis identifies NR4A1 as a key mediator of T cell dysfunction. Nature 567, 525–529. 10.1038/s41586-019-0979-8. [DOI] [PMC free article] [PubMed] [Google Scholar]
- 39.Seo H, Chen J, González-Avalos E, Samaniego-Castruita D, Das A, Wang YH, López-Moyado IF, Georges RO, Zhang W, Onodera A, et al. (2019). TOX and TOX2 transcription factors cooperate with NR4A transcription factors to impose CD8(+) T cell exhaustion. Proc. Natl. Acad. Sci. USA 116, 12410–12415. 10.1073/pnas.1905675116. [DOI] [PMC free article] [PubMed] [Google Scholar]
- 40.Trefzer A, Kadam P, Wang SH, Pennavaria S, Lober B, Akçabozan B, Kranich J, Brocker T, Nakano N, Irmler M, et al. (2021). Dynamic adoption of anergy by antigen-exhausted CD4(+) T cells. Cell Rep. 34, 108748. 10.1016/j.celrep.2021.108748. [DOI] [PubMed] [Google Scholar]
- 41.Feuerer M, Hill JA, Kretschmer K, von Boehmer H, Mathis D, and Benoist C (2010). Genomic definition of multiple ex vivo regulatory T cell subphenotypes. Proc. Natl. Acad. Sci. USA 107, 5919–5924. 10.1073/pnas.1002006107. [DOI] [PMC free article] [PubMed] [Google Scholar]
- 42.Dikiy S, and Rudensky AY (2023). Principles of regulatory T cell function. Immunity 56, 240–255. 10.1016/j.immuni.2023.01.004. [DOI] [PubMed] [Google Scholar]
- 43.Miragaia RJ, Gomes T, Chomka A, Jardine L, Riedel A, Hegazy AN, Whibley N, Tucci A, Chen X, Lindeman I, et al. (2019). Single-Cell Transcriptomics of Regulatory T Cells Reveals Trajectories of Tissue Adaptation. Immunity 50, 493–504.e7. 10.1016/j.immuni.2019.01.001. [DOI] [PMC free article] [PubMed] [Google Scholar]
- 44.Scheinecker C, Göschl L, and Bonelli M (2020). Treg cells in health and autoimmune diseases: New insights from single cell analysis. J. Autoimmun. 110, 102376. 10.1016/j.jaut.2019.102376. [DOI] [PubMed] [Google Scholar]
- 45.Zemmour D, Zilionis R, Kiner E, Klein AM, Mathis D, and Benoist C (2018). Single-cell gene expression reveals a landscape of regulatory T cell phenotypes shaped by the TCR. Nat. Immunol. 19, 291–301. 10.1038/s41590-018-0051-0. [DOI] [PMC free article] [PubMed] [Google Scholar]
- 46.Liberzon A, Birger C, Thorvaldsdóttir H, Ghandi M, Mesirov JP, and Tamayo P (2015). The Molecular Signatures Database (MSigDB) hallmark gene set collection. Cell Syst. 1, 417–425. 10.1016/j.cels.2015.12.004. [DOI] [PMC free article] [PubMed] [Google Scholar]
- 47.Wei G, Wei L, Zhu J, Zang C, Hu-Li J, Yao Z, Cui K, Kanno Y, Roh TY, Watford WT, et al. (2009). Global mapping of H3K4me3 and H3K27me3 reveals specificity and plasticity in lineage fate determination of differentiating CD4+ T cells. Immunity 30, 155–167. 10.1016/j.immuni.2008.12.009. [DOI] [PMC free article] [PubMed] [Google Scholar]
- 48.Feuerer M, Herrero L, Cipolletta D, Naaz A, Wong J, Nayer A, Lee J, Goldfine AB, Benoist C, Shoelson S, and Mathis D (2009). Lean, but not obese, fat is enriched for a unique population of regulatory T cells that affect metabolic parameters. Nat. Med. 15, 930–939. 10.1038/nm.2002. [DOI] [PMC free article] [PubMed] [Google Scholar]
- 49.Safford M, Collins S, Lutz MA, Allen A, Huang CT, Kowalski J, Blackford A, Horton MR, Drake C, Schwartz RH, and Powell JD (2005). Egr-2 and Egr-3 are negative regulators of T cell activation (vol 6, pg 472, 2005). Nat. Immunol. 6, 737. 10.1038/ni0705-737. [DOI] [PubMed] [Google Scholar]
- 50.Kalekar LA, and Mueller DL (2017). Relationship between CD4 Regulatory T Cells and Anergy In Vivo. J. Immunol. 198, 2527–2533. 10.4049/jimmunol.1602031. [DOI] [PMC free article] [PubMed] [Google Scholar]
- 51.Gavin MA, Clarke SR, Negrou E, Gallegos A, and Rudensky A (2002). Homeostasis and anergy of CD4(+)CD25(+) suppressor T cells in vivo. Nat. Immunol. 3, 33–41. 10.1038/ni743. [DOI] [PubMed] [Google Scholar]
- 52.Maggi J, Schafer C, Ubilla-Olguín G, Catalán D, Schinnerling K, and Aguillón JC (2015). Therapeutic Potential of Hyporesponsive CD4(+) T Cells in Autoimmunity. Front. Immunol. 6, 488. 10.3389/fimmu.2015.00488. [DOI] [PMC free article] [PubMed] [Google Scholar]
- 53.Bensinger SJ, Walsh PT, Zhang J, Carroll M, Parsons R, Rathmell JC, Thompson CB, Burchill MA, Farrar MA, and Turka LA (2004). Distinct IL-2 receptor signaling pattern in CD4+CD25+ regulatory T cells. J. Immunol. 172, 5287–5296. 10.4049/jimmunol.172.9.5287. [DOI] [PMC free article] [PubMed] [Google Scholar]
- 54.Schnell A, Bod L, Madi A, and Kuchroo VK (2020). The yin and yang of co-inhibitory receptors: toward anti-tumor immunity without autoimmunity. Cell Res. 30, 285–299. 10.1038/s41422-020-0277-x. [DOI] [PMC free article] [PubMed] [Google Scholar]
- 55.Li MO, and Rudensky AY (2016). T cell receptor signalling in the control of regulatory T cell differentiation and function. Nat. Rev. Immunol. 16, 220–233. 10.1038/nri.2016.26. [DOI] [PMC free article] [PubMed] [Google Scholar]
- 56.Baine I, Abe BT, and Macian F (2009). Regulation of T-cell tolerance by calcium/NFAT signaling. Immunol. Rev. 231, 225–240. 10.1111/j.1600-065X.2009.00817.x. [DOI] [PubMed] [Google Scholar]
- 57.Martinez GJ, Pereira RM, Äijö T, Kim EY, Marangoni F, Pipkin ME, Togher S, Heissmeyer V, Zhang YC, Crotty S, et al. (2015). The Transcription Factor NFAT Promotes Exhaustion of Activated CD8 T Cells. Immunity 42, 265–278. 10.1016/j.immuni.2015.01.006. [DOI] [PMC free article] [PubMed] [Google Scholar]
- 58.Kalekar LA, Schmiel SE, Nandiwada SL, Lam WY, Barsness LO, Zhang N, Stritesky GL, Malhotra D, Pauken KE, Linehan JL, et al. (2016). CD4(+) T cell anergy prevents autoimmunity and generates regulatory T cell precursors. Nat. Immunol. 17, 304–314. 10.1038/ni.3331. [DOI] [PMC free article] [PubMed] [Google Scholar]
- 59.Van de Sande B, Flerin C, Davie K, De Waegeneer M, Hulselmans G, Aibar S, Seurinck R, Saelens W, Cannoodt R, Rouchon Q, et al. (2020). A scalable SCENIC workflow for single-cell gene regulatory network analysis. Nat. Protoc. 15, 2247–2276. 10.1038/s41596-020-0336-2. [DOI] [PubMed] [Google Scholar]
- 60.Yamada T, Park CS, Mamonkin M, and Lacorazza HD (2009). Transcription factor ELF4 controls the proliferation and homing of CD8+ T cells via the Kruppel-like factors KLF4 and KLF2. Nat. Immunol. 10, 618–626. 10.1038/ni.1730. [DOI] [PMC free article] [PubMed] [Google Scholar]
- 61.Wagle MV, Vervoort SJ, Kelly MJ, Van der Byl W, Peters TJ, Martin BP, Martelotto LG, Nüssing S, Ramsbottom KM, Torpy JR, et al. (2021). Antigen-driven EGR2 expression is required for exhausted CD8 T cell stability and maintenance. Nat. Commun. 12, 2782, ARTN 2782. 10.1038/s41467-021-23044-9. [DOI] [PMC free article] [PubMed] [Google Scholar]
- 62.Trujillo-Ochoa JL, Kazemian M, and Afzali B (2023). The role of transcription factors in shaping regulatory T cell identity. Nat. Rev. Immunol. 23, 842–856. 10.1038/s41577-023-00893-7. [DOI] [PMC free article] [PubMed] [Google Scholar]
- 63.Garg G, Muschaweckh A, Moreno H, Vasanthakumar A, Floess S, Lepennetier G, Oellinger R, Zhan Y, Regen T, Hiltensperger M, et al. (2019). Blimp1 Prevents Methylation of and Loss of Regulatory T Cell Identity at Sites of Inflammation. Cell Rep. 26, 1854–1868.e5. 10.1016/j.celrep.2019.01.070. [DOI] [PMC free article] [PubMed] [Google Scholar]
- 64.Wang L, Liu Y, Han R, Beier UH, Thomas RM, Wells AD, and Hancock WW (2013). Mbd2 promotes foxp3 demethylation and T-regulatory-cell function. Mol. Cell Biol. 33, 4106–4115. 10.1128/MCB.00144-13. [DOI] [PMC free article] [PubMed] [Google Scholar]
- 65.Kim HJ, Barnitz RA, Kreslavsky T, Brown FD, Moffett H, Lemieux ME, Kaygusuz Y, Meissner T, Holderried TAW, Chan S, et al. (2015). Stable inhibitory activity of regulatory T cells requires the transcription factor Helios. Science 350, 334–339. 10.1126/science.aad0616. [DOI] [PMC free article] [PubMed] [Google Scholar]
- 66.Bending D, and Zikherman J (2023). Nr4a nuclear receptors: markers and modulators of antigen receptor signaling. Curr. Opin. Immunol. 81, 102285. 10.1016/j.coi.2023.102285. [DOI] [PubMed] [Google Scholar]
- 67.Rudensky AY, Gavin M, and Zheng Y (2006). FOXP3 and NFAT: partners in tolerance. Cell 126, 253–256. 10.1016/j.cell.2006.07.005. [DOI] [PubMed] [Google Scholar]
- 68.Mucida D, Pino-Lagos K, Kim G, Nowak E, Benson MJ, Kronenberg M, Noelle RJ, and Cheroutre H (2009). Retinoic acid can directly promote TGF-beta-mediated Foxp3(+) Treg cell conversion of naive T cells. Immunity 30, 471–473. 10.1016/j.immuni.2009.03.008. [DOI] [PMC free article] [PubMed] [Google Scholar]
- 69.Cunningham TJ, and Duester G (2015). Mechanisms of retinoic acid signalling and its roles in organ and limb development. Nat. Rev. Mol. Cell Biol. 16, 110–123. 10.1038/nrm3932. [DOI] [PMC free article] [PubMed] [Google Scholar]
- 70.Casaletto KB, Elahi FM, Bettcher BM, Neuhaus J, Bendlin BB, Asthana S, Johnson SC, Yaffe K, Carlsson C, Blennow K, et al. (2017). Neurogranin, a synaptic protein, is associated with memory independent of Alzheimer biomarkers. Neurology 89, 1782–1788. 10.1212/WNL.0000000000004569. [DOI] [PMC free article] [PubMed] [Google Scholar]
- 71.La Manno G, Soldatov R, Zeisel A, Braun E, Hochgerner H, Petukhov V, Lidschreiber K, Kastriti ME, Lönnerberg P, Furlan A, et al. (2018). RNA velocity of single cells. Nature 560, 494–498. 10.1038/s41586-018-0414-6. [DOI] [PMC free article] [PubMed] [Google Scholar]
- 72.Bergen V, Lange M, Peidli S, Wolf FA, and Theis FJ (2020). Generalizing RNA velocity to transient cell states through dynamical modeling. Nat. Biotechnol. 38, 1408–1414. 10.1038/s41587-020-0591-3. [DOI] [PubMed] [Google Scholar]
- 73.Qiu X, Hill A, Packer J, Lin D, Ma YA, and Trapnell C (2017). Single-cell mRNA quantification and differential analysis with Census. Nat. Methods 14, 309–315. 10.1038/nmeth.4150. [DOI] [PMC free article] [PubMed] [Google Scholar]
- 74.Cousins SW, McCabe MM, Danielpour D, and Streilein JW (1991). Identification of transforming growth factor-beta as an immunosuppressive factor in aqueous humor. Investig. Ophthalmol. Vis. Sci. 32, 2201–2211. [PubMed] [Google Scholar]
- 75.Coombes JL, Siddiqui KRR, Arancibia-Cárcamo CV, Hall J, Sun CM, Belkaid Y, and Powrie F (2007). A functionally specialized population of mucosal CD103+ DCs induces Foxp3+ regulatory T cells via a TGF-beta and retinoic acid-dependent mechanism. J. Exp. Med. 204, 1757–1764. 10.1084/jem.20070590. [DOI] [PMC free article] [PubMed] [Google Scholar]
- 76.Hong SW, Krueger PD, Osum KC, Dileepan T, Herman A, Mueller DL, and Jenkins MK (2022). Immune tolerance of food is mediated by layers of CD4(+) T cell dysfunction. Nature 607, 762–768. 10.1038/s41586-022-04916-6. [DOI] [PMC free article] [PubMed] [Google Scholar]
- 77.Hoffman L, Chandrasekar A, Wang X, Putkey JA, and Waxham MN (2014). Neurogranin alters the structure and calcium binding properties of calmodulin. J. Biol. Chem. 289, 14644–14655. 10.1074/jbc.M114.560656. [DOI] [PMC free article] [PubMed] [Google Scholar]
- 78.Iniguez MA, Morte B, Rodriguez-Pena A, Munoz A, Gerendasy D, Sutcliffe JG, and Bernal J (1994). Characterization of the promoter region and flanking sequences of the neuron-specific gene RC3 (neurogranin). Brain Res Mol Brain Res 27, 205–214. 10.1016/0169-328x(94)90002-7. [DOI] [PubMed] [Google Scholar]
- 79.Dutta D, Barr VA, Akpan I, Mittelstadt PR, Singha LI, Samelson LE, and Ashwell JD (2017). Recruitment of calcineurin to the TCR positively regulates T cell activation. Nat. Immunol. 18, 196–204. 10.1038/ni.3640. [DOI] [PMC free article] [PubMed] [Google Scholar]
- 80.McLane LM, Abdel-Hakeem MS, and Wherry EJ (2019). CD8 T Cell Exhaustion During Chronic Viral Infection and Cancer. Annu. Rev. Immunol. 37, 457–495. 10.1146/annurev-immunol-041015-055318. [DOI] [PubMed] [Google Scholar]
- 81.Heng JS, Hackett SF, Stein-O’Brien GL, Winer BL, Williams J, Goff LA, and Nathans J (2019). Comprehensive analysis of a mouse model of spontaneous uveoretinitis using single-cell RNA sequencing. P Natl Acad Sci USA 116, 26734–26744. 10.1073/pnas.1915571116. [DOI] [PMC free article] [PubMed] [Google Scholar]
- 82.Lipski DA, Dewispelaere R, Foucart V, Caspers LE, Defrance M, Bruyns C, and Willermain F (2017). MHC class II expression and potential antigen-presenting cells in the retina during experimental autoimmune uveitis. J. Neuroinflammation 14, 136. 10.1186/s12974-017-0915-5. [DOI] [PMC free article] [PubMed] [Google Scholar]
- 83.Okunuki Y, Mukai R, Nakao T, Tabor SJ, Butovsky O, Dana R, Ksander BR, and Connor KM (2019). Retinal microglia initiate neuroinflammation in ocular autoimmunity. Proc. Natl. Acad. Sci. USA 116, 9989–9998. 10.1073/pnas.1820387116. [DOI] [PMC free article] [PubMed] [Google Scholar]
- 84.Nosko A, Kluger MA, Diefenhardt P, Melderis S, Wegscheid C, Tiegs G, Stahl RAK, Panzer U, and Steinmetz OM (2017). T-Bet Enhances Regulatory T Cell Fitness and Directs Control of Th1 Responses in Crescentic GN. J. Am. Soc. Nephrol. 28, 185–196. 10.1681/ASN.2015070820. [DOI] [PMC free article] [PubMed] [Google Scholar]
- 85.Levine AG, Mendoza A, Hemmers S, Moltedo B, Niec RE, Schizas M, Hoyos BE, Putintseva EV, Chaudhry A, Dikiy S, et al. (2017). Stability and function of regulatory T cells expressing the transcription factor T-bet. Nature 546, 421–425. 10.1038/nature22360. [DOI] [PMC free article] [PubMed] [Google Scholar]
- 86.Paust HJ, Riedel JH, Krebs CF, Turner JE, Brix SR, Krohn S, Velden J, Wiech T, Kaffke A, Peters A, et al. (2016). CXCR3+ Regulatory T Cells Control TH1 Responses in Crescentic GN. J. Am. Soc. Nephrol. 27, 1933–1942. 10.1681/ASN.2015020203. [DOI] [PMC free article] [PubMed] [Google Scholar]
- 87.Luger D, Silver PB, Tang J, Cua D, Chen Z, Iwakura Y, Bowman EP, Sgambellone NM, Chan CC, and Caspi RR (2008). Either a Th17 or a Th1 effector response can drive autoimmunity: conditions of disease induction affect dominant effector category. J. Exp. Med. 205, 799–810. 10.1084/jem.20071258. [DOI] [PMC free article] [PubMed] [Google Scholar]
Associated Data
This section collects any data citations, data availability statements, or supplementary materials included in this article.
Supplementary Materials
Data Availability Statement
scRNA-seq data have been deposited at GEO under accession no. GSE281410 and are publicly available as of the date of publication.
This study did not develop any new codes. The code used for analysis can be found in GitHub https://github.com/NIH-NEI/Privilege_Treg_Anergy_scRNA and also in Zenodo https://doi.org/10.5281/zenodo.15053415.
Any additional information required to reanalyze the data reported in this paper is available from the lead contact upon request.