

Abstract
Negative templates come from foreknowledge of distractor-features and lead to improved performance during visual search. Recent studies have better characterized the mechanisms underlying these benefits, by showing a critical role of proactive control mechanisms in negative template use. The goal of this study was to test if state-based fluctuations of proactive control play a role in the use of negative templates. To do so, we engaged participants on a visual search task. We used motivation (e.g. rewards) to induce within-individual fluctuations of proactive control efficiency. We replicated previous findings for the positive templates, with faster RT to find the target during periods of high- compared to low-reward conditions. Interestingly, for negative templates, we failed to find evidence for an effect of motivation on the use of negative templates, even when a motivation condition led to faster RTs. Taken together, these results bring new evidence that using negative templates is not modulated by within-individual fluctuations of proactive engagement and are likely more related to trait-based aspects of an individual’s ability to engage proactive control efficiently.
Keywords: Negative templates, Motivation, Proactive control, Trait factors, Distractor suppression
INTRODUCTION
In our everyday life, knowing the features of what we are looking for (i.e., our target) helps to lead a more efficient visual search. For example, if you are looking for a friend in a crowd, knowing that they are wearing a blue jacket allows you to generate an internal positive template to restrict our search to blue target items. While most theories of attention have focused on this ability to guide our attention toward target features (Bundesen, 1990; Desimone & Duncan, 1995; Wolfe et al., 1989), recent evidence shows that we are also able to use negative templates, i.e., the foreknowledge of distractor-features, to flexibly guide attention away from distractors (Carlisle, 2022; Geng et al., 2019).
The benefits of negative templates were shown for the first time in Arita and colleagues (2012). Participants searched for a shape-defined target in a display containing two colors of Landolt Cs. Each search display was preceded by a cue that could indicate the upcoming target color (positive cues), indicate the upcoming distractor color (negative cues) or be non-informative (neutral cues). The authors found that both positive and negative cues lead to faster RTs compared to neutral cues, but smaller benefits were observed after negative cues compared to positive cues (Arita et al., 2012). The ability to use negative templates to improve search performance has since been replicated in many studies, using behavior, eye tracking, and EEG (Addleman & Stoermer, 2022; Carlisle & Nitka, 2019; Chidharom & Carlisle, 2023; Conci, et al., 2019; Kerzel & Hyunh Cong, 2022; Kugler, 205; Rajsic, et al. 2020; Reeder, et al., 2017; Tanda & Kawahara, 2019; Zhang, et al., 2020; Zhang, et al., 2022; Zhang & Carlisle, 2023). However, some studies have failed to show benefits of negative templates (Beck & Hollingworth, 2015; Beck et al., 2018; Becker et al., 2015; Berggren & Eimer, 2021; Moher & Egeth, 2012; Stilwell & Vecera, 2019a, 2019b; Williams et al., 2020), which may be related to specific aspects of their experimental paradigms (Conci, et al, 2019; Kerzel & Hyunh Cong, 2022). Importantly, large inter-individual variability has been reported in the benefits of negative templates (Beck & Hollingworth, 2015; Carlisle, 2022; Chidharom & Carlisle, under review), which could also be related to the mixed findings in the literature. Gaining a clear understanding of the mechanisms underlying negative templates may help to explain both the mixed findings in the literature as well as the large inter-individual differences in negative template use.
Recent work has begun to examine the executive control component underlying negative templates. In the broad literature on distractor-processing, the ability to suppress irrelevant information relies on at least two distinct mechanisms of control. Proactive mechanisms allow us to anticipate distractors and prevent attending to irrelevant items, whereas reactive mechanisms allow rapid disengagement when attention has been captured by distractors (Geng, 2014; Geng & DiQuattro, 2010; Geng & Duarte, 2021). One way to examine proactive control is to look for evidence of task-based activation prior to the onset of the visual search task (Liesefeld, et al., 2023). In the literature on negative templates, recent neuroscience studies have revealed a critical role of the proactive engagement of attention to filter out distractor items. For instance, an fMRI study showed that prior to visual search, negative cues led to lower activation in large parts of the visual cortex compared to neutral cues, whereas positive cues led to much higher activation (Reeder et al., 2017). In a follow-up study, a representational similarity analysis found target-specific activations for positive templates, but no target-specific deactivation of negative template information (Reeder, et al., 2018). This result suggests that negative templates guide attention through a nonspecific suppression of activity in the visual cortex. In the same manner, EEG studies also showed higher proactive engagement after negative cues as revealed by the specific increase in theta-band activity (4–8 Hz) over frontoparietal regions (Chidharom & Carlisle, 2023; de Vries et al., 2019), a well described frequency of brain oscillations associated with cognitive control (Cavanagh et al., 2012).
While neuroscience methods have been beneficial in highlighting a clear role for proactive control in negative template use, it is also beneficial to have a behavioral indicator of proactive control. One gold-standard task for separating proactive and reactive control states is the AX-Continuous Performance Task (AX-CPT; Cohen, 1999). In the AX-CPT, the specific error types participants make indicate whether they are using proactive or reactive control based on the Dual Mechanisms of Control Theory (Braver, 2012). However, one drawback of the AX-CPT is that it is not an indicator of proactive control which can be measured when participants are performing other cognitive tasks. For this reason, several recent studies have revealed instead used RT variability as a measure of proactive control engagement during the performance of other cognitive tasks.
Reaction time variability is an easy-to-measure indicator of proactive control, which has been verified both in relation to the AX-CPT task as well as measures of frontal theta, other key indicators of proactive control. Participants with higher RT variability exhibit reduced proactive control engagement. For example, Mäki-Marttunen and colleagues (2018) separated individuals into proactive, reactive, and intermediate groups based on the proactive behavioral index (relating AY and BX error rates). They found higher RT variability in the low proactive versus high proactive group. Similarly, individuals with higher RT variability exhibited lower EEG frontoparietal theta power following informative cues (Cooper et al., 2017) and after commission errors (Chidharom et al., 2021a), suggesting reduced ability to anticipate upcoming conflict. These findings from healthy individuals match results from clinical populations with impaired proactive control like schizophrenia and ADHD, where RT variability is consistently elevated. For example, Lesh and colleagues (2013) had schizophrenia patients perform an AX-CPT during fMRI. Individuals with schizophrenia showed reduced frontoparietal brain activation compared to healthy controls during proactive conditions, but similar activation during reactive conditions (see also Chidharom, et al., 2021b; Sidlauskaite et al., 2020). Furthermore, both schizophrenia (Chidharom et al., 2021c) and ADHD patients (Ehlis et al., 2018) exhibit reduced CNV amplitude, an ERP reflecting attentional preparation, along with higher SD-RT compared to controls.
Based on this large group of previous results highlighting the utility of SD-RT as a marker of proactive control, a prior study from our lab used the RT variability to explore the extent to which trait-based proactive control efficiency was associated with negative template benefits (Chidharom & Carlisle, under review). By analyzing the standard deviation of RT (SD-RT), we revealed that individuals with greater ability to engage proactive control (lower RT variability) exhibit greater benefits after negative cues, as well as higher ability to proactively avoid first eye movements to cued distractors. Such results lead us to the conclusion that interindividual differences in proactive control (or the proactive control trait) are associated with negative cue benefits. However, in that study, participants were only tested once. Therefore, it is unclear whether the differences observed are solely due to trait-level factors, or whether state-level factors may also play a role.
The goal of the current study is to examine whether state-based changes in proactive control impact benefits from negative templates. In order to do so, we must manipulate state-based proactive control and measure negative cue benefits. One reliable way to induce state-based variation in proactive control is to increase participant motivation using rewards (Yee and Braver, 2018; Chiew & Braver, 2014). For example, reward incentives have been shown to increase AY interference in the AX-CPT, reflecting enhanced cue maintenance and proactive control (Chiew & Braver, 2013; Locke & Braver, 2008), that aligns with similar behavioral effects in related studies (Dreisbach & Fischer, 2012; Braem et al., 2014). In the same manner, a recent fMRI study revealed reward induced greater pre-trial recruitment of task-positive and visual regions on correct versus incorrect trials, indicative of a proactive strategy maximizing success that has also been associated with decreased state-based periods of higher RT variability (Esterman et al., 2017). Taken together, these results suggest motivation through reward incentives is a powerful tool to increase state-based proactive control, as indicated by reduced RT variability. In our study, we utilized motivation through reward to effect state-based changes in proactive control among our participants.
In the visual search literature more specifically, reward has been shown to increase proactive control engagement enabling higher visual search performance when participants are engaged in a typical positive cue visual search task. For example, in Reinhart & Woodman (2014), a positive cue indicated target features in the upcoming search array. The cue was preceded by a reward stimulus that indicated trials with low- or high-monetary rewards. They revealed a higher increase of frontal midline theta (4–8 Hz) activity after the high- compared to the low-reward cue (Reinhart & Woodman, 2014). Also, Schneider and colleagues (2018) revealed similar results using a slightly different methodology in which monetary reward was attributed to participants after they reached a certain amount of points during the task. With this approach, the amplitude of the CNV, an ERP reflecting attentional preparation, was higher during the high- compared to the low-reward condition (Schneider et al., 2018). Interestingly, the better performance observed in high- compared to the low-reward condition was correlated with higher theta activity and CNV amplitude (Reinhart & Woodman, 2014; Schneider et al., 2018). Taken together, these findings suggest that manipulations of motivation improve visual search performance through intra-individual fluctuations of proactive control.
One benefit of the RT variability measure is that it can also be used as an index of state-based variation of proactive control, in addition to a trait-level indicator of proactive control use. For example, Chidharom and colleagues (2021b) have divided an attentional task into periods of low RT variability (high proactive control) and high RT variability (low proactive control) and explored attentional control mechanisms through EEG recordings of frontal theta-band oscillations. Measures of proactive control from frontal theta were reduced during periods of high- compared to low-RT variability, while reactive control remained stable across the two RT variability periods. The same pattern of results has been recently replicated, once again with higher proactive control efficiency during periods of lower RT variability (Chidharom & Bonnefond, 2023). Thus, in the current study, we can utilize measures of RT variability as an manipulation check for our increases of state-level proactive control.
The goal of this study is to test if state-based fluctuations of proactive control play a role in the use of negative templates. While previous work has concluded that trait-level individual differences in proactive control are related to negative template use (Chidharom & Carlisle, 2023; Chidharom & Carlisle, under review), this does not rule out state-based impacts as well. In our design, we engaged participants in a visual search task. The search onset was preceded by either neutral, negative or positive cues. In Experiments 1 and 2, points were used for a reward manipulation, whereas monetary rewards were used for a reward manipulation in Experiments 3 and 4. The previous literature leads to a clear set of predictions. Regarding the positive cues, we expect to replicate the effect of Reinhart & Woodman (2014), by showing faster RT during the high- compared to the low-reward conditions. These greater benefits should be associated with greater engagement of proactive control, reflected by a decrease of the RT variability during high- compared to low-reward conditions. However, our study focuses on the mechanisms underlying negative cues, where we can formulate two opposing hypotheses. If negative template benefits are influenced by state-based proactive control, we would expect to see faster RT during the high- compared to the low-reward conditions. In addition, greater proactive control engagement during the high-reward condition should be observed through the decrease of RT variability. In contrast, if negative template benefits are solely driven by trait-based differences in proactive control (Chidharom & Carlisle, 2023; Chidharom & Carlisle, under review), we should not observe differences between the high- and the low-reward conditions on RT, nor on RT variability.
EXPERIMENT 1
In Experiment 1, participants performed a version of the negative-cue task similar to Arita, et al. (2012; see Figure 1), however the items in the two colors were not separated by hemifield to prevent any potential spatial strategies for performing the task (Beck & Hollingworth, 2015; Carlisle & Nitka, 2019). Reward was manipulated using a point system, where participants were encouraged to gain as many points as possible.
Figure 1. Design of the task for Experiment 1 and Experiment 2.
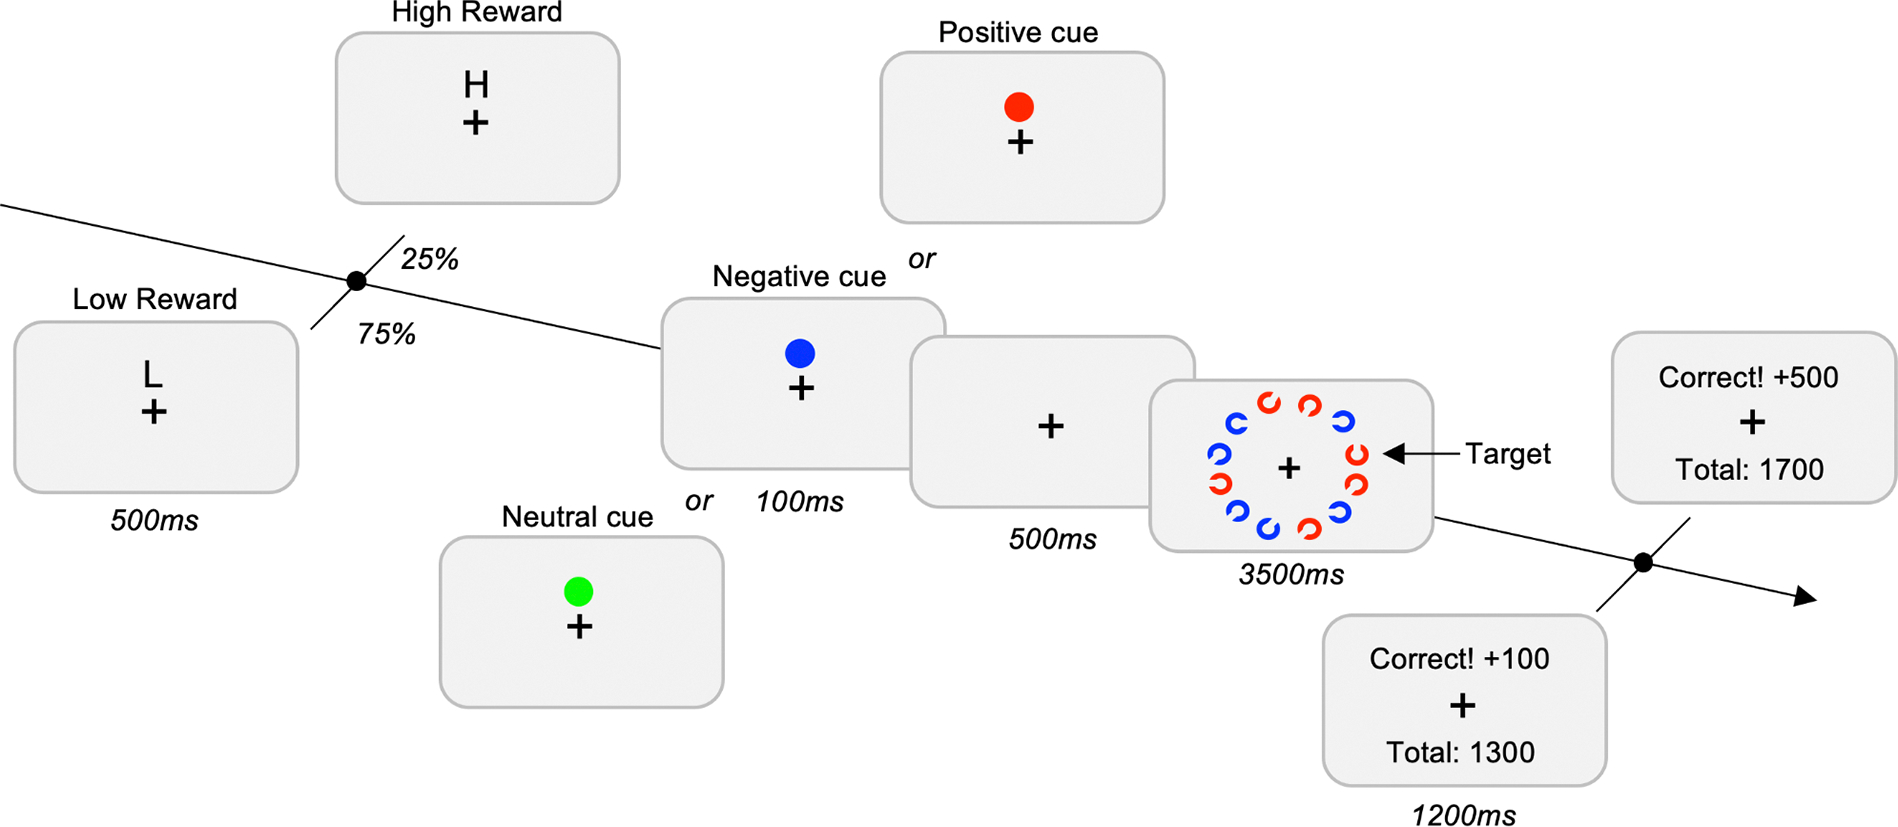
The trial starts with the presentation of the reward cue. In 75% of the trials, a “L” was presented on the screen, indicating to the participant a low-reward for correct performances (100 points). In 25% of the trials, a “H” was presented on the screen, indicating to the participant a high-reward for correct performances (500 points). The type of Cue (Neutral, Negative and Positive) was a blocked-design. The task of the participants was to find the Landolt-C with the gap at the top or the bottom. At the end of each trial, a feedback screen was presented to the subject with the points earned for the trial and the total amount of points accumulated so far.
Method
Participants
Based on previous experiments (Zhang, Gaspelin & Carlisle, 2020; Zhang, Sahatdjian & Carlisle, 2022), we recruited a sample of 25 undergraduates from Lehigh University who gave informed consent and participated in a search task for course credit (Mean Age = 18.7, SD = 1.15, 24 females). Procedures were approved by Lehigh University IRB. All participants reported normal or corrected-to-normal vision and normal color perception.
Stimuli
Stimuli were presented on a gray background (90.0 cd/m2) at a viewing distance of approximately 60 cm. Reward cues were presented at the center of the screen by using the letters L or H, for “Low” and “High” reward, respectively (see Figure 1). The search cue was a filled colored circle (1.3°) presented at the center of the screen. Search items were outlined circles (1.3° in diameter with a 0.2° line thickness) with a gap (0.5° long) that were presented 6.3° from fixation. Target items had a gap at the top or bottom, while distractors had gaps at the other 6 possible gap locations. The two colors appearing during the search array were randomly selected on each trial from a set of six colors (red, green, blue, magenta, orange, and cyan). Each color appeared approximately 17% of the time. The target-color items and the distractor-color items were spatially intermixed randomly on each trial.
Procedure
Each trial contained the same sequence. First, the reward stimulus was presented for 500 ms and immediately followed by the search cue for 100 ms. After a 500 ms fixation screen, a 12-item visual search array of Landolt-Cs was presented on an imaginary circle centered on the fixation cross. Two colors were selected for the search array at random on each trial from red, green, blue, magenta, orange and cyan. The subjects had to detect a target characterized by a gap opening facing the top or bottom of the Landolt-C. Participants had to press the up arrow key on the keyboard if the target Landolt C had a gap at the top, and press the down arrow key if the target had a gap at the bottom. The search array remained on the screen until 200 ms after response, or for a maximum of 3500 ms. The final stimulus event of each trial was feedback displaying the current and total points earned. On low-reward trials (L), subjects earned 100 points for a correct response within the 3500 ms, whereas on high-reward trials (H) subjects earned 500 points for a correct response. There was no penalty for an incorrect or missed response. Participants were instructed to score as many points as possible. 75% of all trials were preceded by low-reward cues with the rest having high-reward cues, consistent with the reward structure of other studies examining reward effects on attention (Della Libera & Chelazzi, 2009; Hickey et al., 2010; Libera & Chelazzi, 2006; Reinhart & Woodman, 2014; Serences, 2008).
This task was divided into 3 blocks of 120 trials, separated by cue type. In the positive cue block, the cue indicated the color the target would appear in in the upcoming block. Using this cue would mean participants would only need to search through the 6 items in this color to find the search target. Similarly, the negative cue indicated that the cued color would not be the target, allowing participants the possibility of ignoring the 6 distractor items appearing in the negative cue color. Finally, the neutral cue block contained a cue that would not appear in the upcoming array, providing no information to help complete the search task. The order of the blocks was randomized across participants, and participants received instructions about the meaning of the cue and practice trials for the cue before beginning each experimental block (Figure 1).
Data and Statistical Analysis
Three participants were excluded for poor accuracy (i.e., 2.5 standard deviations below mean accuracy). Trials with RT less than 300 ms or with incorrect responses were excluded from the RT analysis. The percentage of correct responses was the number of correct responses divided by the total number of trials. To analyze performance, ANOVAs were performed including the within-subject factors Cue (Neutral, Positive and Negative) and Reward Amount (Low and High). In the case of statistically significant interactions, paired t-tests were conducted.
Results
Reaction Time.
The ANOVA performed on RT revealed a significant main effect of Cue, F(2,42) = 16.92, p < 0.001, η2p =.45. Post-hoc paired t-tests revealed faster RT for positive (1.42s), t(21) = 4.95, p < 0.001; and negative (1.64s), t(21) = 2.25, p = 0.035; compared to neutral cues (1.77s). Participants were also slower in the negative cue compared to the positive cue condition, t(21) = 4.24, p < 0.001. This replicates the basic pattern in negative template studies.
No main effect of Reward Amount, F(1,21) = 0.124, p = 0.728, η2p =.006; or Cue x Reward Amount interaction was observed, F(2,42) = 0.194, p = 0.824, η2p =.009. Moreover, the planned comparisons did not show differences between the low-reward and the high-reward conditions after negative, t(21) = 0.593, p = 0.559, BF10 = 0.261, ; and positive cues, t(21) = −0.551, p = 0.588, BF10 = 0.256, (Figure 2A).
Figure 2. Results of Experiment 1 that used a point-based reward for correct responses with no reaction time threshold.
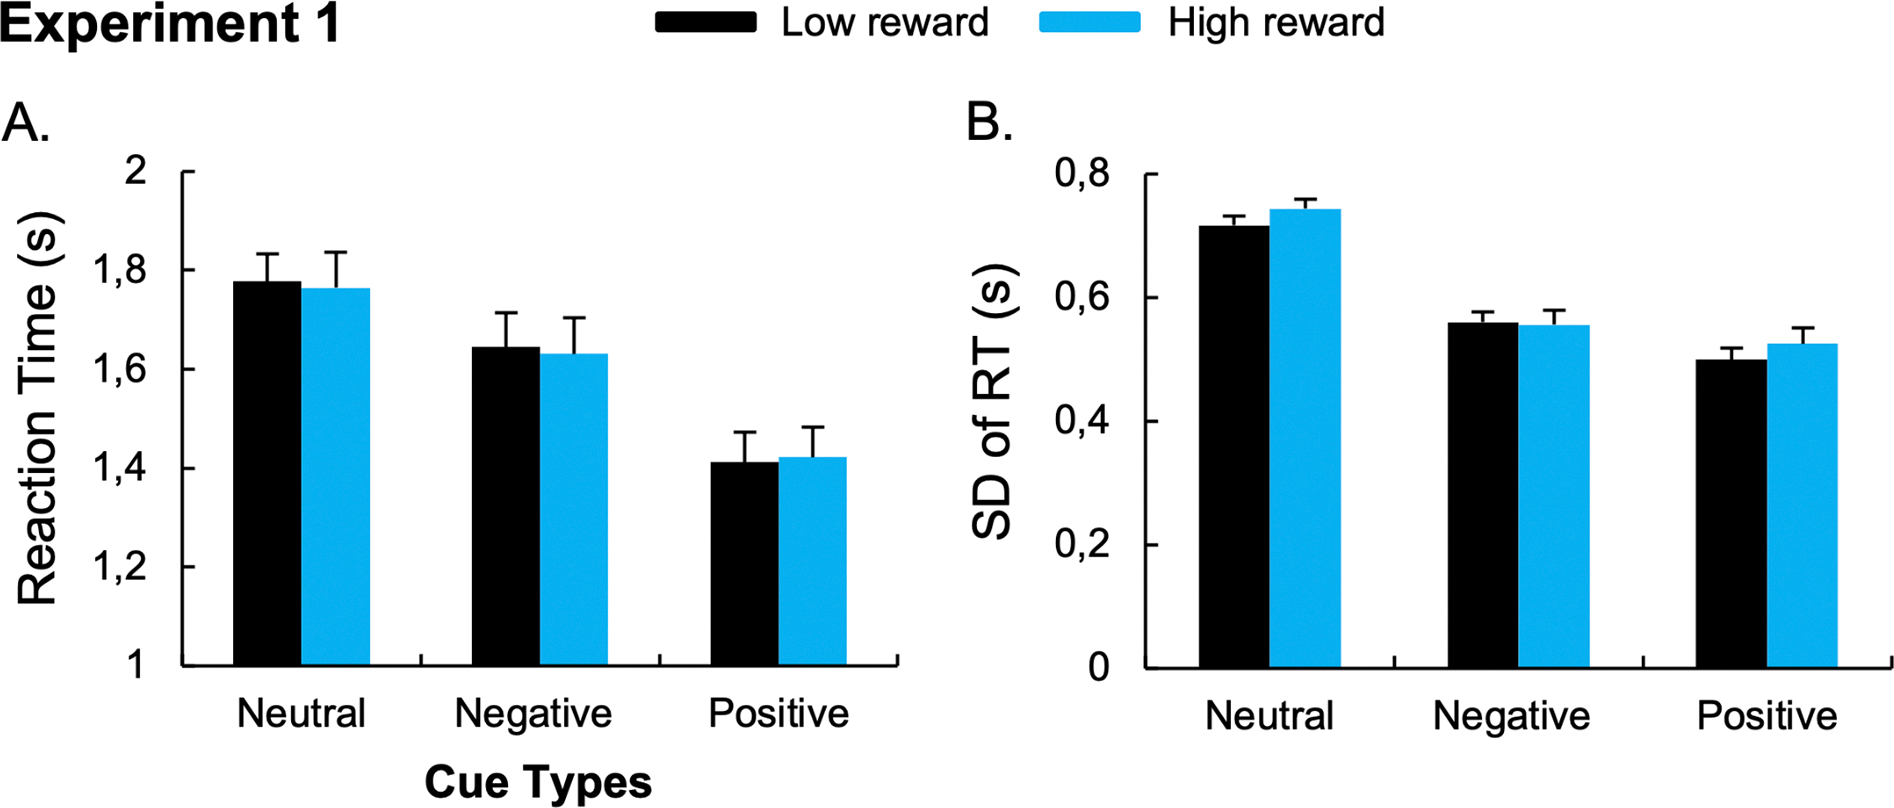
The mean RT (A) and the standard-deviation of RT (B) during low- and high-reward conditions. Error bars represent between-subject standard errors. *p < 0.05.
RT variability.
The ANOVA performed on SD-RT revealed a significant main effect of Cue, F(2,42) = 56.73, p < 0.001, η2p =.73. Post-hoc paired t-tests revealed lower SD-RT for positive (0.51s), t(21)= 8.63, p < 0.001; and negative (0.56s), t(21)= 8.60, p < 0.001; compared to neutral cues (0.73s). Participants also exhibit lower RT variability after the positive compared to the negative cue conditions, t(21)= 2.41, p = 0.025. The ANOVA did not reveal a main effect of Reward Amount, F(1,21) = 2.17, p = 0.156, η2p =.094; nor a Cue x Reward Amount interaction, F(2,42) = 1.41, p = 0.254, η2p =.063. Moreover, the planned comparisons did not show differences between the low-reward and the high-reward conditions after negative, t(21)= 0.264, p = 0.794, BF10 = 0.230; and positive cues, t(21)= −1.64, p = 0.116, BF10 = 0.770 (Figure 2B). To control for a potential effect of the mean RT on SD, we computed the coefficient of variation (i.e., SD-RT/mean-RT) and found similar effects (See Supplementary Results).
Accuracy1.
The ANOVA performed on the % of correct responses revealed no main effect of Cue, F(2,42) = 2.21, p = 0.122, η2p =.095; nor Reward Amount, F(1,21) = 0.686, p = 0.417, η2p =.032; nor Cue x Reward Amount interaction, F(2,42) = 0.642, p =0.531, η2p =.030. Correct responses rate was similar between neutral (88%), negative (89%) and positive cues (91%). Moreover, the planned comparisons did not show differences between the low-reward and the high-reward conditions after negative, t(21)= −0.566, p = 0.577, BF10 = 0.258; and positive cues, t(21)= 0.565, p = 0.578, BF10 = 0.258.
Discussion
In this experiment, we replicated the effect of attentional templates on visual search performance. The participants perform the task more efficiently after both negative and positive cues, with worse performance after negative compared to positive cues. However, the point-based reward did not seem to alter visual search performances. Indeed, no main effect of Reward Amount was observed, nor Cue x Reward Amount interaction for overall RTs. We expected our manipulation of reward to increase proactive control, as demonstrated in previous work (Reinhart & Woodman, 2014; Schneider et al., 2018), however our measures of SD-RT also did not show an impact of the reward manipulation, making it unclear if the points increased the motivation of the participants. In considering why the points may not have improved performance on the task, we reasoned that the lack of impact may be due to the way we chose to reward participants. In our design, points were given for correct responses only. Because participants found the target on almost every trial (89.3 % of the case), the reward was provided on nearly every trial. This high level of accuracy is common in negative template studies (Carlisle, 2022), and so in Experiment 2 we chose to focus our manipulation of reward more on task speed.
EXPERIMENT 2
In Experiment 2, we added a RT threshold for our reward condition to encourage both speed and accuracy of responses. Our goal was to further enhance participants’ motivation to perform the task in as efficient a manner as possible.
Methods
All methods were identical to Experiment 1, except the following changes. We set up a 1500 ms RT threshold in Experiment 2. This threshold of 1500 ms was measured by calculating the mean RT observed in Experiment 1. A correct response paired with a RT below 1500 ms allowed the participant to get the point reward. Thus, contrary to Experiment 1, the reward was based on both subjects’ speed and accuracy.
A new, larger, sample of 61 students from Lehigh University was recruited and volunteered for course credit (Mean Age = 19.6, SD = 1.41, 15 females). Five participants were excluded from the analysis for bad accuracy (i.e., participants that deviate from 2.5 standard deviations from the mean accuracy).
Results
Reaction Time.
The ANOVA performed on RT revealed a significant main effect of Cue, F(2,110) = 31.59, p < 0.001, η2p =.37. Post-hoc paired t-tests revealed faster RT for positive (1.15s), t(55) = 7.12, p < 0.001; and negative (1.29s) t(55) = 4.11, p < 0.001; compared to neutral cues (1.44s). Participants were also slower in the negative cue compared to the positive cue conditions, t(55) = 4.39, p < 0.001. This replicates the basic pattern in negative template studies.
No main effect of Reward Amount, F(1,55) = 0.855, p = 0.359, η2p =.015; or Cue x Reward Amount interaction was observed, F(2,110) = 0.553, p = 0.577, η2p =.010. The planned comparisons did not show differences between the low-reward and the high-reward conditions after negative, t(55) = − 0.869, p = 0.389, BF10 = 0.209; and positive cues, t(55) = 0.247, p = 0.806, BF10 = 0.150 (Figure 3A).
Figure 3. Results of Experiment 2 that used a point-based reward for correct responses faster than a group-level 1500ms reaction time threshold.
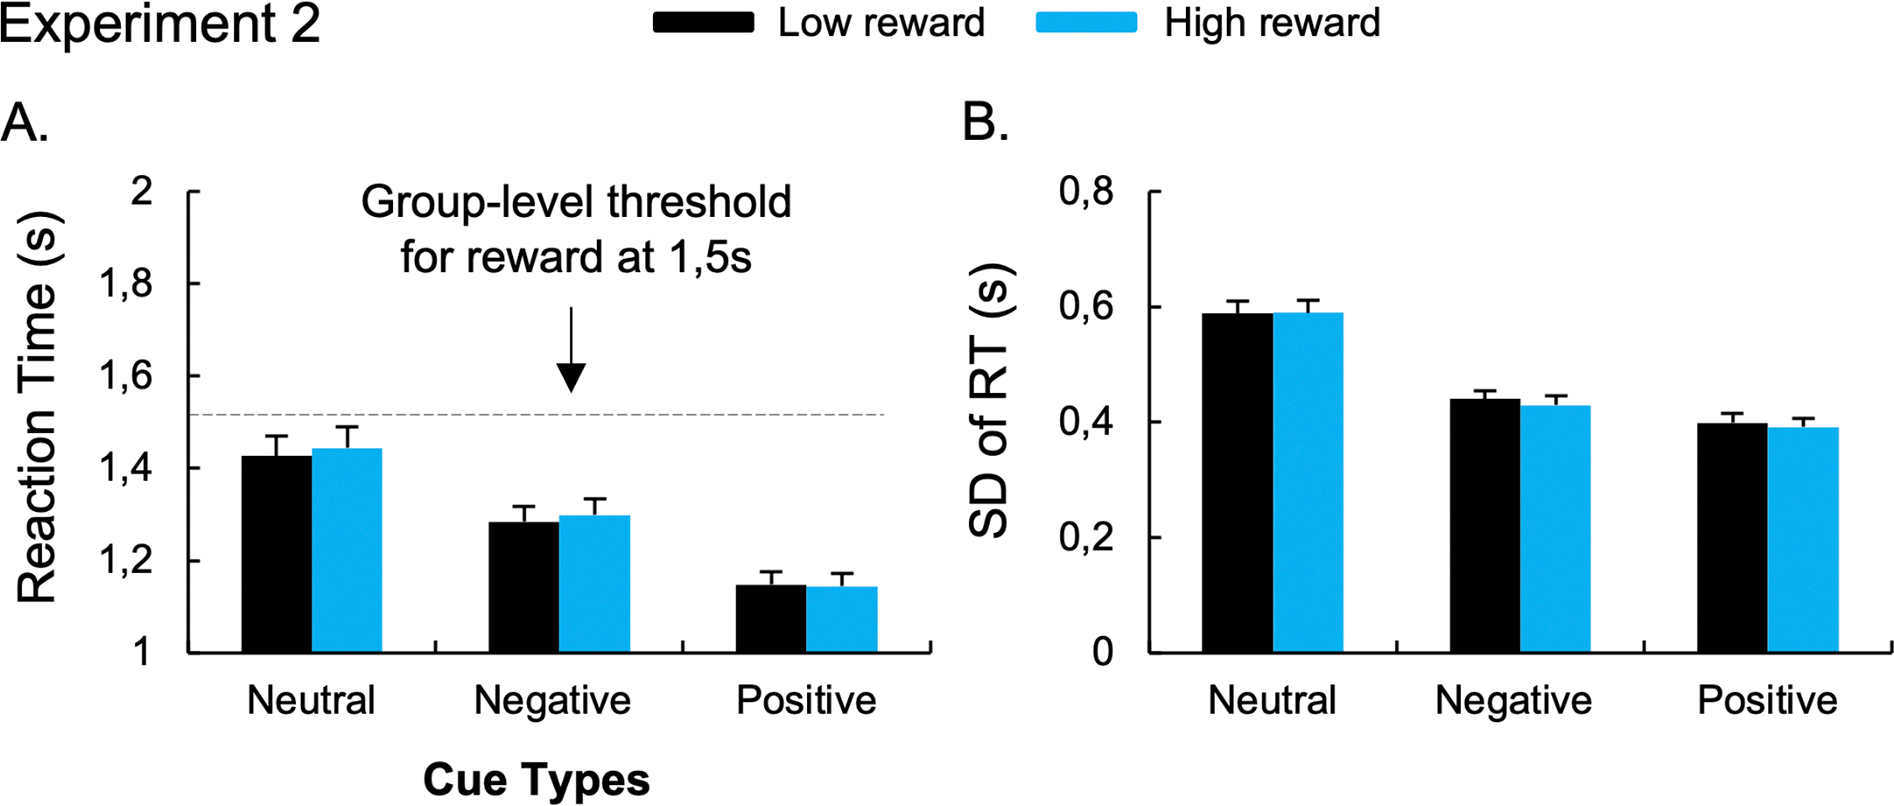
The mean RT (A) and the standard-deviation of RT (B) during low- and high-reward conditions. Error bars represent between-subject standard errors.
RT variability.
The ANOVA performed on SD-RT revealed a significant main effect of Cue, F(2,110) = 56.48, p < 0.001, η2p =.51. Post-hoc paired t-tests revealed lower SD-RT for positive (0.40s), t(55)= 8.99, p < 0.001; and negative (0.44s), t(55)= 7.99, p < 0.001; compared to neutral cues (0.59s). Participants also exhibited lower RT variability after the positive compared to the negative cue conditions, t(55)= 2.37, p = 0.021. The ANOVA did not reveal a main effect of Reward Amount, F(1,55) = 0.655, p = 0.422, η2p =.012; nor a Cue x Reward Amount interaction, F(2,110) = 0.377, p = 0.687, η2p =.007.. Moreover, the planned comparisons did not show differences between the low-reward and the high-reward conditions after negative, t(55) = 1.059, p = 0.294, BF10 = 0.248; and positive cues; t(55) = 0.824, p = 0.414, BF10 = 0.201 (Figure 3B). See Supplementary Section for results on the Coefficient of Variation.
Accuracy.
The ANOVA performed on the % of correct responses revealed a main effect of Cue, F(2,110) = 19.30, p < 0.001, η2p =.26. Post-hoc paired t-tests revealed higher accuracy for positive (79%), t(55) = − 6.00, p < 0.001; and negative (75%), t(55) = − 4.06, p < 0.001; compared to neutral cues (69%). Participants were also more accurate in the positive cue than the negative cue conditions t(55) = − 2.35, p = 0.022. No main effect of Reward Amount, F(1,55) = 0.04, p = 0.835, η2p =.001; or Cue x Reward Amount interaction was observed, F(2,110) = 1.94, p = 0.149, η2p =.034. The planned comparisons did not show differences between the low-reward and the high-reward conditions after negative, t(55) = −1.61, p = 0.112, BF10 = 0.495; and positive cues, t(55) = 0.354, p = 0.724, BF10 = 0.155.
Discussion
In Experiment 2, the RT threshold was added in an attempt to increase the use of reward cues. We replicated the effect of Cue, but we failed to find a main effect of Reward Amount or a Cue x Reward Amount interaction. Based on these results, it is possible that state-based differences do not play a role in the use of informative color cues. However, we also found that the reward manipulation did not lead to differences in SD-RT between the high and low reward conditions. Therefore, it is also possible that our manipulation of reward, using points during the task, was not sufficiently motivating enough to alter performance. Moreover, our choice of using a universal response time threshold might not be an optimal methodology since the fastest individuals (i.e., with average RTs below 1.5s) can more easily rely on a strategy based on accuracy to accumulate points, and RTs are typically faster for positive and negative cues the neutral cues, leading to potential differential impacts by condition. We try to address these methodological concerns in Experiment 3 adding a no-reward condition to ensure the motivation was impacting behavioral performance, and setting participant-specific and condition-specific RT thresholds.
EXPERIMENT 3
In Experiment 2, the point-based reward system failed to alter performance. To increase the potency of our motivation manipulation in Experiment 3, we made two key changes: First, we implemented personalized reaction time (RT) thresholds tailored to each individual’s baseline performance level during a no-reward block, separately for each condition. Including the no-reward block also allowed us to assess whether proactive control was altered by the reward motivation, through a comparison of SD-RT in the no-reward block and the rewarded block. Second, we utilized monetary rewards instead of point rewards.
Methods
All methods were identical to Experiment 2, except the following changes. The experiment consisted of two parts. In part one, participants completed 40 visual search trials without rewards or feedback to obtain a no-reward RT baseline. Mean RTs for each cue type (neutral, negative, positive) were calculated per individual. These means then served as the RT threshold applied to that cue condition in part two. For instance, if a participant’s average unrewarded RT to negative cues was 1450 ms, 1450 ms became their cutoff for rewarded negative cue trials. At the group-level, the average threshold was 2.00s (± 0.258s) for neutral cue, 1.81s (± 0.301s) for negative cue and 1.49s (± 0.261s) for positive cue. The no-reward baseline also ensured the motivation manipulation was having an impact on overall performance. Second, we used monetary rewards tied to both accuracy and speed, with $0.01 for low-reward and $0.05 for high-reward correct trials under the RT threshold. This rewarded not just accuracy but also the ability to respond quickly. The monetary incentives and personalized RT cutoffs aimed to effectively motivate engagement across a broad range of performance levels (Reinhart & Woodman, 2014) (Figure 4). Participants completed 120 low-rewarded trials and 40 high-rewarded trials.
Figure 4. Design of the task for Experiment 3 and Experiment 4.
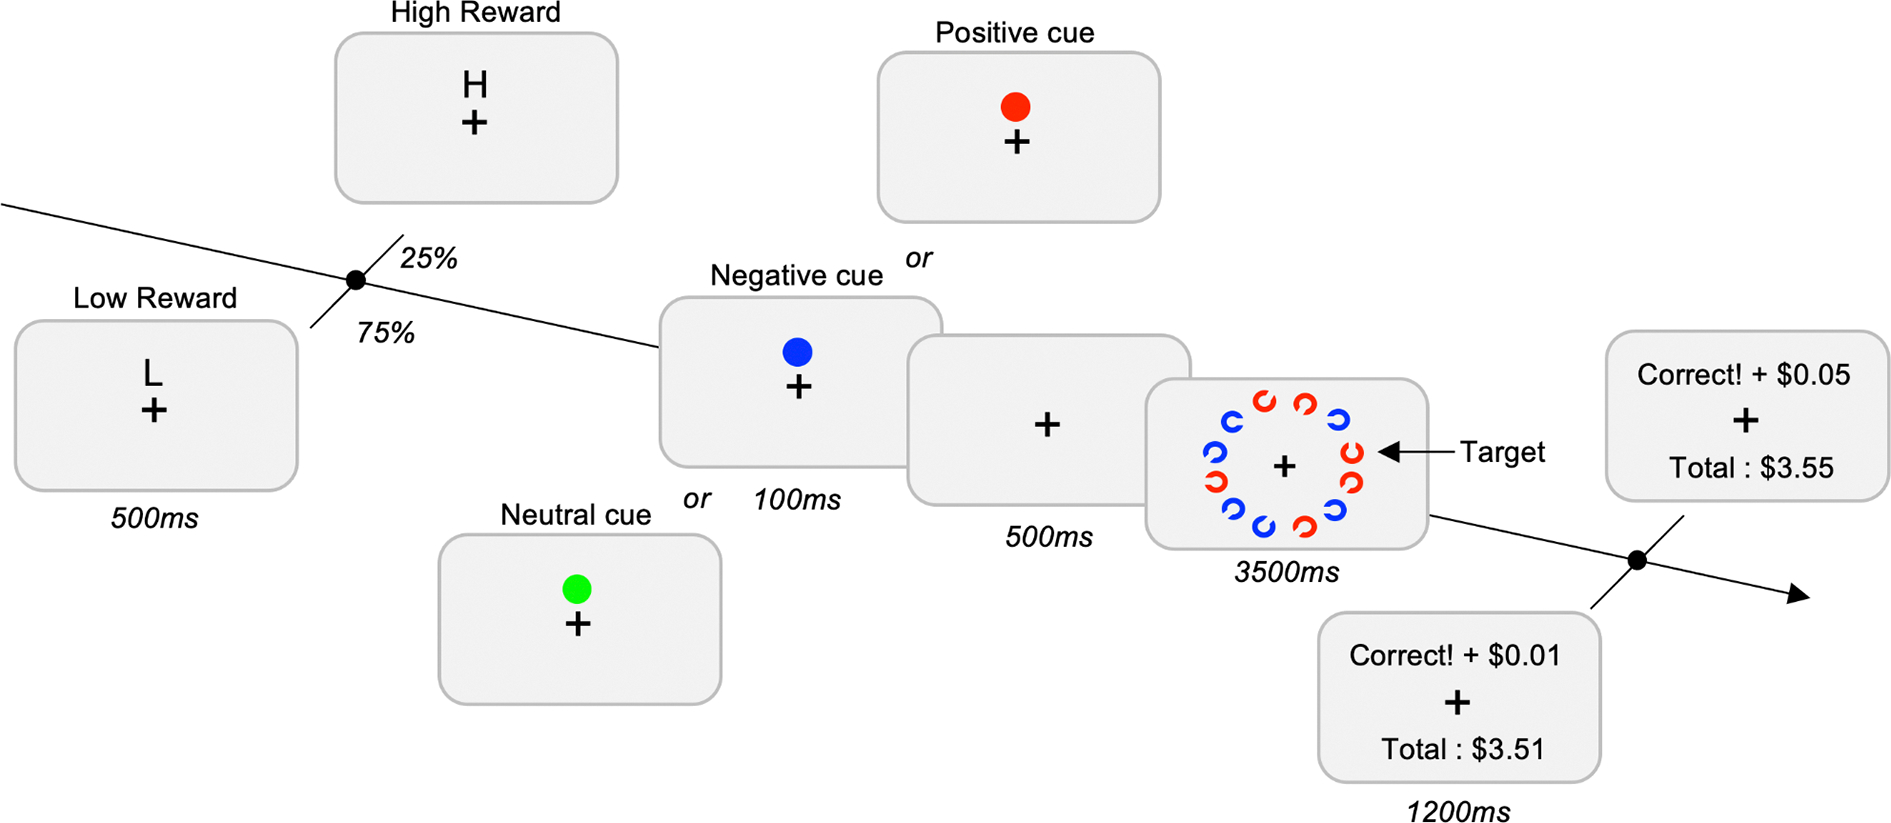
The trial starts with the presentation of the reward cue. In 75% of the trials, a “L” was presented on the screen indicating to the participant a low-reward for correct performances ($ 0.01). In 25% of the trials, a “H” was presented on the screen indicating to the participant a high-reward for correct performances ($ 0.05). The type of Cue (Neutral, Negative and Positive) was a blocked-design. The task of the participants was to find the Landolt-C with the gap at the top or the bottom. At the end of each trial, a feedback screen was presented to the subject with the amount of money earned for the trial, as well as the total amount of money earned so far.
A sample size calculation has been performed and registered on OpenScienceFramework (https://osf.io/ut9az). A new sample of 25 students from Lehigh University was recruited and volunteered for monetary compensation (Mean Age = 23.63, SD = 3.89, 14 females). Three participants have been excluded from the analysis for bad accuracy (i.e., participants that deviate from 2.5 standard deviations from the mean accuracy).
Results
Assessing the reward manipulation.
To explore the effect of the threshold and reward, we performed a paired t-test on both RT (Figure 5A) and SD of RT (Figure 5B) between the part one of the study (no-reward condition) and the part 2 (reward condition through the average of the low- and the high-reward condition). The t-tests revealed reduced RT for the reward condition (mean ± SD; 1.32s ± 0.218) compared to the no-reward condition (1.78s ± 0.174), t(22)= 19.1, p < 0.001, d = 3.98. Moreover, examining RT variability also showed a significant reduction in overall RT variability for the reward condition (0.50s ± 0.09) compared to the no-reward condition (0.598s ± 0.06), t(22)= 6.80, p < 0.001, d = 1.42, indicating the reward manipulation was influencing performance. Finally, there was a tendency for more correct responses for the reward condition (89.7% ± 0.05) compared to the no-reward condition (86.1% ± 0.10), t(22)= −1.94, p = 0.065, d = − 0.41. All together, these results suggest a successful manipulation of performance in the reward condition.
Figure 5. Results of the “No Reward” condition of Experiment 3.

The mean RT (A) and the standard-deviation of RT (B) after the neutral, negative and positive cue conditions. Error bars represent between-subject standard errors.
Reaction Time.
The ANOVA performed on RT revealed a significant main effect of Cue, F(2,44) = 52.40, p < 0.001, η2p =.70. Post-hoc paired t-tests revealed faster RT for positive (1.11s), t(22)= 12.16, p < 0.001, d = 2.53; and negative (1.33s), t(22)= 4.07, p < 0.001, d = 0.85; compared to neutral cues (1.52s). Participants were also slower in the negative cue compared to the positive cue conditions, t(22)= 5.75, p < 0.001, d = 1.19. This replicates the basic pattern in negative template studies.
No main effect of Reward Amount, F(1,22) = 1.75, p = 0.199, η2p =.074; nor Reward Amount x Cue interaction was observed, F(2,44) =1.06, p = 0.354, η2p =.046. However, based on our a priori hypothesis, the planned comparisons performed on the positive cue conditions revealed faster RT during the high- (1.09s) compared to the low-reward condition (1.13s), t(22)= 2.21, p = 0.038, d = 0.46. No effect of the reward was observed after the negative cue, t(22)= 0.884, p = 0.386, BF10 = 0.311) (Figure 6A).
Figure 6. Results of the “Reward conditions” of Experiment 3 that used a monetary-based reward for fast and correct responses below an individualized reaction time threshold.
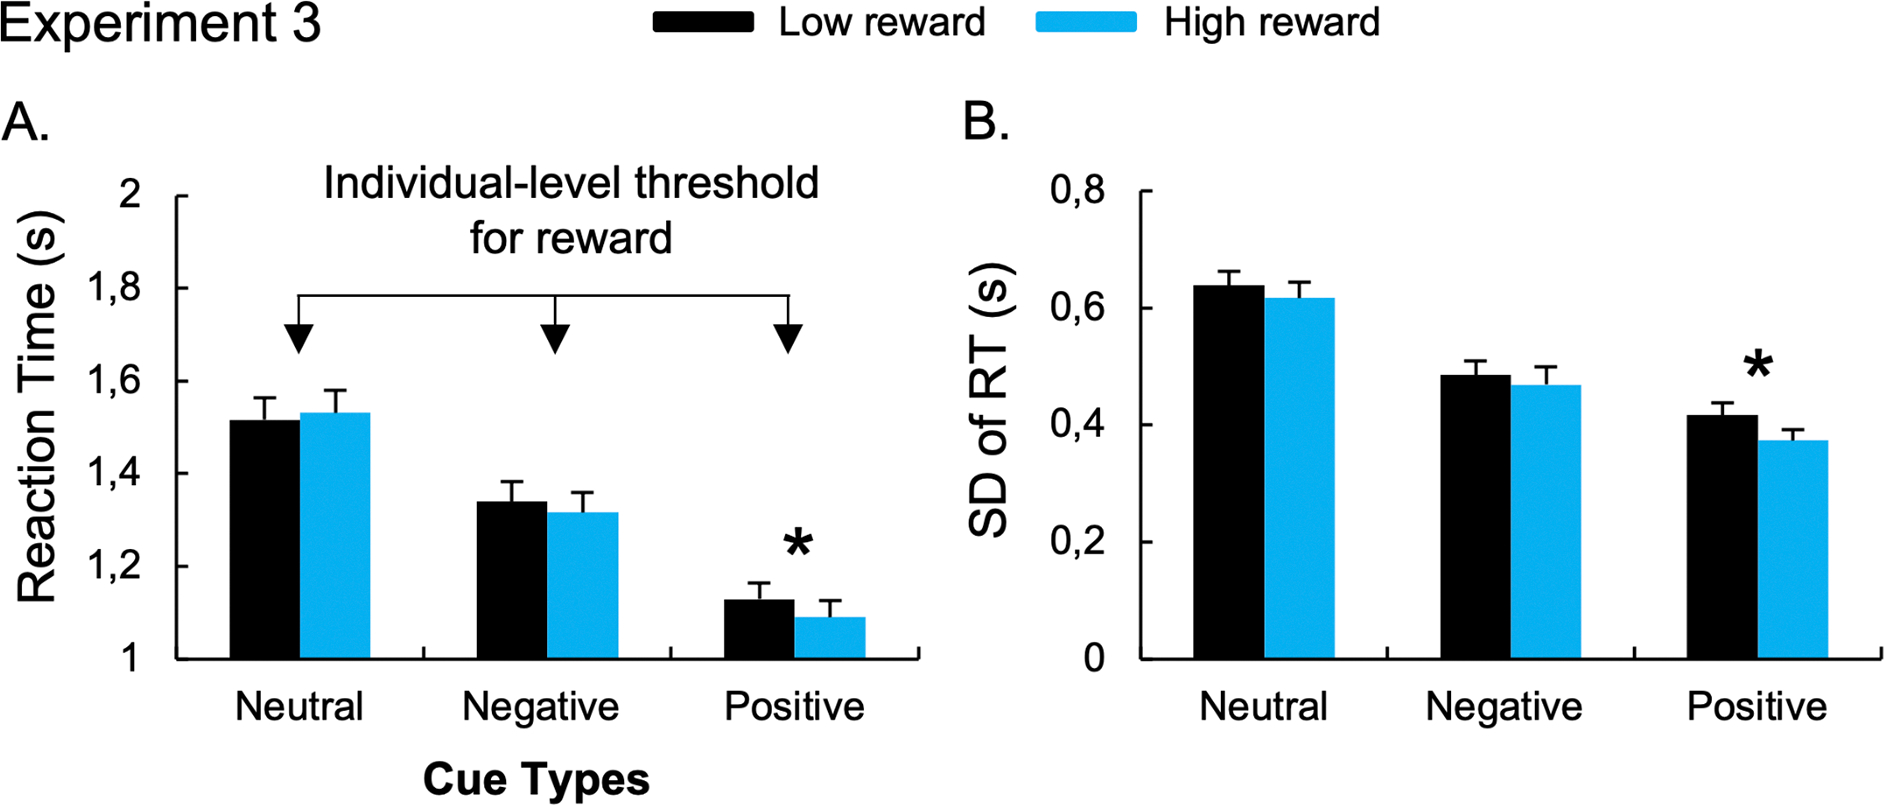
The mean RT (A) and the standard-deviation of RT (B) during low- and high-reward conditions. Error bars represent between-subject standard errors. *p < 0.05.
RT variability.
The ANOVA performed on SD-RT revealed a significant main effect of Cue, F(2,44) = 78.49, p < 0.001, η2p =.78. Post-hoc paired t-tests revealed lower SD-RT for positive (0.40s), t(22)= 15.77, p < 0.001, d = 3.29; and negative (0.48s), t(22)= 6.88, p < 0.001, d = 1.43; compared to neutral cues (0.63s). Participants also exhibited lower RT variability after the positive compared to the negative cue conditions, t(22)= 4.27, p < 0.001, d = 0.89. The ANOVA also revealed a main effect of Reward Amount, F(1,22) = 8.43, p = 0.008, η2p =.28, with reduced RT variability during the high- compared to the low-reward conditions. No significant interaction between Cue x Reward Amount was found, F(2,44) = 0.897, p = 0.415, η2p =.039. The planned comparisons revealed lower RT variability during the high-reward (0.37s) compared to the low-reward condition (0.42s) for positive cue; t(22)= 2.68, p = 0.014, d = 0.56, but not negative cue, t(22)= 0.972, p = 0.342, BF10 = 0.334 (Figure 6B). To control for a potential effect of the mean RT on difference in SD, we computed the coefficient of variation (i.e., SD-RT/mean-RT) and found similar effects (See Supplementary Results).
Accuracy.
The ANOVA performed on the % of correct responses revealed a main effect of Cue, F(2,44) = 52.45 p < 0.001, η2p =.70. Post-hoc paired t-tests revealed higher accuracy for positive (93%), t(22)= − 5.93, p < 0.001, d = −1.24; and negative cues (90%), t(22) = −2.95, p = 0.007, d = − 0.62; compared to neutral cues (86%). Accuracy was also higher after positive compared to negative cues, t(22) = −3.23, p = 0.004, d = − 0.67. The ANOVA did not reveal a main effect of Reward Amount, F(1,22) = 1.668 p = 0.210, η2p =.070; nor a Cue x Reward Amount interaction, F(2,44) = 0.404 p = 0.670, η2p =.018. The planned comparison did not reveal differences between the high-reward and the low-reward conditions for the positive cue, t(22) = −0.52, p = 0.608, BF10 = 0.247; or the negative cue, t(22) = −1.168, p = 0.255, BF10 = 0.401.
Discussion
Adding the no-reward block allowed us to ensure the reward manipulation was impacting participant performance. We were able to show that adding reward led to faster RT and lower SD-RT, ensuring our motivation manipulation was effective. Moreover, the monetary reward allowed us to replicate previous findings on positive templates (Reinhart & Woodman, 2014; Schneider et al., 2018). Indeed, we observed faster RT after positive cues during the high- compared to the low-reward condition. We also found evidence that this stronger performance during high-reward conditions was associated with changes in proactive control engagement. Indeed, the RT variability was lower during the high- compared to the low-reward conditions, suggesting a more efficient engagement of proactive control under high motivation for positive cues. However, we did not observe an effect of reward on negative cue performance, neither on RT nor on RT variability. This could be due to a lack of state-level alterations in negative cue usage. However, one possible explanation for this absence of effect is a ceiling effect existing for negative cues, because of the individualized RT threshold. Indeed, negative cues are more difficult to use compared to positive cues (Phelps et al., 2022, see also Conci, et al. 2019; Rajsic, et al., 2021). The RT threshold could thus lead individuals to perform at their maximum after negative cues, hiding a potential effect of low- and high-reward conditions on negative template benefits.
EXPERIMENT 4
In Experiment 3, we found evidence that participants were sensitive to the amount of reward when utilizing positive cues, but not during the negative cue condition. To ensure the RT cut-off was not inhibiting our ability to see an impact of reward in the negative cue condition, in this final experiment we maintained the monetary reward, but removed the RT cutoff.
Methods
All methods were identical to Experiment 2, except the following changes. To exclude a potential ceiling effect, the RT threshold was removed in Experiment 4. A sample size calculation has been performed and registered on OpenScienceFramework (https://osf.io/ut9az). A new sample of 25 students from Lehigh University was recruited and volunteered for monetary compensation (Mean Age = 23.16, SD = 5.26, 20 females). Two of them were excluded from the analysis for poor accuracy (i.e., 2.5 standard deviations below the mean accuracy).
Results
Assessing the reward manipulation.
To explore the overall effect of reward, we performed a paired t-test on both RT (Figure 7A) and SD of RT (Figure 7B) between the part one of the study (no-reward condition) and part 2 (reward condition through the average of the low- and the high-reward condition). The t-tests revealed reduced RT for the reward condition (mean ± SD; 1.51s ± 0.163s) compared to the no-reward condition (1.76s ± 0.158s), t(22)= 9.23, p < 0.001, d = 1.92. Moreover, examining RT variability also showed a reduced RT variability for the reward condition (0.576s ± 0.06) compared to the no-reward condition (0.600s ± 0.07), t(22)= 2.37, p = 0.027, d = 0.49. Finally, we found an increased rate of correct responses for the reward condition (95.5% ± 0.04) compared to the no-reward condition (85.3% ± 0.07), t(22)= −7.31, p < 0.001, d = − 1.53. All together, these results suggest a successful impact of monetary reward on overall task performance.
Figure 7. Results of the “No Reward” condition of Experiment 4.
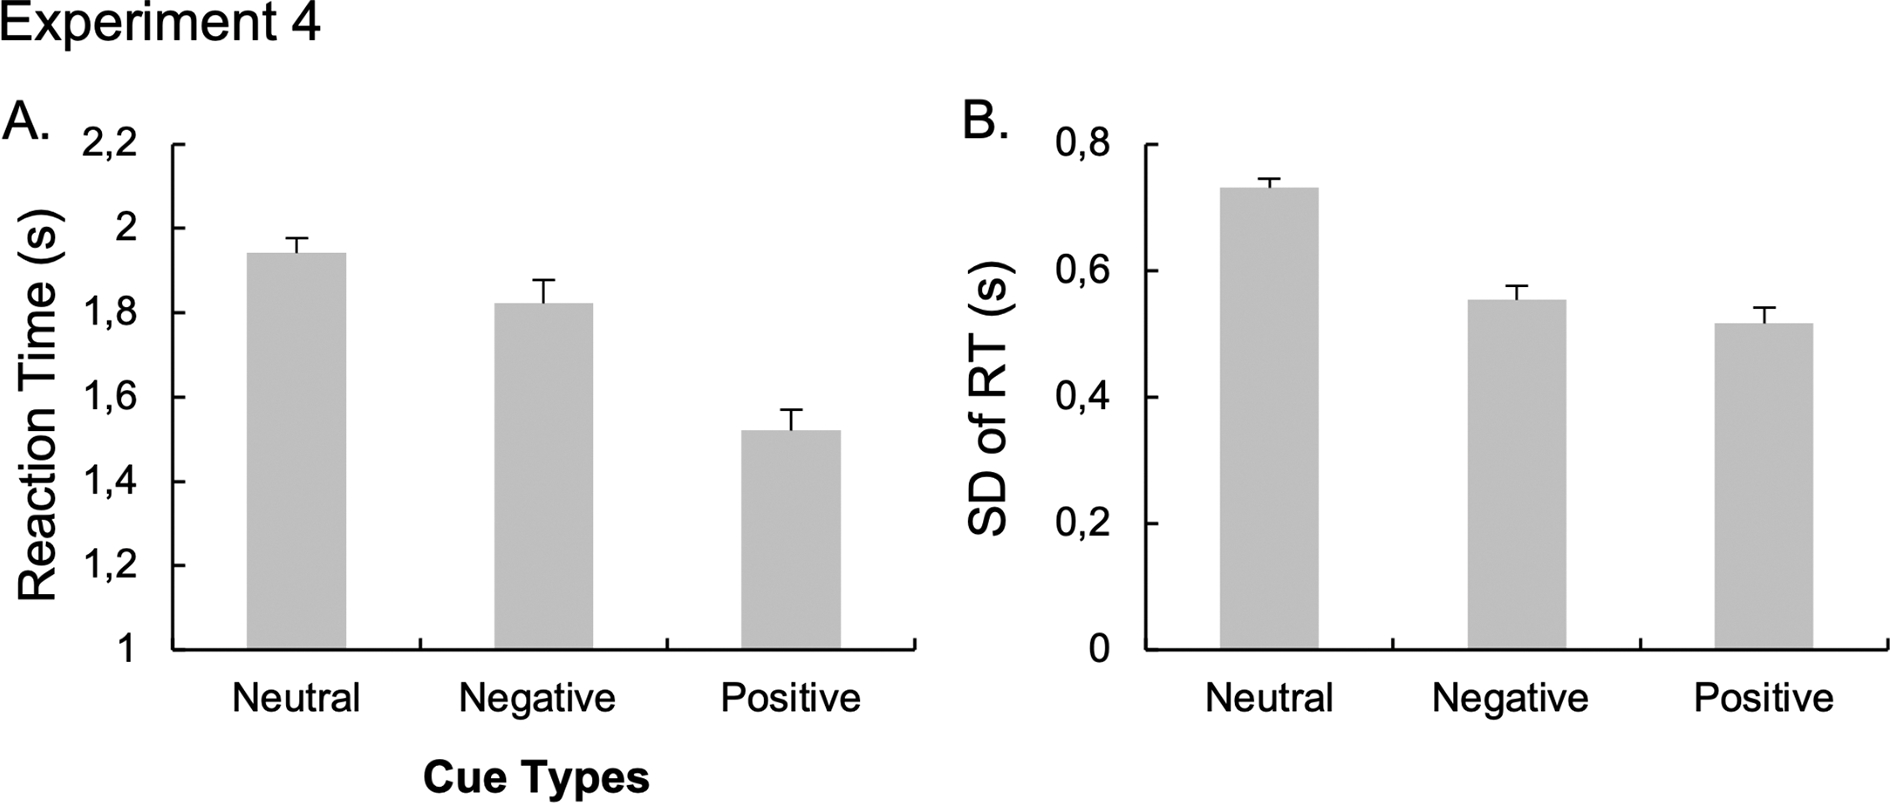
The mean RT (A) and the standard-deviation of RT (B) after the neutral, negative and positive cue conditions. Error bars represent between-subject standard errors.
Reaction Time.
The ANOVA performed on RT revealed a significant main effect of Cue, F(2,44) = 126.40, p < 0.001, η2p =.85. Post-hoc paired t-tests revealed faster RT for positive (1.25s), t(22)= 16.00, p < 0.001, d = 3.34, and negative (1.52s), t(22)= 6.02, p < 0.001, d = 1.26 compared to neutral cues (1.74s). Participants were also faster after the positive cue compared to the negative cue, t(22)= 11.42, p < 0.001, d = 2.38. This replicates the basic pattern in negative template studies.
A main effect of Reward Amount was also observed, F(1,22) = 5.25, p = 0.032, η2p =.19, with faster RT during the high-reward compared to low-reward conditions. The ANOVA revealed a trend for the Cue x Reward Amount interaction, F(2,44) = 2.97, p = 0.062, η2p =.12. The planned comparisons revealed faster RT during the high-reward (1.24s) compared to the low-reward condition (1.27s) after the positive cues, t(22) = 2.38, p = 0.026, d = 0.50, but not the negative cues, t(22) = −0.518, p = 0.609, BF10 = 0.247 (Figure 8A).
Figure 8. Results of the “Reward conditions” of Experiment 4 that used a monetary-based reward for correct responses with no reaction time threshold.
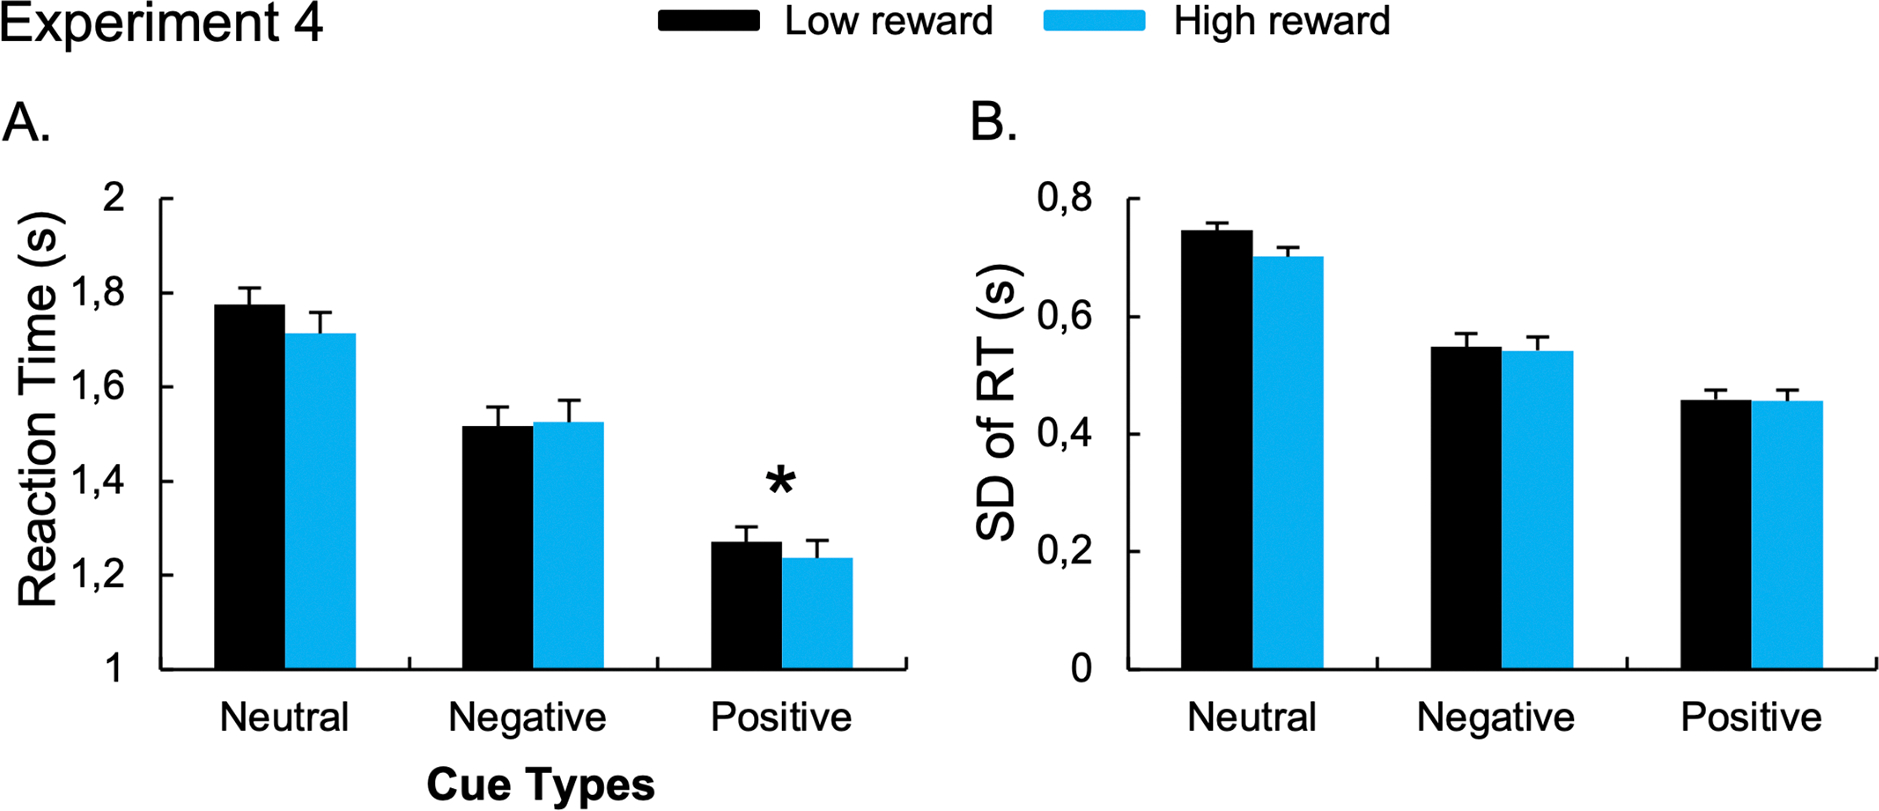
The mean RT (A) and the standard-deviation of RT (B) during low- and high-reward conditions. Error bars represent between-subject standard errors. *p < 0.05.
RT variability.
The ANOVA performed on SD-RT revealed a significant main effect of Cue, F(2,44) = 126.75, p < 0.001, η2p =.85. Post-hoc paired t-tests revealed reduced RT variability after positive (0.46s), t(22)= 15.81, p < 0.001, d = 3.30; and negative (0.55s), t(22)= 8.95 p < 0.001, d = 1.87; compared to neutral cues (0.72s). Participants also exhibited lower RT variability after the positive compared to the negative cue conditions, t(22)= 6.37, p < 0.001, d = 1.33. Moreover, the ANOVA revealed a main effect of Reward Amount, F(1,22) = 6.69, p < 0.017, η2p =.23, with reduced RT variability for the high-reward condition compared to the low-reward condition. The ANOVA also revealed a trend for the Cue x Reward Amount interaction, F(2,44) = 2.94, p = 0.063, η2p =.12. The planned comparisons did not reveal the difference between the high- and low-reward condition in the positive cue, t(22) = 0.171, p = 0.866, BF10 = 0.22; or the negative cue, t(22) = 0.475, p = 0.639, BF10 = 0.24 (Figure 8B). Similar effects have been observed on the coefficient of variation (See Supplementary Results).
Accuracy.
The ANOVA performed on the % of correct responses revealed a main effect of Cue, F(2,44) = 16.00, p < 0.001, η2p = .42. Post-hoc paired t-tests revealed higher accuracy for positive (97%), t(22)= − 4.97, p < 0.001, d = − 1.04; and negative cues (96%), t(22)= − 3.15, p = 0.005, d = − 0.66; compared to neutral cues (92%). Accuracy was also higher after positive compared to negative cues, t(22) = − 2.98, p = 0.007, d = − 0.62. The ANOVA revealed a trend for the main effect of Reward Amount, F(1,22) = 3.49, p = 0.075, η2p =.14, with higher accuracy for the high- compared to the low-reward condition. The ANOVA also revealed a trend for the Cue x Reward Amount interaction, F(2,44) = 2.55, p = 0.089, η2p =.10. The planned comparisons did not reveal difference in accuracy between the low- and the high-reward conditions after positive cues, t(22) = −0.261, p = 0.797, BF10 = 0.23; or negative cues t(22) = 0.123, p = 0.903, BF10 = 0.22.
Discussion
As in Experiment 3, our no-reward condition allowed us to ensure participant behavior was influenced by our motivation manipulation. Reward induced a successful shift to a proactive control state, as revealed by the reduced RT variability during reward (low-and high-rewards condition) compared to the no-reward condition. We replicated the effect of monetary reward on the benefits of positive cues seen in Experiment 3. RTs were faster during high- compared to low-reward conditions for positive cues. Importantly, once again, we did not observe an effect of the monetary reward on negative cue RT, nor on RT variability, allowing us to exclude a ceiling effect induced by the RT threshold on the use of negative templates suggested after Experiment 3. This suggests that state-level alterations in proactive control do not impact negative template use.
EXPLORATORY ANALYSIS.
Trait-based proactive control efficiency is associated with negative cues benefits.
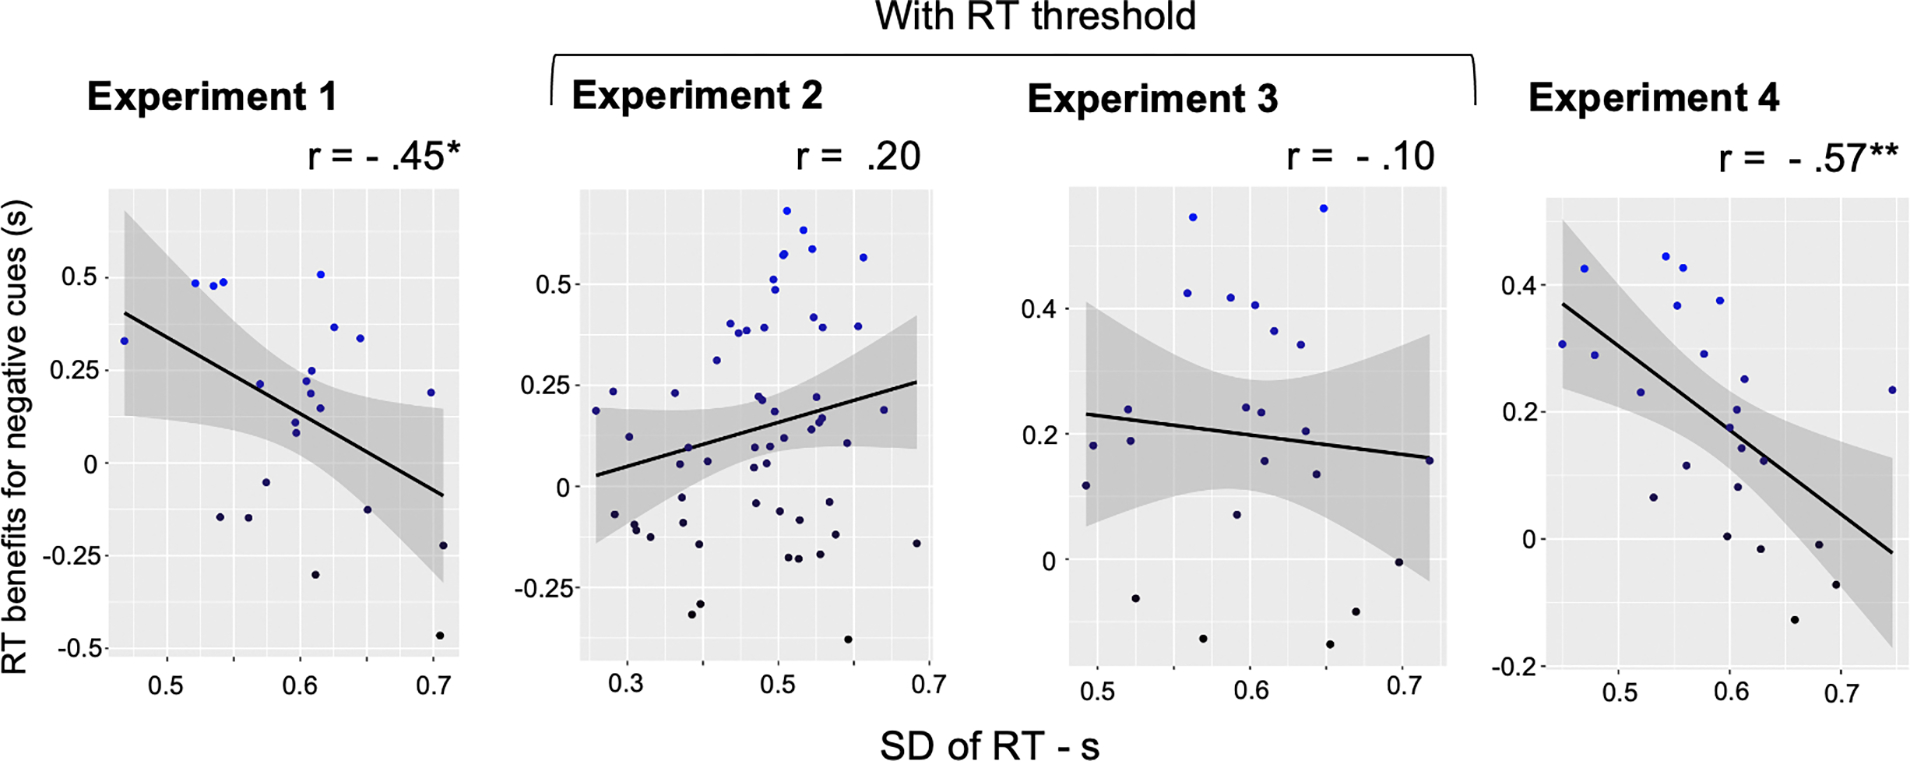
In the four experiments, we did not find evidence that state-based proactive control impacts the use of negative templates. This could suggest that the use of negative cues relies mainly on trait-based proactive control efficiency. Indeed, in a previous study, we revealed that individuals with higher efficiency of proactive control exhibited higher benefits from negative templates (Chidharom & Carlisle, under review). This has been revealed by a significant correlation between the RT variability and the RT benefits of negative cues. In this exploratory analysis section, we wanted first to replicate this effect. In our four experiments, we computed the overall RT variability through the standard deviation of RT. The RT benefits have been explored by subtracting the RT in the neutral cue condition with the RT in the negative cue condition. Then, we performed a correlation analysis between the SD-RT and the benefits of negative cues.
Our correlation analysis revealed a negative correlation between the SD-RT and the benefits of negative cues in Experiment 1 (r = − 0.45, p = 0.037) and in Experiment 4 (r = − 0.57, p = 0.004). However, when our designs included a RT threshold, we found no significant correlation in Experiment 2 (r = 0.20, p = 0.13) and Experiment 3 (r = 0.10, p = 0.67) (Figure 9). We thus replicate our previous findings (Chidharom & Carlisle, under review) with greater benefits after negative cues for individuals with lower RT variability (i.e., individuals with high proactive control efficiency), only in our designs which did not include an RT cut-off. Indeed, the designs of Experiments 1 and 4 are very close to the design used in our previous experiment (Chidharom & Carlisle, under review). The absence of a relationship between the RT variability and the benefits of negative cues in Experiments 2 and 3 is likely explained by the presence of this RT threshold. Indeed, it reduces the overall RT variability and probably avoids having large inter-individual differences in our sample size. Taken together, our results suggest that the use of negative cues relies more on trait-based proactive control efficiency, since no effect of reward was observed for negative cues.
Figure 9. Correlations between RT benefits for negative cues and the RT variability.
No trait x state interaction of proactive control in the negative cue benefits.
Based on these previous results, we can imagine that the individuals with greater proactive control ability (at the trait-level) are more likely to benefit from the reward cue (at the state-level). Such a phenomenon could hide on the average of performance, a potential effect of reward in the negative cue conditions for some individuals. To exclude this possible trait x state interaction, we performed another correlational analysis between the overall SD-RT (trait-proactive control) and the benefits of reward cues (state-proactive control). The benefits of reward cues were computed by calculating the difference in RT between the low- and the high-reward during the negative cue condition.
For all of our experiments, there was no relationship between the overall SD-RT and the reward benefits: Experiment 1, r = − 0.39, p = 0.070, Experiment 2, r = − 0.02, p = 0.844; Experiment 3, r = − 0.14, p = 0.518; Experiment 4, r = − 0.12, p = 0.596. Those results suggest that individuals with higher levels of proactive control do not benefit more from the reward cue during the negative cue condition, excluding the possibility of a trait x state interaction in our results. Taken together, our exploratory analysis supports the hypothesis of a trait-based influence of proactive control.
GENERAL DISCUSSION
The goal of this study was to test if state-based fluctuations of proactive control play a role in the use of negative templates. To do so, we used motivation (e.g. rewards) to induce within-individual fluctuations of proactive control efficiency. In the monetary reward experiments (Experiments 3 and 4), we replicated previous findings for positive templates (Reinhart & Woodman, 2014) showing larger RT benefits for high reward, but we failed to find evidence for an effect of reward amount on the use of negative templates. Importantly, adding the no-reward baseline condition ensured that participant performance was, indeed, sensitive to the addition of reward, leading to both reduced RT and reduced RT variability overall in the reward condition. After negative cues however, no RT differences were observed between the high- and the low-reward conditions, suggesting that reward did not impact negative template use. Taken together, these results bring new evidence that using negative templates are not modulated by within-individual fluctuations of motivation. Given the previous results in this literature suggesting trait-level differences in proactive control are related to individual differences in negative template use (Chidharom & Carlisle, 2023; under review), negative template use may be more related to trait-based individuals’ ability to engage proactive control efficiently.
Effect of motivation on the use of positive templates.
In Experiments 3 and 4, we showed that motivation (high reward) increases the use of positive templates. Participants exhibited faster RT after positive cues during the high- compared to the low-reward condition. This result is in line with previous research on positive attentional templates. Indeed, Reinhart & Woodman (2014), found faster RT during the high- compared to the low-reward condition when a cue indicated the target-features in the upcoming search array. By using a slightly different methodology that mixed point- and monetary-reward, Schneider and colleagues (2018) have revealed the same results.
In our study, we found evidence that changes in performances under motivation are associated with within-individual fluctuations in the top-down engagement of proactive control. Indeed, we revealed a lower RT variability under motivation in Experiment 4 (high- and low-reward conditions vs. no-reward condition) and even a lower RT variability during high- compared to low-reward conditions in Experiment 3. These differences in RT variability suggest that changes in motivation succeed in inducing changes in proactive control. Indeed, it was previously shown that within-individual changes in RT variability were associated with the engagement of the anticipated (or sustained) control mechanisms, with higher proactive control efficiency during periods of lower RT variability (Chidharom, Krieg, & Bonnefond, 2021; Chidharom, Krieg, Pham, et al., 2021; Chidharom & Bonnefond, under review). The finding that reward induces increased proactive control efficiency is also in line with previous neuroscience studies that revealed higher engagement of the proactive neural mechanisms during high-reward conditions. Indeed, higher frontal-midline theta and CNV amplitude has been observed before the search onset during the high- compared to the low-reward condition (Reinhart & Woodman, 2014; Schneider et al., 2018).
Effect of motivation on the use of negative attentional templates
Regarding the use of negative templates, our results revealed for the first time that motivation does not improve visual search performance after negative cues. Indeed, no difference was observed for negative cues between the low- and high-reward conditions on RT (nor on accuracy). This suggests that increasing the motivation of participants did not improve the use of negative templates.
Regarding the RT variability, the absence of significant differences revealed that no within-individual fluctuations of proactive control were induced by motivation during negative template use. Indeed, no difference was observed on the SD-RT after negative cues between low- and high-reward conditions. The first explanation for this absence of differences is that negative templates induce prior engagement of proactive control, not allowing motivation to further increase its engagement. In that case, it is possible that proactive control has reached a ceiling effect for negative templates and does not allow motivation to further improve search performance. As the previous works insightfully pointed out, negative cues confer weaker benefits than positive cues and may only emerge in sufficiently challenging search tasks that require active suppression (Phelps et al., 2022; Conci et al., 2019; Zhang et al., 2022). This suggests that the voluntary top-down inhibition needed for negative templates is difficult to achieve and further modulated by state factors. The lack of modulation by rewards can reflect this inherent difficulty of distractor suppression with negative cues.
The second possible explanation, complementary to the first one, is that proactive control efficiency is a trait-based ability for negative templates. The use of negative cues could then rely on individuals’ efficiency to anticipate specific cued items. This explanation is supported by our exploratory analysis in which we revealed a significant relationship between RT variability and the negative template benefits (in the experiences 1 and 4, without threshold setup). The result is perfectly consistent with the recent findings of Chidharom & Carlisle (under review) based on a larger sample size; individuals with lower SD-RT exhibited greater RT benefits. That suggests that individuals with greater ability to engage proactive control are the ones exhibiting greater performance benefits after negative cues. The idea of a trait-based difference in the use of negative cues is also supported by a recent EEG study, in which the authors revealed that negative cues are associated with higher fronto-parietal theta power compared to positive and neutral cues (Chidharom & Carlisle, 2023). The individuals with higher theta activity, a marker of stronger proactive control engagement, are the ones that exhibited higher reactive attentional engagement on the visual search array.
CONCLUSION
Taken together, the absence of an effect of reward on negative template use suggests motivation does not induce within-individual proactive control fluctuations for negative cues. However, reduced RT variability under reward for positive cues indicates state-based changes in proactive engagement are elicited for positive templates. The reduced RT after reward manipulation during the positive cue condition is associated with an overall moderate effect size. Further research might be needed to improve the effectiveness of motivation on positive template use. Additionally, the relationship between overall RT variability and negative cue benefits provides evidence that trait-based differences in proactive control efficiency impact negative template use.
This study provides new insights into dissociable state vs trait influences on positive and negative attentional templates. The results point to motivation-driven fluctuations in proactive control contributing only for positive templates, while inherent individual differences in proactive control relate to negative template use. Direct neural measures of proactive control could help further confirm the apparent lack of state-based changes underlying negative template benefits. Moreover, identifying cognitive traits associated with poorer proactive control could elucidate sources of variability in effectively suppressing irrelevant information using negative templates.
Supplementary Material
ACKNOWLEDGEMENTS
This paper was supported by a grant from the National Eye Institute of the National Institutes of Health: R15EY030247 to Nancy B. Carlisle.
Footnotes
DECLARATION OF INTEREST STATEMENT
The authors declare no competing financial interests.
In this typical visual search paradigm, error rates - defined as incorrect response button presse - remained low overall at approximately 2% of trials (see Supplementary table for details on accuracy values). Given the very high accuracy across all conditions, errors were not statistically analyzed or interpreted further.
REFERENCES
- Arita JT, Carlisle NB, & Woodman GF (2012). Templates for rejection : Configuring attention to ignore task-irrelevant features. Journal of experimental psychology: human perception and performance, 38(3), 580. [DOI] [PMC free article] [PubMed] [Google Scholar]
- Beck VM, & Hollingworth A (2015). Evidence for negative feature guidance in visual search is explained by spatial recoding. Journal of Experimental Psychology: Human Perception and Performance, 41(5), 1190. [DOI] [PMC free article] [PubMed] [Google Scholar]
- Bundesen C (1990). A theory of visual attention. Psychological review, 97(4), 523. [DOI] [PubMed] [Google Scholar]
- Carlisle NB (2022). Negative and positive templates : Two forms of cued attentional control. Attention, Perception, & Psychophysics, 1–11. [DOI] [PMC free article] [PubMed] [Google Scholar]
- Cavanagh JF, Zambrano-Vazquez L, & Allen JJB (2012). Theta lingua franca : A common mid-frontal substrate for action monitoring processes. Psychophysiology, 49(2), 220–238. 10.1111/j.1469-8986.2011.01293.x [DOI] [PMC free article] [PubMed] [Google Scholar]
- Chidharom M, & Carlisle NB (2023). Neurophysiological Measures of Proactive and Reactive Control in Negative Template Use. Journal of Cognitive Neuroscience. 35(7), 1063–1074. [DOI] [PMC free article] [PubMed] [Google Scholar]
- Chidharom M, & Carlisle NB Why Are Some Individuals Better in Using Negative Templates to Suppress Distractors? Exploration of Interindividual Differences in Proactive Control Efficiency. Under Review. [DOI] [PMC free article] [PubMed] [Google Scholar]
- Chidharom M, Krieg J, & Bonnefond A (2021). Impaired Frontal Midline Theta During Periods of High Reaction Time Variability in Schizophrenia. Biological Psychiatry: Cognitive Neuroscience and Neuroimaging, 6(4), 429–438. 10.1016/j.bpsc.2020.10.005 [DOI] [PubMed] [Google Scholar]
- Chidharom M, Krieg J, Pham B-T, & Bonnefond A (2021). Conjoint fluctuations of PFC-mediated processes and behavior : An investigation of error-related neural mechanisms in relation to sustained attention. Cortex, 143, 69–79. 10.1016/j.cortex.2021.07.009 [DOI] [PubMed] [Google Scholar]
- Chidharom M, Bonnefond A Mind-wandering does not always rhyme with proactive functioning! Changes in the temporal dynamics of the mPFC-mediated theta oscillations during moments of mind-wandering. Biological Psychology, 181 (108598). [DOI] [PubMed] [Google Scholar]
- Della Libera C, & Chelazzi L (2009). Learning to attend and to ignore is a matter of gains and losses. Psychological Science, 20(6), 778–784. 10.1111/j.1467-9280.2009.02360.x [DOI] [PubMed] [Google Scholar]
- Desimone R, & Duncan J (1995). Neural mechanisms of selective visual attention. Annual review of neuroscience, 18(1), 193–222. [DOI] [PubMed] [Google Scholar]
- de Vries IE, Savran E, van Driel J, & Olivers CN (2019). Oscillatory mechanisms of preparing for visual distraction. Journal of cognitive neuroscience, 31(12), 1873–1894. [DOI] [PubMed] [Google Scholar]
- Geng JJ (2014). Attentional mechanisms of distractor suppression. Current Directions in Psychological Science, 23(2), 147–153. [Google Scholar]
- Geng J, & DiQuattro N (2010). Attentional capture by a salient non-target improves target selection. Journal of Vision, 9(8), 109–109. [DOI] [PubMed] [Google Scholar]
- Geng JJ, & Duarte SE (2021). Unresolved issues in distractor suppression: Proactive and reactive mechanisms, implicit learning, and naturalistic distraction. Visual Cognition, 29(9), 608–613. 10.1080/13506285.2021.1928806 [DOI] [Google Scholar]
- Geng JJ, Won B-Y, & Carlisle NB (2019). Distractor ignoring : Strategies, learning, and passive filtering. Current Directions in Psychological Science, 28(6), 600–606. [DOI] [PMC free article] [PubMed] [Google Scholar]
- Hickey C, Chelazzi L, & Theeuwes J (2010). Reward changes salience in human vision via the anterior cingulate. The Journal of Neuroscience: The Official Journal of the Society for Neuroscience, 30(33), 11096–11103. 10.1523/JNEUROSCI.1026-10.2010 [DOI] [PMC free article] [PubMed] [Google Scholar]
- Libera CD, & Chelazzi L (2006). Visual Selective Attention and the Effects of Monetary Rewards. Psychological Science, 17(3), 222–227. 10.1111/j.1467-9280.2006.01689.x [DOI] [PubMed] [Google Scholar]
- Liesefeld HR, Lamy D, Gaspelin N, Geng J, Kerzel D, Schall J, … & Wolfe J. (2023). Terms of debate: Consensus definitions to guide the scientific discourse on visual distraction. [DOI] [PMC free article] [PubMed] [Google Scholar]
- Phelps AM, Alexander RG, & Schmidt J (2022). Negative cues minimize visual search specificity effects. Vision Research, 196, 108030. 10.1016/j.visres.2022.108030 [DOI] [PMC free article] [PubMed] [Google Scholar]
- Rajsic J, Carlisle NB, & Woodman GF (2020). What not to look for: Electrophysiological evidence that searchers prefer positive templates. Neuropsychologia, 140, 107376. [DOI] [PMC free article] [PubMed] [Google Scholar]
- Reeder RR, Olivers CN, & Pollmann S (2017). Cortical evidence for negative search templates. Visual Cognition, 25(1–3), 278–290. [Google Scholar]
- Reinhart RMG, & Woodman GF (2014). Oscillatory Coupling Reveals the Dynamic Reorganization of Large-scale Neural Networks as Cognitive Demands Change. Journal of Cognitive Neuroscience, 26(1), 175–188. 10.1162/jocn_a_00470 [DOI] [PMC free article] [PubMed] [Google Scholar]
- Schneider D, Bonmassar C, & Hickey C (2018). Motivation and short-term memory in visual search : Attention’s accelerator revisited. Cortex, 102, 45–56. 10.1016/j.cortex.2017.06.022 [DOI] [PubMed] [Google Scholar]
- Serences JT (2008). Value-based modulations in human visual cortex. Neuron, 60(6), 1169–1181. 10.1016/j.neuron.2008.10.051 [DOI] [PMC free article] [PubMed] [Google Scholar]
- Wolfe JM, Cave KR, & Franzel SL (1989). Guided search : An alternative to the feature integration model for visual search. Journal of Experimental Psychology: Human Perception and Performance, 15, 419–433. 10.1037/0096-1523.15.3.419 [DOI] [PubMed] [Google Scholar]
Associated Data
This section collects any data citations, data availability statements, or supplementary materials included in this article.