

Abstract
Rhodopsin is a member of the superfamily of G-protein-coupled receptors. This seven α-helix transmembrane protein is the visual pigment of the vertebrate rod photoreceptor cells that mediate dim light vision. In the active binding site of this protein the ligand or chromophore, 11-cis-retinal, is covalently bound via a protonated Schiff base to lysine residue 296. Here we present the complete 1H and 13C assignments of the 11-cis-retinylidene chromophore in its ligand-binding site determined with ultra high field magic angle spinning NMR. Native bovine opsin was regenerated with 99% enriched uniformly 13C-labeled 11-cis-retinal. From the labeled pigment, 13C carbon chemical shifts could be obtained by using two-dimensional radio frequency-driven dipolar recoupling in a solid-state magic angle spinning homonuclear correlation experiment. The 1H chemical shifts were assigned by two-dimensional heteronuclear (1H-13C) dipolar correlation spectroscopy with phase-modulated Lee–Goldburg homonuclear 1H decoupling applied during the t1 period. The data indicate nonbonding interactions between the protons of the methyl groups of the retinylidene ionone ring and the protein. These nonbonding interactions are attributed to nearby aromatic acid residues Phe-208, Phe-212, and Trp-265 that are in close contact with, respectively, H-16/H-17 and H-18. Furthermore, binding of the chromophore involves a chiral selection of the ring conformation, resulting in equatorial and axial positions for CH3-16 and CH3-17.
Rhodopsin is the photosensitive protein of the rod photoreceptor in the vertebrate retina that mediates dim light vision. Rhodopsin represents a paradigm for the large and diverse family of the G protein-coupled membrane receptors (GPCRs) (1). The GPCRs play an essential role in the transduction of signals from the extracellular environment across the plasma membrane to the interior of every cell type and thus represent an important target for pharmacological intervention (1). Rhodopsin consists of 348-aa residues arranged in seven transmembrane α-helices that span the disk membranes of the rod outer segment (2–4). The chromophore of rhodopsin is an 11-cis-retinylidene prosthetic group that is bound to the protein via a protonated Schiff base (pSB) linkage to amino acid residue Lys-296 (Fig. 1A) (5). The trigger for photoreceptor activation is the light-induced isomerization of the 11-cis-retinylidene ligand to the all-trans configuration.
Figure 1.

Molecular structure and International Union of Pure and Applied Chemistry numbering of the 11-cis-12-s-trans-retinylidene chromophore in rhodopsin (A) and the 11-cis-12-s-cis-retinylidene pSB model (B).
The chromophore of rhodopsin has been studied extensively during the past decades by a variety of techniques. Solid-state 13C magic angle spinning (MAS) NMR spectroscopy has been used in the past to resolve essential details of the spatial and electronic structure of the chromophore. These studies have focused on the retinylidene chain by using 13C-labeled retinals and have assigned the chemical shifts for the polyene carbon atoms (6–12).
Recently, a 10-fold 13C-labeled 11-cis-retinal was incorporated in the active site of rhodopsin (12). With solid-state two-dimensional (2D) correlation spectroscopy, detailed information on the electronic structure of the end part of the polyene near the pSB was obtained. Analysis of the NMR data showed that the excess positive charge from the pSB is partially delocalized into the polyene chain, yielding a polaronic conjugation defect close to the nitrogen of the Schiff base (12, 14). This finding demonstrates the utility of multispin labeling in combination with solid-state 2D correlation spectroscopy for the study of ligand–protein interactions for GPCRs.
In the present study uniformly 13C-labeled 11-cis-retinal is reconstituted into native opsin in the natural membrane environment, enabling a comprehensive 1H and 13C NMR assay of the electronic structure of the chromophore in the active site of the protein. The 1H and 13C shifts of the ionone ring methyl groups are strongly perturbed by close contacts with the protein environment. The results are discussed in the context of recently established structural models of the chromophore binding pocket.
Materials and Methods
Uniformly 13C-labeled retinal was prepared by total synthesis, starting from commercially available 99% enriched 13C2-acetonitrile, 13C3-acetone, 13C2-acetic acid, [2-13C]-acetic acid, and [1,2,3,4-13C4]-ethyl acetoacetate (15). The 11-cis-retinal was obtained by a standard illumination and HPLC purification procedure (9). All subsequent manipulations with the purified 11-cis isomer and rhodopsin were performed in the dark or under dim red light conditions with λ > 620 nm. Opsin was isolated from fresh cattle eyes and reconstituted with the uniformly 13C-labeled 11-cis-retinal according to standard procedures (16). The resulting A280/A500 ratio of 1.9 ± 0.1 showed that the efficiency of the regeneration was better than 95% (17).
NMR spectra were acquired at 750-MHz 1H frequency (Bruker, Karlsruhe, Germany). The sample was cooled to 223 K, and the MAS spin rate was 12 kHz for all experiments. The spectra were recorded by using 2.0-ms ramped cross polarization and two-pulse phase modulation decoupling during acquisition (18, 19). Radio frequency-driven dipolar recoupling correlation spectra were acquired by using a pathway-selective phase cycling method (20). The 2D heteronuclear correlation spectra were obtained with phase-modulated Lee–Goldburg decoupling during the t1 period (21, 22).
1H and 13C chemical shifts of the ligand are reported relative to tetramethylsilane, using the 1H and 13C chemical shift assignments of the phospholipids that are present in the rhodopsin sample as an internal reference (23, 24). In the 2D MAS heteronuclear correlation spectrum, the C⩵C carbons of the phospholipid acyl chain are easily resolved from the C-10 chromophore response. Based on a global comparison of solid- and solution-state NMR data for lipids, we assign this lipid peak to isotropic proton and carbon shifts of 5.3 ppm and 128.7 ppm, respectively. The lipid methylenic 13C is clearly resolved at 28.7 ppm (7, 12). The associated phospholipid methylenic proton response at 2.7 ppm was used to calculate a Lee Goldburg scaling factor of 0.610, which is in line with the theoretical value of 1/√3 = 0.577 (25).
To calculate the Δσ (carbon NMR ligation
shift) and Δσ
(carbon NMR ligation
shift) and Δσ (proton NMR ligation shift) for
the polyene region, shifts reported for the pSB model
N-(11-cis-12-s-cis-retinylidene)-n-propyliminium
trifluoro acetate dissolved in CDCl3 were used
(26). Both σ
(proton NMR ligation shift) for
the polyene region, shifts reported for the pSB model
N-(11-cis-12-s-cis-retinylidene)-n-propyliminium
trifluoro acetate dissolved in CDCl3 were used
(26). Both σ (isotropic proton shift of pSB model
compound) and σ
(isotropic proton shift of pSB model
compound) and σ (isotropic carbon shift of pSB
model compound) of this model compound were published, whereas only the
σ
(isotropic carbon shift of pSB
model compound) of this model compound were published, whereas only the
σ are reported for the
N-(11-cis-12-s-cis-retinylidene)-n-propyliminium
chloride that was used as a reference in our prior investigations (12).
The σ
are reported for the
N-(11-cis-12-s-cis-retinylidene)-n-propyliminium
chloride that was used as a reference in our prior investigations (12).
The σ of the ring methylene protons of the
11-cis-retinylidene pSB model has not been reported. Because
there is ample experimental evidence that in free retinylidene
compounds the chemical shifts of these protons are insensitive to the
configuration of the C11⩵C12 bond, an
all-trans-retinylidene pSB model,
N-(all-trans-12-s-cis-retinylidene)-n-butyliminium
triflate, was used to estimate the Δσ
of the ring methylene protons of the
11-cis-retinylidene pSB model has not been reported. Because
there is ample experimental evidence that in free retinylidene
compounds the chemical shifts of these protons are insensitive to the
configuration of the C11⩵C12 bond, an
all-trans-retinylidene pSB model,
N-(all-trans-12-s-cis-retinylidene)-n-butyliminium
triflate, was used to estimate the Δσ of the
ring methylene protons (27–29).
of the
ring methylene protons (27–29).
Normalization of the Δσ and
Δσ
and
Δσ is based on the difference of the proton and
carbon chemical shift scale. The protons have a chemical shift
dispersion of ≈15 ppm whereas the carbon response has a much larger
range of ≈200 ppm. Scaling according to
Δσ̃
is based on the difference of the proton and
carbon chemical shift scale. The protons have a chemical shift
dispersion of ≈15 ppm whereas the carbon response has a much larger
range of ≈200 ppm. Scaling according to
Δσ̃ (normalized proton NMR ligation
shift) = Δσ
(normalized proton NMR ligation
shift) = Δσ /15 and
Δσ̃
/15 and
Δσ̃ (normalized carbon NMR ligation
shift) = Δσ
(normalized carbon NMR ligation
shift) = Δσ /200 provides a normalized
image that is useful to compare proton and carbon NMR ligation shifts.
/200 provides a normalized
image that is useful to compare proton and carbon NMR ligation shifts.
Results
The one-dimensional 13C cross
polarization/MAS spectra from rhodopsin membranes containing either
the uniformly 13C-labeled or the unlabeled
11-cis-retinylidene chromophore are shown in Fig. 4, which
is published as supporting information on the PNAS web site,
www.pnas.org. Several narrow signals, from methyl and methylene
13C in the ionone ring of the chromophore, are
detected in the aliphatic region (5–40 ppm) of the spectrum. In the
vinylic region (120–150 ppm) the resonances of the carbon labels in
the polyene chain can be identified. The response at
σ (isotropic carbon shift of chromophore) =
127.9 ppm is superimposed on the broad natural abundance signal around
≈130 ppm of the unsaturated carbon atoms of the phospholipid acyl
chains and the aromatic side chains of the protein. Two signals with
σ
(isotropic carbon shift of chromophore) =
127.9 ppm is superimposed on the broad natural abundance signal around
≈130 ppm of the unsaturated carbon atoms of the phospholipid acyl
chains and the aromatic side chains of the protein. Two signals with
σ = 168.3 ppm and σ
 = 165.8
ppm with corresponding spinning side bands at σ
= 165.8
ppm with corresponding spinning side bands at σ =
103.9 ppm and σ
=
103.9 ppm and σ = 101.4 ppm are from vinylic
carbon atoms that are shifted downfield because of a relatively high
positive atomic charge density. Finally, the broad signal at
σ
= 101.4 ppm are from vinylic
carbon atoms that are shifted downfield because of a relatively high
positive atomic charge density. Finally, the broad signal at
σ = 175 ppm is caused by the carbonyl moieties of
peptide bonds and lipid ester groups.
= 175 ppm is caused by the carbonyl moieties of
peptide bonds and lipid ester groups.
In the composite Fig. 2, contour regions from 2D homonuclear (13C-13C) and 2D heteronuclear (1H-13C) dipolar correlation spectra of the rhodopsin containing the uniformly 13C-labeled chromophore are shown. The network of nearest-neighbor correlation signals is indicated in the plot with pairs of regular numbers. The correlations between carbon nuclei of the molecular frame C1–C15 are indicated with solid lines in the corresponding panels of the 2D radio frequency-driven dipolar recoupling spectrum. Furthermore, correlations between the carbon atoms of the molecular frame and the directly attached methyl groups are shown with dashed lines.
Figure 2.

Contour regions of the 2D homonuclear (13C-13C) and 2D heteronuclear (1H-13C) dipolar correlation spectra of the uniformly 13C-labeled retinylidene in rhodopsin. The regions shown in the Top Left (CACV) and Middle Right (CVCA) display correlations between vinylic and aliphatic carbon nuclei. Correlations between vinylic 13C are in the Middle Left (CVCV), couplings between aliphatic 13C are revealed in the Top Right (CACA). (Bottom) The correlations between protons and vinylic (CVH) or aliphatic (CAH) 13C are shown.
Even for the relatively short mixing time of 1.23 ms that was used for the radio frequency-driven dipolar recoupling experiment, relayed transfer along the 13C-labeled network gives rise to additional correlations, which are indicated in Fig. 2 with italic numbers. In particular, the methyl groups of the chromophore show relayed correlations with vinylic carbon atoms. The longer-range correlations are generally weaker than the nearest-neighbor correlations. An exception is the relatively strong long-range correlation between carbon C-4 of the ionone ring and CH3-18. Its signal is superimposed on a broad and weak cross peak of C-3 and C-4.
The 2D 13C dataset leads to a complete assignment
of the 13C responses of the chromophore (Table
1). The σ for the
polyene chain correspond with the assignments reported by Smith
et al. (7) and Verhoeven et al. (12) within the
experimental errors of 0.4 and 0.6 ppm, respectively. This finding
validates the procedure of calibrating the 13C
shift scale by using the lipid response. The 13C
assignment can be used for an assignment of the proton signals from the
chromophore bound to its receptor target in the natural membrane
environment. High-field
1H-13C heteronuclear
correlation data from the rhodopsin containing the uniformly
13C-labeled chromophore are shown in the bottom
of Fig. 2. These data were collected with a short cross polarization
contact time of 50 μs to excite predominantly heteronuclear
correlations between 13C nuclei and directly
bound protons. For most heteronuclear correlation signals, the high
resolution in the carbon dimension is sufficient to assign the
corresponding isotropic proton shifts of the chromophore
(σligH, Table 2).
The aliphatic region of the 2D
1H-13C spectrum
(CAH) is complicated because of strong overlap
with correlations involving protons attached to carbons of phospholipid
and protein. A 2D 1H-13C
heteronuclear correlation spectrum of natural abundance rhodopsin was
therefore collected to identify the “background” signals (data
not shown).
for the
polyene chain correspond with the assignments reported by Smith
et al. (7) and Verhoeven et al. (12) within the
experimental errors of 0.4 and 0.6 ppm, respectively. This finding
validates the procedure of calibrating the 13C
shift scale by using the lipid response. The 13C
assignment can be used for an assignment of the proton signals from the
chromophore bound to its receptor target in the natural membrane
environment. High-field
1H-13C heteronuclear
correlation data from the rhodopsin containing the uniformly
13C-labeled chromophore are shown in the bottom
of Fig. 2. These data were collected with a short cross polarization
contact time of 50 μs to excite predominantly heteronuclear
correlations between 13C nuclei and directly
bound protons. For most heteronuclear correlation signals, the high
resolution in the carbon dimension is sufficient to assign the
corresponding isotropic proton shifts of the chromophore
(σligH, Table 2).
The aliphatic region of the 2D
1H-13C spectrum
(CAH) is complicated because of strong overlap
with correlations involving protons attached to carbons of phospholipid
and protein. A 2D 1H-13C
heteronuclear correlation spectrum of natural abundance rhodopsin was
therefore collected to identify the “background” signals (data
not shown).
Table 1.
The complete carbon assignment σligC of the 11-cis-retinylidene chromophore of rhodopsin compared with σpSBC for N-(11-cis-retinylidene)-n-propyl-iminium trifluoro acetate in solution to obtain the ΔσligC
| Position | σligC, ppm | σpSBC, ppm* | ΔσligC, ppm |
|---|---|---|---|
| C-1 | 34.0 | 34.1 | −0.1 |
| C-2 | 40.3 | 38.9 | 1.4 |
| C-3 | 20.3 | 18.8 | 1.5 |
| C-4 | 34.0 | 33.0 | 1.0 |
| C-5 | 130.9 | 132.1 | −1.2 |
| C-6 | 137.0 | 137.2 | −0.2 |
| C-7 | 132.8 | 132.3 | 0.5 |
| C-8 | 139.1 | 137.2 | 1.9 |
| C-9 | 149.0 | 147.8 | 1.2 |
| C-10 | 127.9 | 126.4 | 1.5 |
| C-11 | 141.4 | 138.7 | 2.7 |
| C-12 | 132.2 | 128.7 | 3.5 |
| C-13 | 168.3 | 165.8 | 2.5 |
| C-14 | 122.3 | 120.5 | 1.8 |
| C-15 | 165.8 | 163.3 | 2.5 |
| C-16 | 30.6 | 28.9 | 1.7 |
| C-17 | 26.1 | 28.9 | −2.8 |
| C-18 | 21.7 | 22.1 | −0.4 |
| C-19 | 14.4 | 12.6 | 1.8 |
| C-20 | 16.3 | 18.8 | −2.5 |
Data from Shriver et al. (26).
Table 2.
The complete proton assignment σligH of the 11-cis-retinylidene chromophore in rhodopsin
| Position | σligH, ppm | σpSBH, ppm | ΔσligH, ppm |
|---|---|---|---|
| H-2 | 1.0 | 1.49* | −0.5 |
| H-3 | 1.6 | 1.63* | 0.0 |
| H-4 | 1.0 | 2.06* | −1.1 |
| H-7 | 6.4 | 6.55† | −0.2 |
| H-8 | 6.2 | 6.36† | −0.2 |
| H-10 | 6.4 | 6.98† | −0.6 |
| H-11 | 7.2 | 7.12† | 0.1 |
| H-12 | 7.2 | 6.31† | 0.9 |
| H-14 | 7.0 | 6.71† | 0.3 |
| H-15 | 8.1 | 9.19† | −1.1 |
| H-16 | 0.8 | 1.05† | −0.3 |
| H-17 | 0.6 | 1.05† | −0.5 |
| H-18 | 0.5 | 1.73† | −1.2 |
| H-19 | 2.2 | 2.14† | 0.1 |
| H-20 | 1.7 | 2.57† | −0.9 |
Discussion
By comparing the shifts for the chromophore in rhodopsin with the responses collected from model compounds, an NMR assay of the spatial and electronic structure of the chromophore can be obtained (12). The Δσlig = σlig − σpSB are listed in Tables 1 and 2 for the 13C and the 1H responses, respectively. The Δσlig reflect differences in the electronic and spatial molecular structure between the pSB model compound and the chromophore bound in the active site of the protein. They can be used as a probe for ligand–protein interactions between the chromophore and the protein binding pocket, including protein-induced conformational restraints in the ligand or electronic effects on the chromophore exerted by the protein.
It has been shown that Δσ can be quite
informative when considered at the molecular level and reveal
systematic variations in the bound ligand (12). In comparison,
Δσ
can be quite
informative when considered at the molecular level and reveal
systematic variations in the bound ligand (12). In comparison,
Δσ is even more sensitive in providing
information about nonbonding interactions between the chromophore and
the protein. A Δσ
is even more sensitive in providing
information about nonbonding interactions between the chromophore and
the protein. A Δσ ≥ 0.5 ppm can be considered
highly significant on the proton shift scale of ≈15 ppm. Thus the
combination of Δσ
≥ 0.5 ppm can be considered
highly significant on the proton shift scale of ≈15 ppm. Thus the
combination of Δσ and
Δσ
and
Δσ can give comprehensive information about
localized nonbonding interactions between ligand and receptor.
can give comprehensive information about
localized nonbonding interactions between ligand and receptor.
Fig. 3A provides a visual
representation of the Δσ and
Δσ
and
Δσ of the chromophore in rhodopsin. The
color-encoded NMR ligation shift patterns can be used for a discussion
of local protein–ligand interactions. In addition, the scaled
Δσ̃
of the chromophore in rhodopsin. The
color-encoded NMR ligation shift patterns can be used for a discussion
of local protein–ligand interactions. In addition, the scaled
Δσ̃ and Δσ̃
 provide a view of the relative magnitude of the
13C and 1H effects and an
overview of significant ligand–protein interactions acting on the
chromophore bound in the active site of the protein (Fig.
3B).
provide a view of the relative magnitude of the
13C and 1H effects and an
overview of significant ligand–protein interactions acting on the
chromophore bound in the active site of the protein (Fig.
3B).
Figure 3.
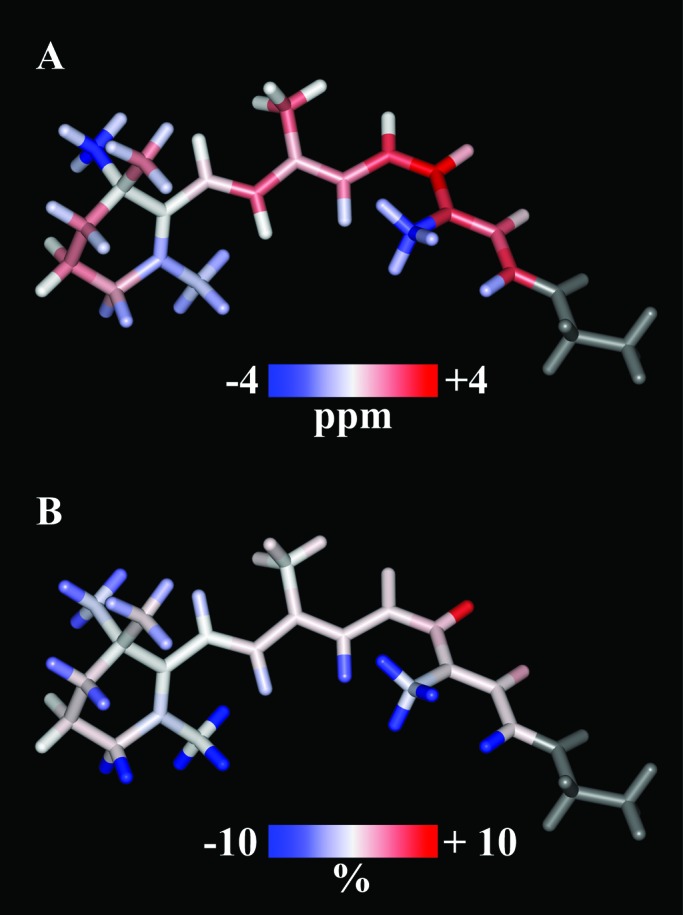
Visual representation of (A) the
Δσ and Δσ
 NMR ligation
shifts in Tables 1 and 2 and (B) normalized
Δσ̃
NMR ligation
shifts in Tables 1 and 2 and (B) normalized
Δσ̃ and Δσ̃
 .
The model corresponds with the image of the ground state structure
calculated with Carr–Parrinello molecular dynamics (10, 14). Blue and
red colors reflect the upfield and downfield Δσlig,
respectively, and the larger the shift the darker the color.
.
The model corresponds with the image of the ground state structure
calculated with Carr–Parrinello molecular dynamics (10, 14). Blue and
red colors reflect the upfield and downfield Δσlig,
respectively, and the larger the shift the darker the color.
Charge Delocalization in the Polyene Chain of the 11-cis-Retinylidene Chromophore.
Previous experiments already revealed downfield
Δσ for the C10–C15 region in the tail end of
the polyene chain of the retinylidene in rhodopsin in comparison with
N-(11-cis-retinylidene)-n-propyliminium chloride
(12). The Δσ
for the C10–C15 region in the tail end of
the polyene chain of the retinylidene in rhodopsin in comparison with
N-(11-cis-retinylidene)-n-propyliminium chloride
(12). The Δσ was ascribed to three synergistic
contributions leading to an excess of positive charge in the polyene:
(i) the electronegative nitrogen, (ii) the
protonation, and (iii) the counterion strength. The
color-encoded data in Fig. 3A show a similar pattern for the
Δσ
was ascribed to three synergistic
contributions leading to an excess of positive charge in the polyene:
(i) the electronegative nitrogen, (ii) the
protonation, and (iii) the counterion strength. The
color-encoded data in Fig. 3A show a similar pattern for the
Δσ of the vinylic carbon nuclei in the tail end
of the polyene chain of the chromophore, with the largest downfield
shift for C-12, Δσ
of the vinylic carbon nuclei in the tail end
of the polyene chain of the chromophore, with the largest downfield
shift for C-12, Δσ = 3.5 ppm (Table 1).
The stronger positive charge delocalization into the rhodopsin polyene compared with the model compounds is thought to be caused by electrostatic interactions with polar or negatively charged side chains of amino acid residues that are in close contact with the tail end of the polyene (30–32). Based on earlier solid-state NMR studies on 15N-Lys-labeled rhodopsin, an effective center-to-center distance between the counterion and the pSB nitrogen of 0.43 ± 0.01 nm was estimated (33, 34). This effective radius is larger than the 0.34 nm derived from the recently published crystal structure and implies the presence of a complex counterion (3, 4). Such a complex counterion could be organized around a hydrogen-bonded network positioning a water molecule between the positively charged nitrogen of the pSB and the negatively charged carboxylate of Glu-113 (34). Several studies showed that upon addition of D2O the proton of the pSB exhibits rapid H-D exchange already in the dark, indicating that the Schiff base region is easily accessible for bulk water molecules (35, 36).
The Palczewski model shows another glutamic acid residue, Glu-181, in
the second extracellular loop, and a tyrosine residue, Tyr-268, in
transmembrane helix VI, to be in close contact with the tail end of the
polyene (3, 4). Site-directed mutagenesis studies of either residue
leads to significant shifts in the spectral properties of the pigment
(37, 38). Therefore, similar to Glu-113, Glu-181 and Tyr-268 may be
involved in modulating the positive charge delocalization in the
polyene, resulting in the observed large downfield
Δσ of the carbon resonances in the tail end of
the polyene chain. In addition, these two amino acid residues might
contribute to a hydrogen-bonded network. Ab initio molecular
dynamics simulations provided evidence that the
13C shifts of the carbons of the tail end of the
polyene are sensitive to the position of the counterion (30). These
simulations also suggest that other charged residues that are located
in the vicinity of the C10-C13 region, like Glu-181 and Tyr-268, may
contribute to the observed downfield Δσ
of the carbon resonances in the tail end of
the polyene chain. In addition, these two amino acid residues might
contribute to a hydrogen-bonded network. Ab initio molecular
dynamics simulations provided evidence that the
13C shifts of the carbons of the tail end of the
polyene are sensitive to the position of the counterion (30). These
simulations also suggest that other charged residues that are located
in the vicinity of the C10-C13 region, like Glu-181 and Tyr-268, may
contribute to the observed downfield Δσ .
.
Conformation of the 11-cis-Retinylidene Chromophore.
By using a uniformly 13C-labeled chromophore, the assay of the charge delocalization is extended to the ring end of the polyene. In the past, NMR studies with 5-13C-labeled all-trans-retinal reconstituted into bacteriorhodopsin have demonstrated that the counterion strength affects the shift of carbon C-5 in the ionone ring of the chromophore (39, 40). This finding contrasts with the data for rhodopsin, because the charge delocalization appears to be restricted to the region between carbon C-7 and C-15 (Fig. 3A). The difference between the two retinal proteins may be related to the conformation of the C6–C7 single bond. At an early stage it was established with MAS NMR shift tensor measurements using rhodopsin reconstituted with 13C-5-labeled retinal and retinoic acid model compounds that the 6–7 single bond has a 6-s-cis conformation in rhodopsin, which is different from the 6-s-trans-retinylidene chromophore in bacteriorhodopsin (7).
Recent deuterium MAS experiments on oriented rhodopsin preparations have been interpreted in terms of a 6-s-trans conformation of the chromophore (41). In contrast, the x-ray data point to a 6-s-cis structure, but the resolution is insufficient to rule out the possibility of a mixture of 6-s-cis and 6-s-trans (4). MAS NMR chemical shifts have been shown to be a sensitive indicator of this bond conformation, and our shifts match those of the previous MAS NMR study, thus reconfirming the 6-s-cis conformation (7, 39). Additionally, as can be seen in Fig. 2, there is no evidence of signal doubling or splitting and therefore the ring conformation must be unique.
In the past, NMR studies have provided convincing evidence for a conformational change leading to a nonplanar C10–C13 segment for the polyene chain in the chromophore relative to the models in solution (Fig. 1) (9, 10). Because the 12-s-cis conformation is energetically favorable over the 12-s-trans, the equilibrium will be shifted in solution toward 12-s-cis (Fig. 1B) (42). In the protein, however, there is a nonplanar 12-s-trans conformation (Fig. 1A) (4, 10, 43). Also the most recent refined x-ray model for rhodopsin includes an out-of-plane distortion in the C10–C13 segment with a dihedral angle for C10–C11–C12–C13 of ϕ = 7.9° (4). This distortion is in line with the torsional angle of C10–C11–C12–C13 of ϕ = 17°, which was calculated from the NMR distance constraints with Carr–Parrinello molecular dynamics (44). The out-of-plane distortion is distributed over several bonds (10).
The 1H shift data provide additional qualitative
support for a conformational change involving the C10–C13 segment of
the chromophore by binding to the protein, because the
σ of the 12-s-trans chromophore in
rhodopsin is different from the σ
of the 12-s-trans chromophore in
rhodopsin is different from the σ of the pSB
model in the 12-s-cis conformation in solution.
of the pSB
model in the 12-s-cis conformation in solution.
The downfield Δσ̃ of H-12 and H-14 may be
caused by a reduced intramolecular steric interaction between
CH3-20 and the nearby protons H-12 and H-14,
relative to the pSB model. In addition, the upfield
Δσ̃
of H-12 and H-14 may be
caused by a reduced intramolecular steric interaction between
CH3-20 and the nearby protons H-12 and H-14,
relative to the pSB model. In addition, the upfield
Δσ̃ of H-10 and H-20 may reflect the
steric interaction between H-10 and the methyl group C-20 in the
11-cis-12-s-trans-retinylidene chromophore bound
to the protein, which is released in the free 12-s-cis
conformation. Furthermore, the observed upfield
Δσ
of H-10 and H-20 may reflect the
steric interaction between H-10 and the methyl group C-20 in the
11-cis-12-s-trans-retinylidene chromophore bound
to the protein, which is released in the free 12-s-cis
conformation. Furthermore, the observed upfield
Δσ = −2.5 ppm of CH3-20
is in line with a distorted s-trans conformation of the 12-s
bond. Addition of a methyl group at C-10, giving 10-methylrhodopsin,
yields a larger out-of-plane distortion in the isomerization region
compared with rhodopsin and an additional upfield
Δσ
= −2.5 ppm of CH3-20
is in line with a distorted s-trans conformation of the 12-s
bond. Addition of a methyl group at C-10, giving 10-methylrhodopsin,
yields a larger out-of-plane distortion in the isomerization region
compared with rhodopsin and an additional upfield
Δσ = −1.6 ppm compared with the C-20 response
in rhodopsin (10, 45, 46). This finding suggests a correlation between
torsion and the 13C-20 shift. Finally, a
relatively large Δσ
= −1.6 ppm compared with the C-20 response
in rhodopsin (10, 45, 46). This finding suggests a correlation between
torsion and the 13C-20 shift. Finally, a
relatively large Δσ = −1.1 ppm is detected for
the H-15. This Δσ
= −1.1 ppm is detected for
the H-15. This Δσ may be produced by a
difference in the conformation around the C14–C15 bond between the
11-cis-retinylidene chromophore and the pSB model compound
or by an interaction with a nearby protein residue (3, 4, 33, 34).
may be produced by a
difference in the conformation around the C14–C15 bond between the
11-cis-retinylidene chromophore and the pSB model compound
or by an interaction with a nearby protein residue (3, 4, 33, 34).
The absence of conformational shifts for C-7, C-8, and C-19 provides strong evidence for a highly similar electronic and spatial conformation of the rhodopsin chromophore and the pSB model. In particular, Fourier transform IR and resonance Raman spectroscopic studies have been interpreted in terms of a close contact between the C-19 methyl group and the surrounding protein (47, 48). Although these studies indicate strong ligand–protein interactions for CH3-19, it is clear from the NMR that the protein has no significant effect on the conformation of the chromophore around C-19.
Finally, both methyl groups C-16 and C-17 of the pSB model compound in
solution resonate with σ = 28.9 ppm (26). These
methyl groups have significantly different shifts in rhodopsin (54).
One methyl group is detected with σ
= 28.9 ppm (26). These
methyl groups have significantly different shifts in rhodopsin (54).
One methyl group is detected with σ = 26.1 ppm,
corresponding with a Δσ
= 26.1 ppm,
corresponding with a Δσ of −2.8 ppm, whereas
the other resonates with σ
of −2.8 ppm, whereas
the other resonates with σ = 30.6 ppm, a
Δσ
= 30.6 ppm, a
Δσ of +1.7 ppm. In contrast, the
Δσ
of +1.7 ppm. In contrast, the
Δσ = −0.5 ppm and −0.3 ppm for the protons of
these two methyl groups are both upfield and of comparable magnitude.
= −0.5 ppm and −0.3 ppm for the protons of
these two methyl groups are both upfield and of comparable magnitude.
The single resonance of CH3-16 and
CH3-17 of the pSB model compound in solution is
caused by motional averaging between the equatorial and axial
conformation for the two methyl groups attached to the
sp3-hybridized C-1 of the six-membered ring (49).
Evidently the protein prevents the ring flip that occurs in solution.
In this way, our data contribute to converging evidence that the
chromophore conformation is unique with an equatorial position for
CH3-16 and an axial CH3-17
methyl caused by the steric constraints from the protein binding pocket
(54). The relatively large upfield Δσ of C-17
can be explained in terms of a γ effect caused by steric hindrance
between the protons of C-17 and H-3 (50, 54). Because the
CH3-16 occupies an equatorial position, it
experiences weaker steric interactions than in the pSB model in
solution, which can explain the observed downfield NMR ligation shift.
of C-17
can be explained in terms of a γ effect caused by steric hindrance
between the protons of C-17 and H-3 (50, 54). Because the
CH3-16 occupies an equatorial position, it
experiences weaker steric interactions than in the pSB model in
solution, which can explain the observed downfield NMR ligation shift.
NMR Ligation Shifts in the Ionone Moiety of the Chromophore Indicate Pronounced Interactions with the Protein Environment.
Binding studies on rhodopsin using acyclic retinal analogs have shown that the ionone moiety plays a central role in the formation of a stable photoactive pigment. In particular, the methyl groups attached to the ring appear to be essential for binding (51). Reconstitution studies have provided evidence for specific protein–ligand interactions, which are essential for correct positioning of the ionone ring and in particular the methyl groups. The complete proton and carbon assignments of the ionone moiety of the chromophore provide a view on the molecular details of these interactions with atomic selectivity.
In particular, the proton shifts of the ligand can reveal the
presence of aromatic side chains in the binding pocket. Calculations of
ring current intensities demonstrate that an extension of the
delocalization of electrons in an aromatic system produces an increase
of the magnitude of the ring current effect that leads to upfield
proton shifts (52). These ring current effects can become highly
significant on the proton shift scale of ≈15 ppm. The
Δσ̃ reveal relatively strong
ligand–receptor interactions for the ionone ring of the chromophore.
The CH3-18 protons show the largest upfield
Δσ̃
reveal relatively strong
ligand–receptor interactions for the ionone ring of the chromophore.
The CH3-18 protons show the largest upfield
Δσ̃ observed in the chromophore. The
protons of the adjacent carbon C-4 also demonstrate a large upfield
Δσ̃
observed in the chromophore. The
protons of the adjacent carbon C-4 also demonstrate a large upfield
Δσ̃ . These relatively large
Δσ̃
. These relatively large
Δσ̃ indicate the presence of a tryptophan
amino acid residue (52). Earlier studies already suggested that a
tryptophan residue should be located in the vicinity of the ionone ring
(13, 53). Based on these studies and the recently published x-ray
model, a tryptophan residue at a distance of ≈3.8 Å to C-18, Trp-265
in transmembrane helix VI, is most likely responsible for these
interactions (3, 4). The Δσ̃
indicate the presence of a tryptophan
amino acid residue (52). Earlier studies already suggested that a
tryptophan residue should be located in the vicinity of the ionone ring
(13, 53). Based on these studies and the recently published x-ray
model, a tryptophan residue at a distance of ≈3.8 Å to C-18, Trp-265
in transmembrane helix VI, is most likely responsible for these
interactions (3, 4). The Δσ̃ for the
CH3-16 and CH3-17 can be
explained in terms of ring current effects from two nearby
phenylalanine side chains, Phe-208 and Phe-212 of transmembrane helix V
(3, 44, 52). According to the x-ray model, Phe-212 is also located
close to the methylene protons attached to C-2 (≈4 Å), which is in
line with the observed upfield Δσ̃
for the
CH3-16 and CH3-17 can be
explained in terms of ring current effects from two nearby
phenylalanine side chains, Phe-208 and Phe-212 of transmembrane helix V
(3, 44, 52). According to the x-ray model, Phe-212 is also located
close to the methylene protons attached to C-2 (≈4 Å), which is in
line with the observed upfield Δσ̃ for the
C-2 protons. In this way the NMR data contribute to converging evidence
that nonbonding interactions between the methyl groups and the nearby
phenylalanines contribute to the “scaffolding” of the protein
structure and the retinylidene binding pocket.
for the
C-2 protons. In this way the NMR data contribute to converging evidence
that nonbonding interactions between the methyl groups and the nearby
phenylalanines contribute to the “scaffolding” of the protein
structure and the retinylidene binding pocket.
Other parts of the ionone moiety appear less important for binding to the protein. The carbon responses of C-2 and C-3 are relatively broad, which indicates disorder of this part of the ring. This finding correlates with ligand analog experiments, which demonstrated that acyclic retinal analogs could bind as well. It also suggests that C-2 and C-3 play only a modest part in rhodopsin–ligand recognition in the dark inactive state of the receptor (51).
It is difficult to attribute the small Δσ̃ to a specific mechanism. For instance, C-5 shows a small upfield
Δσ
to a specific mechanism. For instance, C-5 shows a small upfield
Δσ = −1.2 ppm, with
Δσ̃
= −1.2 ppm, with
Δσ̃ = −0.4 ppm for the adjacent
CH3-18. The x-ray model and rotational resonance
solid-state MAS NMR studies demonstrate that the C5–C8 segment has a
twisted out-of-plane conformation (3, 4, 54). Ab
initio calculations on pSB models suggested that the C5⩵C6 bond
and the adjacent methyl group C-18 lie in one plane (42).
Conformational distortions might be the origin of the observed small
Δσ̃
= −0.4 ppm for the adjacent
CH3-18. The x-ray model and rotational resonance
solid-state MAS NMR studies demonstrate that the C5–C8 segment has a
twisted out-of-plane conformation (3, 4, 54). Ab
initio calculations on pSB models suggested that the C5⩵C6 bond
and the adjacent methyl group C-18 lie in one plane (42).
Conformational distortions might be the origin of the observed small
Δσ̃ for C-5 and C18. In addition, the
x-ray model of rhodopsin indicates that the carboxylic group of a
glutamic acid residue, Glu-122, is in close contact to C-5 (≈3.8 Å)
(3, 4). Interaction with the side chain of such a polar amino acid
could also result in a small upfield Δσ
for C-5 and C18. In addition, the
x-ray model of rhodopsin indicates that the carboxylic group of a
glutamic acid residue, Glu-122, is in close contact to C-5 (≈3.8 Å)
(3, 4). Interaction with the side chain of such a polar amino acid
could also result in a small upfield Δσ .
.
Conclusions
High-field solid-state 2D homonuclear and 2D heteronuclear MAS NMR dipolar correlation spectroscopy on rhodopsin reconstituted with a uniformly 13C-labeled 11-cis-retinylidene chromophore provided a complete 13C and 1H chemical shift assignment for the chromophore. The Δσlig and Δσ̃lig reflect the spatial and electronic structure of the chromophore in the active site of rhodopsin relative to the pSB model in solution and thus provide a detailed view on the mechanisms of ligand–protein interactions with atomic selectivity.
Pronounced Δσ̃ are observed for the
methyl protons of the ring moiety. The data provide converging evidence
for nonbonding interactions between the chromophore and the protein
binding pocket involving the aromatic amino acid residues Phe-208,
Phe-212, and Trp-265 that are in close contact with H-16/H-17 and
H-18, respectively. The Δσ̃
are observed for the
methyl protons of the ring moiety. The data provide converging evidence
for nonbonding interactions between the chromophore and the protein
binding pocket involving the aromatic amino acid residues Phe-208,
Phe-212, and Trp-265 that are in close contact with H-16/H-17 and
H-18, respectively. The Δσ̃ in the polyene
chain and the relatively large downfield Δσ
in the polyene
chain and the relatively large downfield Δσ observed for CH3-20 are consistent with a
nonplanar conformation of the 12-s bond. Finally, binding of the
chromophore involves chiral selection by fixation of the ring
puckering, which results in well-defined axial and equatorial positions
for CH3-17 and CH3-16.
observed for CH3-20 are consistent with a
nonplanar conformation of the 12-s bond. Finally, binding of the
chromophore involves chiral selection by fixation of the ring
puckering, which results in well-defined axial and equatorial positions
for CH3-17 and CH3-16.
This study shows that the combination of a uniformly 13C-labeled ligand incorporated into the active binding site of a GPCR with 2D solid-state NMR correlation spectroscopy can provide detailed information about ligand–protein interaction patterns. In this way a solid-state NMR “snapshot” of the spatial and electronic ground state structure of a ligand bound to its GPCR target in the natural membrane is obtained.
Supplementary Material
Acknowledgments
We thank J. Hollander, C. Erkelens, and F. Lefeber for assistance with the MAS NMR experiments. Cambridge Isotope Laboratories is gratefully acknowledged for their kind gift of all 13C-labeled starting materials that were used for the preparation of the uniformly 13C-labeled retinal. H.J.M.d.G. is a recipient of a pioneer award of the Chemical Science section of the Netherlands Organization for Research (NWO). The 750-MHz instrumentation was financed in part by Demonstration Project Grant BIO4-CT97-2101 (DG12-SSMI) of the commission of the European Communities.
Abbreviations
- GPCR
G protein-coupled receptor
- pSB
protonated Schiff base
- MAS
magic angle spinning
- 2D
two-dimensional
- Δσ

proton NMR ligation shift
- Δσ

carbon NMR ligation shift
- Δσ̃

normalized proton NMR ligation shift
- Δσ̃

normalized carbon NMR ligation shift
- σ

isotropic proton shift of chromophore
- σ

isotropic carbon shift of chromophore
- σ

isotropic proton shift of pSB model compound
- σ

isotropic carbon shift of pSB model compound
Footnotes
This paper was submitted directly (Track II) to the PNAS office.
References
- 1.Baldwin J M, Schertler G F X, Unger V M. J Mol Biol. 1997;272:144–164. doi: 10.1006/jmbi.1997.1240. [DOI] [PubMed] [Google Scholar]
- 2.Unger V M, Hargrave P A, Baldwin J M, Schertler G F X. Nature (London) 1997;389:203–206. doi: 10.1038/38316. [DOI] [PubMed] [Google Scholar]
- 3.Palczewski K, Kumasaka T, Hori T, Behnke C A, Motoshima H, Fox B A, Le Trong I, Teller D C, Okada T, Stenkamp R E, et al. Science. 2000;289:739–745. doi: 10.1126/science.289.5480.739. [DOI] [PubMed] [Google Scholar]
- 4.Teller D C, Okada T, Behnke C A, Palczewski K, Stenkamp R E. Biochemistry. 2001;40:7761–7772. doi: 10.1021/bi0155091. [DOI] [PMC free article] [PubMed] [Google Scholar]
- 5.Gärtner W. Angew Chem Int Ed Engl. 2001;40:2977–2981. doi: 10.1002/1521-3773(20010817)40:16<2977::AID-ANIE2977>3.0.CO;2-E. [DOI] [PubMed] [Google Scholar]
- 6.Mollevanger L C, Kentgens A P, Pardoen J A, Courtin J M, Veeman W S, Lugtenburg J, de Grip W J. Eur J Biochem. 1987;163:9–14. doi: 10.1111/j.1432-1033.1987.tb10729.x. [DOI] [PubMed] [Google Scholar]
- 7.Smith S O, Palings I, Copié V, Raleigh D P, Courtin J, Pardoen J A, Lugtenburg J, Mathies R A, Griffin R G. Biochemistry. 1987;26:1606–1611. doi: 10.1021/bi00380a018. [DOI] [PubMed] [Google Scholar]
- 8.Smith S O, Courtin J, de Groot H, Gebhard R, Lugtenburg J. Biochemistry. 1991;30:7409–7415. doi: 10.1021/bi00244a007. [DOI] [PubMed] [Google Scholar]
- 9.Feng X, Verdegem P J E, Lee Y K, Sandström D, Edén M, Bovee-Geurts P, de Grip W J, Lugtenburg J, de Groot H J M, Levitt M H. J Am Chem Soc. 1997;119:6853–6857. [Google Scholar]
- 10.Verdegem P J E, Bovee-Geurts P H M, de Grip W J, Lugtenburg J, de Groot H J M. Biochemistry. 1999;38:11316–11324. doi: 10.1021/bi983014e. [DOI] [PubMed] [Google Scholar]
- 11.de Groot H J M. Curr Opin Struct Biol. 2000;10:593–600. doi: 10.1016/s0959-440x(00)00136-6. [DOI] [PubMed] [Google Scholar]
- 12.Verhoeven M A, Creemers A F L, Bovee-Geurts P H M, de Grip W J, Lugtenburg J, de Groot H J M. Biochemistry. 2001;40:3282–3288. doi: 10.1021/bi0023798. [DOI] [PubMed] [Google Scholar]
- 13.Kochendoerfer G G, Kaminaka S, Mathies R A. Biochemistry. 1997;36:13153–13159. doi: 10.1021/bi971541c. [DOI] [PubMed] [Google Scholar]
- 14.Buda F, de Groot H J M, Bifone A. Phys Rev Lett. 1996;77:4474–4477. doi: 10.1103/PhysRevLett.77.4474. [DOI] [PubMed] [Google Scholar]
- 15.Lugtenburg J, Creemers A F L, Verhoeven M A, van Wijk A A C, Verdegem P J E, Monnee M C F, Jansen F J H M. Pure Appl Chem. 1999;71:2245–2251. [Google Scholar]
- 16.DeGrip W J, Daemen F J M, Bonting S L. Methods Enzymol. 1980;67:301–320. doi: 10.1016/s0076-6879(80)67038-4. [DOI] [PubMed] [Google Scholar]
- 17.De Grip W J. Methods Enzymol. 1982;81:197–207. doi: 10.1016/s0076-6879(82)81032-x. [DOI] [PubMed] [Google Scholar]
- 18.Pines A, Gibby M G, Waugh J S. J Chem Phys. 1973;59:569–573. [Google Scholar]
- 19.Balaban T S, Holzwarth A R, Schaffner K, Boender G J, de Groot H J M. Biochemistry. 1995;34:15259–15266. doi: 10.1021/bi00046a034. [DOI] [PubMed] [Google Scholar]
- 20.Boender G J, Raap J, Prytulla S, Oschkinat H, de Groot H J M. Chem Phys Lett. 1995;237:502–508. [Google Scholar]
- 21.Van Rossum B-J, Boender G J, de Groot H J M. J Magn Reson A. 1996;120:274–277. [Google Scholar]
- 22.Vinogradov E, Madhu P K, Vega S. Chem Phys Lett. 1999;314:443–450. [Google Scholar]
- 23.Brown M F, Miljanich G P, Dratz E A. Proc Natl Acad Sci USA. 1977;74:1978–1982. doi: 10.1073/pnas.74.5.1978. [DOI] [PMC free article] [PubMed] [Google Scholar]
- 24.Zumbulyadis N, O'Brien D F. Biochemistry. 1979;18:5427–5432. doi: 10.1021/bi00591a027. [DOI] [PubMed] [Google Scholar]
- 25.Van Rossum B-J, Förster H, de Groot H J M. J Magn Reson. 1997;124:516–519. [Google Scholar]
- 26.Shriver J W, Mateescu G D, Abrahamson E W. Biochemistry. 1979;18:4785–4792. doi: 10.1021/bi00589a004. [DOI] [PubMed] [Google Scholar]
- 27.Liu R S H, Asato A E. Tetrahedron. 1984;40:1931–1969. [Google Scholar]
- 28.Englert G. In: Carotenoids: Spectroscopy. Britton G, Liaaen-Jensen S, Pfander H, editors. 1B. Basel: Birkhäuser; 1995. pp. 163–167. [Google Scholar]
- 29.Elia G R, Childs R F, Britten J F, Yang D S C, Santarsiero B D. Can J Chem. 1996;74:591–601. [Google Scholar]
- 30.La Penna G, Buda F, Bifone A, de Groot H J M. Chem Phys Lett. 1998;294:447–453. [Google Scholar]
- 31.Buda F, Giannozzi P, Mauri F. J Phys Chem. 2000;104:9048–9053. [Google Scholar]
- 32.Buda F, Touw S I E, de Groot H J M. In: Perspectives on Solid-State NMR in Biology. Kiihne S, de Groot H J M, editors. Dordrecht, The Netherlands: Kluwer; 2001. pp. 111–122. [Google Scholar]
- 33.Eilers M, Reeves P J, Ying W, Khorana H G, Smith S O. Proc Natl Acad Sci USA. 1999;96:487–492. doi: 10.1073/pnas.96.2.487. [DOI] [PMC free article] [PubMed] [Google Scholar]
- 34.Creemers A F L, Klaassen C H W, Bovee-Geurts P H M, Kelle R, Kragl U, Raap J, de Grip W J, Lugtenburg J, de Groot H J M. Biochemistry. 1999;38:7195–7199. doi: 10.1021/bi9830157. [DOI] [PubMed] [Google Scholar]
- 35.Oseroff A R, Callender R H. Biochemistry. 1974;13:4243–4248. doi: 10.1021/bi00717a027. [DOI] [PubMed] [Google Scholar]
- 36.Mathies R A, Oseroff A R, Stryer L. Proc Natl Acad Sci USA. 1976;73:1–5. doi: 10.1073/pnas.73.1.1. [DOI] [PMC free article] [PubMed] [Google Scholar]
- 37.Nakayama T A, Khorana H G. J Biol Chem. 1991;266:4269–4275. [PubMed] [Google Scholar]
- 38.Terakita A, Yamashita T, Shichida Y. Proc Natl Acad Sci USA. 2000;97:14263–14267. doi: 10.1073/pnas.260349597. [DOI] [PMC free article] [PubMed] [Google Scholar]
- 39.Harbison G, Mulder P, Pardoen H, Lugtenburg J, Herzfeld J, Griffin R G. J Am Chem Soc. 1985;107:4809–4816. [Google Scholar]
- 40.Hu J, Griffin R G, Herzfeld J. Proc Natl Acad Sci USA. 1994;91:8880–8884. doi: 10.1073/pnas.91.19.8880. [DOI] [PMC free article] [PubMed] [Google Scholar]
- 41.Gröbner G, Burnett I J, Glaubitz C, Choi G, Mason A J, Watts A W. Nature (London) 2000;405:810–813. doi: 10.1038/35015604. [DOI] [PubMed] [Google Scholar]
- 42.Terstegen F, Buss V. J Mol Struct. 1996;369:53–65. [Google Scholar]
- 43.Lin S W, Groesbeek M, van der Hoef I, Verdegem P, Lugtenburg J, Mathies R A. J Phys Chem B. 1998;102:2787–2806. [Google Scholar]
- 44.Bifone A, de Groot H J M, Buda F. J Phys Chem B. 1997;101:2954–2958. [Google Scholar]
- 45.Tonelli A E. NMR Spectroscopy and Polymer Microstructure: The Conformational Connection. Weinheim: VCH; 1989. pp. 43–53. [Google Scholar]
- 46.De Lange F, Bovee-Geurts P H, Van Oostrum J, Portier M D, Verdegem P J, Lugtenburg J, De Grip W J. Biochemistry. 1998;37:1411–1420. doi: 10.1021/bi972397y. [DOI] [PubMed] [Google Scholar]
- 47.Eyring G, Curry B, Mathies R A, Fransen R, Palings I, Lugtenburg J. Biochemistry. 1980;19:2410–2418. doi: 10.1021/bi00552a020. [DOI] [PubMed] [Google Scholar]
- 48.Ganter U M, Schmid E D, Perez-Sala D, Rando R R, Siebert F. Biochemistry. 1989;28:5954–5962. doi: 10.1021/bi00440a036. [DOI] [PubMed] [Google Scholar]
- 49.Breitmaier E, Voelter W. Carbon-13 NMR Spectroscopy. 3rd Ed. Weinheim: VCH; 1987. pp. 115–116. [Google Scholar]
- 50.Günther H. NMR Spectroscopy. 2nd Ed. Chichester, U.K.: Wiley; 1995. pp. 501–504. [Google Scholar]
- 51.Nakanishi K, Crouch R. Isr J Chem. 1995;35:253–272. [Google Scholar]
- 52.Giessner-Prettre C, Pullman B. J Theor Biol. 1971;31:287–294. doi: 10.1016/0022-5193(71)90188-3. [DOI] [PubMed] [Google Scholar]
- 53.Lin S W, Sakmar T P. Biochemistry. 1996;35:11149–11159. doi: 10.1021/bi960858u. [DOI] [PubMed] [Google Scholar]
- 54. Spooner, P. J. R., Sharples, J. M., Verhoeven, M. A., Lugtenburg, J., Glaubitz, C. & Watts, A. (2002) Biochemistry,in press. [DOI] [PubMed]
Associated Data
This section collects any data citations, data availability statements, or supplementary materials included in this article.