

Abstract
Soluble N-ethylmaleimide-sensitive factor attachment protein receptor (SNARE) proteins are required for intracellular membrane fusion, and are differentially localized throughout the cell. SNAREs on vesicle and target membranes contain “SNARE motifs” which interact to form a four-helix bundle that contributes to the fusion of two membranes. SNARE motif sequences fall into four classes, homologous to the neuronal proteins syntaxin 1a, VAMP 2, and the N- and C-terminal SNARE motifs of SNAP-25 (S25N and S25C), and it is thought that one member from each class interacts to form a SNARE complex. Many SNAREs also feature N-terminal domains believed to function in regulating SNARE complex assembly or other aspects of vesicle transport. Syntaxin 6 is a SNARE found primarily in endosomal transport vesicles and whose SNARE motif shows significant homology to both syntaxin 1a and S25C. The crystal structure of the syntaxin 6 N-terminal domain reveals strong structural similarity with the N-terminal domains of syntaxin family members syntaxin 1a, Sso1p, and Vam3p, despite a very low level of sequence similarity. The syntaxin 6 SNARE motif can substitute for S25C in in vitro binding experiments, supporting the classification of syntaxin 6 as an S25C family member. Secondary structure prediction of SNARE proteins shows that the N-terminal domains of many syntaxin, S25N, and S25C family members are likely to be similar to one another, but are distinct from those of VAMP family members, indicating that syntaxin, S25N, and S25C SNAREs may have shared a common ancestor.
Transport of cargo between intracellular compartments is accomplished through fusion of membranous transport vesicles with target membrane structures. Several families of proteins mediate this process. The cytoplasmic regions of soluble N-ethylmaleimide-sensitive factor attachment protein receptor (SNARE) proteins found on transport vesicles and target membranes interact and form a four-helix coiled coil, thereby linking the membrane structures and possibly providing a mechanism to overcome the energetic barrier to fusing two lipid bilayers (1, 2). SNAREs mediate diverse membrane fusion events such as neurotransmitter-filled vesicles fusing with the presynaptic plasma membrane, homotypic vacuole fusion in yeast, and formation of Golgi stacks (3).
The SNAREs contain highly homologous regions, termed SNARE motifs, of ≈70 amino acids that form one or more helices of the coiled-coil SNARE complex. In the neuron, VAMP2 and syntaxin 1a each contribute one helix, and SNAP-25 contributes two helices to the SNARE complex (1, 4). SNARE motifs can be classified into four families: those with homology to VAMP2, syntaxin 1a, or the N- or C-terminal SNARE motifs of SNAP-25 (S25N or S25C, respectively; ref. 5). Proteins belonging to the VAMP family contain a conserved Arg at a typically hydrophobic heptad repeat position (r-SNAREs), whereas SNARE proteins belonging to the other three families each contain a conserved Gln residue in the equivalent position (q-SNAREs; ref. 6). The three-dimensional structure of the neuronal core SNARE complex shows that these conserved residues form a polar layer in the hydrophobic core of the four-stranded coiled coil (7). It has been proposed that one protein from each of the four families is required to form a functional SNARE complex (5).
Syntaxin 6 is a q-SNARE found in endosomal transport vesicles. Immunoelectron microscopy studies suggest that syntaxin 6 participates in vesicular trafficking between the trans-Golgi network and endosomes or lysosomes (8). Syntaxin 6 contains an N-terminal domain followed by a SNARE motif and a single C-terminal membrane anchor. This primary structure organization, as well as significant homology to several syntaxin family members in the SNARE motif, led to the classification of this protein as a syntaxin family member (9). Moreover, syntaxin 6 coprecipitates with vps45, a sec1-like protein (8). Proteins of the sec1 family are required for SNARE-mediated membrane fusion and are believed to bind to and regulate syntaxin-like proteins (10, 11).
Syntaxin 6 also shares significant sequence homology with the C-terminal SNARE region of SNAP-25 (9). A recent genome-scale comparison of SNARE-motif sequences, coupled with the constraint that the four SNARE families be roughly equal in size, placed the syntaxin 6 SNARE motif in the S25C family rather than the syntaxin family (5). Immunoprecipitation studies using a melanoma cell line indicate that syntaxin 6 is functionally equivalent to S25C, as it interacts with the syntaxin family member syntaxin 7, the S25N homolog mVti1b, and the VAMP family rSNAREs VAMP7 and VAMP8 (12). Thus, syntaxin 6 seems to share properties of both S25C and syntaxin-family q-SNAREs.
Many SNARE proteins contain N-terminal domains in addition to the SNARE motif. The sequence homology among these domains is low or undetectable, and apart from syntaxin 1a and its yeast ortholog Sso1p, the functions of the N-terminal domains are not known. In these syntaxins, the N-terminal domain binds to the SNARE motif, and this intramolecular interaction decreases the rate of association with the partner SNAREs (13, 14). The syntaxin 1a N-terminal domain is also required for the interaction with nSec1 and munc-13 (15). The three-dimensional structures of the N-terminal domains of the syntaxin family members syntaxin 1a, Sso1p, and Vam3p are antiparallel 3-helix bundles, and in both syntaxin 1a and Sso1p, the domain features a groove into which a portion of the C-terminal SNARE motif can bind (16–19). The structures of N-terminal domains of the VAMP family members mSec22b and Ykt6p are a cyclic permutation of the profilin fold (20, 21). NMR data suggest that the N-terminal domain and SNARE motifs of Ykt6p can interact and slightly diminish the rate of association (21). Of the proteins with SNARE motifs belonging to the S25N and S25C families, some, including SNAP25, SNAP23, and SNAP29, contain both SNARE motifs on a single polypeptide chain and lack an N-terminal domain. Others have polypeptide sequence N-terminal to the SNARE motif, but structural and functional characterization of these domains is extremely limited.
To better understand the N-terminal domains of SNARE proteins and their role in different intracellular trafficking pathways, we examined the biochemical properties of syntaxin 6 and determined the crystal structure of its amino-terminal domain at 2.1 Å resolution. We present in vitro binding data that support the classification of syntaxin 6 as an S25C family member. The structure, which is the first of a non-syntaxin q-SNARE N-terminal domain, bears a striking resemblance to the N-terminal domain of syntaxin 1a, despite the low level of sequence homology. The functional and evolutionary implications of these findings are discussed.
Methods
Crystallization and Structure Solution of the Syntaxin 6 N-Terminal Domain.
Expression and purification of recombinant proteins are described in the supporting information, which is published on the PNAS web site, www.pnas.org. Crystals of the syntaxin 6 amino-terminal domain were obtained by vapor diffusion at 21°C. Purified protein in a buffer containing 150 mM NaCl, 5 mM β-mercaptoethanol (β-Me), and 10 mM Hepes, pH 7.4, was mixed with an equal volume of reservoir solution containing 30% (vol/vol) PEG 8000, 400 mM sodium acetate, 10 mM β-Me, and 10 mM Hepes, pH 7.4. Crystals were either flash frozen at 100 K directly from the crystallization drops or in Paratone-N. The crystals grew as either needles (primitive orthorhombic) or small plates (C-centered orthorhombic) and were typically twinned. The native crystal used for refinement belongs to space group P212121 with unit cell dimensions a = 39.6 Å, b = 54.38 Å, and c = 94.89 Å. The asymmetric unit contains two copies of the syntaxin 6 amino-terminal domain, corresponding to a solvent content of 30%. The crystal used for multiwavelength anomalous dispersion (MAD) data collection belonged to space group C2221 and had unit cell dimension of a = 39.98 Å, b = 56.16 Å, and c = 94.72 Å. The asymmetric unit contains one copy of the protein, but the packing relationship between crystallographically related molecules is preserved in the P212121 crystal form. Data collection ane MAD phasing methods are described in the supporting information; statistics are presented in Tables 1 and 2.
Table 1.
Crystallographic data and refinement statistics
| Data collection* | Wavelength, Å | Resolution, Å | % complete | Rsym† | % > 3σ(I) | Average redundancy |
|---|---|---|---|---|---|---|
| MAD | λ1 = 0.9252 (remote) | 30.0–2.80 | 99.9 (99.4) | 0.058 (0.112) | 94.7 (87.4) | 3.9 (3.2) |
| λ2 = 0.9795 (peak) | 30.0–2.80 | 99.9 (99.4) | 0.058 (0.112) | 94.7 (87.4) | 3.9 (3.1) | |
| Refinement | 1.5418 | 30.0–2.1 | 99.6 (96.7) | 0.099 (0.345) | 76.6 (48.7) | 4.1 (3.9) |
| Phasing |
| Resolution, Å | 37.11–9.85 | 9.85–6.29 | 6.29–4.95 | 4.95–4.20 | 4.20–3.72 | 3.72–3.37 | 3.37–3.10 | 3.10–2.89 | Overall |
| Figure-of-merit | 0.75 | 0.82 | 0.80 | 0.79 | 0.76 | 0.76 | 0.72 | 0.68 | 0.75 |
| Refinement | |
|---|---|
| R values and temperature factors | |
| No. reflections | |
| Working set‡ | 10,571 |
| Test set§ | 1,216 |
| Rcryst¶, % | 26.5 |
| Rfree¶, % | 20.6 |
| Average Bg, Å2 | |
| Protein | 13.7 |
| Solvent | 45.1 |
| Main chain bond-related B rmsd | 1.3 |
| Main chain angle-related B rmsd | 2.3 |
| Side chain bond-related B rmsd | 1.9 |
| Side chain angle-related B rmsd | 3.4 |
| Model geometry | |
| Bond length rmsd from ideal, Å | 0.005 |
| Bond angle rmsd from ideal, o | 0.8728 |
| Ramachandran plot‡ | |
| % in most favored regions | 95.9 |
| % in additional allowed regions | 3.6 |
| % in generously allowed regions | 0.5 |
| Anisotropic temperature factor, Å2 | |
| B11 = 2.27 | |
| B22 = −4.75 | |
| B33 = 2.48 |
Values in parentheses are for the highest resolution shell: 3.1–2.89 Å for the MAD phasing data sets, 2.19–2.10 Å for the native data set.
Rsym = ΣhΣi|(Ii(h) − 〈 I(h)〉|ΣhΣIIi(h), where Ii(h) is the Ith measurement of reflection h, and 〈I(h)〉 is the weighted mean of all measurements of h. Bijvoet measurements were treated as independent reflections for the MAD phasing data sets.
As defined in procheck (31).
The test set comprises a randomly selected subset of the data that was not included in the refinement of the model. The working set contains the remaining reflections from the data set.
R = Σi||Fobs(h)| − |Fcalc(h)∥/Σh|Fobs(h)|. Rcryst and Rfree were calculated with the working and test reflection sets, respectively.
An initial model representing about 60% of the structure was built into the experimentally phased MAD map to 2.8 Å resolution with the program O (22). Refinement was carried out against all data with |F| > 0 using the program CNS (23). Before refinement, a random subset (≈14% because of the small number of total reflections) of the data was removed and used as a test set for cross-validation. The model was initially refined by simulated annealing using the maximum likelihood complex structure factor (MLHL) target in CNS against the selenium high energy remote data with the density-modified phases used as prior phase information. The model then was used for molecular replacement into the 2.1 Å native data set. Packing considerations indicated that the two crystal forms are related, and a successful solution was obtained by rigid-body refinement of two crystallographically related molecules in the C2221 unit cell against the P212121 data, starting with a high resolution cutoff of 6.0 Å and then stepping out to higher resolution. The model was rebuilt into the P212121 molecular replacement map, and subsequent rounds of model building using σA-weighted 2Fo − Fc maps, positional minimization, and individual thermal-factor refinement were then carried out to produce the final model. Water molecules were placed in positive-difference Fourier peaks greater than 3σ, which exhibited a sensible chemical environment. The final model contains residues 4–109 for copy A, 3–74 and 79–109 for copy B, and 160 water molecules in the asymmetric unit.
Protein Binding Assays and CD Spectroscopy.
Purified fusion proteins were immobilized on glutathione agarose beads. Purified syntaxin 6 N-terminal domain was added to the beads in a molar ratio of 5:1 soluble protein:immobilized fusion protein (10:2 μM). Proteins were incubated for 1 h at 25°C in a buffer of 20 mM Hepes, pH 7.5/100 mM NaCl. Beads were separated from supernatant, washed four times with incubation buffer, and subjected to SDS/PAGE to detect binding.
CD data were recorded on an Aviv 62DS CD (Aviv Associates, Lakewood, NJ) spectrophotometer equipped with a thermoelectric temperature controller. Measurements were made in PBS buffer by using a 1-cm path length quartz cuvette. Wavelength measurements were recorded at 4°C, using 6 μM protein as determined by the Bio-Rad protein assay with BSA as a standard. Thermal unfolding experiments were performed at 6 μM protein concentration by measuring the CD signal at 222 nm, allowing 1 min equilibration per 1°C temperature increment, and averaging 30 s per measurement. Thermal stability measurements of the syn1aH3/VAMP2/S25N/syn6 complex were made by using a protein concentration of 2 μM. Melting transitions were taken as the first derivative of the melting curve.
Results
Structure of Syntaxin 6 Amino-Terminal Domain.
Attempts to crystallize the full-length cytoplasmic domain of syntaxin 6 were unsuccessful, but crystals were obtained from a 13-kDa N-terminal breakdown product, residues 1–113. The N-terminal domain structure was determined at 2.1 Å resolution and revealed a compact, antiparallel three-helix bundle (Fig. 1A). Helices A and C are parallel to each other, and helix B is anti-parallel to A and C. Helices A, B, and C are 28, 31, and 27 residues long, respectively. The packing angles between the helices are similar: 26° between A and B, 24° between B and C, and 18° between A and C.
Figure 1.

(A) Ribbon diagram of syntaxin 6 N-terminal domain. Helix a (residues 4–32) is shown in red, helix b (residues 38–60) is shown in orange, and helix c (res 92–109) is shown in yellow. (B) Superposition of syntaxin 6 and syntaxin 1a N-terminal domains. (C) Superposition of syntaxin 6 and Vam3p N-terminal domains. This figure was generated with MOLSCRIPT (32) and RASTER3D (33).
The amino-terminal domains of syntaxins 6 and 1a adopt the same fold despite weak homology between the two proteins in this region. The two domains do not superimpose well, however (Fig. 1B); the rms deviation (rmsd) on Cα positions is 3.5 Å for residues with helical backbone angles. For comparison, the two copies of the syntaxin 6 N-terminal domain in the asymmetric unit superimpose with an rmsd of 1.3 Å. The poor superposition can be attributed to the more uniform twist of the three helices in syntaxin 6. This difference eliminates the SNARE motif-binding groove seen in syntaxin 1a (Fig. 2 A and B). In addition, the helices seen in syntaxin 6 are shorter than those in syntaxin 1a by ≈1 helical turn. Several Phe side chains are partially exposed to solvent between helices A and C in the syntaxin 6 structure, creating a flat, nonpolar surface (Fig. 2C). The significance of this feature, if any, is not known. Many syntaxin-like proteins contain an unstructured ≈30-residue polypeptide chain that precedes the first helix of the N-terminal domain (11, 16, 17). In contrast, syntaxin 6 lacks this N-terminal extension, and in the structure presented here, the first ordered residue is the first residue of the peptide sequence.
Figure 2.
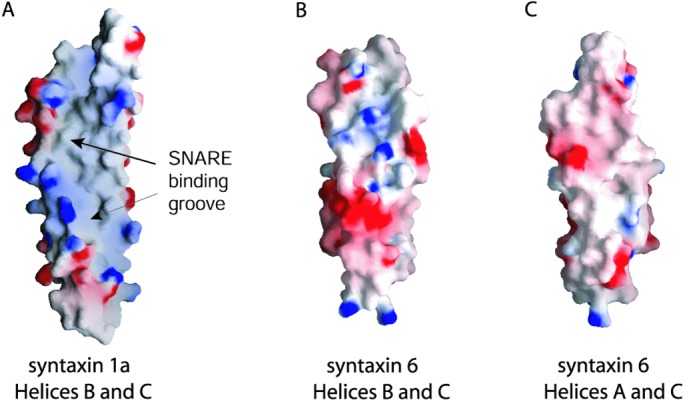
Electrostatic surface potentials of syntaxin 1a and syntaxin 6. Red represents negative potential, gray or white is neutral, and blue represents positive potential. The maps were contoured at the 10 kT/e level. (A) Surface of syntaxin 1a showing hydrophobic groove which binds the SNARE peptide in the closed conformation of the full cytosolic protein (11). (B) The corresponding view of syntaxin 6 showing the absence of a hydrophobic groove. (C) The flat hydrophobic surface between helices A and C in syntaxin 6. This figure was prepared by using GRASP (34).
The fold of the N-terminal domain of syntaxin 6 is also found in the equivalent region of Vam3p (19), a syntaxin-family protein involved in homotypic vacuole fusion. The lengths of the Vam3p N-terminal domain helices are similar to those in syntaxin 6, but the rmsd on Cα positions for residues with helical backbone angles is 5.6 Å (Fig. 1C), which is considerably larger than the syntaxin 6 and syntaxin 1a superposition. Some of this difference may reflect that the structures of the Vam3p and syntaxin 6 N-terminal domains were determined by using NMR and crystallography, respectively.
Biophysical Characterization and Classification of Syntaxin 6.
Syntaxin 6 has been proposed to belong to the S25C protein family rather than the syntaxin family, but this hypothesis has not been tested. The physiological binding partners of syntaxin 6 are not known, so we used the SNARE motif of syntaxin 6 to represent the S25C family and attempted to complete the complex with neuronal SNARE proteins. The SNARE motifs of VAMP2, syntaxin 1a, and S25N were added to glutathione S-transferase (GST)-syntaxin 6 SNARE-motif fusion protein that was immobilized on glutathione agarose beads. The three neuronal proteins bound to the immobilized syntaxin 6 SNARE motif (Fig. 3A). The complex was removed from the beads by thrombin cleavage and analyzed by CD spectroscopy. A thermal denaturation profile revealed that the four proteins form a stable complex with a melting temperature of 78°C (Fig. 3B). These data indicate that the SNARE motifs of syntaxin 6 and S25C can substitute for each other in a SNARE complex formed in vitro. Control experiments indicated that the syntaxin 6 SNARE motif could not substitute for SNARE motifs of syntaxin 1a, S25N, or VAMP2 (data not shown).
Figure 3.

Biochemical properties of syntaxin 6. (A) SDS/PAGE showing that syntaxin 1a, VAMP 2, and S25N SNARE motifs bind to immobilized GST-syn6 SNARE motif. VAMP 2 and syntaxin 1a H3 migrate similarly through the gel but are distinguishable. S, supernatant, B, beads. (B) Thermal denaturation of the thrombin-cleaved products shows that the four SNARE motif peptides form a stable complex with a melting temperature of 78°C.
By using bead binding and CD experiments, it has been shown that the N-terminal domains of syntaxin 1a and Sso1p bind their SNARE motifs and kinetically inhibit SNARE-complex formation (13, 14, 24). Given the structural similarity between syntaxin 1a, Sso1p, and syntaxin 6, we tested whether the N-terminal domain of syntaxin 6 displays similar biochemical properties. Formation of SNARE complexes containing syntaxin 1a, VAMP2, S25N, and syntaxin 6 in solution resulted in uninterpretable CD data, which prevented analysis of assembly kinetics by this method. Binding of the syntaxin 6 N-terminal domain to the SNARE motif was tested by incubating purified N-terminal domain with a GST-syntaxin 6 SNARE-motif fusion protein that was immobilized on glutathione agarose beads. The SNARE motif of syntaxin 7 fused to GST was used as a negative control. After centrifugation, the N-terminal domain remained exclusively in the supernatant (Fig. 4), suggesting that the syntaxin 6 SNARE motif does not tightly associate with its N-terminal domain in isolation.
Figure 4.

The N-terminal domain of syntaxin 6 does not bind its SNARE motif. A GST-syntaxin 6- or syntaxin 7-SNARE fusion protein was immobilized on glutathione-agarose beads. After a 1-h incubation with soluble syntaxin 6 N-terminal domain, the beads and supernatant were separated and subjected to SDS/PAGE. Lanes 6(B) and 7(B) show the fraction remaining on syntaxin 6-SNARE or syntaxin 7-SNARE beads, respectively. The highest molecular weight bands are unrelated contaminants, and the GST band results from cleavage of the fusion protein during purification and immobilization. Lanes 6(S) and 7(S) show components remaining in the supernatant after incubation with syntaxin 6 N-terminal domain.
To detect weaker intramolecular interactions, the thermal denaturation profile of cytosolic syntaxin 6 was measured and compared with those of other syntaxin-like proteins. The melting curve for cytosolic syntaxin 1a is biphasic, and the two transitions have been interpreted as indicating the separation of the N-terminal domain from the C-terminal peptide followed by melting of the N-terminal domain (4). The closely related SNAREs syntaxin 4 and syntaxin 7 also display biphasic melting curves (Fig. 5A). In contrast, the full-length cytosolic portion of syntaxin 6 displays a monophasic melting curve, suggesting that the N-terminal domain and SNARE motif do not interact. This interpretation may not be correct however, because Sso1p also displays a monophasic melting curve (14) but is known to adopt a closed conformation in isolation (18). The syntaxin 6 and Sso1p N-terminal domains have melting transitions 3° lower than the full-length cytosolic proteins (Fig. 5B), indicating that SNARE motifs may stabilize the N-terminal domains of syntaxin and S25C-like proteins.
Figure 5.
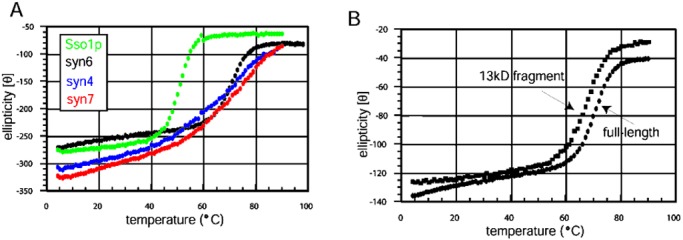
(A) Comparison of syntaxin 6 thermal melting curves with full-length Sso1p, syntaxin 7, and syntaxin 4. α-Helical signal was monitored at 222 nm as a function of increasing temperature. The black, green, red, and blue curves represent syntaxin 6, Sso1p, syntaxin 7, and syntaxin 4, respectively. Syntaxin 6 and Sso1p display monophasic melting transitions, whereas the melting curves of syntaxin 7 and syntaxin 4 are mildly biphasic. (B) Solid ovals represent the thermal melting curves of full-length syntaxin 6, and squares represent the melting curve of the 13-kDa fragment. Both are monophasic with melting transitions of 71°C and 67°C, respectively.
SNARE Protein N-Terminal Domain Sequence Analysis.
Little is known about the relationship of sequence and structure to the function of the SNARE protein N-terminal domains. We used the program PSIPRED (25) to predict secondary structure elements for the sequences of proteins which have been placed in the syntaxin, VAMP, S25N, or S25C families based on their SNARE motifs (Fig. 6). To see whether the classification extended to the N-terminal domains of SNARE proteins, the patterns of secondary structure elements were matched with representative members of each family for which tertiary structures are known. The N-terminal domains of proteins that belong to the syntaxin category when classified according to SNARE-motif sequence homology contained almost exclusively α-helical secondary structure elements with intervening loops. Some exceptions were syntaxin 18, syntaxin 16, and Sft2p, which contained some predicted β-strand structure or large regions of predicted irregular secondary structure. The majority of VAMP family proteins do not contain an N-terminal domain. For those that do, however, most contained predominantly β-strand secondary structure elements. The pattern of predicted β-strand and α-helix secondary structures suggest that these N-terminal domains may adopt tertiary structure similar to that of rsec22b and Ykt6p (20, 21).
Figure 6.

Predicted structures and alignments of SNARE protein N-terminal domains. Colored bars represent scaled SNARE sequences. Red and pink represent regions predicted to form α-helical secondary structure with high confidence (>5) and with lower confidence (<5), respectively. Blue and light blue represent regions predicted to form β-strand secondary structure with high confidence (>5) and lower confidence (<5), respectively. Black represents regions predicted to form loops or for which assignments were not generated with confidence. Sequence numbering on the y axis follows the syntaxin 1a sequence. Dashed lines indicate gaps in the alignment. The #aa's column reports the length of the full-length proteins, and proteins are grouped into syntaxin, S25N, S25C, and VAMP categories. Secondary structure prediction and confidence levels were assigned by PSIPRED (25).
The S25N and S25C groups contain N-terminal domains that are more diverse than the syntaxin or VAMP groups as assessed by secondary structure prediction. In some cases, the SNARE motifs are not preceded by an N-terminal domain, whereas others have N-terminal regions predicted to contain mixtures of α-helical and β-strand secondary structure elements. Some unusual cases, such as Sec9p, contain a large N-terminal domain predicted to have little regular secondary structure, followed by S25N and S25C SNARE motifs. Among the proteins assigned to the S25C functional group, there seem to be other examples of syntaxin-like N-terminal domains in addition to that of syntaxin 6.
Discussion
Tertiary structures of SNARE proteins provide clues to the evolutionary conservation of certain aspects of membrane fusion as well as the requirements for specificity and regulation in divergent trafficking pathways. The relatively close sequence homology among the q-SNARE motifs and the structural similarity of the syntaxin 6 N-terminal domain with those of syntaxin 1a, Sso1p, and Vam3p strongly suggest that these proteins arose from a common ancestor. The divergence of the q-SNAREs may reflect selective pressure to independently regulate their association for highly specialized and specific intracellular membrane-fusion events. Thus, the N-terminal domains of syntaxin 1a and Sso1p interact with their SNARE motifs and thereby slow the association with partner SNAREs, which may represent a specialization of these plasma-membrane SNAREs that is not generally found in other transport processes. In the case of syntaxin 1a, the resulting closed conformation is required for interaction with the essential protein nSec1 (26). This stable binary complex has been demonstrated definitively only for the syntaxin 1a–nSec1 interaction (10, 11). In contrast, the N-terminal domain of Vam3p is not required in vivo, does not interact with the SNARE motif, and is not required for the interaction with the Sec1-family member Vps33p (19). We were not able to detect an interaction between the syntaxin 6 N-terminal domain and SNARE motif, suggesting that it may also adopt an open conformation at equilibrium. It is possible that interaction between the N-terminal domains and SNARE motifs are only required in highly regulated transport steps such as exocytosis.
The N-terminal domains of SNAREs may fulfill functional roles in addition to regulation of the SNARE motif. The N-terminal domain of the syntaxin-like protein Tlg2p is required in vivo, and seems to stabilize the Tlg2p SNARE motif, suggesting that it acts as a chaperone to protect the SNARE motif from degradation during transport (27). The N-terminal domain also may mediate interactions with Vps45p, as full-length Tlg2p cannot form SNARE complexes in vps45-null strains (27). Large protein complexes have been described for vacuolar and intra-Golgi transport in yeast that contain members of the Rab, Rab effector, Sec1, and SNARE families (28, 29). It is not clear how the various N-terminal domains present in a SNARE complex contribute to its associated membrane-transport step, but they may mediate protein–protein interactions within these large assemblies. Syntaxin 6 has been found to immunoprecipitate with syntaxin 7, VAMP7, and vti1b (12). According to the secondary structure analysis (Fig. 5), syntaxin 7 as well as syntaxin 6 would contribute helical N-terminal domains to this complex, and VAMP7 likely has an N-terminal domain similar to that of mSec22b and Ykt6p (20, 21). Likewise, more than one N-terminal domain is present in the syntaxin 7/syntaxin 8/VAMP7/vti1b complex responsible for endosomal fusion (30). Multiple N-terminal domains are also found in the plasma membrane Sso1p/Snc1p/Sec9p complex. In this case, however, the Sso1p N-terminal domain fits well into the syntaxin protein family, whereas the N-terminal domain of Sec9p is atypically large and is predicted to contain long unstructured regions. It is unclear which, if any, N-terminal domain family shares structural similarity with Sec9p.
The general conservation of proteins involved in intracellular vesicle transport likely reflects underlying mechanistic similarities of this process. However, neuronal and other forms of regulated exocytosis, which at present are the best characterized biochemically, may be unusual in that they require more stringent spatial and temporal segregation of long-range targeting, docking, and fusion than in constitutive trafficking such as endosomal or ER-to-Golgi membrane transport. Variations in the antiparallel three-helix bundle found in q-SNAREs may contribute to differences in the regulation of particular transport steps.
Supplementary Material
Acknowledgments
This work was supported by National Institutes of Mental Health Grants MH58570 (to W.I.W.) and MH38710 (to R.H.S.). Part of this work is based upon research conducted at Stanford Synchrotron Radiation Laboratory (SSRL), a national facility operated by Stanford University for the United States Department of Energy, Office of Basic Energy Sciences. The SSRL Structural Molecular Biology Program is supported by the Department of Energy, Office of Biological and Environmental Research, the National Center for Research Resources, Biomedical Technology program, and National Institute of General Medical Sciences, National Institutes of Health.
Abbreviations
- SNARE
soluble N-ethylmaleimide-sensitive factor attachment protein receptor
- MAD
multiwavelength anomalous dispersion
- GST
glutathione S-transferase
- rmsd
rms deviation
Footnotes
Data deposition: The atomic coordinates have been deposited in the Protein Data Bank, www.rcsb.org (PDB ID code 1LVF).
References
- 1.Jahn R, Sudhof T C. Annu Rev Biochem. 1999;68:863–911. doi: 10.1146/annurev.biochem.68.1.863. [DOI] [PubMed] [Google Scholar]
- 2.Weber T, Zemelman B V, McNew J A, Westermann B, Gmachl M, Parlati F, Sollner T H, Rothman J E. Cell. 1998;92:759–772. doi: 10.1016/s0092-8674(00)81404-x. [DOI] [PubMed] [Google Scholar]
- 3.Rothman J E, Warren G. Curr Biol. 1994;4:220–233. doi: 10.1016/s0960-9822(00)00051-8. [DOI] [PubMed] [Google Scholar]
- 4.Fasshauer D, Otto H, Eliason W K, Jahn R, Brunger A T. J Biol Chem. 1997;272:28036–28041. doi: 10.1074/jbc.272.44.28036. [DOI] [PubMed] [Google Scholar]
- 5.Bock J B, Matern H T, Peden A A, Scheller R H. Nature (London) 2001;409:839–841. doi: 10.1038/35057024. [DOI] [PubMed] [Google Scholar]
- 6.Fasshauer D, Sutton R B, Brunger A T, Jahn R. Proc Natl Acad Sci USA. 1998;95:15781–15788. doi: 10.1073/pnas.95.26.15781. [DOI] [PMC free article] [PubMed] [Google Scholar]
- 7.Sutton R B, Fasshauer D, Jahn R, Brunger A T. Nature (London) 1998;395:347–353. doi: 10.1038/26412. [DOI] [PubMed] [Google Scholar]
- 8.Bock J B, Klumperman J, Davanger S, Scheller R H. Mol Biol Cell. 1997;8:1261–1271. doi: 10.1091/mbc.8.7.1261. [DOI] [PMC free article] [PubMed] [Google Scholar]
- 9.Bock J B, Lin R C, Scheller R H. J Biol Chem. 1996;271:17961–17965. doi: 10.1074/jbc.271.30.17961. [DOI] [PubMed] [Google Scholar]
- 10.Pevsner J. J Neurosci Res. 1996;45:89–95. doi: 10.1002/(SICI)1097-4547(19960715)45:2<89::AID-JNR1>3.0.CO;2-B. [DOI] [PubMed] [Google Scholar]
- 11.Misura K M S, Scheller R H, Weis W I. Nature (London) 2000;404:355–362. doi: 10.1038/35006120. [DOI] [PubMed] [Google Scholar]
- 12.Wade N, Bryant N J, Connolly L M, Simpson R J, Luzio J P, Piper R C, James D E. J Biol Chem. 2001;276:19820–19827. doi: 10.1074/jbc.M010838200. [DOI] [PubMed] [Google Scholar]
- 13.Calakos N, Bennett M K, Peterson K E, Scheller R H. Science. 1994;263:1146–1149. doi: 10.1126/science.8108733. [DOI] [PubMed] [Google Scholar]
- 14.Nicholson K L, Munson M, Miller R B, Filip T J, Fairman R, Hughson F M. Nat Struct Biol. 1998;5:793–802. doi: 10.1038/1834. [DOI] [PubMed] [Google Scholar]
- 15.Betz A, Okamoto M, Benseler F, Brose N. J Biol Chem. 1997;272:2520–2526. doi: 10.1074/jbc.272.4.2520. [DOI] [PubMed] [Google Scholar]
- 16.Fernandez I, Ubach J, Dulubova I, Zhang X Y, Sudhof T C, Rizo J. Cell. 1998;94:841–849. doi: 10.1016/s0092-8674(00)81742-0. [DOI] [PubMed] [Google Scholar]
- 17.Lerman J C, Robblee J, Fairman R, Hughson F M. Biochemistry. 2000;398:8470–8479. doi: 10.1021/bi0003994. [DOI] [PubMed] [Google Scholar]
- 18.Munson M, Chen X, Cocina A E, Schultz S M, Hughson F M. Nat Struct Biol. 2000;7:894–902. doi: 10.1038/79659. [DOI] [PubMed] [Google Scholar]
- 19.Dulubova I, Yamaguchi T, Wang Y, Sudhof T C, Rizo J. Nat Struct Biol. 2001;8:258–264. doi: 10.1038/85012. [DOI] [PubMed] [Google Scholar]
- 20.Gonzalez L C, Weis W I, Scheller R H. J Biol Chem. 2001;276:24203–24211. doi: 10.1074/jbc.M101584200. [DOI] [PubMed] [Google Scholar]
- 21.Tochio H, Tsui M M K, Banfield D K, Zhang M J. Science. 2001;293:698–702. doi: 10.1126/science.1062950. [DOI] [PubMed] [Google Scholar]
- 22.Jones T A, Zou J-Y, Cowan S W, Kjeldgaard M. Acta Crystallogr A. 1991;36:856–864. doi: 10.1107/s0108767390010224. [DOI] [PubMed] [Google Scholar]
- 23.Brunger A T, Adams P D, Clore G M, Gros P, Grosse-Kunstleve R W, Jiang J-S, Kuszewski J, Nilges M, Pannu N S, Read R J, et al. Acta Crystallogr D. 1998;54:905–921. doi: 10.1107/s0907444998003254. [DOI] [PubMed] [Google Scholar]
- 24.Fiebig K M, Rice L M, Pollock E, Brunger A T. Nat Struct Biol. 1999;6:117–123. doi: 10.1038/5803. [DOI] [PubMed] [Google Scholar]
- 25.Jones D T. J Mol Biol. 1999;292:195–202. doi: 10.1006/jmbi.1999.3091. [DOI] [PubMed] [Google Scholar]
- 26.Yang B, Steegmaier M, Gonzalez L C, Scheller R H. J Cell Biol. 2000;148:247–252. doi: 10.1083/jcb.148.2.247. [DOI] [PMC free article] [PubMed] [Google Scholar]
- 27.Bryant N J, James D E. EMBO J. 2001;203:380–3388. doi: 10.1093/emboj/20.13.3380. [DOI] [PMC free article] [PubMed] [Google Scholar]
- 28.Seals D F, Eitzen G, Margolis N, Wickner W T, Price A. Proc Natl Acad Sci USA. 2000;97:9402–9407. doi: 10.1073/pnas.97.17.9402. [DOI] [PMC free article] [PubMed] [Google Scholar]
- 29.Eitzen G, Will E, Gallwitz D, Haas A, Wickner W. EMBO J. 2000;19:6713–6720. doi: 10.1093/emboj/19.24.6713. [DOI] [PMC free article] [PubMed] [Google Scholar]
- 30.Antonin W, Holroyd C, Fasshauer D, Pabst S, von Mollard G F, Jahn R. EMBO J. 2000;19:6453–6464. doi: 10.1093/emboj/19.23.6453. [DOI] [PMC free article] [PubMed] [Google Scholar]
- 31.Laskowski R A, MacArthur M W, Moss D S, Thornton J M. J Appl Crystallogr. 1993;26:283–291. [Google Scholar]
- 32.Kraulis P J. J Appl Crystallogr. 1991;24:946–950. [Google Scholar]
- 33.Merritt E A, Bacon D J. Methods Enzymol. 1997;277:505–524. doi: 10.1016/s0076-6879(97)77028-9. [DOI] [PubMed] [Google Scholar]
- 34.Nicholls A. grasp, Graphical Representation and Analysis of Surface Properties (Columbia Univ. Press, New York) 1992. [Google Scholar]
Associated Data
This section collects any data citations, data availability statements, or supplementary materials included in this article.