Abstract
A sequence of seven alanine residues—too short to form an α-helix and whose side chains do not interact with each other—is a particularly simple model for testing the common description of denatured proteins as structureless random coils. The 3JHNα coupling constants of individual alanine residues have been measured from 2 to 56°C by using isotopically labeled samples. The results display a thermal transition between different backbone conformations, which is confirmed by CD spectra. The NMR results suggest that polyproline II is the dominant conformation at 2°C and the content of β strand is increased by approximately 10% at 55°C relative to that at 2°C. The polyproline II conformation is consistent with recent studies of short alanine peptides, including structure prediction by ab initio quantum mechanics and solution structures for both a blocked alanine dipeptide and an alanine tripeptide. CD and other optical spectroscopies have found structure in longer “random coil” peptides and have implicated polyproline II, which is a major backbone conformation in residues within loop regions of protein structures. Our result suggests that the backbone conformational entropy in alanine peptides is considerably smaller than estimated by the random coil model. New thermodynamic data confirm this suggestion: the entropy loss on alanine helix formation is only 2.2 entropy units per residue.
Tanford's pioneering experiments on denatured proteins in 6 M guanidinium chloride (GdmCl) (1–5) were interpreted by using the random coil model, and they anchored a widespread belief that denatured proteins are structureless chains. Tanford emphasized that 6 M GdmCl is required to eliminate all residual structure, which was detected by optical rotatory dispersion in heat-denatured proteins (6). The random coil model has been applied to modern NMR studies of backbone conformation in denatured proteins (7, 8) by assuming that the backbone conformations found in protein structures, including or excluding regions of regular secondary structure, are represented with the same frequencies in denatured proteins. One might suppose, however, that the energy differences between major backbone conformations are sufficiently large to favor one conformation over others, at least in a homopeptide.
We address this question by using NMR to investigate the backbone conformation as a function of temperature for a sequence of seven alanine residues in a peptide solubilized in water by two basic residues at either end of the alanine sequence. This peptide presents an appealing model system for a structureless denatured protein. It is too short to form any detectable α-helix in water via peptide hydrogen bonds; moreover, the —CH3 side chain is too short to form nonpolar clusters and too inert to form other side chain interactions. To characterize the backbone conformations of this peptide, we measure system properties that are related directly to either the φ or the ψ backbone angles. It is possible today to resolve and assign most backbone resonances of denatured proteins in the size range of hen lysozyme (129 residues) (8) or sperm whale myoglobin (153 resonances) (9). Nevertheless, the Hα resonances of a seven-residue alanine peptide overlap significantly because of the repeated sequence, but NH signals are resolved and 3JHNα coupling constants can be measured for alanine residues by using a 15N-isotopically labeled sample. A selectively deuterated sample is used to improve the resolution of proton nuclear Overhauser effect spectroscopy (NOESY). Our NMR studies are complemented by CD spectra taken as a function of temperature.
The peptide used here and referred to as XAO is an 11-mer with the sequence
AcXXA1A2A3A4A5A6A7OOamide,
where X denotes diaminobutyric acid; A, alanine; and O,
ornithine. The predominant native structure found in a similar peptide
containing a longer alanine stretch at low concentrations in water is
α-helix (10). The sequence of seven alanine residues is flanked by
pairs of residues with basic side chains, diaminobutyric acid at the N
terminus [side chain
—CH2—CH2—NH ],
and ornithine [side chain
(—CH2)3—NH
 ]
at the C terminus.
Materials and Methods
Peptide Synthesis.
Isotopically labeled or unlabeled peptides were synthesized and characterized as described (11), by using a Rainin Instruments PS-3 solid-state synthesizer with standard Fmoc chemistry. Rink resin (Advanced ChemTech) was used to amidate the C terminus. Fmoc amino acids were purchased from Nova Biochem and isotopically labeled products from Isotec. The products were purified on reversed-phase HPLC columns by using a gradient of water and acetonitrile; peaks corresponding to the major product were collected, analyzed by matrix-assisted laser desorption/ionization spectrometry mass spectrometry (Shimadzu), and dried before preparation of samples.
CD Spectroscopy.
CD spectra were recorded on an Aviv 202 spectrometer (Aviv Associates, Lakewood, NJ), as described (11), calibrated with (+)-10-camphorsulfonic acid standard (12). CD measurements were performed at a peptide concentration of ≈50 μM in 10 mM phosphate buffer, pH 7, from 1 to 80°C. Triplicate scans were averaged and smoothed to produce the spectra shown.
NMR Spectrometry.
1H NMR spectra were collected on a Varian INOVA 600 spectrometer. All one-dimensional 1H spectra were acquired with 32K complex data points by averaging 16 or 32 scans with a cycle delay of 5 s; free induction decays (FIDs) were transformed after weighing with a squared sine bell window function and zero filling the data points to 64K complex data points to enhance resolution and improve digital resolution. We used States et al.'s method (13) to obtain phase-sensitive clean total correlation spectroscopy (TOCSY) (14, 15) (data not shown) by using a mixing time of 80 ms. NOESY experiments (16, 17) were made with mixing times of 200, 300, and 400 ms. Solvent was suppressed by a Watergate pulse sequence (18). Each two-dimensional data set contained 512 FIDs with 2,048 complex data points each, obtained by collecting 64 added free induction decays after 4 dummy scans. Spectra were Fourier transformed in both t2 and t1 dimensions after apodization with a shifted square sine bell function, typically with 90° phase shift. Zero filling was done in the t1 dimension to obtain a final matrix of 2,048 × 1,024 real points. NMR data were processed by using vnmr Ver. 6.1B (Varian, Palo Alto, CA). One-dimensional spectra were collected from 2 to 56°C with a step size of 3°C; NOESY and TOCSY spectra were collected at 5°C. Temperature was controlled by the temperature controller and was directly read from the console without correction. Samples were prepared by dissolving peptides in 30 mM sodium acetate buffer (pH 4.6; 10% D2O) to a concentration of ≈4 mM. Coupling constants were measured directly from one-dimensional spectra. The quantitative ratio of NOEs was determined by taking the ratio of the respective NOE integrated by using vnmr Ver. 6.1B.
Simulation.
A Karplus relationship plot (19) between 3JHNα coupling constant and φ dihedral angle was constructed by using the equation of Vuister and Bax (20): 3JHNα = 6.51 cos2θ − 1.76 cosθ + 1.6, with θ = |φ − 60°|. The dependence of dNN(i,i+1) on ψ with the φ value restricted to the range between −60° and −75° were simulated by measuring the change in the dNN(i,i+ 1) distance of model tri-Ala peptides built from hyperchem software (Hypercube, Gainesville, FL) by systematically varying the backbone ψ value from −180° to +180° with a step size of 5° while fixing the φ value at −60° or −75°. The contour plot relating the ratio of NOEβi-NHi/NOEβi-NHi+1 to φ and ψ angles was constructed from the measured distances—d(βi,NHi) and d(βi,NHi+1)—as a function of φ and ψ angles at 5° intervals. The distances were also measured on model peptides built from hyperchem modeling software; they were measured from the center of three methyl protons to the corresponding NH groups. The reciprocal of the ratio of the sixth power of these distances was then used to determine the ratios of NOEβi-NHi/NOEβi-NHi+1.
Results
Coupling Constants.
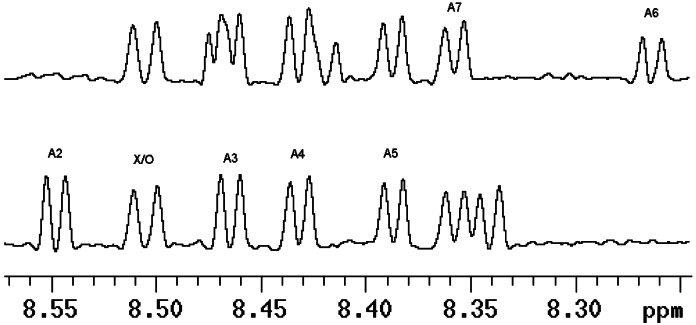
This alanine sequence provides a model for the unfolded state that can be characterized under native folding conditions. 15N-isotopic label(s) at specific sites allow each Ala group to be measured individually. Our primary objective is to measure the 3JHNα coupling constant that is related directly to the φ angle (20, 21). The one-dimensional spectrum must be well resolved in the NH region to get accurate 3JHNα coupling constant values; see Fig. 1. For assignments, multiple samples containing single or double substitutions of 15N alanine at Ala-2, -4, and -6 were synthesized. Values of 3JHNα for A2, A3, A4, and A5 can be determined from the well-resolved spectra of an unlabeled or 15N-labeled sample (with 15N decoupling in the pulse sequence), as seen in the Fig. 1 Lower; the values for A6 and A7 can be obtained from the sample XAO26 (15N-labeled at 2 and 6 positions), as seen in Fig. 1 Upper.
Figure 1.
Amide region of 1H NMR spectra for XAO peptide. Each NH peak in the spectrum of XAO is cleanly resolved and allows accurate determination of the coupling constants. The values of 3JHNα for A2, A3, A4, and A5 can be determined from unlabeled sample or 15N-labeled sample (with 15N decoupling in the pulse sequence), as seen (Lower); those for A6 and A7 can be obtained from the sample XAO26 (15N-labeled at 2 and 6 positions) without 15N decoupling in the pulse sequence, as seen (Upper).
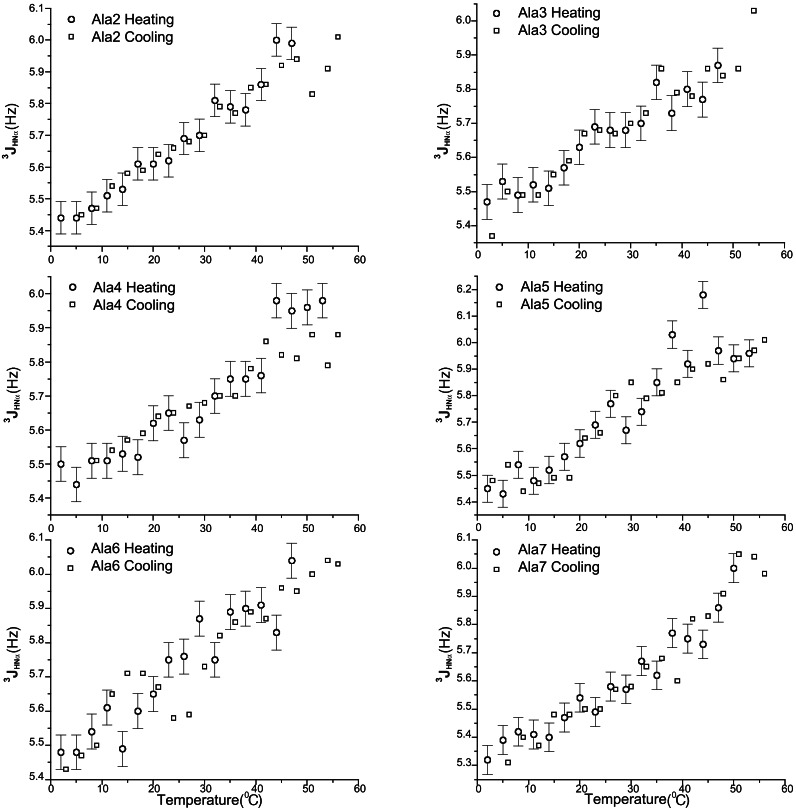
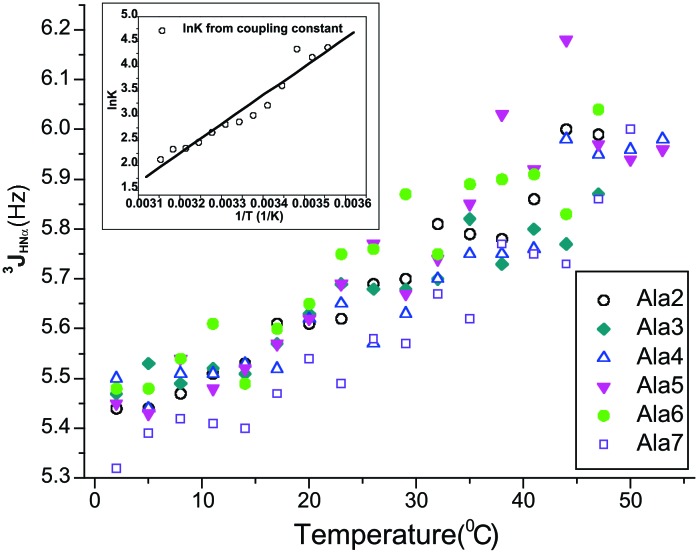
The coupling constants for different residues determined in this way change markedly with temperature (Fig. 2). Superimposing 3JHNα values for each site in the chain reveals a common behavior in their temperature dependence: a monotonic increase in coupling constant between 2 and 56°C (Fig. 3). The cooling curves are superimposable on the heating curves (Fig. 2), which shows that the increase in coupling constant with temperature is not the result of forming irreversible aggregates at higher temperatures.
Figure 2.
The 3JHNα coupling constants vs. temperature for different alanine residues in the XAO peptide. The reversibility of 3JHNα vs. temperature was checked by measurements with temperature increasing from 2 to 56°C (labeled as heating) or decreasing from 56 to 6°C (labeled as cooling). The errors are the same in heating and cooling measurements; the error bars are shown only for heating measurements for clarity. The conditions were: temperature from 2 to 56°C, concentration ≈4 mM, in 30 mM sodium acetate buffer (pH 4.6 in 10% D2O).
Figure 3.
General trend for the change of 3JHNα with temperature as shown by overlaying the plots in Fig. 2 for different alanine residues. Only measurements from heating are shown. The errors are the same as in Fig. 2. (Inset) van't Hoff plot of lnK vs. 1/T , used to determine the enthalpy of the transition from PII to β strand. Data are shown for the variation of 3JHNα with temperature. The assumptions are (see text): (i) the percentage of PII conformation at 2°C is normalized to 100% to estimate ΔH for the transition; (ii) ΔH is independent of temperature within the temperature range studied; and (iii) the 3JHNα coupling constant for the β conformation is 9.81 Hz and for PII it is 5.45 Hz. To calculate lnK from 3JHNα data at different temperatures, the mean coupling constants for six alanine residues were averaged. See text for discussion of the apparent enthalpy change.
NOESY Spectra.
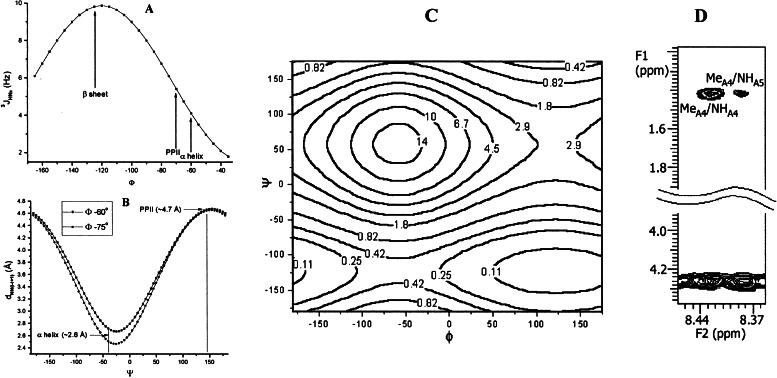
NOESY spectra with mixing times of 200, 300, and 400 ms were recorded on a sample of XAO in which the methyl groups of Ala-1–3 and Ala-5–7 were deuterated. This deuteration allows selective observation of NOEs between methyl protons of Ala-4 and any other protons, such as its own NH proton and the NH proton of the neighboring Ala-5 residue. In each NOESY spectrum, there is a strong NOE between the methyl protons of Ala-4 and its own NH proton and also a weak NOE from its methyl protons to the NH of the succeeding residue Ala-5 (Fig. 4D). The quantitative ratio of these NOEs can be determined by taking the ratio of the respective integrated NOE volume, NOEβi-NHi/NOEβi-NHi+1 ≈4. In the amide–amide region, no measurable NOEs are observed between any pair of successive amides in the chain, which indicates that no measurable α-helix or other α conformation is present (Fig. 4B; see Discussion).
Figure 4.
(A) Coupling constant vs. φ from Karplus relationship, given by the calibration of Vuister and Bax (20). (B) Simulation of the dependence of dN,N(i,i+1) on ψ, with the φ value restricted to the range of α-helix and PII, −60° and −70°, respectively. (C) Simulated contour plot showing the value of the ratio, NOEβi-NHi/NOEβi-NHi+1 vs. φ and ψ angles. (D) Section of the NOESY spectrum of XAO deuterated except at alanine 4. The conditions were: temperature 5°C, concentration ≈4 mM, mixing time 200 ms in 30 mM sodium acetate buffer (pH 4.6 in 10% D2O). The strip of NOESY spectrum shows a strong NOE between the side chain methyl protons of alanine 4 and its own amide; a weak NOE is observed between the methyl group and the amide of alanine 5. In the same spectrum, no NOEs are observed between succeeding amide NH protons (data not shown).
CD Spectra.
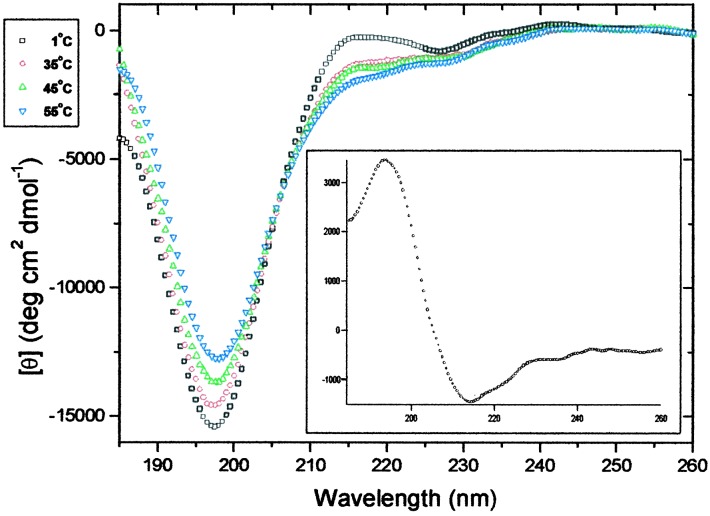
The CD spectra of the XAO peptide at temperatures of 1, 35, 45, and 55°C are shown in Fig. 5. The spectra all show strong negative bands at 198 nm, and the spectrum at 1°C also shows a weak positive band at ≈215 nm. This type of spectrum has been observed with unfolded polypeptides (22–26) and may be related to the polyproline II helical structure (26–29). By subtracting the spectrum of XAO at 1°C from that at 55°C, the difference spectrum shown in the Fig. 5 Inset is obtained. This spectrum resembles the CD spectrum of β structure (29) and differs markedly from the 1°C spectrum of XAO (Fig. 5).
Figure 5.
CD spectra of XAO at □ 1°C; ○ 35°C; ▵ 45°C; and ▿ 55°C. Peptide concentrations were 50 μM in 10 mM KH2PO4 buffer, pH 7.0. (Inset) Differential CD spectrum for XAO between 1 and 55°C.
Discussion
Structure of XAO at 2°C Characterized from NMR Measurements.
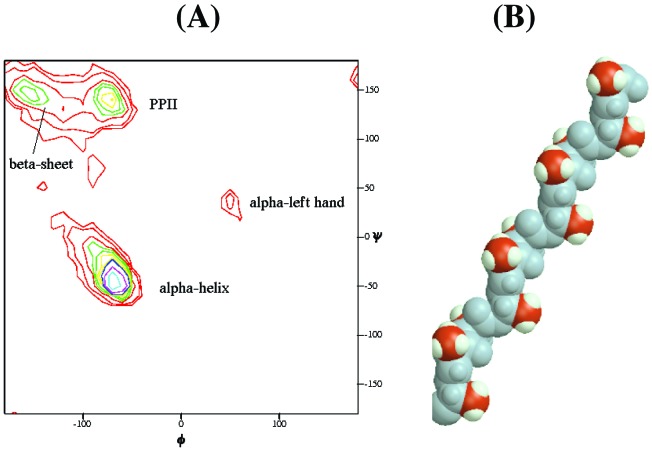
The combined evidence from 3JHNα coupling constants and NOE measurements demonstrates that the XAO peptide has a preferred backbone conformation that undergoes change with increasing temperature. The following argument suggests that the canonical left-handed polyproline II helix (PII) is the dominant conformation at 2°C. We limit consideration to the three main backbone conformations found in protein structures (30–32), namely α, β, and PII. A frequency diagram of backbone conformations, obtained from high-resolution structures in the Protein Data Bank (32), is reproduced in Fig. 6A. The lack of i, i + 1 NH–NH NOEs in the XAO peptide (see below) indicates the absence of both α-helix and the “nascent helix” observed by Dyson et al. (33). The φ angle of −70°, derived from the 3JHNα value of 5.45 ± 0.05 at 2°C, is consistent with either α-helix or PII conformation (see Fig. 4A), whereas NOE data indicate the absence of the α conformation. Consequently, if there is a single dominant conformation at 1°C (see below), it is PII.
Figure 6.
(A) A frequency plot, analogous to the Ramachandran plot, showing the φ,ψ distribution of core backbone conformations of all nonglycine residues in high-resolution protein structures (32). (Core backbone conformations account for 98% of all backbone conformations.) (B) A 12-residue segment of polyalanine PII helix is shown for reference. The backbone is shown in blue-gray; β carbons are in red, and their hydrogens are in white. Unlike the more familiar α-helix, a PII helix is left-handed (φ,ψ = −75°, +145°). It has three residues per turn; that is, every third side-chain is colinear, forming three parallel columns spaced uniformly around the long axis of the helix. In solution, significant fluctuations from the idealized structure shown here probably occur.
The absence of any measurable α conformation, on the basis of the absence of any measurable NH–NH(i, i + 1) NOE, can be quantitated as follows. The intraresidue NH-αH(i,i) NOE is used as an internal reference because the distance between these two protons, which depends on φ, varies only weakly between 2.65 and 2.85 Å over the allowed range of φ from −50° to −180° (21). For the value of φ determined here, −70°, this distance is 2.75 Å. This is quite close to the NH–NH(i, i + 1) distance in a regular α-helix. Consequently, we may take the maximum amount of α conformation in peptide XAO at 2°C to be approximately the same as the maximum ratio of NOEs from dNN(i,i+1) and dαN(i,i) in our experiments, which is less than 10%.
The value of the observed coupling constant at 2°C, 5.45 ± 0.05 Hz, places a limit on the possible amount of β structure at this temperature, because the coupling constant for β strand (close to 10 Hz) is roughly twice the value for PII (close to 5 Hz). The Karplus relation (19) between coupling constant and φ is known to be accurate, and it has been calibrated by Vuister and Bax (20). The φ values at the maximum frequencies of occurrence for PII and β in Fig. 6A are φ = −72° (PII) and φ = −125° (β). These correspond to values for 3JHNα of 5.69 Hz (PII) and 9.81 Hz (β). Using these values of 3JHNα, the maximum possible amount of β is zero, because 5.69 Hz is larger than the observed coupling constant, 5.45 Hz. Instead, if a single conformation is present at 2°C, the value of φ must be the value calculated from the observed 3JHNα, namely φ = −70°, which is close to the value of −72° predicted from Fig. 6A. The addition of 10% β strand to the 7-mer system at 2°C would increase the observed value of 3JHNα from 5.45 to 5.89 Hz. It is reasonable to conclude that no more than 10% β strand should be present at 2°C.
The assignment of PII as the dominant backbone conformation at 2°C is also consistent with the weak NOE observed between the methyl side chain protons of Ala-4 and the NH proton of Ala-5, compared with the strong NOE between the methyl protons of Ala-4 and its own NH proton (Fig. 4D). The ratio of these NOEs, NOEβi-NHi/NOEβi-NHi+1 ≈4, gives a ψ angle of +145° ± 20° when φ = −70° (Fig. 4C), again consistent with the PII structure.
A model of a PII helix formed by alanine side chains is illustrated for reference in Fig. 6B, whereas Fig. 6A illustrates the common occurrence of the PII backbone conformation (30–32) among residues in high-resolution protein structures. Because Fig. 6A includes residues in α-helices and β sheets, the relative frequency of the PII conformation in loop regions is even higher than indicated in Fig. 6A (see Fig. 1B of ref. 31).
Thermal Transition Between PII and β.
The increase in 3JHNα coupling constant with temperature indicates a partial thermal transition from one backbone conformation to another, and so does the CD difference spectrum between 1 and 55°C (Fig. 5 Inset), which is different from the 2° spectrum and instead resembles that of β structure (34). The increase in 3JHNα with increasing T strongly suggests that β strand is the new backbone conformation produced at higher temperatures, because the α conformation has a lower J value than PII, whereas the J value of β is much larger. As discussed above, NOE data indicate the absence of the α conformation at 2°C.
A first estimate of the enthalpy of the transition from PII to β strand can be made by using the above coupling constants and assuming a two-state transition, with only PII populated at 2°C. The values of 3JHNα given above are 5.45 Hz for PII and 9.81 Hz for β strand. Then the increase in 3JHNα (observed) from 5.45 Hz at 2° to 5.97 Hz at 52° corresponds to the additional presence of 12% β strand at 52° and for the molecule the enthalpy of the β strand is estimated to be 11.6 ± 0.9 kcal/mol higher than that of PII, which is an astonishingly high value. R. Woody (personal communication) points out that this high value for the enthalpy difference drops rapidly to about 3 kcal/mol if 10–15% β is included at 2°C, and it is likely that the actual enthalpy difference is closer to 3 kcal/mol for this reason. The enthalpy difference between PII and β, predicted for a blocked alanine monomer in a quantum mechanics study by Suhai and coworkers, is 1.9 kcal/mol (35).
Formation of the PII helix in the seven-residue alanine sequence may or may not be cooperative, and water may play a role in stabilizing the cooperative structure, as suggested by the crystal structure of a collagen peptide (36, 37). A molecular dynamics simulation of the conformational fluctuations of an alanine 8-mer in explicit water (38) found that bridging water molecules play a role in stabilizing PII relative to the β backbone conformation. Because the Flory isolated pair hypothesis is nearly valid in this region of the φ,ψ-map (ref. 39 and R. V. Pappu and G.D.R., unpublished data), any cooperativity should arise through peptide–solvent interactions, not through intrapeptide interactions. A significant enthalpy difference between PII and β almost certainly reflects a difference in solvation between these two conformations. In the quantum mechanics study by Suhai and coworkers, the energy minimum found for PII disappears in the absence of water (35), whereas the minimum for β remains. Simple amides such as N-methylacetamide show large enthalpies, about −12 kcal/mol (41), for the interaction between water and the polar groups of the amide.
Related Studies of PII in Alanine and Other Peptides.
Short segments of PII helical structure occur commonly in protein structures (42), as do isolated residues with the PII backbone conformation (30, 31) (see figure 1B of ref. 31). These observations suggest that the PII backbone conformation may occur frequently in peptides and proteins. Early CD studies (22–29) of peptides and denatured proteins, and especially studies by vibrational CD (43) and Raman optical activity (44), strongly support this possibility. A new CD study of a seven-residue lysine peptide finds the PII conformation (45). Recent structural studies of very short alanine peptides, as well as a quantum mechanics study of the interaction between water and the peptide backbone, yield the PII conformation. The ab initio quantum mechanics study (35), which uses density functional theory to examine the relative stabilities of eight conformers of N-acetyl-alanine-N-methylamide, with four water molecules H-bonded to its peptide NH and CO groups, finds that the PII backbone conformation is the most stable, followed by β structure (1.9 kcal/mol less stable) and then right-handed α-helix. Neither PII nor right-handed α-helix appears as a stable backbone structure unless water is present. An NMR solution structure of a blocked alanine dipeptide (46), based on the use of residual dipolar couplings and on the assumption that only one backbone conformation is present, yields the PII structure. A recent solution structure of an alanine tripeptide, obtained by combining Fourier transform infrared spectroscopy and polarized Raman spectroscopy, likewise identifies the PII structure (47). This structure was derived by two-dimensional vibrational spectroscopy (48), which has been extended by the use of isotope editing (49). In contrast to our NMR results, in which averaging of different backbone conformations might be present because measurements are made on a slow time scale compared with conformational averaging, the optical spectroscopy results are measured on a fast time scale and, if different backbone conformations are present, the optical spectra should detect the individual conformations.
Entropy Change on Alanine Helix Formation.
Our results show that the term “helix-coil” transition may be a serious misnomer when applied to the unfolding of an alanine helix: the unfolding reaction is in fact an interconversion between two predominantly structured forms, the alanine α-helix and the PII helix. It is customary to estimate the change in backbone conformational entropy accompanying helix formation or the folding of a protein from the assumed number of backbone conformers in the unfolded state: see, for example, ref. 50. In the case of an alanine peptide folding to form the α-helix, the entropy change is now known accurately from experiment. The standard free energy change at 0°C, found from the helix propensity of alanine (51), has been known for several years to be −0.27 kcal/mol. The enthalpy change on helix formation has recently been measured accurately by isothermal titration calorimetry (52) to be −0.9 ± 0.1 kcal/mol. Thus, from ΔG = ΔH − TΔS, the entropy change on alanine helix formation is −2.20 ± 0.37 entropy units per residue, corresponding to a free energy change at 298 K of 0.65 kcal/mol. If PII is the dominant backbone conformation, substantial fluctuations from the PII conformation, as predicted by the analysis of Pappu and Rose (R. V. Pappu and G.D.R., unpublished data), may explain the entropy loss on helix formation. In 1996, Freire and coworkers gave an experimentally based estimate of backbone conformational entropy in an alanine sequence of 4.1 entropy units per residue (53), which they attribute to a substantial number of backbone conformers in the unfolded state. Recently even smaller estimates of backbone conformational entropy in the “unfolded” state than the one we give here have been provided by molecular dynamics simulations of peptides: values near 0.4 kcal/mol per residue in free energy units (298 K) are discussed by Dinner and Karplus (50).
The nucleation constant for alanine helix formation should contain the free energy term arising from the entropy loss of fixing three peptide groups in helical form (54). This free energy change can now be calculated from the entropy change given above as (3) × (0.65) = 1.8 kcal/mol at 298 K. The nucleation constant for the alanine helix has the value of 0.0013 [when corrected for N-capping (see ref. 51)], corresponding to a free energy of 3.9 kcal/mol at 298 K. Thus, one-half of the nucleation free energy is an unfavorable enthalpy. An enthalpic contribution to helix nucleation was predicted by Brant and Flory (55), who pointed out that the dipole–dipole interactions among the peptide NH and CO groups are unfavorable in the α-helical conformation. Solvation of the peptide backbone is likely to be affected by forming a helix nucleus and probably also contributes substantially.
Random Coil Model for Unfolded Proteins.
We refer here to the random coil model of unfolded proteins, a term often used today by protein chemists. Its use implies that there are no strongly preferred backbone conformations. Instead, the energy differences among different backbone conformations should be small, of the order of kT [see the discussion by Flory (56)]. When the energy differences among backbone conformations are large compared with kT, there will be one strongly preferred backbone conformation (56). This is the situation we find here: our observation that a thermal transition is taking place between preferred backbone conformations necessarily implies that the energy difference between the two conformations is large compared with kT.
A further distinction between the “random coil,” whose chain configuration is Gaussian for all chain lengths, and the “statistical coil” or “rotational isomeric-state model,” whose chain configuration becomes Gaussian only for infinite chains (40, 56), is often made today. In practice, all real polymers are statistical coils (56). We use the term “random coil model” for unfolded proteins in the sense described just above, in which the energy differences among backbone conformations are small.
The difference between the meaning of the terms “random coil” and “statistical coil” is discussed in a manuscript (to be submitted) on the simulated conformational behavior of short peptides in aqueous solution by J. A. Vila, D. R. Ripoll, H. A. Baldoni, and H. A. Scheraga.
Acknowledgments
We gratefully acknowledge helpful discussion from Robert Woody, Tobin Sosnick, Jan Hermans, and Michael Levitt. Support for this research was provided by grants from the Office of Naval Research to N.R.K. and from the National Institutes of Health (GM29458) and the Mathers Foundation to G.D.R.
Abbreviations
- NOE
nuclear Overhauser effect
- NOESY
NOE spectroscopy
- PII
canonical left-handed polyproline II helix
References
- 1.Tanford C, Kawahara K, Lapanje S. J Am Chem Soc. 1967;89:729–736. doi: 10.1021/ja00995a035. [DOI] [PubMed] [Google Scholar]
- 2.Nozaki Y, Tanford C. J Am Chem Soc. 1967;89:742–749. doi: 10.1021/ja00980a003. [DOI] [PubMed] [Google Scholar]
- 3.Tanford C, Kawahara K, Lapanje S, Hooker T M, Zarlengo M H, Salahudd A, Aune K C, Takagi T. J Am Chem Soc. 1967;89:5023–5029. doi: 10.1021/ja00995a034. [DOI] [PubMed] [Google Scholar]
- 4.Lapanje S, Tanford C. J Am Chem Soc. 1967;89:5030–5033. doi: 10.1021/ja00995a035. [DOI] [PubMed] [Google Scholar]
- 5.Tanford C. Adv Protein Chem. 1968;23:121–282. doi: 10.1016/s0065-3233(08)60401-5. [DOI] [PubMed] [Google Scholar]
- 6.Aune K C, Salahuddin A, Zarlengo M H, Tanford C. J Biol Chem. 1967;242:4486–4489. [PubMed] [Google Scholar]
- 7.Smith L J, Bolin K A, Schwalbe H, MacArthur M W, Thornton J M, Dobson C M. J Mol Biol. 1996;255:494–506. doi: 10.1006/jmbi.1996.0041. [DOI] [PubMed] [Google Scholar]
- 8.Schwalbe H, Fiebig K M, Buck M, Jones J A, Grimshaw S B, Spencer A, Glaser S J, Smith L J, Dobson C M. Biochemistry. 1997;36:8977–8991. doi: 10.1021/bi970049q. [DOI] [PubMed] [Google Scholar]
- 9.Yao J, Chung J, Eliezer D, Wright P E, Dyson H J. Biochemistry. 2001;40:3561–3571. doi: 10.1021/bi002776i. [DOI] [PubMed] [Google Scholar]
- 10.Spek E J, Olson C A, Shi Z S, Kallenbach N R. J Am Chem Soc. 1999;121:5571–5572. [Google Scholar]
- 11.Olson C A, Spek E J, Shi Z, Vologodskii A, Kallenbach N R. Proteins. 2001;44:123–132. doi: 10.1002/prot.1079. [DOI] [PubMed] [Google Scholar]
- 12.Chen G C, Yang J T. Anal Lett. 1977;10:1195–1207. [Google Scholar]
- 13.States D J, Haberkorn R A, Ruben D J. J Magn Reson. 1982;48:286–292. [Google Scholar]
- 14.Bax A, Davis D G. J Magn Reson. 1985;65:355–360. [Google Scholar]
- 15.Freeman R, Frenkiel T A, Levitt M H. J Magn Reson. 1981;44:409–412. [Google Scholar]
- 16.Jeener J, Meier B H, Bachmann P, Ernst R R. J Chem Phys. 1979;71:4546–4553. [Google Scholar]
- 17.Kumar A, Ernst R R, Wüthrich K. Biochem Biophys Res Commun. 1980;95:1–6. doi: 10.1016/0006-291x(80)90695-6. [DOI] [PubMed] [Google Scholar]
- 18.Piotto M, Saudek V, Sklenar V. J Biomol NMR. 1992;2:661–665. doi: 10.1007/BF02192855. [DOI] [PubMed] [Google Scholar]
- 19.Karplus M. J Phys Chem. 1959;30:11–15. [Google Scholar]
- 20.Vuister G W, Bax A. J Am Chem Soc. 1993;115:7772–7777. [Google Scholar]
- 21.Wüthrich K. NMR of Proteins and Nucleic Acids. New York: Wiley; 1986. [Google Scholar]
- 22.Tiffany M L, Krimm S. Biopolymers. 1968;6:1379–1382. doi: 10.1002/bip.1968.360060911. [DOI] [PubMed] [Google Scholar]
- 23.Rippon W B, Walton A G. Biopolymers. 1971;10:1207–1212. doi: 10.1002/bip.360100710. [DOI] [PubMed] [Google Scholar]
- 24.Drake A F, Siligardi G, Gibbons W A. Biophys Chem. 1988;31:143–146. doi: 10.1016/0301-4622(88)80019-x. [DOI] [PubMed] [Google Scholar]
- 25.Park S H, Shalongo W, Stellwagen E. Protein Sci. 1997;6:1694–1700. doi: 10.1002/pro.5560060809. [DOI] [PMC free article] [PubMed] [Google Scholar]
- 26.Woody R W. Adv Biophys Chem. 1992;2:37–79. [Google Scholar]
- 27.Sreerama N, Woody R W. Biochemistry. 1994;33:10022–10025. doi: 10.1021/bi00199a028. [DOI] [PubMed] [Google Scholar]
- 28.Tiffany M L, Krimm S. Biopolymers. 1968;6:1767–1770. doi: 10.1002/bip.1968.360061212. [DOI] [PubMed] [Google Scholar]
- 29.Bhatnagar R S, Gough C A. Circular Dichroism and the Conformtional Analysis of Biomolecules. New York: Plenum; 1996. [Google Scholar]
- 30.Stapley B J, Creamer T P. Protein Sci. 1999;8:587–595. doi: 10.1110/ps.8.3.587. [DOI] [PMC free article] [PubMed] [Google Scholar]
- 31.Serrano L. J Mol Biol. 1995;254:322–333. doi: 10.1006/jmbi.1995.0619. [DOI] [PubMed] [Google Scholar]
- 32.Kleywegt G J, Jones T A. Structure (London) 1996;4:1395–1400. doi: 10.1016/s0969-2126(96)00147-5. [DOI] [PubMed] [Google Scholar]
- 33.Dyson H J, Rance M, Houghten R A, Wright P E, Lerner R A. J Mol Biol. 1988;201:201–217. doi: 10.1016/0022-2836(88)90447-0. [DOI] [PubMed] [Google Scholar]
- 34.Greenfield N, Fasman G D. Biochemistry. 1969;8:4108–4116. doi: 10.1021/bi00838a031. [DOI] [PubMed] [Google Scholar]
- 35.Han W G, Jalkanen K J, Elstner M, Suhai S. J Phys Chem B. 1998;102:2587–2602. [Google Scholar]
- 36.Bella J, Eaton M, Brodsky B, Berman H M. Science. 1994;266:75–81. doi: 10.1126/science.7695699. [DOI] [PubMed] [Google Scholar]
- 37.Bella J, Brodsky B, Berman H M. Structure (London) 1995;3:893–906. doi: 10.1016/S0969-2126(01)00224-6. [DOI] [PubMed] [Google Scholar]
- 38.Sreerama N, Woody R W. Proteins. 1999;36:400–406. [PubMed] [Google Scholar]
- 39.Pappu R V, Srinivasan R, Rose G D. Proc Natl Acad Sci USA. 2000;97:12565–12570. doi: 10.1073/pnas.97.23.12565. [DOI] [PMC free article] [PubMed] [Google Scholar]
- 40.Cantor C R, Schimmel P R. Biophysical Chemistry, Part III: The Behavior of Biological Macromolecules. New York: Freeman; 1980. pp. 991–996. [Google Scholar]
- 41.Avbelj F, Luo P, Baldwin R L. Proc Natl Acad Sci USA. 2000;97:10786–10791. doi: 10.1073/pnas.200343197. [DOI] [PMC free article] [PubMed] [Google Scholar]
- 42.Adzhubei A A, Sternberg M J. J Mol Biol. 1993;229:472–493. doi: 10.1006/jmbi.1993.1047. [DOI] [PubMed] [Google Scholar]
- 43.Keiderling T A, Silva R A, Yoder G, Dukor R K. Bioorg Med Chem. 1999;7:133–141. doi: 10.1016/s0968-0896(98)00217-x. [DOI] [PubMed] [Google Scholar]
- 44.Barron L D, Hecht L, Blanch E W, Bell A F. Prog Biophys Mol Biol. 2000;73:1–49. doi: 10.1016/s0079-6107(99)00017-6. [DOI] [PubMed] [Google Scholar]
- 45.Rucker A L, Creamer T P. Protein Sci. 2002;11:980–985. doi: 10.1110/ps.4550102. [DOI] [PMC free article] [PubMed] [Google Scholar]
- 46.Poon C D, Samulski E T, Weise C F, Weisshaar J C. J Am Chem Soc. 2000;122:5642–5643. [Google Scholar]
- 47.Schweitzer-Stenner R, Eker F, Huang Q, Griebenow K. J Am Chem Soc. 2001;123:9628–9633. doi: 10.1021/ja016202s. [DOI] [PubMed] [Google Scholar]
- 48.Woutersen S, Hamm P. J Phys Chem B. 2000;104:11316–11320. [Google Scholar]
- 49.Woutersen S, Hamm P. J Chem Phys. 2001;114:2727–2737. [Google Scholar]
- 50.Dinner A R, Karplus M. Angew Chem Int Ed. 2001;40:4615–4616. doi: 10.1002/1521-3773(20011217)40:24<4615::aid-anie4615>3.0.co;2-h. [DOI] [PubMed] [Google Scholar]
- 51.Rohl C A, Chakrabartty A, Baldwin R L. Protein Sci. 1996;5:2623–2637. doi: 10.1002/pro.5560051225. [DOI] [PMC free article] [PubMed] [Google Scholar]
- 52.Lopez M M, Chin D-H, Baldwin R L, Makhatadze G I. Proc Natl Acad Sci USA. 2002;99:1298–1302. doi: 10.1073/pnas.032665199. [DOI] [PMC free article] [PubMed] [Google Scholar]
- 53.D'Aquino J A, Gomez J, Hilser V J, Lee K H, Amzel L M, Freire E. Proteins. 1996;25:143–156. doi: 10.1002/(SICI)1097-0134(199606)25:2<143::AID-PROT1>3.0.CO;2-J. [DOI] [PubMed] [Google Scholar]
- 54.Zimm B H, Doty P, Iso K. Proc Natl Acad Sci USA. 1959;45:1601–1607. doi: 10.1073/pnas.45.11.1601. [DOI] [PMC free article] [PubMed] [Google Scholar]
- 55.Brant D A, Flory P J. J Am Chem Soc. 1965;87:663–664. [Google Scholar]
- 56.Flory P J. Statistical Mechanics of Chain Molecules. New York: Wiley; 1969. pp. 30–31. [Google Scholar]


