

Abstract
DGAT1 encodes diacylglycerol O-acyltransferase (EC 2.3.1.20), a microsomal enzyme that catalyzes the final step of triglyceride synthesis. It became a functional candidate gene for lactation traits after studies indicated that mice lacking both copies of DGAT1 are completely devoid of milk secretion, most likely because of deficient triglyceride synthesis in the mammary gland. Our mapping studies placed DGAT1 close to the region of a quantitative trait locus (QTL) on bovine chromosome 14 for variation in fat content of milk. Sequencing of DGAT1 from pooled DNA revealed significant frequency shifts at several variable positions between groups of animals with high and low breeding values for milk fat content in different breeds (Holstein–Friesian, Fleckvieh, and Braunvieh). Among the variants was a nonconservative substitution of lysine by alanine (K232A), with the lysine-encoding allele being associated with higher milk fat content. Haplotype analysis indicated the lysine variant to be ancestral. Two animals that were typed heterozygous (Qq) at the QTL based on marker-assisted QTL-genotyping were heterozygous for the K232A substitution, whereas 14 animals that are most likely qq at the QTL were homozygous for the alanine-encoding allele. An independent association study in Fleckvieh animals confirmed the positive effect of the lysine variant on milk fat content. We consider the nonconservative K232A substitution to be directly responsible for the QTL variation, although our genetic studies cannot provide formal proof.
Milk fat content in cattle is a continuously distributed trait with heritability estimates between 0.45 and 0.50 (1). The systematic mapping of quantitative trait loci (QTL) underlying the genetic variance of milk production traits resulted in approximate map positions of QTL for milk fat content (2–5). The most consistent results were reported for a QTL on chromosome 14 (4, 6). On the basis of the analysis of seven chromosomes carrying the milk fat content increasing allele Q, the QTL was pinpointed to an interval of 5 centimorgans (cM) (7). Even with further refinement of the QTL position, determining the molecular basis of the variation at the QTL by a purely positional approach would be extremely difficult. The combined information from the function of gene products and the chromosomal location of genes allows the identification of functional and positional candidate genes which can then be screened for DNA variation that might represent the molecular basis for the variation at the QTL.
Recently, Cases et al. (8) showed at least two enzymes catalyze the reaction in which diacylglycerol is covalently joined to long-chain fatty acyl-CoAs to form triglycerides as major constituents of fat, including fat of secreted milk. DGAT1 (diacylglycerol O-acyltransferase homolog 1, mouse) encodes one of these enzymes (EC 2.3.1.20). It became a functional candidate gene for milk fat content after studies indicated that lactation is deficient in female mice lacking both copies of DGAT1, most likely because of impaired or deficient triglyceride synthesis in the mammary gland (9). In the present study we report the mapping of DGAT1 in the region of the milk fat content QTL on bovine chromosome 14. We present evidence that increased milk fat content in different breeds is strongly associated with a lysine at position 232 of the protein encoded by bovine DGAT1; an alanine at this position is associated with lowered milk fat content.
Materials and Methods
Primers.
Primers were designed based on expressed sequence tag (EST)-derived bovine DNA sequence, human cDNA sequence, and obtained bacterial artificial chromosome (BAC) sequence by using the PRIMER3 program (http://www.genome.wi.mit.edu/cgi-bin/primer/primer3_www.cgi).
Screening of BAC Library.
The bovine RPCI-42 genomic BAC library (10) was screened by using a radiolabeled PCR product of 565 bp containing parts of bovine exons 16 and 17 as a probe for colony hybridization. Three clones (56-F1, 240-A1, 269-H17) were identified and confirmed by PCR.
Mapping.
The map position of DGAT1 on human chromosome 8 was determined by PCR analysis of the Gene Bridge 4 human–hamster radiation hybrid panel (11) with primers derived from the 3′ untranslated region of human DGAT1 mRNA (F, 5′-GAGGCCTCTCTGCCCTATG-3′, R, 5′-TTTATTGACACCCTCGGACC-3′). Results were analyzed with a program from The Sanger Center (http://www.sanger.ac.uk/Software/RHserver/RHserver.shtml). The chromosomal location of DGAT1 in cattle was determined by fluorescence in situ hybridization observing a standard protocol and by PCR analysis of a bovine–hamster radiation hybrid panel (12) with the primers: F, 5′-GTGGCTGTCACTCATCATCG-3′ and R, 5′-TGTGCACAGCACTTTATTGAC-3′.
DNA Samples and Pooling.
DNA was prepared from bovine semen by a standard method. Semen samples were obtained from individuals belonging to different taurine (Bos taurus taurus) and indicine (B. taurus indicus) breeds. DNA concentrations were measured by using a fluorometer and adjusted to a concentration of 25 ng/μl. Quality and quantity of DNA samples were assessed independently through agarose gel electrophoresis and PCR. Only DNA samples allowing consistent quantification yielding equal PCR amplification were used for the preparation of DNA pools. Pools were composed of DNA from bulls of German Holstein–Friesian (32 animals per pool), German Fleckvieh (32 animals per pool) and German Braunvieh (20 animals per pool) populations with highest (+) and lowest (−) breeding values for milk fat content (percentage of fat in milk) as evaluated internationally by INTERBULL (http://www.interbull.org) by using the Best Linear Unbiased Prediction (13). Holstein–Friesian bulls were selected from 2,857 artificial insemination bulls born 1988 or later (mean breeding value for milk fat content of −0.148 and ±0.284 SD). Bulls with breeding values greater than 0.48 and less than −0.68 were selected. Mean breeding values of pooled groups were: HF32+, 0.622 ± 0.125; HF32−, −0.771 ± 0.063. Fleckvieh bulls were selected among 4,070 artificial insemination bulls born 1990 or later (mean breeding value of 0.089 ± 0.217). Bulls with breeding values greater than 0.56 and less than −0.31 were selected. Mean breeding values of pooled groups were: FV32+, 0.683 ± 0.153; FV32−, −0.454 ± 0.061. Braunvieh bulls were selected among 656 artificial insemination bulls born 1990 or later (mean breeding value of 0.006 ± 0.185). Bulls with breeding values greater than 0.29 and less than −0.22 were selected. Mean breeding values of pooled groups were: BV20+, 0.424 ± 0.156; BV20−, −0.317 ± 0.096.
Polymorphism Detection.
Screening for variation was performed by PCR amplification and sequencing on an ABI377 sequencer by using DNA samples of individual animals and pooled DNA and by using primer sets covering DGAT1 and the flanking ends (for primer sequences please contact authors). Sequence data were analyzed by using the Phred/Phrap/Polyphred/Consed software suite (14–17). A GC-to-AA exchange at positions 10433–10434 resulted in preferential PCR amplification of the AA allele. The amplitudes of the sequencing traces varied considerably between heterozygous animals. The inclusion of 5% DMSO in the PCR resulted in equal amplification of the two alleles and consistent patterns for the heterozygous samples.
Estimation of Allele Frequencies on the Basis of Sequencing Traces.
Amplitude values at variable positions were extracted from data files “poly” created by the base calling program Phred (14, 15). The amplitude value for a given base was divided by the normalization factor for that base. Comparisons between the normalized amplitude values of pooled DNA (P) and mean normalized amplitude values of homozygous (Ho) and heterozygous (He) animals, respectively, were used to estimate allele frequencies. First, peak drops of pooled DNA (DP) and of heterozygous individuals (DH) relative to the peaks of homozygous individuals were calculated, i.e., DP = Ho − P, DH = Ho − He. Next, the following quotients were calculated: Q1 = P/Ho, Q2 = P/He for P ≤ He, and Q2 = He/P for P > He, Q3 = DP/DH for DP ≤ DH, and Q3 = DH/DP for DP > DH. The largest quotient dictated the calculation method for estimating optimal allele frequency (F) when assuming a linear relationship between normalized amplitude values and frequency in the given data range. The calculation methods were: F = P/Ho for Q1 being the largest quotient; F = (P × 0.5)/He for Q2 being the largest quotient; F = 1 − [(DP × 0.5)/DH] for Q3 being the largest quotient. The estimates for base 1 and the alternative base 2 were designated F1 and F2, respectively. Finally, an average estimate for each base was calculated: F1average = [(1 − F2) + F1]/2 and F2average = 1 − F1average.
QTL Mapping.
QTL mapping was performed in a Fleckvieh granddaughter design (18) consisting of 20 paternal half-sib families with a total of 695 sons (18–58 sons per sire). Observations used for linkage analysis were INTERBULL breeding values for milk fat content. Breeding values of sons had an average reliability of 0.85 and ranged from −0.60 to +0.96 (mean of 0.027 ± 0.251 SD). Sires and their sons were genotyped for eight microsatellite markers on chromosome 14. The ILSTS039 upstream primer was newly designed (5′-CCGAACAGAGTTGGACACAA-3′). All other microsatellites were amplified by using published primer pairs (http://www.ri.bbsrc.ac.uk, http://www.marc.usda.gov) and analyzed by multiplexing fluorescence-labeled PCR products on an ABI310 DNA sequencer. Average marker heterozygosity of sires was 62.5% with a maximum of 90% at the position of the marker ILSTS039. A standard interval-mapping procedure with multiple linked markers (19) was applied for linkage analysis. A chromosome-wide significance threshold was obtained empirically based on 10,000 permutations of the breeding values as described (20). The genome-wide significance threshold accounting for multiple chromosomes was determined by Bonferroni correction (21).
Restriction Fragment Length Polymorphism (RFLP) Assay.
Detection of allelic variation at nucleotide positions 10433–10434 of the DGAT1 gene was performed by CfrI cleavage in a 411-bp PCR product (primers: F, 5′-GCACCATCCTCTTCCTCAAG-3′; R, 5′-GGAAGCGCTTTCGGATG-3′). Cleavage by CfrI is diagnostic for the alanine-bearing allele. Five percent DMSO was added to the PCR reaction for equal amplification of both alleles.
Assessment of a VNTR in the 5′ End of DGAT1.
The number of repetitions of the repeat unit was determined on an ABI377 sequencer on the basis of the electrophoretic mobility of fluorescence-labeled PCR products (primers: F, 5′-TCAGGATCCAGAGGTACCAG-3′; R, 5′-GGGGTCCAAGGTTGATACAG-3′).
Results
To assess the positional candidate gene status of DGAT1, its precise position on human chromosome 8 was determined. Radiation hybrid mapping placed it next to marker AFMa082wh9 at cR3000 = 552.63 (lod score = 9.5) on the GB4 map (http://www.ncbi.nlm.nih.gov/genemap99/), 3.87 centirads from KIAA0278, a marker that is 16.6 centirads from CSSM066 on the bovine radiation hybrid map (7). Ref. 7 showed CSSM066 to be part of the identical-by-descent segment that indicated the minimal mapping interval of the milk fat content QTL, which provided indirect support of the positional candidate status of DGAT1 with regard to the QTL.
BLASTN analysis with human DGAT1 mRNA sequence identified 12 bovine sequences in the EST division GenBank. Some of these ESTs have been annotated as DGAT1-specific by the COMPASS approach (22). The EST-derived bovine mRNA corresponds to the human mRNA from position 509 to the 3′ end.
Bovine BAC clones carrying DGAT1 were isolated to obtain the sequence of the 5′ end of the gene and its promotor region and to determine its structure. Iterative sequencing directly from BAC-DNA, sequencing from genomic DNA, and comparison of the resulting sequence with human mRNA and bovine EST-derived mRNA for DGAT was the basis for unraveling the exon–intron structure of the gene (Fig. 1). In total, the determined sequence spans 14,117 bp. Mapping of BAC-DNA containing DGAT1 by fluorescence in situ hybridization assigned bovine DGAT1 to a region on bovine chromosome 14 close to the centromere, the approximate physical location of the milk fat content QTL. Radiation hybrid mapping directly in cattle placed DGAT1 distal to ILSTS039, a marker that at the time indicated the proximal boundary of the chromosome segment predicted to contain the QTL (7). This location of DGAT1 theoretically excluded it as a positional candidate for the milk fat content QTL. However, because of the potential errors in determining a QTL interval by identical-by-descent-mapping, we continued to treat DGAT1 as a candidate gene.
Figure 1.
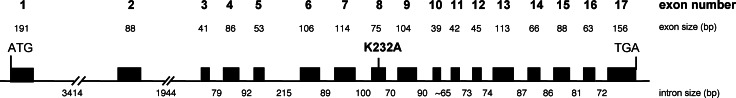
Structure of bovine DGAT1. Exons are shown as rectangles. The sequence of intron 10 (≈65 bp) could not be completely resolved by sequencing. K232A indicates the only nonsynonymous mutation.
We screened pooled DNA and DNA of individuals from different breeds and species for variation within the determined sequence. Direct sequencing revealed 19 variable positions and regions (Table 1), 17 of which were single-base exchanges, whereas two represented variable numbers of repeat units. We also observed variable PCR amplification in a region that could not be resolved by sequencing. However, fragmentary sequence information suggests the presence of a longer G stretch that could be variable in length. Variable positions 10433 and 10434 are located in exon 8, causing a lysine-to-alanine exchange at position 232 of the predicted protein (K232A). Alignment of DGAT1 amino acid sequences of different plant and animal species indicates a conserved lysine residue at position 232 of the bovine sequence (Fig. 2). All other variants are silent, occurring either within introns or in the 5′ or 3′ untranslated regions.
Table 1.
Variable positions in and around DGAT1
| Position* | Variation | Position* | Variation |
|---|---|---|---|
| 1465 | (AGGCCCCGCCCTCCCCGG)n† | 10515 | (G)n‡ |
| 3343 | C → G/T | ≈10800 | + → −§ |
| 3399 | T → G | 11030 | G → A |
| 7233 | A → G | 11048 | C → T |
| 8567 | A → G | 11993 | T → C |
| 8607 | G → A | 12005 | A → C |
| 9284 | T → C | 12036 | T → C |
| 10147 | A → C | 12056 | A → G |
| 10433 | G → A | 12136 | G → A |
| 10434 | C → A | 13309 | G → C |
Numbering is according to the deposited sequence (GenBank accession no. AJ318490).
n = 3, 4, 5, 6, 7.
n = 6, 7.
+, PCR product present; −, no or very weak PCR product.
Figure 2.
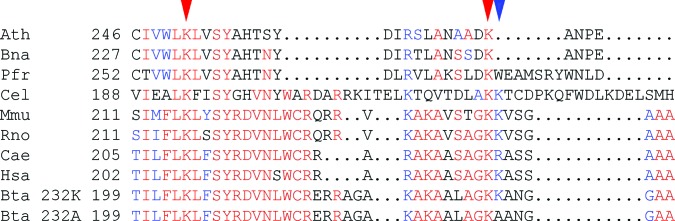
Alignment of the DGAT amino acid sequences of Arabidopsis thaliana (Ath), Brassica napus (Bna), Perilla fructescens (Pfr), Caenorhabditis elegans (Cel), Mus musculus (Mmu), Rattus norvegicus (Rno), Ceropithecus aethiops (Cae). Homo sapiens (Hsa) and two alleles of Bos taurus (Bta_ 232K, Bta_232A) by using PILEUP of the GCG package (23). Sequences were assembled by using BOXSHADE (http://www.isrec.isb-sib.ch:8080/software/BOX_form.html). Numbers on the left indicate amino acid positions. Red and blue letters indicate identical and conserved amino acids, respectively. Red arrows indicate identical lysine residues that might play a role in acyl-CoA binding. The blue arrow indicates conserved amino acids in animal species and in the bovine allele associated with high milk fat content. The lysine-to-alanine mutation at this position is not conservative and could have a negative effect on the acyl-CoA-binding capacity of DGAT.
We unambiguously derived at least eight haplotypes through direct sequencing of animals belonging to different breeds of B. taurus taurus and B. taurus indicus as well as of animals of Bos grunniens (yak) and Bubalus bubalus (water buffalo) at six of the variable nucleotide positions. Lysine-encoding haplotypes are present in yak and water buffalo. Thus, the lysine-encoding variant is likely the ancestral state of DGAT1. The K232A substitution probably took place early in the history of domesticated cattle or even before domestication as surmised by the presence of the alanine variant in the Anatolian Black breed which is indigenous to a region known as the site of domestication of the European Bos taurus (24). The alanine variant was not seen in the subspecies B. taurus indicus which was domesticated separately (25). An RFLP assay was applied to obtain preliminary estimates on the frequency of the lysine- and alanine-encoding alleles in several cattle breeds and species of the Bovinae subfamily (Fig. 3B).
Figure 3.

(A) Haplotypes of DGAT1 based on nucleotide positions 3343, 10433, 10434, 11030, 11048, and 11993 determined by direct sequencing and (B) preliminary frequency estimates for the lysine (red) and alanine (yellow) encoding alleles in different species and breeds determined by RFLP assay (n, number of animals).
The allele frequencies at six variable positions in the pools of animals with high and low breeding values for milk fat content, respectively, are visualized in Fig. 4. Distinct frequency differences exist for the Fleckvieh and Holstein–Friesian breeds between the groups with high and low breeding values. The most extreme differences are between the “positive” and “negative” pools in the Holstein–Friesian breed. In both breeds, the lysine-encoding variant is more frequent in animals with high breeding values. The lysine-encoding allele is also present in Braunvieh animals from the high end of the distribution of the milk fat content breeding values, although to a lesser extent than in the other breeds. This finding is remarkable considering the low frequency of the lysine allele in this breed (Fig. 3B). Allele frequencies calculated for position 10433 by using the genotyping results from the RLFP assay in individual animals of the pools (data not shown) were in good agreement with those estimated from the analysis of the sequencing traces, providing support for the latter.
Figure 4.

(A) Distributions of breeding values for milk fat content of Holstein–Friesian, Fleckvieh, and Braunvieh artificial insemination bulls. Colored areas indicate the range of the breeding values, from which bulls were chosen for the extreme positive (+, red) and negative (−, yellow) pools. (B and E) Sequence trace views of sequencing traces for positions 10430–10437 within DGAT1 for DNA pools (B) and individual animals (E). The vertical line indicates nucleotide position 10433. Positions 10433 and 10434 are responsible for the K232A substitution. (C) Estimates of allelic frequencies in the +pool (red) and −pool (yellow) for each breed based on sequencing traces. (D) Frequencies of alleles with 3, 4, 5, 6, and 7 repeat units in the 5′ region of DGAT1 in the +pool (red) and −pool (yellow) for each breed determined by fragment analysis.
Association of variation in DGAT1 with milk fat content variation is evidence that DGAT1 represents the milk fat QTL on chromosome 14 and that the predicted K232A substitution is responsible for the QTL variation, if the observed association (i) is not a relict of population admixture nor (ii) is due to a causal variant located in another gene but in linkage disequilibrium with the DGAT1 variants. Linkage disequilibrium could indeed explain association of DGAT1 variants and milk fat content, especially if the QTL is confirmed to reside proximal to ILSTS039 as suggested by Riquet et al. (7). Admixture also cannot be ruled out for all three breeds investigated when considering the frequencies of the lysine-encoding allele (Fig. 3B) and the history of the breeds. Admixture in Holstein–Friesian and Braunvieh could result from crossbreeding with Jersey, a breed with high milk fat content and high frequency of the lysine-encoding allele, whereas admixture in Fleckvieh could result from the introgression of Holstein–Friesian. However, pedigree analysis reveals that animals with Holstein–Friesian ancestry can be found both in the “positive” and the “negative” pools, which argues against admixture being exclusively responsible for the observed association.
Another argument for DGAT1 (or linked loci) being responsible for the QTL variation on chromosome 14 is provided by QTL mapping in Fleckvieh by using a half-sib or “granddaughter” design. The test statistic indicates that the most likely position of the QTL along chromosome 14 is close to marker ILSTS039 (Fig. 5A). Evidence was highly significant for segregation of the QTL in 2 of 20 families (Fig. 5B) with estimates of QTL effects for milk fat content being 0.313 ± 0.070 and 0.409 ± 0.064, respectively. These allele substitution effects greatly exceed the genetic standard deviation of about 0.2 in the Fleckvieh population and account for about 10% of the phenotypic variation in this breed (based on a frequency of 0.07). The genotypes at the predicted K232A substitution determined by an RFLP assay are compatible with the heterozygous status of the segregating (Qq) sires and homozygosity of the alanine-encoding variant of the nonsegregating (most likely qq) sires (Fig. 5C). Direct sequencing of DGAT1 from DNA and determining the repeat number of the 5′ VNTR in the two segregating bulls and some of their progeny allowed us to derive their haplotypes on the basis of the genotypes of homozygous progeny. The lysine-encoding variant is present on two different haplotypes. Bull 16 carries the only lysine-encoding haplotype we found in Holstein–Friesian, and bull 10 carries a lysine-encoding haplotype found in Fleckvieh, Anatolian Black, and Sahival (Figs. 3A and 6), which could indicate that a lysine-encoding allele has been introduced into Fleckvieh from Holstein–Friesian. Pedigree analysis indeed shows that the greatgrandfather of bull 16 was a purebred Holstein–Friesian sire, whereas no indication of Holstein–Friesian ancestry exists for bull 10. Three (3343, 11030, 11993) of the seven variable positions that make up the haplotypes are homozygous in Qq bull 10 (Fig. 6). Thus, they can be excluded as causal. The variants responsible for the K232A polymorphism, however, are heterozygous in both Qq bulls.
Figure 5.

(A) Across family test statistic curve for QTL analyses of milk fat content on chromosome 14 for a Fleckvieh granddaughter design. F ratios testing for the presence of a segregating QTL are plotted for given positions along the chromosome. The marker map with distances in centimorgans (cM) between markers is shown on the x axis. Empirical chromosome-wide and genome-wide 1% significance levels achieved by 10,000 permutations are indicated as horizontal lines. (B) Bars show transformed significance levels [log (1/p)] of the test statistic for a segregating QTL present at 0 cM within each family (x axis). The horizontal line indicates the transformed 1% significance level for a single family after correcting for multiple testing of 20 families. QTL effects for milk fat content and their respective standard errors are shown on top of the bars for significantly segregating sires. (C) Detection of allelic variation at nucleotide positions 10433 and 10434 (K232A) of the DGAT1 gene by CfrI cleavage in a 411-bp PCR product from bovine genomic DNA of sires 1–16. Cleavage by CfrI is diagnostic for the allele encoding alanine (GC). No DNA samples were available for sires 17–20.
Figure 6.
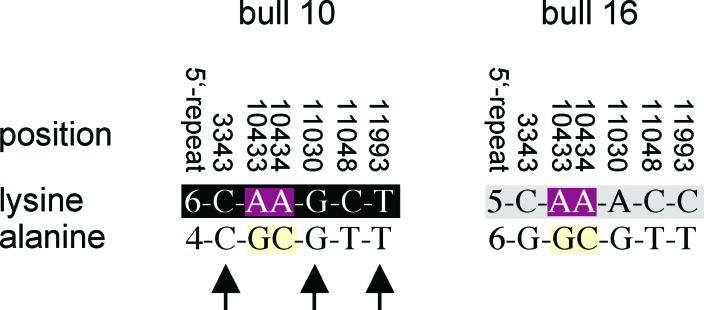
Haplotypes of two segregating (Qq) Fleckvieh bulls. The haplotype on the black background is found in Fleckvieh, Anatolian Black, and Sahival; the haplotype on the gray background is the only lysine-encoding haplotype that we found in Holstein–Friesian (Fig. 3A). The arrows indicate the homozygous sites, implicating that these variants are not causal.
An independent association study was performed based on breeding values for milk fat content of the sons of nonsegregating sires. These sons were grouped according to the allelic variant that they received from their dams as determined by RFLP assay (Fig. 7). The respective means of breeding values were compared after correction of half the sire's breeding value. The difference of +0.265 for the group carrying the lysine variant was highly significant (P < 0.0001) and strongly supports the size of the gene substitution effect found by linkage analysis. It also agrees with the results of the association study presented above. Because the dams can be considered to represent a random sample of the Fleckvieh population with regard to milk fat content, the association involving the sons of nonsegregating sires is not likely to be confounded by admixture.
Figure 7.

Distribution of breeding values for sons of nonsegregating sires grouped according to whether or not they have received the lysine allele from their dams. The numbers of bulls (n), the corrected means (μ), and standard deviations (σ) are indicated for the two groups.
In conclusion, population admixture cannot be completely ruled out to have contributed to the observed associations of lysine-encoding alleles with high breeding values for milk fat content. However, it is unlikely to be the major determinant. The linkage study in Fleckvieh clearly indicates that the chromosomal region harboring DGAT1 is involved in the variation of milk fat content not only in Holstein–Friesian but also in Fleckvieh.
Discussion
We have presented evidence that genomic variation in the chromosomal region harboring DGAT1 is associated with variation in milk fat content. We cannot present experimental evidence to prove formally the hypothesis that DGAT1 actually represents the milk fat QTL. However, we favor this hypothesis on the basis of the following:
• The lysine variant is consistently associated with high milk fat content and the alanine variant with low milk fat content in different breeds.
• The evolutionarily conserved lysine residue at position 232 together with neighboring conserved lysine residues (see Fig. 2) may be important for the interaction of the CoA moiety with DGAT, as suggested for other CoA-dependent enzymes (26, 27). Hence, the alanine residue at position 232 could have a negative effect on the acyl-CoA-binding capacity of DGAT, accounting for its associated lower milk fat content. The lysine variant may represent the more efficient allele with regard to fat synthesis, because it is present at a high frequency or exclusively in species and breeds with a higher milk fat content and in animals from the “high-end” of the trait distribution.
Proving the identity of the QTL alleles with DGAT1 alleles by genetic means, i.e., by exclusion of linkage disequilibrium, which is a priori extensive in cattle (28), will be difficult. At the very least (29), we have revised the map position of the QTL reported by Riquet et al. (7) during the final stage of preparing this manuscript to encompass a region distal to ILSTS039. Thus, the map position of DGAT1 no longer precludes it theoretically from containing causal QTL variation. However, proving a causal involvement of DGAT1 will require studying the effects of the different allelic variants on the enzymatic activity both in vitro and in vivo, i.e., in transgenic animals. Our genetic studies provide a basis to establish hypotheses concerning determinants affecting the rate of fat synthesis not only in the context of triglyceride production in animals and plants but also in the context of human diseases caused by excess triglyceride synthesis and deposition.
If the K232A polymorphism is indeed identical with allelic variation at the milk fat QTL, it represents “classical” QTL variation, i.e., the molecular variation of DGAT1 would not be the only explanation for genetic variation of milk fat content. Such variation is compatible with the model of quantitative genetics assuming variation is due to so-called “polygenes” responsible for a continuously varying trait. The identification of causal molecular variation in one of the polygenes should facilitate the molecular analysis of other genes involved in milk fat content variation.
In our QTL study we assumed a biallelic situation, i.e., the alleles Q and q. The presence of both the milk fat content-enhancing and -lowering variants in different haplotypes indicates the presence of multiple alleles at the QTL. This hypothesis can now be tested by analyzing the effects of the different haplotypes on milk fat content. It will be particularly interesting to involve the VNTR in the 5′ region in such studies. Although variation in the number of repeats is unlikely to be a major causal determinant, especially considering that the five- and six-repeat alleles occur equally frequently in the two Braunvieh pools (Fig. 4D), it remains that the VNTR could affect the regulation of the gene. Together, variation in the expression level of the gene and in the activity of the enzyme due to a polymorphism affecting the amino acid sequence could determine the net rate of triglyceride synthesis.
Acknowledgments
We thank the Bayerische Landesanstalt für Tierzucht in Grub and the Vereinigte Informationssysteme für Tierhaltung w.V. in Verden for providing pedigree information and INTERBULL breeding values. Semen samples were generously donated by German artificial insemination stations. C. Kühn assembled semen samples for Holstein–Friesian pools. DNA used in pedigree analyses was prepared by K. Bodis. T. Meitinger supplied DNA samples of radiation hybrid panel GB4. R. Antes, R. Böhm, and A. Keller provided excellent technical assistance. H. Gossner contributed valuable comments concerning the Fleckvieh pedigrees. Zebu DNA was generously provided by D. Bradley. O. Bininda-Emonds provided valuable comments on the manuscript. This work was funded by the Arbeitsgemeinschaft Deutscher Rinderzüchter (German cattle breeders federation), the Bundesministerium für Bildung und Forschung (Federal Ministry of Education and Research, Project 0311020A), and the European Union (EURIBDIS Project, BIO 4-CT97-0471).
Abbreviations
- DGAT
diacylglycerol acyltransferase
- DGAT1
symbols of gene encoding DGAT
- QTL
quantitative trait locus
- BAC
bacterial artificial chromosome
- K232A
lysine by alanine substitution at amino acid position 232 of DGAT
- EST
expressed sequence tag
- RFLP
restriction fragment length polymorphism
Footnotes
Data deposition: The sequence reported in this paper has been deposited in the GenBank database (accession no. AJ318490).
References
- 1.Goddard M E, Wiggans G R. In: The Genetics of Cattle. Fries R, Ruvinsky A, editors. Wallingford, U.K.: CABI; 1999. pp. 511–537. [Google Scholar]
- 2.Georges M, Nielsen D, Mackinnon M, Mishra A, Okimoto R, Pasquino A T, Sargent L S, Sorensen A, Steele M R, Zaho X, et al. Genetics. 1995;139:907–920. doi: 10.1093/genetics/139.2.907. [DOI] [PMC free article] [PubMed] [Google Scholar]
- 3.Zhang Q, Boichard D, Hoeschele I, Ernst C, Eggen A, Murkve B, Pfister-Genskow M, Witte L A, Grignola F E, Uimari P, et al. Genetics. 1998;149:1959–1973. doi: 10.1093/genetics/149.4.1959. [DOI] [PMC free article] [PubMed] [Google Scholar]
- 4.Heyen D W, Weller J I, Ron M, Band M, Beever J E, Feldmesser E, Da Y, Wiggans G R, VanRanden P M, Lewin H A. Physiol Genomics. 1999;1:165–175. doi: 10.1152/physiolgenomics.1999.1.3.165. [DOI] [PubMed] [Google Scholar]
- 5.Velmala R J, Vilkki H J, Elo K T, de Koning D J, Maki-Tanila A V. Anim Genet. 1999;30:136–143. doi: 10.1046/j.1365-2052.1999.00435.x. [DOI] [PubMed] [Google Scholar]
- 6.Coppieters W, Riquet J, Arranz J J, Berzi P, Cambisano N, Grisart B, Karim L, Marcq F, Moreau L, Nezer C, et al. Mamm Genome. 1998;9:540–544. doi: 10.1007/s003359900815. [DOI] [PubMed] [Google Scholar]
- 7.Riquet J, Coppieters W, Cambisano N, Arranz J J, Berzi P, Davis S K, Grisart B, Farnir F, Karim L, Mni M, et al. Proc Natl Acad Sci USA. 1999;96:9252–9257. doi: 10.1073/pnas.96.16.9252. [DOI] [PMC free article] [PubMed] [Google Scholar]
- 8.Cases S, Stone S J, Zhou P, Yen E, Tow B, Lardizabal K D, Voelker T, Farese R V., Jr J Biol Chem. 2001;276:38870–38876. doi: 10.1074/jbc.M106219200. [DOI] [PubMed] [Google Scholar]
- 9.Smith S J, Cases S, Jensen D R, Chen H C, Sande E, Tow B, Sanan D A, Raber J, Eckel R H, Farese R V., Jr Nat Genet. 2000;25:87–90. doi: 10.1038/75651. [DOI] [PubMed] [Google Scholar]
- 10.Warren W, Smith T P, Rexroad C E, Fahrenkrug S C, Allison T, Shu C L, Catanese J, de Jong P J. Mamm Genome. 2000;11:662–663. doi: 10.1007/s003350010126. [DOI] [PubMed] [Google Scholar]
- 11.Gyapay G, Schmitt K, Fizames C, Jones H, Vegaczarny N, Spillett D, Muselet D, Prud'Homme J F, Dib C, Auffray C, et al. Hum Mol Genet. 1996;5:339–346. doi: 10.1093/hmg/5.3.339. [DOI] [PubMed] [Google Scholar]
- 12.Womack J E, Johnson J S, Owens E K, Rexroad C E, III, Schläpfer J, Yang Y-P. Mamm Genome. 1997;8:854–856. doi: 10.1007/s003359900593. [DOI] [PubMed] [Google Scholar]
- 13.Henderson C R. J Dairy Sci. 1974;57:963–972. [Google Scholar]
- 14.Ewing B, Hillier L, Wendl M C, Green P. Genome Res. 1998;8:175–185. doi: 10.1101/gr.8.3.175. [DOI] [PubMed] [Google Scholar]
- 15.Ewing B, Green P. Genome Res. 1998;8:186–194. [PubMed] [Google Scholar]
- 16.Nickerson D A, Tobe V O, Taylor S L. Nucleic Acids Res. 1997;25:2745–2751. doi: 10.1093/nar/25.14.2745. [DOI] [PMC free article] [PubMed] [Google Scholar]
- 17.Gordon D, Abajian C, Green P. Genome Res. 1998;8:195–202. doi: 10.1101/gr.8.3.195. [DOI] [PubMed] [Google Scholar]
- 18.Weller J I, Kashi Y, Soller M. J Dairy Sci. 1990;73:2525–2537. doi: 10.3168/jds.S0022-0302(90)78938-2. [DOI] [PubMed] [Google Scholar]
- 19.Knott S A, Elsen J M, Haley C S. Theor Appl Genet. 1996;93:71–80. doi: 10.1007/BF00225729. [DOI] [PubMed] [Google Scholar]
- 20.Churchill G A, Doerge R W. Genetics. 1994;138:963–971. doi: 10.1093/genetics/138.3.963. [DOI] [PMC free article] [PubMed] [Google Scholar]
- 21.Snedecor G W, Cochran W G. Statistical Methods. Ames: Iowa State Univ. Press; 1980. [Google Scholar]
- 22.Rebeiz M, Lewin H A. Anim Biotechnol. 2000;11:75–241. doi: 10.1080/10495390009525951. [DOI] [PubMed] [Google Scholar]
- 23.Genetics Computer Group. wisconsin package (GCG, Madison, WI), Version 10.2. 2001. [Google Scholar]
- 24.Medjugorac I, Kusterman W, Lazar P, Russ I, Pirchner F. Anim Genet. 1994;25:19–27. doi: 10.1111/j.1365-2052.1994.tb00399.x. [DOI] [PubMed] [Google Scholar]
- 25.Loftus R T, Machugh D E, Bradley D G, Sharp P M, Cunningham P. Proc Natl Acad Sci USA. 1994;91:2757–2761. doi: 10.1073/pnas.91.7.2757. [DOI] [PMC free article] [PubMed] [Google Scholar]
- 26.Mathieu M, Modis Y, Zeelen J P, Engel C K, Abagyan R A, Ahlberg A, Rasmussen B, Lamzin V S, Kunau W H, Wierenga R K. J Mol Biol. 1997;273:714–728. doi: 10.1006/jmbi.1997.1331. [DOI] [PubMed] [Google Scholar]
- 27.Mukherjee S, Katiyar S S. J Enzyme Inhib. 2000;15:421–427. doi: 10.1080/14756360009040698. [DOI] [PubMed] [Google Scholar]
- 28.Farnir F, Coppieters W, Arranz J-J, Berzi P, Cambisano N, Grisart B, Karim L, Marcq F, Moreau L, Mni M, et al. Genome Res. 2000;10:220–227. doi: 10.1101/gr.10.2.220. [DOI] [PubMed] [Google Scholar]
- 29.Grisart B, Coppieters W, Farnir F, Karim L, Ford C, Berzi P, Cambisano N, Mni M, Reid S, Simon P, et al. Genome Res. 2002;12:222–231. doi: 10.1101/gr.224202. [DOI] [PubMed] [Google Scholar]