

Abstract
Protein misfolding and aggregation are central features of the polyglutamine neurodegenerative disorders, but the dynamic properties of expanded polyglutamine proteins are poorly understood. Here, we use fluorescence recovery after photobleaching (FRAP) and fluorescence loss in photobleaching (FLIP) with green fluorescent protein fusion proteins to study polyglutamine protein kinetics in living cells. Our results reveal markedly divergent mobility states for an expanded polyglutamine protein, ataxin-3, and establish that nuclear inclusions formed by this protein are aggregates. Additional studies of green fluorescent protein-tagged cAMP response element binding protein coexpressed with either of two mutant polyglutamine proteins, ataxin-3 and huntingtin, support a model of disease in which coaggregation of transcriptional components contributes to pathogenesis. Finally, studies of a third polyglutamine disease protein, ataxin-1, reveal unexpected heterogeneity in the dynamics of inclusions formed by different disease proteins, a finding which may help explain disease-specific elements of pathogenesis in these neurodegenerative disorders.
At least nine inherited neurodegenerative diseases are caused by CAG triplet repeat expansions that encode expanded polyglutamine (polyQ) in the disease proteins (1). A unifying feature of polyQ diseases is the formation of neuronal intracellular inclusions by the disease protein, most commonly in the nuclear inclusions (NIs). Growing evidence suggests that polyQ expansion promotes protein misfolding, resulting in neuronal dysfunction and degeneration by still unknown mechanisms.
Two leading, yet compatible, theories of polyQ pathogenesis are failures in protein homeostasis and perturbations in transcriptional regulation. Evidence implicating problems in protein homeostasis includes the formation of ubiquitin-positive inclusions in disease tissue, the recruitment of molecular chaperones and proteasome components to NI, and the ability of molecular chaperones to suppress toxicity in disease models (2–11). Evidence supporting transcriptional dysregulation includes expanded polyQ-induced changes in gene expression, the inhibition of histone acetyltransferases by polyQ proteins, and the fact that at least two disease proteins are transcription factors (1, 12–13). In addition, the nucleus is recognized to be a critical site for polyQ toxicity (14–16), suggesting that one or more nuclear-specific functions are perturbed in disease.
A compelling link between these two leading theories is the fact that many proteins implicated in transcriptional control become redistributed into NI (17–27). One intriguing example is the transcription coactivator, cAMP response element binding protein (CREB)-binding protein (CBP), which colocalizes to the NI formed by several expanded polyQ proteins (18–20, 25, 27). Moreover, overexpressed CBP suppresses polyQ toxicity in cellular models of polyQ disease. These results suggest a model of pathogenesis (25) in which sequestration of CBP by polyQ proteins inhibits this important transcriptional component.
Many questions that are relevant to pathogenesis and that concern the dynamics of polyQ disease proteins remain unanswered. For example, why do polyQ proteins preferentially form inclusions in the nucleus? Before inclusion formation, do expanded polyQ proteins have altered mobility because of aberrant protein–protein interactions? If so, does this occur preferentially in the nucleus? Are nuclear inclusions true aggregates or are they concentrated stores of abnormal protein in specific nuclear domains? Likewise, are recruited proteins such as CBP coaggregated or simply highly enriched in sites from which they can diffuse? The answer to this last question is important for the CBP sequestration model of pathogenesis.
To address these questions, we have used photobleaching techniques to explore polyQ disease protein kinetics in living cells. Here we use fluorescence recovery after photobleaching (FRAP) and fluorescence loss in photobleaching (FLIP) to define the mobility states of normal and expanded forms of the polyQ disease protein, ataxin-3. Ataxin-3 is the mutant protein in the most common dominant ataxia, spinocerebellar ataxia type-3, also known as Machado-Joseph disease (SCA3/MJD). In further studies employing three polyQ disease proteins and CBP, we provide evidence supporting the sequestration model yet also identify marked differences in the dynamics of NI formed by different polyQ proteins.
Methods
Constructs.
Ataxin-3 expression constructs pcDNA3-hemagglutinin(HA)-Q78, pcDNA3-myc-ataxin-3(Q28), and pcDNA- myc-ataxin-3(Q84) were described (3, 5, 28). Green fluorescent protein (GFP)-ataxin-3 (Q28) and GFP-ataxin-3 (Q84) were constructed by ligating ataxin-3 cDNAs into the BamHI site of pEGFP-C1 (CLONTECH), resulting in full-length ataxin-3 with EGFP fused inframe to its N terminus. Verification of expression of GFP-ataxin-3 was determined through immunofluorescence (IF) and Western blot analysis using ataxin-3 and GFP-specific antibodies (not shown). Expression vectors pcDNA1-Flag-ataxin-1(Q82), pcDNA3.1-myc-Htt-N171-Q82, and pEGFP-CBP were generously provided by H. Zoghbi (Baylor College of Medicine, Houston), C. Ross (Research Institute, The Hospital for Sick Children, Toronto), and D. Bazett-Jones (The Johns Hopkins Univ. School of Medicine, Baltimore), respectively.
Cell Culture and Transfections.
Methods for cell culture, transfection, and IF have been described (3, 5, 27–28). In cotransfections, constructs encoding polyQ proteins or control vector were used at a molar ratio of 1:1 with pEGFP-CBP construct.
Microscopy, Photobleaching, and Live-Cell Imaging.
IF imaging was performed on Zeiss Axioplan and Zeiss LSM 510 confocal laser scanning microscopes equipped with an argon-krypton laser. For co-IF, fluorescein and rhodamine were excited by laser light at a 488- or 543-nm wavelength, respectively. In all cases, exposure time was 221.2 msec, and each fluorophore was scanned independently by using the multitracking function of the LSM 510 unit. For live-cell imaging, cells were plated and observed in Lab-Tek chamber slides (Nalge) on the Zeiss 510 confocal microscope. After transfection (72 or 96 h), coverslips were placed on chamber slides containing medium surrounded by vacuum grease at room temperature. The 488-nm laser light and a 63× plan Apochromat oil objective were used in bleaching. The region of interest (noted by white outlined areas in Figs. 1, 2, and 4–6) was photobleached by using LSM software provided with the Zeiss 510 microscope. We used high iteration and intensity levels (150, 100% respectively) for all experiments to optimize bleaching of inclusions. For imaging, the laser power was attenuated to 10% of the bleach intensity to decrease possible phototoxicity. To ensure that cells remained viable, we monitored cells by differential interference contrast optics for changes in cellular morphology. In FRAP analyses, 12-bit images were collected before, immediately following, and at defined intervals after bleaching. For FLIP analyses, cells were repeatedly imaged and bleached at intervals of 30 s at the same defined region.
Figure 1.
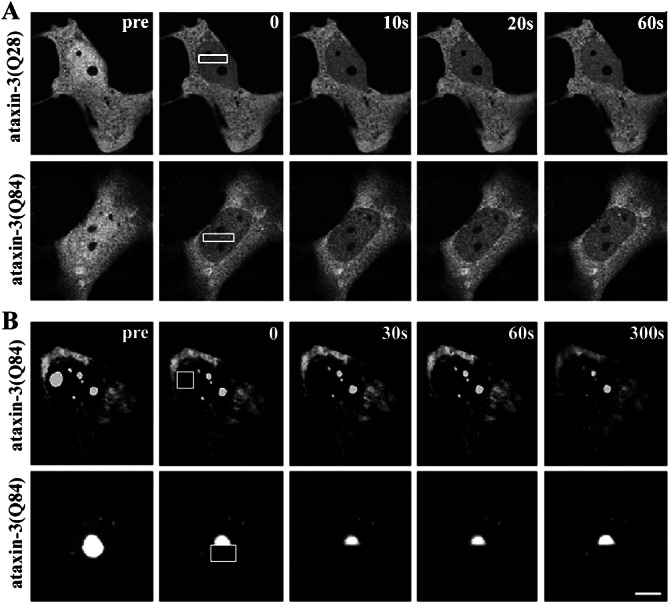
FRAP Analysis of ataxin-3 in the nucleus. COS7 cells expressing GFP-tagged normal or expanded ataxin-3 were imaged immediately before photobleaching a defined zone in the nucleus (boxed area), then afterward at the indicated times. (A) When diffusely distributed in the nucleoplasm, normal (Upper) and expanded (Lower) GFP-ataxin-3 show an immediate decrease in fluorescence throughout the nucleus without a detectable bleached zone. (B) In contrast, mutant ataxin-3 in nuclear inclusions is fully bleached and shows no recovery. This occurs with bleaching of a full (Upper) or half (Lower) of an inclusion. (A and B, bars = 10 μm.)
Figure 2.
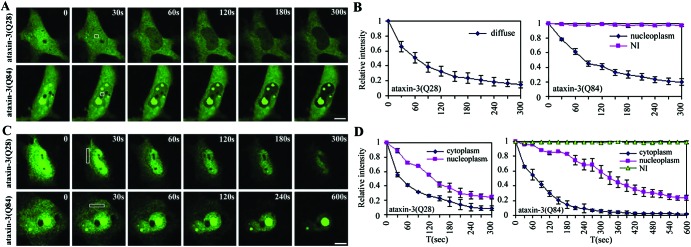
FLIP Analysis of ataxin-3 in the nucleus and cytoplasm. COS7 cells expressing normal or expanded GFP-ataxin-3 were repeatedly bleached at the indicated zone (box) in the nucleus or cytoplasm and imaged between consecutive bleach pulses. (A) Nuclear FLIP. Normal (Upper) and mutant (Lower) ataxin-3 diffusely distributed in the nucleoplasm show rapid and complete bleaching with nuclear FLIP. Ataxin-3 within NI (Lower) shows no loss of fluorescence with nuclear FLIP. (B) Quantification of fluorescence loss for normal and mutant ataxin-3 with nuclear FLIP. (C) Cytoplasmic FLIP. Both normal and mutant ataxin-3 show loss of fluorescence signal over time, first from the cytoplasm, then from the nucleus. Both normal (Upper) and mutant (Lower) nucleoplasmic ataxin-3 show fluorescence loss over time. In contrast, ataxin-3 within NI (Lower) shows no loss of fluorescence (Lower). (D) Quantification of fluorescence loss for normal and mutant ataxin-3 with cytoplasmic FLIP. Curves in B and D depict mean values (± SEM) from three representative cells, including those shown in A and C. (A and C, bar = 10 μm.)
Figure 4.
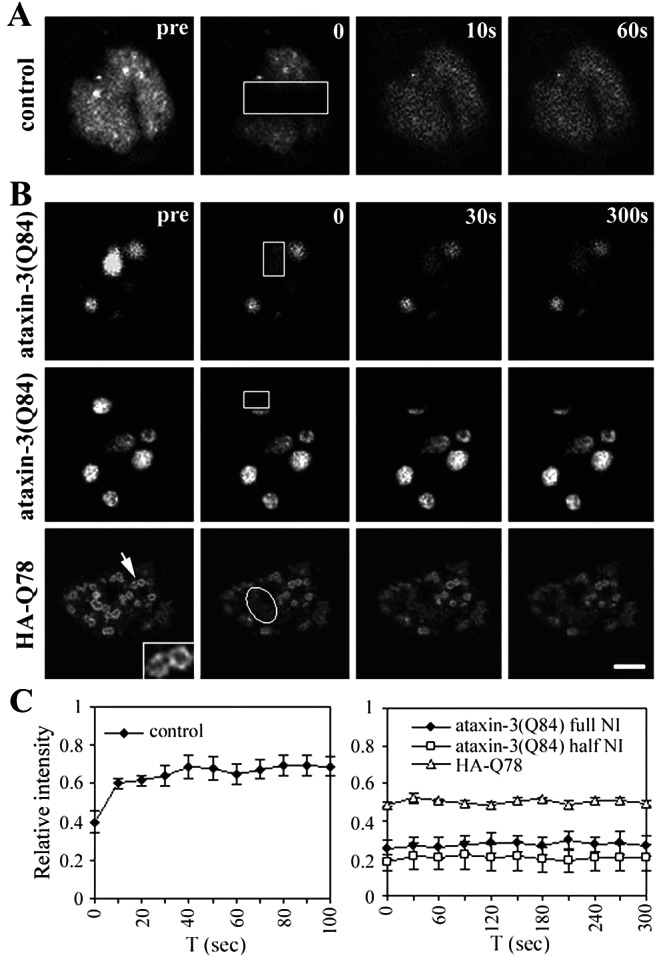
FRAP Analysis of GFP-CBP in ataxin-3 inclusions. HeLa cells expressing GFP-CBP alone (A) or together with ataxin-3 (B) were imaged before and during recovery after bleaching (boxes). Images were taken at the indicated times after the bleach pulse. (A) Rapid fluorescence recovery for GFP-CBP expressed alone. (B) No fluorescence recovery for GFP-CBP within NI formed by full-length ataxin-3 (Top and Middle) or by truncated ataxin-3 (HA-Q78; Bottom) (Bar = 10 μm.). (Inset) Enlarged view of NI formed by HA-Q78 (arrow), illustrating the characteristic fluorescence at the perimeter of these NI. (C) Quantitative analyses of FRAP results showing rapid fluorescence recovery for nucleoplasmic GFP-CBP (Left), but not for GFP-CBP within NI (Right). Curves depict mean values (± SEM) from measurements of three representative cells.
Figure 6.
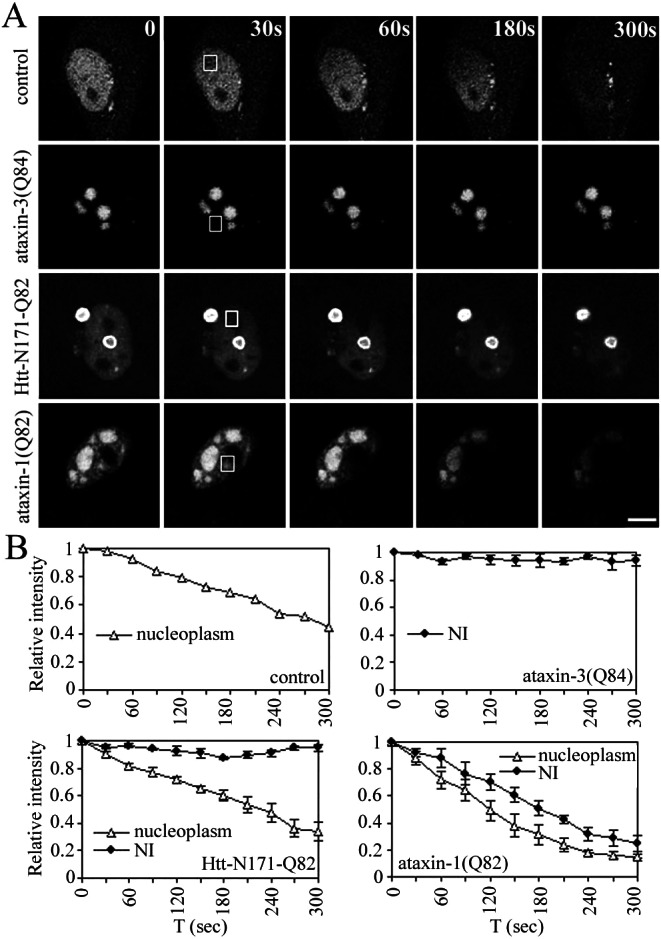
FLIP analysis of GFP-CBP in nucleoplasm vs. inclusions. (A) HeLa cells expressing GFP-CBP alone or together with expanded ataxin-3, huntingtin, or ataxin-1 were repeatedly bleached at the indicated nuclear zone (boxed areas) and imaged between consecutive bleach pulses. When expressed alone (control), GFP-CBP shows loss of fluorescence signal with FLIP, as expected. In cells with ataxin-3 NI, GFP-CBP quantitatively localizes to NI, and FLIP shows no loss of fluorescence from NI. In cells containing NI of huntingtin, GFP-CBP that remains nucleoplasmic (i.e., not recruited to NI) shows fluorescence loss, but GFP-CBP in NI does not. In contrast, GFP-CBP localizing to ataxin-1 NI shows nearly complete fluorescence loss with FLIP. (Bar = 10 μm.) (B) Quantitative analyses of FLIP results. Curves depict mean values (± SEM) from measurements of three representative cells.
Changes in fluorescence intensity in FRAP and FLIP studies were determined by importing serial images to PHOTOSHOP V.6.0 and measuring mean fluorescence intensity for the identical region in consecutive frames (by using the luminosity channel on Histogram function in PHOTOSHOP V.6.0). To assess changes with FLIP, we measured the intensity in a defined area outside of the bleached zone. The relative fluorescence intensity was obtained by dividing the intensity at various time points after bleaching by the intensity before bleaching. For results shown in Figs. 2, 4, 5, and 6, plotted values represent mean values ± SEM from three separately bleached cells in at least two independent experiments. Data were analyzed by using Microsoft EXCEL and SIGMAPLOT, and final figures were generated by using Adobe PHOTOSHOP V.6.0.
Figure 5.
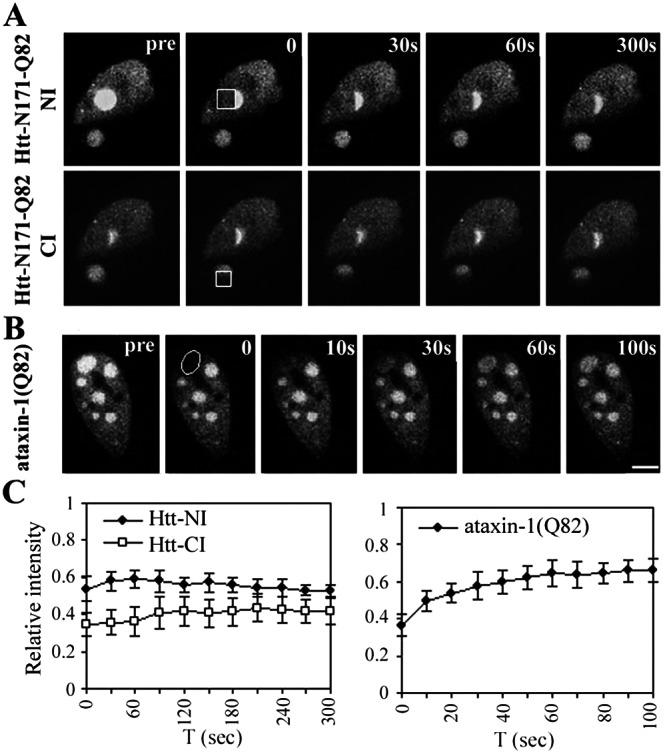
FRAP Analysis of GFP-CBP in huntingtin or ataxin-1 inclusions. HeLa cells expressing GFP-CBP together with truncated huntingtin (A) or full-length ataxin-1 (B) were imaged before and during recovery after bleaching (boxes). Images were taken at the indicated times after the bleach pulse. (A) Huntingtin-expressing cell that contains one NI and one CI, to both of which GFP-CBP colocalized. Sequential FRAP was performed on half of each inclusion, beginning with the NI (Upper) followed by the CI (Lower). Neither inclusion shows fluorescence recovery. (B) In contrast, GFP-CBP localized to an inclusion formed by ataxin-1 shows significant fluorescence recovery. (Bar = 10 μm.) (C) Quantitative analyses of FRAP results. Curves depict mean values (± SEM) from measurements of three representative cells including those shown.
Results
Dynamic Imaging of Normal and Mutant Ataxin-3.
To study the kinetics of expanded polyQ protein, we focused on the SCA3/MJD disease protein, ataxin-3. The smallest polyQ disease protein at ≈42 kDa, ataxin-3 displays a mixed cytoplasmic and nuclear localization (29–32). An advantage of ataxin-3 over the Huntington Disease protein huntingtin for these studies is that NI formation can be readily modeled with full-length ataxin-3 (27, 33). To study dynamic properties of ataxin-3, we created GFP-tagged versions of ataxin-3 containing 28 or 84 glutamine repeats. A repeat of 28 is an average normal repeat in ataxin-3, whereas a repeat of 84 is the largest expansion documented in humans with SCA3/MJD (34). GFP-ataxin-3 behaves similarly to untagged ataxin-3, displaying the same mixed nucleo-cytoplasmic distribution and forming NI of similar size and frequency. NI formed by GFP-ataxin-3 emit a strong and homogeneous fluorescence signal, suggesting a relatively uniform composition.
We first used FRAP to explore kinetic properties of ataxin-3 in living cells. In most cells, GFP-ataxin-3 is diffusely distributed in the nucleus and cytoplasm. When we used FRAP to bleach a region of the nucleus transiently, no discernible bleach zone could be seen afterward. Instead, there was an immediate decrease in fluorescence intensity through the entire nucleus, occurring both with normal and expanded GFP-ataxin-3 (Fig. 1A). As a control, FRAP of formaldehyde-fixed cells resulted in a prominent bleach zone with no recovery (not shown). Thus, normal and expanded ataxin-3 are highly mobile proteins in the nucleus, moving through the bleached region faster than the time of the pulse and subsequent image (<2 sec). As shown later, the same FRAP protocol results in a detectable bleach zone with GFP-CBP (see Fig. 4). Thus, nuclear ataxin-3 is even more mobile than GFP-CBP, which is known to be a highly dynamic nuclear protein (35).
In contrast, ataxin-3 localizing to NI showed markedly different behavior with FRAP: NI formed by GFP-ataxin-3 could be completely bleached and showed no recovery over time (Fig. 1B). This absence of recovery occurred whether we bleached a full NI or half of an NI. This result shows that mutant ataxin-3 in NI is immobile, consistent with insoluble, aggregated protein.
Next, we used FLIP to compare the diffusion of normal and expanded ataxin-3 in the nucleus vs. cytoplasm (Fig. 2). In FLIP, a region of the cell is repeatedly bleached, and loss of fluorescence in the surrounding area is followed over time. When a small nuclear region was subjected to FLIP, the fluorescence signal in the remaining nucleoplasm decreased over time to near background levels. This occurred both for normal ataxin-3 and for any expanded ataxin-3 that remained diffusely distributed in the nucleoplasm (“nucleoplasmic” ataxin-3). Quantitative analysis showed that fluorescence loss obeyed first order kinetics, with normal and expanded ataxin-3 showing nearly identical rapid rates of diffusion (Fig. 2B). Thus, if microaggregates (i.e., not detectable as inclusions by microscopy) exist in the nucleus as has been suggested, they do not significantly alter the mobility of the mutant protein. In contrast, expanded ataxin-3 within NI showed no fluorescence loss with FLIP, confirming that ataxin-3 is immobile when it is in an inclusion. Our FLIP and FRAP analyses demonstrate that mutant ataxin-3 exists in two mobility states in the nucleus, one of which is very similar to the rapidly mobile normal ataxin-3, and the second of which represents nondiffusible protein.
With nuclear FLIP, we noticed that cytoplasmic fluorescence for GFP-ataxin-3 decreased slowly when the nucleus was continually bleached (not shown). This result suggested that ataxin-3 transport across the nuclear membrane is rate-limiting to its diffusion. To assess further ataxin-3 mobility and transport, we performed similar FLIP studies with the beam focused on the cytoplasm (Fig. 2C). With cytoplasmic FLIP, both normal and expanded ataxin-3 showed rapid fluorescence loss throughout the cytoplasm, indicating that ataxin-3 is a highly mobile protein regardless of its subcellular location or the size of its polyQ domain. Loss of fluorescence from the nucleoplasm did occur with cytoplasmic FLIP but was significantly delayed, confirming that ataxin-3 export across the nuclear membrane is rate-limiting. Quantitative analysis also suggested that export of mutant ataxin-3 may be slower and less efficient than export of normal ataxin-3 (Fig. 2D).
In contrast to nucleoplasmic ataxin-3, ataxin-3 in NI showed no loss of fluorescence over time with cytoplasmic FLIP, confirming that ataxin-3 NI are composed of nondiffusible protein.
Divergent CBP Sequestration by PolyQ Proteins.
Mutant ataxin-3 and other polyQ disease proteins induce the redistribution of specific nuclear proteins, including promyelocytic leukemia antigen (PML) and CBP (3, 18–20, 25, 27, 36–37). The CBP sequestration model of polyQ pathogenesis argues that redistribution of CBP into inclusions depletes the cell of this critically important transcription coactivator (25). CBP is normally a highly dynamic protein that moves rapidly in and out of PML nuclear bodies (35). In polyQ diseases, redistributed CBP would be expected to lose its ability to modulate transcription if the protein truly became immobilized. We directly tested this in living cells by using a GFP-CBP fusion protein (35).
First, we coexpressed GFP-CBP with various disease proteins to confirm redistribution into polyQ inclusions (Fig. 3). We studied three structurally unrelated polyQ disease proteins: an N-terminal fragment of huntingtin (N171) that forms cytoplasmic inclusions (CI) and NI; full-length ataxin-3, as well as a carboxyl-terminal fragment of ataxin-3; and full-length SCA1 disease protein, ataxin-1. Mutant ataxin-1 forms NI in cellular and animal models and in human disease tissue.
Figure 3.

GFP-CBP recruitment to different polyQ protein inclusions. Confocal immunofluorescence images of HeLa cells expressing GFP-CBP alone or together with different expanded polyQ proteins. Each set of panels shows GFP-CBP (green), immunofluorescence for the indicated polyQ protein (red), and merged images. GFP-CBP is recruited to inclusions formed by full-length ataxin-3, a truncated fragment of ataxin-3 (HA-Q78), huntingtin fragment (htt-N171), or full-length ataxin-1. Ataxin-1 shows only partial recruitment of CBP in a subset of cells, as shown here. (Bar = 10 μm.)
When expressed alone, GFP-CBP was diffusely distributed in the nucleus with occasional small bright foci (Fig. 3). When coexpressed with polyQ proteins, GFP-CBP localized to inclusions, but the degree of redistribution differed among the disease proteins. Full-length ataxin-3 recruited CBP most effectively, recruiting GFP-CBP quantitatively into intensely and uniformly fluorescent NI (Fig. 3). A stably transfected neuronal cell line expressing mutant ataxin-3 also showed CBP sequestration into inclusions (not shown). A carboxyl-terminal fragment of expanded ataxin-3, HA-Q78, caused CBP redistribution into many small NI with the fluorescence concentrated at the perimeter (Fig. 3; also Fig. 4 Inset). Confirming earlier results (25), an N-terminal huntingtin fragment caused redistribution of CBP into NI or CI or both, depending upon the cell. Ataxin-1 differed most in its recruitment of CBP. Mutant ataxin-1 partially redistributed CBP into a subset of NI without depletion of nucleoplasmic CBP, and in many cells, GFP-CBP seemed to be excluded from NI (not shown). These differences in CBP redistribution illustrate that the surrounding protein context of expanded polyQ influences NI composition.
Differential Immobilization of CBP by PolyQ Proteins.
Having established that GFP-CBP localized to inclusions, we used FRAP and FLIP to define the dynamics of CBP redistribution. In cells expressing GFP-CBP alone (Fig. 4 A and C), FRAP resulted in a transient bleach zone that rapidly recovered, confirming that CBP is a mobile nuclear protein (35). In contrast, GFP-CBP colocalizing to NI formed by full-length or truncated ataxin-3 showed no recovery even after 300 s (Fig. 4 B and C). With full-length ataxin-3, this occurred whether a full NI or a half NI was bleached (Fig. 4B). Thus, CBP sequestered in ataxin-3 NI is completely immobilized, failing even to diffuse locally within NI.
To determine whether CBP immobilization was generally true for polyQ inclusions, we extended the analysis to huntingtin and ataxin-1 inclusions. In cells expressing truncated huntingtin, GFP-CBP colocalized to NI and CI, sometimes in the same cell. This allowed us to perform side-by-side comparative FRAP on both types of inclusions (Fig. 5A). When half an NI, and subsequently half a CI, were bleached in the same cell, there was no fluorescence recovery (Fig. 5C). Thus, mutant huntingtin, like ataxin-3, causes CBP to become sequestered in a fully immobilized state. Results with ataxin-1 inclusions, however, differed markedly (Fig. 5 B and C). Although GFP-CBP did colocalize to a subset of ataxin-1 NI, there was rapid FRAP.
The divergent redistribution of CBP with different polyQ disease proteins prompted us to perform FLIP. In cells expressing GFP-CBP alone, nuclear FLIP led to a gradual decrease in fluorescence throughout the nucleus (Fig. 6A). The results confirm the rapid mobility of nucleoplasmic CBP, although quantitative analysis suggested rather complex kinetics, perhaps reflecting differing mobilities for distinct subpopulations of CBP (Fig. 6B). In contrast, GFP-CBP colocalizing to ataxin-3 NI or to huntingtin NI or CI showed no fluorescence loss with FLIP (Fig. 6 A and B). In huntingtin-expressing cells, the residual nucleoplasmic CBP gradually decreased in fluorescence intensity, indicating that any remaining nucleoplasmic CBP retained its mobility.
These results demonstrate that sequestered CBP in huntingtin or ataxin-3 inclusions is completely immobilized. In contrast, CBP colocalizing to ataxin-1 NI showed a markedly different behavior. With FLIP directed at a nuclear region, all CBP-containing inclusions showed a rapid and nearly complete loss in fluorescence. The rate of fluorescence loss from ataxin-1 NI was similar to that seen for GFP-CBP expressed alone (Fig. 6 A and B). Therefore, CBP in ataxin-1 inclusions retains its mobility, suggesting that in this type of NI, proteins are not aggregated.
Discussion
The live-cell photobleaching studies reported here provide insight into dynamic properties of polyQ disease proteins and into the nature of NI, a hallmark structure of polyQ diseases. Our FRAP and FLIP analyses document the complete immobility of mutant ataxin-3 in NI, offering strong evidence that NI formed by this disease protein are indeed aggregates. They further show that CBP is fully immobilized in inclusions formed by ataxin-3 or huntingtin. Additional studies with ataxin-1, however, clearly demonstrate that NI formed by polyQ proteins differ, underscoring the importance of protein context in polyQ diseases.
The results support the view that CBP sequestration contributes to pathogenesis in some polyQ diseases. Normally a mobile nuclear protein, CBP is immobilized in inclusions formed by two of the three polyQ disease proteins we tested, ataxin-3 and huntingtin, but not the third, ataxin-1. The physical state of immobilized CBP is incompatible with its continued functioning as a transcription coactivator. Many other proteins, including numerous transcription factors or cofactors, also localize to NI in disease tissue and animal or cell models of disease (17–27). Thus, we anticipate that CBP is not the only resident nuclear protein to be immobilized in NI; it is just the first to be examined by the techniques used here. Although we recognize that NI cannot be the primary pathogenic factor in polyQ disease and that transcriptional abnormalities also probably occur independently of inclusion formation, we suggest that the immobilization in NI of specific nuclear factors, including CBP, contributes to the evolving cascade of deleterious events that ultimately lead to neurodegeneration. However, CBP sequestration may contribute to pathogenesis in only a subset of polyQ diseases, as our results with ataxin-1 argue that CBP sequestration does not play a significant role in SCA1. These divergent results also suggest that the list of immobilized proteins may differ in various diseases, contributing to disease-specific features.
Our FRAP and FLIP analyses reveal that mutant ataxin-3 exists in two widely divergent physical states: fully immobilized and rapidly diffusible. Soluble ataxin-3 (normal and expanded) is a highly mobile protein in the nucleus and cytoplasm, with its diffusion rate-limited by transport across the nuclear membrane. The rapid mobility of nuclear ataxin-3 might seem surprising in light of the fact that ataxin-3 binds the nuclear matrix (31–32), but other matrix-binding proteins are known to diffuse rapidly (38–40). Within our detection limits, expanded polyQ does not alter ataxin-3 mobility, except that transport across the nuclear membrane may be slower. This result could contribute to the shift toward more nuclear ataxin-3 in diseased brain (30).
In the nucleus, it seems unlikely that these two physical states of mutant ataxin-3 would exist in a stable equilibrium if one makes a few reasonable assumptions: (i) NI incorporate mutant protein at their surface; (ii) diffusible ataxin-3 comes into contact with NI; and (iii) the protein surveillance machinery is not always sufficient to counteract this process. We would expect that this reaction tends to go toward completion, with eventually most if not all diffusible mutant ataxin-3 being incorporated into NI. Indeed, this result occurs in our transfected cell models, suggesting that a loss of normal ataxin-3 function contributes to disease.
These studies also reveal that NI formed by polyQ proteins are complex and heterogeneous. The immobilized state of ataxin-3 and CBP in NI formed by ataxin-3 argues that these NI are true aggregates. In contrast, the rapid diffusion of CBP from ataxin-1 inclusions suggests that these NI instead represent concentrated stores of abnormal protein in subnuclear structures. Alternatively, these NI may contain aggregated ataxin-1 protein but in a noncompact matrix that permits diffusion of CBP and presumably other proteins. Despite these differences, we suspect that both types of NI originate in the same way: beginning as stored reservoirs of abnormal protein in specific subnuclear domains that, with continued deposition, evolve into aggregates. The probable initiating site is the PML nuclear body (3, 27, 36–37). Inclusion formation in PML bodies may disrupt the highly intricate and dynamic array of subnuclear domains which are now recognized to play pivotal roles in nuclear function, including the control of gene expression.
Acknowledgments
We thank S. Berke and R. Pittman for constructive comments, and R. Truant and H. Orr for communicating results before publication. This study was supported by National Institutes of Health Grant NS38712, Ataxia Machado-Joseph Disease Research Project, Inc., and the Ellison Medical Foundation.
Abbreviations
- polyQ
polyglutamine
- NI
nuclear inclusion
- CBP
CREB-binding protein
- FRAP
fluorescence recovery after photobleaching
- FLIP
fluorescence loss in photobleaching
- GFP
green fluorescent protein
- CI
cytoplasmic inclusion
Footnotes
This paper was submitted directly (Track II) to the PNAS office.
References
- 1.Margolis R L, Ross C A. Trends Mol Med. 2001;7:479–482. doi: 10.1016/s1471-4914(01)02179-7. [DOI] [PubMed] [Google Scholar]
- 2.Cummings C J, Mancini M A, Antalffy B, DeFranco D B, Orr H T, Zoghbi H Y. Nat Genet. 1998;19:148–154. doi: 10.1038/502. [DOI] [PubMed] [Google Scholar]
- 3.Chai Y, Koppenhafer S L, Shoesmith S J, Perez M K, Paulson H L. Hum Mol Genet. 1999;8:673–682. doi: 10.1093/hmg/8.4.673. [DOI] [PubMed] [Google Scholar]
- 4.Stenoien D L, Cummings C J, Adams H P, Mancini M G, Patel K, DeMartino G N, Marcelli M, Weigel N L, Mancini M A. Hum Mol Genet. 1999;8:731–741. doi: 10.1093/hmg/8.5.731. [DOI] [PubMed] [Google Scholar]
- 5.Chai Y, Koppenhafer S L, Bonini N M, Paulson H L. J Neurosci. 1999;19:10338–10347. doi: 10.1523/JNEUROSCI.19-23-10338.1999. [DOI] [PMC free article] [PubMed] [Google Scholar]
- 6.Warrick J M, Chan H Y, Gray-Board G L, Chai Y, Paulson H L, Bonini N M. Nat Genet. 1999;23:425–428. doi: 10.1038/70532. [DOI] [PubMed] [Google Scholar]
- 7.Krobitsch S, Lindquist S. Proc Natl Acad Sci USA. 2000;97:1589–1594. doi: 10.1073/pnas.97.4.1589. [DOI] [PMC free article] [PubMed] [Google Scholar]
- 8.Kazemi-Esfarjani P, Benzer S. Science. 2000;287:1837–1840. doi: 10.1126/science.287.5459.1837. [DOI] [PubMed] [Google Scholar]
- 9.Chan H Y, Warrick J M, Gray-Board G L, Paulson H L, Bonini N M. Hum Mol Genet. 2000;9:2811–2820. doi: 10.1093/hmg/9.19.2811. [DOI] [PubMed] [Google Scholar]
- 10.Bence N F, Sampat R M, Kopito R R. Science. 2001;292:1552–1555. doi: 10.1126/science.292.5521.1552. [DOI] [PubMed] [Google Scholar]
- 11.Cummings C J, Sun Y, Opal P, Antalffy B, Mestril R, Orr H T, Dillmann W H, Zoghbi H Y. Hum Mol Genet. 2001;10:1511–1518. doi: 10.1093/hmg/10.14.1511. [DOI] [PubMed] [Google Scholar]
- 12.Steffan J S, Bodai L, Pallos J, Poelman M, McCampbell A, Apostol B L, Kazantsev A, Schmidt E, Zhu Y Z, Greenwald M, et al. Nature (London) 2001;413:739–743. doi: 10.1038/35099568. [DOI] [PubMed] [Google Scholar]
- 13.McCampbell A, Taye A A, Whitty L, Penney E, Steffan J S, Fischbeck K H. Proc Natl Acad Sci USA. 2001;98:15179–15184. doi: 10.1073/pnas.261400698. [DOI] [PMC free article] [PubMed] [Google Scholar]
- 14.Klement I A, Skinner P J, Kaytor M D, Yi H, Hersch S M, Clark H B, Zoghbi H Y, Orr H T. Cell. 1998;95:41–53. doi: 10.1016/s0092-8674(00)81781-x. [DOI] [PubMed] [Google Scholar]
- 15.Saudou F, Finkbeiner S, Devys D, Greenberg M E. Cell. 1998;95:55–66. doi: 10.1016/s0092-8674(00)81782-1. [DOI] [PubMed] [Google Scholar]
- 16.Peters M F, Nucifora F C, Jr, Kushi J, Seaman H C, Cooper J K, Herring W J, Dawson V L, Dawson T M, Ross C A. Mol Cell Neurosci. 1999;14:121–128. doi: 10.1006/mcne.1999.0773. [DOI] [PubMed] [Google Scholar]
- 17.Perez M K, Paulson H L, Pendse S J, Saionz S J, Bonini N M, Pittman R N. J Cell Biol. 1998;143:1457–1470. doi: 10.1083/jcb.143.6.1457. [DOI] [PMC free article] [PubMed] [Google Scholar]
- 18.Kazantsev A, Preisinger E, Dranovsky A, Goldgaber D, Housman D. Proc Natl Acad Sci USA. 1999;96:11404–11409. doi: 10.1073/pnas.96.20.11404. [DOI] [PMC free article] [PubMed] [Google Scholar]
- 19.Steffan J S, Kazantsev A, Spasic-Boskovic O, Greenwald M, Zhu Y Z, Gohler H, Wanker E E, Bates G P, Housman D E, Thompson L M. Proc Natl Acad Sci USA. 2000;97:6763–6768. doi: 10.1073/pnas.100110097. [DOI] [PMC free article] [PubMed] [Google Scholar]
- 20.McCampbell A, Taylor J P, Taye A A, Robitschek J, Li M, Walcott J, Merry D, Chai Y, Paulson H, Sobue G, et al. Hum Mol Genet. 2000;9:2197–2202. doi: 10.1093/hmg/9.14.2197. [DOI] [PubMed] [Google Scholar]
- 21.Lin X, Antalffy B, Kang D, Orr H T, Zoghbi H Y. Nat Neurosci. 2000;3:157–163. doi: 10.1038/72101. [DOI] [PubMed] [Google Scholar]
- 22.Wood J D, Nucifora F C, Jr, Duan K, Zhang C, Wang J, Kim Y, Schilling G, Sacchi N, Liu J M, Ross C A. J Cell Biol. 2000;150:939–948. doi: 10.1083/jcb.150.5.939. [DOI] [PMC free article] [PubMed] [Google Scholar]
- 23.Luthi-Carter R, Strand A, Peters N L, Solano S M, Hollingsworth Z R, Menon A S, Frey A S, Spektor B S, Penney E B, Schilling G, et al. Hum Mol Genet. 2000;9:1259–1271. doi: 10.1093/hmg/9.9.1259. [DOI] [PubMed] [Google Scholar]
- 24.Shimohata T, Nakajima T, Yamada M, Uchida C, Onodera O, Naruse S, Kimura T, Koide R, Nozaki K, Sano Y, et al. Nat Genet. 2000;26:29–36. doi: 10.1038/79139. [DOI] [PubMed] [Google Scholar]
- 25.Nucifora F C, Jr, Sasaki M, Peters M F, Huang H, Cooper J K, Yamada M, Takahashi H, Tsuji S, Troncoso J, Dawson V L, et al. Science. 2001;291:2423–2428. doi: 10.1126/science.1056784. [DOI] [PubMed] [Google Scholar]
- 26.Holbert S, Denghien I, Kiechle T, Rosenblatt A, Wellington C, Hayden M R, Margolis R L, Ross C A, Dausset J, Ferrante R J, et al. Proc Natl Acad Sci USA. 2001;98:1811–1816. doi: 10.1073/pnas.041566798. [DOI] [PMC free article] [PubMed] [Google Scholar]
- 27.Chai Y, Wu L, Griffin J D, Paulson H L. J Biol Chem. 2001;276:44889–44897. doi: 10.1074/jbc.M106575200. [DOI] [PubMed] [Google Scholar]
- 28.Paulson H L, Perez M K, Trottier Y, Trojanowski J Q, Subramony S H, Das S S, Vig P, Mandel J L, Fischbeck K H, Pittman R N. Neuron. 1997;19:333–344. doi: 10.1016/s0896-6273(00)80943-5. [DOI] [PubMed] [Google Scholar]
- 29.Kawaguchi Y, Okamoto T, Taniwaki M, Aizawa M, Inoue M, Katayama H, Nakamura S, Nishimura M, Akiguchi I, Kimura J, et al. Nat Genet. 1994;8:221–228. doi: 10.1038/ng1194-221. [DOI] [PubMed] [Google Scholar]
- 30.Paulson H L, Das S S, Crino P B, Perez M K, Patel S C, Gotsdiner D, Fischbeck K H, Pittman R N. Ann Neurol. 1997;41:453–462. doi: 10.1002/ana.410410408. [DOI] [PubMed] [Google Scholar]
- 31.Tait D, Riccio M, Sittler A, Scherzinger E, Santi S, Ognibene A, Maraldi N M, Lehrach H, Wanker E E. Hum Mol Genet. 1998;7l:991–997. doi: 10.1093/hmg/7.6.991. [DOI] [PubMed] [Google Scholar]
- 32.Perez M K, Paulson H L, Pittman R N. Hum Mol Genet. 1999;8:2377–2385. doi: 10.1093/hmg/8.13.2377. [DOI] [PubMed] [Google Scholar]
- 33.Evert B O, Wullner U, Schulz J B, Weller M, Groscurth P, Trottier Y, Brice A, Klockgether T. Hum Mol Genet. 1999;8:1169–1176. doi: 10.1093/hmg/8.7.1169. [DOI] [PubMed] [Google Scholar]
- 34.Opal P, Paulson H L. In: Molecular Mechanisms of Neurodegenerative Diseases. Chesselet M-F, editor. Clifton, NJ: Humana; 2000. pp. 285–306. [Google Scholar]
- 35.Boisvert F M, Kruhlak M J, Box A K, Hendzel M J, Bazett-Jones D P. J Cell Biol. 2001;152:1099–1106. doi: 10.1083/jcb.152.5.1099. [DOI] [PMC free article] [PubMed] [Google Scholar]
- 36.Skinner P J, Koshy B T, Cummings C J, Klement I A, Helin K, Servadio A, Zoghbi H Y, Orr H T. Nature (London) 1997;389:971–974. doi: 10.1038/40153. [DOI] [PubMed] [Google Scholar]
- 37.Yasuda S, Inoue K, Hirabayashi M, Higashiyama H, Yamamoto Y, Fuyuhiro H, Komure O, Tanaka F, Sobue G, Tsuchiya K, et al. Genes Cells. 1999;4:743–756. doi: 10.1046/j.1365-2443.1999.00294.x. [DOI] [PubMed] [Google Scholar]
- 38.Phair R D, Misteli T. Nature (London) 2000;404:604–609. doi: 10.1038/35007077. [DOI] [PubMed] [Google Scholar]
- 39.Stenoien D L, Patel K, Mancini M G, Dutertre M, Smith C L, O'Malley B W, Mancini M A. Nat Cell Biol. 2001;3:15–23. doi: 10.1038/35050515. [DOI] [PubMed] [Google Scholar]
- 40.Pederson T. Cell. 2001;104:635–638. doi: 10.1016/s0092-8674(01)00258-6. [DOI] [PubMed] [Google Scholar]