Abstract
The mechanisms responsible for initiating autoimmune diabetes remain obscure. Here, we describe a method for identifying both the α- and β-chains of the T cell receptor (TCR) from individual pancreatic islet-infiltrating T cells at the earliest stages of disease in nonobese diabetic mice (NOD). Analysis of the TCR repertoire of these early islet infiltrates reveals enrichment for a small subset of TCR sequences. Reconstitution of these TCR in vitro demonstrates that these receptors confer reactivity to islet cells but not to the well characterized autoantigens, glutamic acid decarboxylase (GAD65) and insulin. Thus, autoimmune diabetes in NOD may be initiated by a limited number of antigens distinct from GAD65 and insulin.
Autoimmune (type I) diabetes mellitus is a highly morbid disease afflicting nearly one million people in the United States (1). Significant insight into the pathogenesis of type I diabetes has been garnered from the study of spontaneous diabetes in the nonobese diabetic (NOD) mouse (2–4). Diabetes in NOD shares many features with the human disease, most strikingly the strong genetic association with the MHC class II (MHC-II) locus (5, 6). In both NOD and humans, disease susceptibility is linked to mutation of aspartate-57 of the β-chain of a MHC-II molecule, DQ (human) and I-A (mouse; ref. 7). Moreover, autoantibodies to a number of islet cell antigens, including glutamic acid decarboxylase (GAD65) and insulin, are a hallmark of autoimmune diabetes in both species (8).
Type I diabetes is the clinical consequence of the T cell-mediated destruction of the insulin-producing β-cells of the islets of Langerhans (4, 9). Although both CD4+ and CD8+ T lymphocytes seem to be important in this disease process, several lines of evidence suggest a critical role for CD4+ T cells in the initiation of diabetes. Some CD4+ T cells are sufficient to trigger diabetes independently (10, 11). Concordantly, treatment of NOD mice with anti-CD4 antibody abrogates disease (12, 13). Introduction of MHC-II other than I-Ag7, the endogenous NOD MHC-II, also prevents diabetes, possibly by altering the CD4+ T cell repertoire (14–16). Finally, the strong genetic linkage of disease to MHC-II provides a rationale for focusing on CD4+ T cells (5, 17, 18).
Intensive effort has been directed toward identifying the antigens responsible for provoking this pathogenic T cell response. Circulating autoantibodies from diabetic patients have led to the discovery of a number of autoantigens, most notably GAD65 (19) and insulin (20). In NOD mice, a T cell response to GAD65 appears as early as 4 weeks of age; response to islet cells, however, appears even earlier, suggesting the existence of other important early antigens (21, 22). Many attempts to identify these critical early autoantigens have focused upon studying the specificity of islet-infiltrating T cells. Experiments with T cell clones have been limited by biases inherent in the cloning process as well as difficulty in generating clones from NOD mice younger than 4 weeks old (11, 23). On the other hand, PCR-based studies of T cells in prediabetic mice have suggested restricted T cell receptor (TCR) utilization at the onset of insulitis (24–27). Unfortunately, these studies have been limited to analyses of bulk T cell populations and, hence, have been unable to examine the α- and β-chains of the same TCR. As a result, motifs identified by these methods cannot be studied further by reconstitution. In light of these limitations, reconstitution of TCRs in vitro or in transgenic models provides a compelling alternative.
Here, we describe a PCR method for the determination of both α- and β-chains of the TCR in single T lymphocytes. We have used this method to analyze the TCR repertoire of CD4+ T cell infiltrates at the earliest stages of insulitis in NOD mice. Two motifs in the TCR β-chain have been identified in these early islet infiltrates. In vitro reconstitution of representative TCRs with these β-chain motifs demonstrates their islet-cell specificity. Furthermore, these TCRs do not appear to recognize GAD65 or insulin. Our results suggest that autoimmune diabetes in NOD may be initiated by a limited number of autoantigens distinct from GAD65 or insulin.
Materials and Methods
Single-Cell PCR Protocol.
Pancreata were harvested from NOD mice and digested with collagenase P according to the manufacturer's protocol (Roche Molecular Biochemicals) in which the digestion buffer was supplemented with 1 mM PMSF/100 μM leupeptin/1 μM pepstatin A. Ficoll gradient purification of islets and preparation of a single-cell suspension from islets were performed as described (10). Single CD4+ T cells were sorted from this mixture by standard fluorescence activated cell sorter (FACS) methods into 5 μl of sorting buffer (6% Triton X-100/0.3 mg/ml BSA/1.5 mM spermidine/1.5 mM dNTPs (each)/2.08 mM CH3HgOH/16.67 μg/ml oligo dT). cDNA synthesis was preceded by the addition of 4.35 μl of DTT buffer [51.72 mM DTT/0.25 U RNAsin (Promega)]. Reverse transcription (RT)-PCR was performed according to the manufacturer's protocol (SuperScript II, United States Biochemical) in a final volume of 15 μl. Resulting cDNA (2.5 μl) was used for each PCR reaction.
PCR amplification of TCR α- and β-chains from the cDNA of individual T cells was performed as described in Results. Reaction conditions consisted of 1.5 mM MgCl2, 500 mM KCl, 100 mM Tris⋅HCl (pH 9.0), 1% Triton X-100, 0.25 units Taq polymerase. PCR products were subcloned into pGEM-T (Promega) and sequenced. Sequences of the oligonucleotides and the method for their design are given in Tables 1 and 2, which are published as supporting information on the PNAS web site, www.pnas.org. Nomenclature used in Tables 1 and 2 is taken from Arden et al. (28).
Construction of TCR Expression Vectors.
Cassettes encoding TCR α and β variable chain sequences with the appropriate CDR3 were generated by PCR from genomic DNA templates. Restriction sites for subcloning, leader sequences, and unique V(D)J junctional sequences were contributed by primer oligonucleotides. TCR α-chain cassettes were subcloned into a previously described TCR α-shuttle vector, which retains a portion of the genomic TCR α-gene structure (29). TCR β-chain cassettes were combined with the full TCR β constant region sequences to generate a full-length cDNA, which then was subcloned into the mammalian expression vector pBJ1-neo (30). Maps and sequences of these constructs are available upon request.
Reconstitution of TCRs in D10.G4.1.
Linearized TCR α- and β-chain constructs were transfected into the mouse T cell clone D10.G4.1 as described (31). Briefly, D10 cells were harvested 14 to 28 days after stimulation with antigen-presenting cells and conalbumin (Sigma), washed and resuspended in PBS + 10 mM MgCl2 at 3.1 × 10⁶ cells per ml. For each TCR, 750 μl of this cell suspension was mixed with 4 μg of linearized TCR β-chain construct and 20 μg of linearized TCR α-chain construct, incubated on ice for 10 min, pulsed (300 V, 960 μF) in a Bio-Rad GenePulser electroporation cuvette, placed back on ice for 10 min, diluted with 1 ml of serum-free RPMI medium 1640 and incubated at room temperature for 10 min; finally, the suspension was diluted into 10 ml RPMI medium 1640 supplemented with 10% (vol/vol) FCS/1 mM glutamine/β-ME/sodium pyruvate/penicillin/streptomycin. Transfections were plated in 96-well tissue-culture plates at 100 μl per well with 2 × 10⁵ irradiated (3,500 rad) H-2k splenocytes and 200 μg/ml conalbumin (Sigma). After 2 days at 37°C, an additional 100 μl of media was added to produce a total volume of 200 μl with a final concentration of 0.4 mg/ml geneticin (G418 sulfate; GIBCO/BRL) and 50–100 units/ml of mouse IL-2. Transfectants were maintained in geneticin selection medium supplemented with IL-2 and were restimulated with H-2k splenocytes and conalbumin every 2–3 weeks. Constructs for the expression of 5C.C7 (pC7β23 and pβAC7α) were the kind gift of J. Kaye (The Scripps Research Institute, LaJolla, CA) and were transfected as above (32, 33).
T Cell Stimulation Assays.
T cell reactivity was assessed by incubation of 2.5 × 10⁴ T cells (TCR transfectants in D10), 2.5 × 10⁵ irradiated splenocytes (3,500 rad), and antigens as indicated in 96-well tissue-culture plates. After 48 h, an additional 50 μl of fresh media with 1 μCi [3H]thymidine was added to each well. After 18 h of labeling, assays were harvested onto BetaPlate filters (LKB Wallac, Finland); incorporated [3H]thymidine was determined by scintillation. Purified GAD65 protein was the generous gift of C. C. Chao and H. O. McDevitt (Stanford Univ., Stanford, CA). Recombinant insulin was obtained from Sigma. Islet cells used in antigen preparations were purified as described (10).
Results
A Single-Cell PCR Method for Studying the TCR Repertoire of Early Islet Infiltrates.
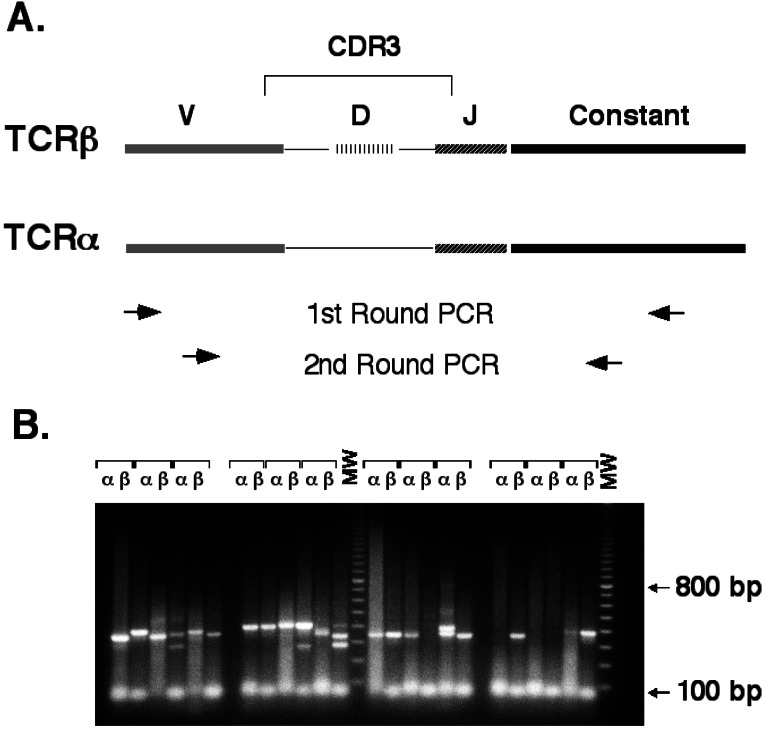
Panels of oligonucleotides specific for all known TCR α- and β-chain variable regions were designed (Tables 1 and 2) and mixed to produce separate external and internal primer sets for α- and β-chain. The complementarity-determining region 3 (CDR3) of the TCR chains was amplified by using two nested rounds of PCR as follows: a first round with the external mixture coupled with a constant region primer, followed by a second round using the internal mixture coupled with a nested constant region primer (Fig. 1A). TCR α- and β-chain amplifications were performed in separate reactions by using cDNA prepared from a single T cell. Under optimized conditions, a specific PCR product was recovered in over 80% of the reactions (Fig. 1B). This technique amplifies the entire panel of TCR α- and β-chain variable regions with nearly equal efficiency (data not shown).
Figure 1.
Single-cell PCR method for TCR amplification. (A) Nested PCR strategy for specific amplification of TCR α- and β-chains from single cells. The thin lines connecting V(D)J segments represent areas of N-region addition. Regions are not drawn to scale. The upper set of arrows indicates the relative position of external oligonucleotides used in the first round of PCR. The lower set of arrows represents the nested position of the internal oligonucleotides used in the second round of PCR. (B) Sample PCR amplification of TCR α- and β-chains from 12 single CD4+ T cells using internal and external oligonucleotide pools. Completed second-round reactions were electrophoresed through a 1.5% agarose gel and stained with ethidium bromide. MW, molecular weight markers (100-bp ladder).
To apply this PCR method to the study of islet-infiltrating T cells, single-cell suspensions were prepared from purified islets and then analyzed by FACS. The addition of protease inhibitors during islet purification permitted the immediate antibody staining of cell-surface markers. Consistent with previous reports (34), islet-infiltrating CD4+ T cells were first detected between 2 and 3 weeks of age (data not shown). FACS was used to isolate individual CD4+ T cells from single-cell suspensions of islets from 14-to 18-day-old female NOD mice, and the TCR α- and β-chain sequences were obtained.
Restriction in TCR β-Chain Sequences in Early Islet Infiltrates.
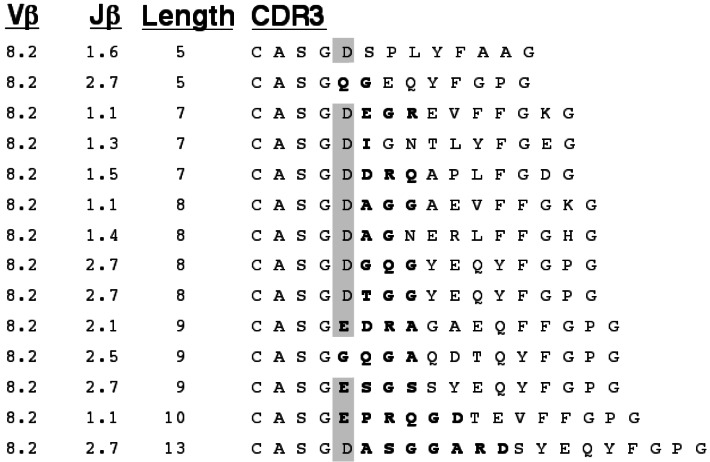
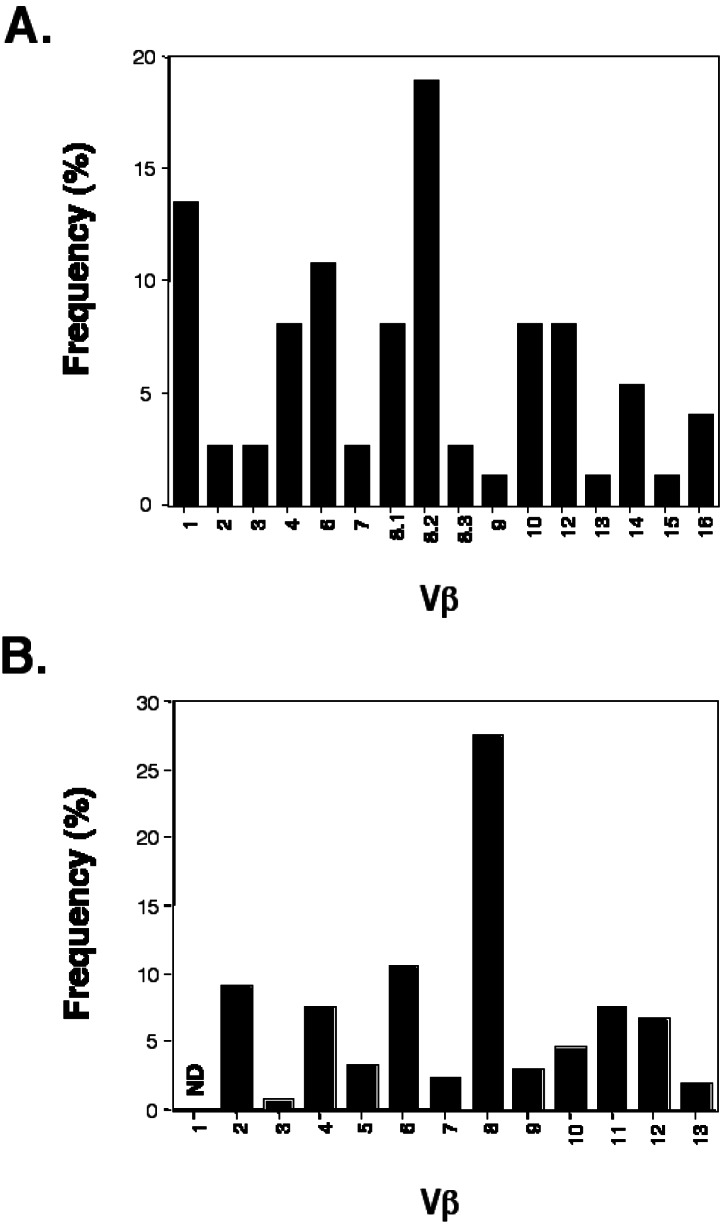
We gathered 140 TCR α- and β-chain sequences from 80 single islet-infiltrating CD4+ T cells isolated as above (Figs. 2, 3, and 4, and data not shown). Analysis of the sequences for variable chain usage revealed that a disproportionate fraction of islet-infiltrating T cells bear Vβ8.2 and Vβ1 (Fig. 5A). A relative abundance of Vβ8.2+ T cells in early islet infiltrates has been described (26). As in this previous study, the majority of our Vβ8.2 sequences have an aspartate or glutamate at position 2 of the CDR3 (ref. 35, Fig. 2). Nevertheless, the large number of Vβ8.2+ T cells found in the islet infiltrates is most likely a reflection of the high frequency of these cells in the peripheral repertoire of NOD (ref. 25, Fig. 5B, and data not shown). Furthermore, the germline sequence of Vβ8.2 encodes the aspartate seen in the majority of our sequences, and thus the prevalence of this residue is not likely due to selected junctional diversity. Finally, no other restriction in the content or length of the Vβ8.2 CDR3 was apparent (Fig. 2). For these reasons, further analysis of Vβ8.2 sequences was not pursued.
Figure 2.
CDR3 sequences for Vβ8.2 TCR from early islet infiltrates in NOD. Amino acid sequence is presented with junctionally encoded sequences indicated in bold face. Vβ, Jβ usage, and CDR3 length are given in the three columns at the left of the figure. The presence of an aspartate or glutamate at position 2 of the CDR3 is highlighted.
Figure 3.
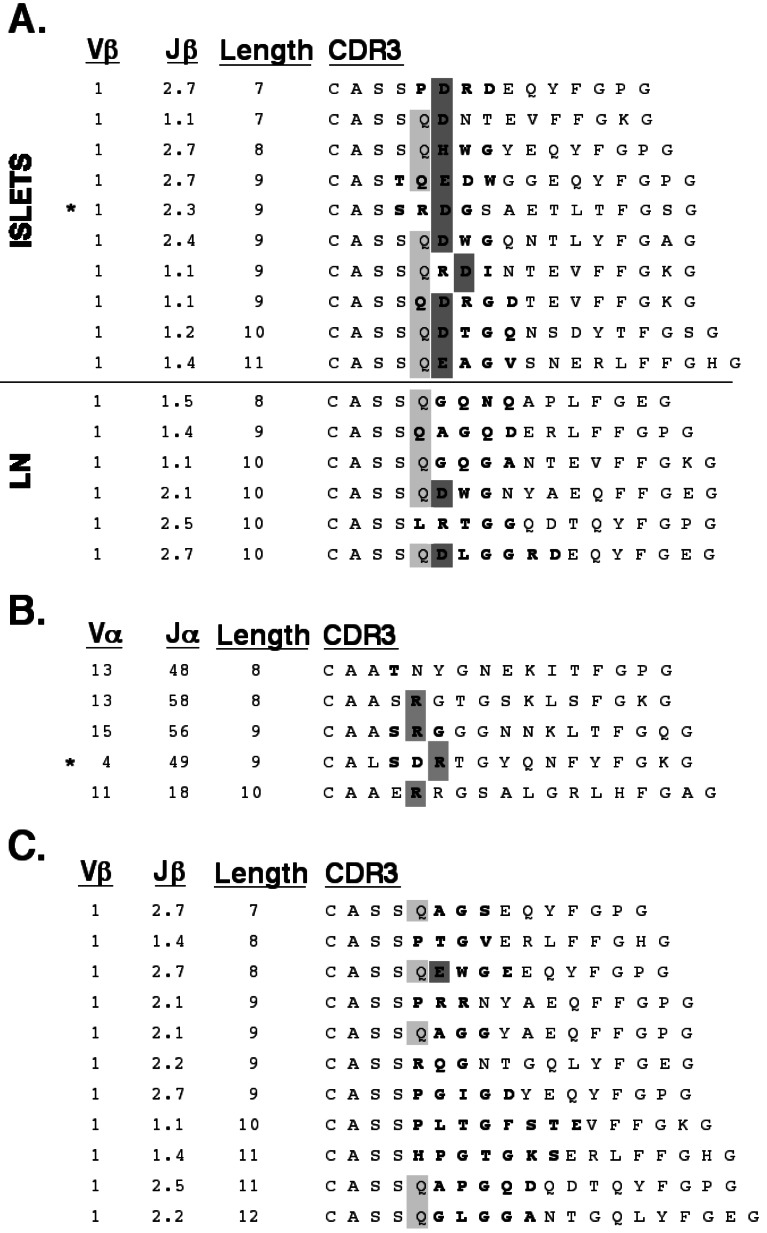
Vβ1 motif in early islet infiltrates in NOD. (A) CDR3 sequences for Vβ1 TCR from early islet infiltrates (Islets). Sequences from T cells in pancreas-draining lymph nodes (LN) from the same animals are included (Lower) for comparison. The presence of glutamine in position 2 of the CDR3 is indicated in light gray. Aspartate or glutamate at position 2 or 3 of the CDR3 is highlighted in dark gray. (B) Paired α-chain CDR3 sequences for 5 Vβ1 sequences. The presence of a junctionally encoded arginine at position 1 or 2 of the CDR3 is highlighted. (C) Vβ1 sequences from the islet infiltrates of 11-week-old NOD. (A–C) Amino acid sequence is presented with junctionally encoded sequences indicated in bold face. Vβ usage, Jβ usage, and CDR3 length are given in the three columns at the left of each panel. (A and B) *, denotes the sequence used for reconstitution experiments in Fig. 6.
Figure 4.
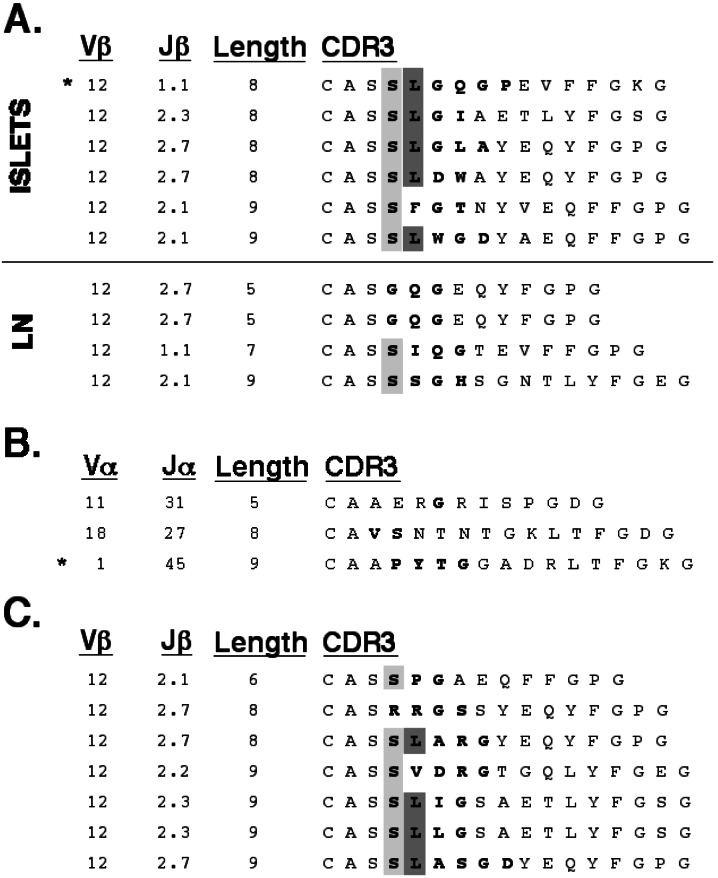
Vβ12 motif in early islet infiltrates in NOD. (A) CDR3 sequences for Vβ12 TCR from early islet infiltrates (Islets). Sequences from T cells in pancreas-draining lymph nodes (LN) from the same animals are included (Lower) for comparison. The presence of serine in position 1 of the CDR3 is indicated in light gray. Leucine at position 2 of the CDR3 is highlighted in dark gray. (B) Paired α-chain CDR3 sequences for 3 Vβ12 sequences. (C) Vβ12 sequences from the islet infiltrates of 11-week-old NOD. (A–C) Amino acid sequence is presented with junctionally encoded sequences indicated in bold face. Vβ usage, Jβ usage, and CDR3 length are given in the three columns at the left of each panel. (A and B) *, denotes the sequence used for reconstitution experiments in Fig. 6.
Figure 5.
TCR β-chain variable region usage in (A) islet-infiltrating CD4+ T cells from 14- to 18-day-old NOD mice and in (B) peripheral CD4+ T cells from the same animals. (A) Full-length sequences (74) which could be clearly classified were obtained by the single-cell PCR protocol described in this report. (B) The relative frequency of β-chain variable regions was established by FACS staining. ND, not determined because antibodies are not currently available.
Screening of individual T cells isolated from lymph nodes suggests that Vβ1+ T cells account for less than 5% of the peripheral CD4+ repertoire (data not shown). By contrast, Vβ1 was expressed by 13% of early islet-infiltrating T cells (Fig. 5A). Alignment of these sequences shows a selection for CDR3 with a junctionally encoded acidic residue at position 3 of the CDR3 (Fig. 3A). Of the remaining two sequences, one has a histidine at this position, the third most acidic side chain, whereas the other sequence has an aspartate in position 4. In this CDR3 motif, the acidic residue is preceded by either a glutamine or arginine. Fifty percent of these CDR3 have a length of nine amino acids. The α-chains paired with these Vβ1 TCRs were compared when available. No restriction in either the variable or joining regions used by these TCR α-chains was apparent (Fig. 3B). A comparison of the CDR3, however, revealed that four of these five α-chains contained an arginine in the junctionally encoded region, at either position 2 or 3 of the CDR3.
The CDR3 regions of all TCR α and β variable chain families for which multiple sequences were available were then aligned and assessed for restricted CDR3 length and junctional amino acid content. Although most of these comparisons yielded no evidence of restriction, five of the six Vβ12 CDR3s were noted to share a motif (Fig. 4A). In particular, they have a junctionally encoded leucine at position 2 which is preceded by a partially junctionally encoded serine. In addition, the CDR3 length within the Vβ12 sequences is highly restricted, with all clones having a length of either eight or nine amino acids. No apparent restriction was noted in the three TCR α-chains found paired with these Vβ12 sequences (Fig. 4B). These Vβ1 and Vβ12 motifs were compared with Vβ1 and Vβ12 sequences found in CD4+ T cells from pancreas-draining lymph nodes from the same animals (Figs. 3A, 4A, Lower). In these peripheral Vβ1 sequences, only two of six have a junctionally encoded acidic residue, and only one had a CDR3 length of nine amino acids. Similarly, the peripheral Vβ12 sequences show that none have a leucine in position 2, and furthermore, only one sequence has a CDR3 length of either eight or nine amino acids.
There is substantial evidence that the TCR repertoire of islet-infiltrating cells is quite diverse in later stages of diabetes (36–44). To determine whether the Vβ1 and Vβ12 motifs enriched in early islet infiltrates were still present later in disease, islet-infiltrating T cells from 11- to 12-week-old female NOD mice were screened for Vβ1 and Vβ12. Analysis of the Vβ1 CDR3 obtained from the islets of older animals revealed an almost complete dilution of the motif, with only 1 of 11 transcripts having the junctionally encoded acidic residue (Fig. 3C). In contrast, Vβ12 transcripts from the islets of older mice still showed clear bias for the junctionally encoded leucine (Fig. 4C). The CDR3 length of the islet-infiltrating Vβ12+ T cells also remained highly restricted, with six of seven transcripts having a length of either eight or nine amino acids.
Reconstitution of TCRs in Vitro Demonstrates Islet-Cell Specificity.
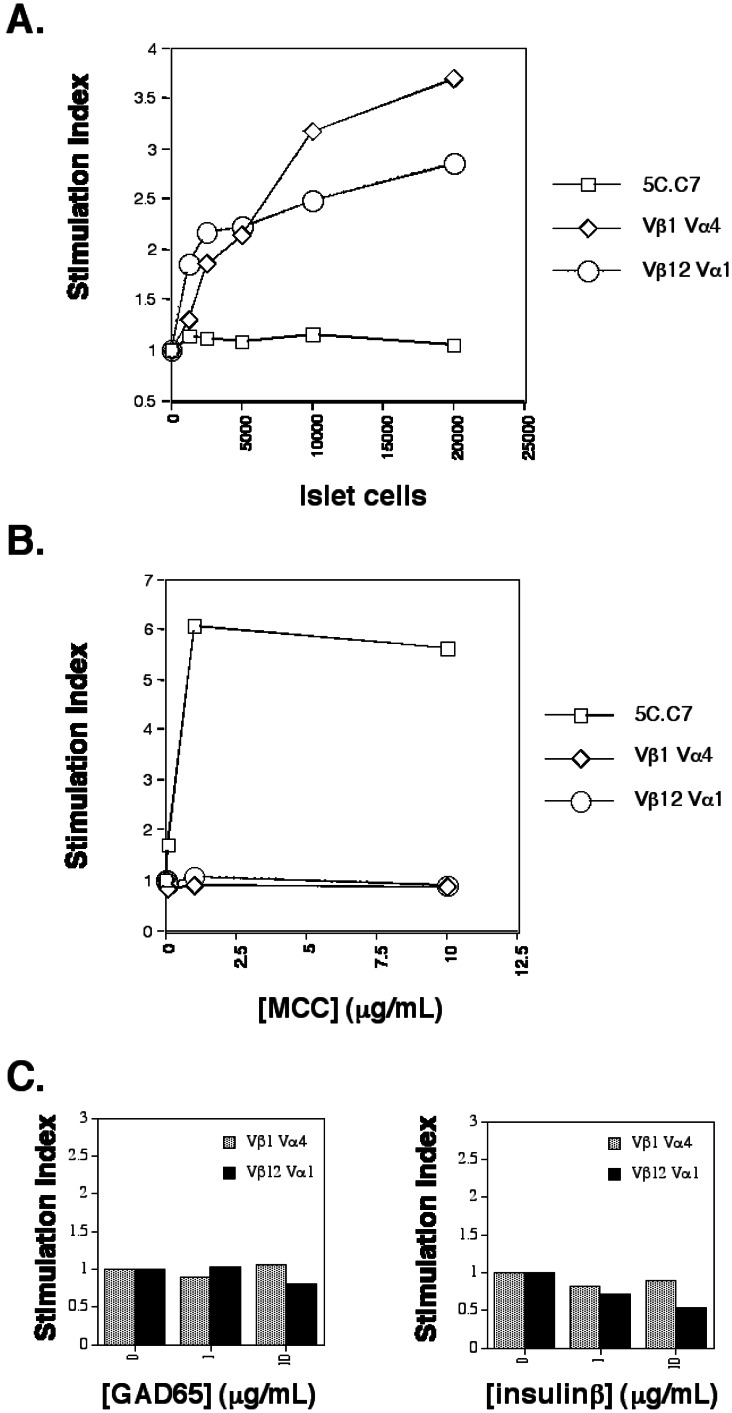
To test the islet-cell specificity of these TCR β-chain motifs, a representative TCR (for which both α- and β-chain sequences was available) was selected from each of the pools of Vβ1 and Vβ12 sequences. A pair of expression plasmids was constructed for each of these TCR (designated Vβ1Vα4 and Vβ12Vα1). Stable transfectants expressing these two TCR were established in the mouse T cell clone D10.G4.1 (D10). D10 has been successfully used in previous studies for the functional expression of mouse TCR with full reconstitution of their reactivity to an appropriate MHC/peptide complex (31, 32). As a control, a stable transfectant of the MCC/I-Ek-reactive TCR 5C.C7 also was generated in D10 (32). In the presence of islet cells and antigen-presenting cells (APC) bearing the NOD-specific MHC-II protein, I-Ag7, D10/Vβ1Vα4, and D10/Vβ12Vα1 were able to proliferate at a markedly higher rate than when incubated with APC alone (Fig. 6A). By contrast, D10/5C.C7 showed no such response to islet cells. To confirm the specificity of this response, the converse experiment was performed, in which the presence of MCC peptide and I-Ek-bearing APC produced an antigen-specific response from D10/5C.C7 but not from D10/Vβ1Vα4 or D10/Vβ12Vα1 (Fig. 6B).
Figure 6.
In vitro reconstitution of Vβ1Vα4 and Vβ12Vα1. (A) Reactivity to islet cells presented by I-Ag7 splenocytes. (B) Reactivity to MCC (88–103) peptide presented by I-Ek splenocytes. (C) Reactivity to GAD65 and insulin β-chain presented by I-Ag7 splenocytes. The GAD65 protein used in C stimulates T cell hybridomas specific for GAD65 in the context of I-Ag7 in parallel experiments (M.L. and M.M.D., unpublished data). The recombinant insulin used in C is a commercially available reagent (Sigma). (A–C) Stimulation index corresponds to T cell proliferation in the presence of APC and the indicated amount of antigen normalized to the degree of proliferation observed in the presence of APC alone. The experiments for A–C were conducted in parallel by using the same APC and T cells. Data shown is the average value for at least two samples, with data values generally varying by less than 20%.
Several islet-cell antigens have been implicated in both NOD disease and in human type I diabetes, of which GAD65 and insulin have been the most intensively studied. D10/Vβ1Vα4 and D10/Vβ12Vα1 were tested for their reactivity to GAD65 and insulin in the presence of IAg7-expressing APC. Neither TCR conferred reactivity to either of these two antigens (Fig. 6C).
Discussion
Restriction of the TCR Repertoire in Early Islet-Cell Infiltrates in NOD.
Although restricted TCR repertoires have been noted in other models of autoimmune disease, including collagen-induced arthritis (45, 46) and experimental autoimmune encephalomyelitis (47, 48), it has been unclear whether this is true in NOD. By using a PCR strategy to characterize the complete TCR sequences expressed by individual islet-infiltrating T lymphocytes, we have identified two motifs which appear to be enriched at the earliest stages of insulitis in NOD. The physiologic relevance of these TCR motifs has been demonstrated by the islet-reactivity conferred by representative TCRs with these motifs in an in vitro reconstitution assay.
Restricted TCR utilization has been suggested previously by a number of PCR-based experiments involving young, prediabetic NOD mice (24–27). Drexler et al. (1993) measured the relative abundance of eighteen TCR β-chain variable regions in islet-infiltrates from 4-week-old NOD mice. As in our study, Vβ1 transcripts were found in the islets of 14 of 17 animals, with no other β-chain detected in more than 5 mice (24). Galley and Danska (25) tested for the relative frequencies of 10 β-chain variable regions in peri-islet infiltrates of 30-day-old NOD mice. In contrast to our results, they found a relative predominance of Vβ3 and Vβ7, only infrequently observed Vβ1, and failed to detect Vβ8 and Vβ12. The discrepancy with our results might be attributable to the older age of the mice used in their study or to differences in the methods of detection. Yang et al. (26) described a predominance of Vβ8.2+ T cells in pooled islets from 14-day-old NOD females. Although we have also observed a predominance of Vβ8.2+ T cells in islet infiltrates, the disproportionately high levels of peripheral Vβ8.2+ T cells makes it difficult to assess the significance of this finding. Furthermore, the similarities between Vβ8.2 sequences from islet-infiltrating T cells were limited to germline-encoded regions. No apparent restriction in CDR3 length or junctionally encoded CDR3 sequences could be identified. Indeed, the prevalence of Vβ8.2+ T cells with the germline-encoded aspartate at position 2 of the CDR3 has been observed in many tissues in NOD mice (49).
TCR restriction in young NOD mice has also been suggested by a number of T cell cloning studies. An analysis of T cell clones specific for an insulin epitope has identified a TCR α-chain motif involving Vα13 (50). Another recent report has described a TCR β-chain motif found in T cell clones specific for hsp60 p277 (51). Interestingly, this motif is associated with Vβ12, is detectable in the islets of 1-month-old NOD mice, and bears some similarities to the motif we describe. A family of T cell clones specific for p524–538 of GAD65 confer protection from diabetes and also preferentially utilizes Vβ12 (52). Further study will be required to assess the significance of these similarities.
Although these previous studies have been limited for the reasons discussed earlier (see beginning of paper), their conclusions are largely compatible with ours. In most cases, early islet infiltrates appear to have oligoclonality superimposed on a background of relatively diverse TCR usage. Additionally, preferential usage and/or motifs involving Vβ1 and Vβ12 in early islet infiltrates appear to have precedence (24, 26). Our study extends these previous findings in examining both chains of the TCR and in demonstrating the islet-cell reactivity conferred by these motifs.
Identity of Early Autoantigens and Role of Early Islet-Infiltrating T Cells.
GAD65 and insulin have been extensively studied as critical autoantigens in the pathogenesis of disease in NOD. Splenic T cell reactivity to GAD65 can be detected in NOD mice as young as 4 weeks of age (21, 53). Immune responses to both GAD65 and insulin can be found in human type I diabetes (54). Furthermore, tolerance induction to GAD65 (55–58) and insulin (57, 59–61) in prediabetic animals can mitigate and, in some cases, prevent diabetes.
Despite compelling evidence to support the importance of these antigens in NOD, the TCR motifs we have identified from the earliest stages of disease do not confer reactivity to either GAD65 or insulin but nevertheless confer islet-cell reactivity. Our results are consistent with the observation that robust T cell responses to crude islet preparations are detectable at early time points where only weak responses are found against the known autoantigens (21, 22). Recently, experiments with NOD mice engineered to express GAD65 ubiquitously have shown that such mice are not protected from diabetes, nor do they develop evidence of widespread autoimmunity distinct from that observed in NOD (62). Likewise, GAD65-deficient mice bred onto the NOD background are not protected from autoimmune disease (63). Although insulin-reactive CD4+ T cells are present in early islet lesions (50), splenic T cell responses to insulin arise late in the course of insulitis in NOD (21). While our results do not rule out a critical role for GAD65 or insulin in the pathogenesis of diabetes in NOD, they suggest the existence of a limited number of unknown antigens that participate in the initiation of disease. Reconstitution of the motifs identified in this report, either in cell culture or in transgenic models, provides a powerful tool for the ultimate identification of these antigens.
A second question raised by our findings relates to the role played by the islet-cell reactive T cells found at this early disease stage. The description of distinct populations of T cells with regulatory and pathogenic functions in NOD has suggested that a change in the balance between these cell populations results in progression from insulitis to diabetes (reviewed in ref. 4). Whether the motifs described in this paper are present on T cells with protective or pathogenic activities will remain unanswered until T cells bearing these motifs are further characterized, either in vitro or in transgenic models.
Generalizable Technique.
The methodology described in this paper enables the amplification of both TCR α- and β-chains from single T cells without prior knowledge of the composition or specificity of the receptor. A similar experimental strategy could be applied to the study of CD8+ T cells in early islet infiltrates in NOD. T cells purified by using the tetrameric MHC-peptide reagent could be analyzed by this technique to yield a complete description of a TCR repertoire that recognizes a single MHC-peptide ligand. In general, a single-cell PCR technique will be particularly useful where tissue samples or the cells of interest may be limiting. Finally, addition of oligonucleotides specific to other molecules of interest, such as cytokines, transcription factors, or adhesion molecules, will allow single-cell expression analysis which should prove to be highly complementary to the population level analyses currently available.
Supplementary Material
Acknowledgments
We thank Michael McHeyzer for his assistance during the initial stages of this work, Jonathan Katz for islet purification protocols and advice, and Cheng-chi Chao and Hugh McDevitt for providing purified antigens. We also thank the members of the Chien and Davis laboratories for helpful discussions and technical advice. Finally, we thank Irene Wu and Heather Bogdanoff for critical reading of the manuscript. F.J.B. is supported by the Medical Scientist Training Program. This study was funded by grants from the Howard Hughes Medical Institute and the National Institutes of Health (to M.M.D.).
Abbreviations
- NOD
nonobese diabetic mouse
- TCR
T cell receptor
- GAD65
glutamic acid decarboxylase
- CDR3
complementarity determining region 3
- APC
antigen presenting cell
References
- 1.Diabetes Control and Complications Trial Research Group. J Am Med Assoc. 1996;276:1409–1415. [PubMed] [Google Scholar]
- 2.McDevitt H O. Hosp Pract. 1995;30:55–62. doi: 10.1080/21548331.1995.11443229. [DOI] [PubMed] [Google Scholar]
- 3.Slattery R M, Miller J F. Curr Top Microbiol Immunol. 1996;206:51–66. doi: 10.1007/978-3-642-85208-4_4. [DOI] [PubMed] [Google Scholar]
- 4.Delovitch T L, Singh B. Immunity. 1997;7:727–738. doi: 10.1016/s1074-7613(00)80392-1. [DOI] [PubMed] [Google Scholar]
- 5.Prochazka M, Leiter E H, Serreze D V, Coleman D L. Science. 1987;237:286–289. doi: 10.1126/science.2885918. [DOI] [PubMed] [Google Scholar]
- 6.Davies J L, Kawaguchi Y, Bennett S T, Copeman J B, Cordell H J, Pritchard L E, Reed P W, Gough S C, Jenkins S C, Palmer S M, et al. Nature (London) 1994;371:130–136. doi: 10.1038/371130a0. [DOI] [PubMed] [Google Scholar]
- 7.Todd J A, Bell J I, McDevitt H O. Nature (London) 1987;329:599–604. doi: 10.1038/329599a0. [DOI] [PubMed] [Google Scholar]
- 8.Atkinson M A, Leiter E H. Nat Med. 1999;5:601–604. doi: 10.1038/9442. [DOI] [PubMed] [Google Scholar]
- 9.Yoshida K, Kikutani H. Rev Immunogenet. 2000;2:140–146. [PubMed] [Google Scholar]
- 10.Katz J D, Wang B, Haskins K, Benoist C, Mathis D. Cell. 1993;74:1089–1100. doi: 10.1016/0092-8674(93)90730-e. [DOI] [PubMed] [Google Scholar]
- 11.Bergman B, Haskins K. Proc Soc Exp Biol Med. 1997;214:41–48. doi: 10.3181/00379727-214-44067. [DOI] [PubMed] [Google Scholar]
- 12.Shizuru J A, Gregory A K, Chao C T, Fathman C G. Science. 1987;237:278–280. doi: 10.1126/science.2955518. [DOI] [PubMed] [Google Scholar]
- 13.Shizuru J A, Taylor-Edwards C, Banks B A, Gregory A K, Fathman C G. Science. 1988;240:659–662. doi: 10.1126/science.2966437. [DOI] [PubMed] [Google Scholar]
- 14.Lund T, O'Reilly L, Hutchings P, Kanagawa O, Simpson E, Gravely R, Chandler P, Dyson J, Picard J K, Edwards A, et al. Nature (London) 1990;345:727–729. doi: 10.1038/345727a0. [DOI] [PubMed] [Google Scholar]
- 15.Schmidt D, Verdaguer J, Averill N, Santamaria P. J Exp Med. 1997;186:1059–1075. doi: 10.1084/jem.186.7.1059. [DOI] [PMC free article] [PubMed] [Google Scholar]
- 16.Ridgway W M, Ito H, Fasso M, Yu C, Fathman C G. J Exp Med. 1998;188:2267–2275. doi: 10.1084/jem.188.12.2267. [DOI] [PMC free article] [PubMed] [Google Scholar]
- 17.Wicker L S, Todd J A, Peterson L B. Annu Rev Immunol. 1995;13:179–200. doi: 10.1146/annurev.iy.13.040195.001143. [DOI] [PubMed] [Google Scholar]
- 18.Wicker L S. J Exp Med. 1997;186:973–975. doi: 10.1084/jem.186.7.973. [DOI] [PMC free article] [PubMed] [Google Scholar]
- 19.Baekkeskov S, Aanstoot H J, Christgau S, Reetz A, Solimena M, Cascalho M, Folli F, Richter-Olesen H, DeCamilli P, Camilli P D. Nature (London) 1990;347:151–156. doi: 10.1038/347151a0. [DOI] [PubMed] [Google Scholar]
- 20.Pontesilli O, Carotenuto P, Gazda L S, Pratt P F, Prowse S J. Clin Exp Immunol. 1987;70:84–93. [PMC free article] [PubMed] [Google Scholar]
- 21.Tisch R, Yang X D, Singer S M, Liblau R S, Fugger L, McDevitt H O. Nature (London) 1993;366:72–75. doi: 10.1038/366072a0. [DOI] [PubMed] [Google Scholar]
- 22.Gelber C, Paborsky L, Singer S, McAteer D, Tisch R, Jolicoeur C, Buelow R, McDevitt H, Fathman C G. Diabetes. 1994;43:33–39. doi: 10.2337/diab.43.1.33. [DOI] [PubMed] [Google Scholar]
- 23.Haskins K, Wegmann D. Diabetes. 1996;45:1299–1305. doi: 10.2337/diab.45.10.1299. [DOI] [PubMed] [Google Scholar]
- 24.Drexler K, Burtles S, Hurtenbach U. Immunol Lett. 1993;37:187–196. doi: 10.1016/0165-2478(93)90030-6. [DOI] [PubMed] [Google Scholar]
- 25.Galley K A, Danska J S. J Immunol. 1995;154:2969–2982. [PubMed] [Google Scholar]
- 26.Yang Y, Charlton B, Shimada A, Dal Canto R, Fathman C G. Immunity. 1996;4:189–194. doi: 10.1016/s1074-7613(00)80683-4. [DOI] [PubMed] [Google Scholar]
- 27.Komagata Y, Masuko K, Tashiro F, Kato T, Ikuta K, Nishioka K, Ito K, Miyazaki J, Yamamoto K. Int Immunol. 1996;8:807–814. doi: 10.1093/intimm/8.6.807. [DOI] [PubMed] [Google Scholar]
- 28.Arden B, Clark S P, Kabelitz D, Mak T W. Immunogenetics. 1995;42:501–530. doi: 10.1007/BF00172177. [DOI] [PubMed] [Google Scholar]
- 29.Ho W Y, Cooke M P, Goodnow C C, Davis M M. J Exp Med. 1994;179:1539–1549. doi: 10.1084/jem.179.5.1539. [DOI] [PMC free article] [PubMed] [Google Scholar]
- 30.Lin A Y, Devaux B, Green A, Sagerstrom C, Elliott J F, Davis M M. Science. 1990;249:677–679. doi: 10.1126/science.1696397. [DOI] [PubMed] [Google Scholar]
- 31.Katayama C D, Eidelman F J, Duncan A, Hooshmand F, Hedrick S M. EMBO J. 1995;14:927–938. doi: 10.1002/j.1460-2075.1995.tb07074.x. [DOI] [PMC free article] [PubMed] [Google Scholar]
- 32.Kaye J, Hedrick S M. Nature (London) 1988;336:580–583. doi: 10.1038/336580a0. [DOI] [PubMed] [Google Scholar]
- 33.Kaye J, Hsu M L, Sauron M E, Jameson S C, Gascoigne N R, Hedrick S M. Nature (London) 1989;341:746–749. doi: 10.1038/341746a0. [DOI] [PubMed] [Google Scholar]
- 34.Wong S, Guerder S, Visintin I, Reich E P, Swenson K E, Flavell R A, Janeway C A., Jr Diabetes. 1995;44:326–329. doi: 10.2337/diab.44.3.326. [DOI] [PubMed] [Google Scholar]
- 35.Rock E P, Sibbald P R, Davis M M, Chien Y H. J Exp Med. 1994;179:323–328. doi: 10.1084/jem.179.1.323. [DOI] [PMC free article] [PubMed] [Google Scholar]
- 36.Miyazaki A, Hanafusa T, Yamada K, Miyagawa J, Fujino-Kurihara H, Nakajima H, Nonaka K, Tarui S. Clin Exp Immunol. 1985;60:622–630. [PMC free article] [PubMed] [Google Scholar]
- 37.Livingstone A, Edwards C T, Shizuru J A, Fathman C G. J Immunol. 1991;146:529–534. [PubMed] [Google Scholar]
- 38.Maeda T, Sumida T, Kurasawa K, Tomioka H, Itoh I, Yoshida S, Koike T. Diabetes. 1991;40:1580–1585. doi: 10.2337/diab.40.12.1580. [DOI] [PubMed] [Google Scholar]
- 39.Nakano N, Kikutani H, Nishimoto H, Kishimoto T. J Exp Med. 1991;173:1091–1097. doi: 10.1084/jem.173.5.1091. [DOI] [PMC free article] [PubMed] [Google Scholar]
- 40.Candeias S, Katz J, Benoist C, Mathis D, Haskins K. Proc Natl Acad Sci USA. 1991;88:6167–6170. doi: 10.1073/pnas.88.14.6167. [DOI] [PMC free article] [PubMed] [Google Scholar]
- 41.Waters S H, O'Neil J J, Melican D T, Appel M C. Diabetes. 1992;41:308–312. doi: 10.2337/diab.41.3.308. [DOI] [PubMed] [Google Scholar]
- 42.Koide Y, Kaidoh T, Nakamura M, Yoshida T O. Tohoku J Exp Med. 1994;173:157–170. doi: 10.1620/tjem.173.157. [DOI] [PubMed] [Google Scholar]
- 43.Sarukhan A, Gombert J M, Olivi M, Bach J F, Carnaud C, Garchon H J. Eur J Immunol. 1994;24:1750–1756. doi: 10.1002/eji.1830240805. [DOI] [PubMed] [Google Scholar]
- 44.Sarukhan A, Bedossa P, Garchon H J, Bach J F, Carnaud C. Int Immunol. 1995;7:139–146. doi: 10.1093/intimm/7.1.139. [DOI] [PubMed] [Google Scholar]
- 45.Li Y, Sun G R, Tumang J R, Crow M K, Friedman S M. J Clin Invest. 1994;94:2525–2531. doi: 10.1172/JCI117624. [DOI] [PMC free article] [PubMed] [Google Scholar]
- 46.Wagner U G, Koetz K, Weyand C M, Goronzy J J. Proc Natl Acad Sci USA. 1998;95:14447–14452. doi: 10.1073/pnas.95.24.14447. [DOI] [PMC free article] [PubMed] [Google Scholar]
- 47.Acha-Orbea H, Mitchell D J, Timmermann L, Wraith D C, Tausch G S, Waldor M K, Zamvil S S, McDevitt H O, Steinman L. Cell. 1988;54:263–273. doi: 10.1016/0092-8674(88)90558-2. [DOI] [PubMed] [Google Scholar]
- 48.Zhang X M, Heber-Katz E. J Immunol. 1992;148:746–752. [PubMed] [Google Scholar]
- 49.Berschick P, Fehsel K, Weltzien H U, Kolb H. J Autoimmun. 1993;6:405–422. doi: 10.1006/jaut.1993.1034. [DOI] [PubMed] [Google Scholar]
- 50.Simone E, Daniel D, Schloot N, Gottlieb P, Babu S, Kawasaki E, Wegmann D, Eisenbarth G S. Proc Natl Acad Sci USA. 1997;94:2518–2521. doi: 10.1073/pnas.94.6.2518. [DOI] [PMC free article] [PubMed] [Google Scholar]
- 51.Tikochinski Y, Elias D, Steeg C, Marcus H, Kantorowitz M, Reshef T, Ablamunits V, Cohen I R, Friedmann A. Int Immunol. 1999;11:951–956. doi: 10.1093/intimm/11.6.951. [DOI] [PubMed] [Google Scholar]
- 52.Quinn A, McInerney B, Reich E P, Kim O, Jensen K P, Sercarz E E. J Immunol. 2001;166:2982–2991. doi: 10.4049/jimmunol.166.5.2982. [DOI] [PubMed] [Google Scholar]
- 53.Kaufman D L, Clare-Salzler M, Tian J, Forsthuber T, Ting G S, Robinson P, Atkinson M A, Sercarz E E, Tobin A J, Lehmann P V. Nature (London) 1993;366:69–72. doi: 10.1038/366069a0. [DOI] [PMC free article] [PubMed] [Google Scholar]
- 54.Nepom G T. Curr Opin Immunol. 1995;7:825–830. doi: 10.1016/0952-7915(95)80055-7. [DOI] [PubMed] [Google Scholar]
- 55.Liblau R, Tisch R, Bercovici N, McDevitt H O. Immunol Today. 1997;18:599–604. doi: 10.1016/s0167-5699(97)01171-7. [DOI] [PubMed] [Google Scholar]
- 56.Liddi R. Diabetes Metab Rev. 1998;14:256–257. doi: 10.1002/(sici)1099-0895(1998090)14:3<256::aid-dmr219>3.0.co;2-2. [DOI] [PubMed] [Google Scholar]
- 57.Maron R, Melican N S, Weiner H L. J Autoimmun. 1999;12:251–258. doi: 10.1006/jaut.1999.0278. [DOI] [PubMed] [Google Scholar]
- 58.Weaver D J, Jr, Liu B, Tisch R. J Immunol. 2001;167:586–592. doi: 10.4049/jimmunol.167.1.586. [DOI] [PubMed] [Google Scholar]
- 59.Arakawa T, Yu J, Chong D K, Hough J, Engen P C, Langridge W H. Nat Biotechnol. 1998;16:934–938. doi: 10.1038/nbt1098-934. [DOI] [PubMed] [Google Scholar]
- 60.Karounos D G, Bryson J S, Cohen D A. J Clin Invest. 1997;100:1344–1348. doi: 10.1172/JCI119654. [DOI] [PMC free article] [PubMed] [Google Scholar]
- 61.Homann D, Dyrberg T, Petersen J, Oldstone M B, von Herrath M G. J Immunol. 1999;163:1833–1838. [PubMed] [Google Scholar]
- 62.Geng L, Solimena M, Flavell R A, Sherwin R S, Hayday A C. Proc Natl Acad Sci USA. 1998;95:10055–10060. doi: 10.1073/pnas.95.17.10055. [DOI] [PMC free article] [PubMed] [Google Scholar]
- 63.Kash S F, Condie B G, Baekkeskov S. Horm Metab Res. 1999;31:340–344. doi: 10.1055/s-2007-978750. [DOI] [PubMed] [Google Scholar]
Associated Data
This section collects any data citations, data availability statements, or supplementary materials included in this article.


