

Abstract
Background and Objectives
Efgartigimod (EFG), a biological drug targeting the IgG recycling neonatal Fc receptor (FcRn), leads to clinical improvements in patients affected by myasthenia gravis (MG), a prototypic autoantibody (Ab)–mediated autoimmune disease affecting neuromuscular junction. Because FcRn is a multifunctional protein expressed in different immune system cells, including B cells, we investigated whether FcRn blockade by EFG may have further immunologic effects, other than IgG reduction, in patients with MG.
Methods
Anti-acetylcholine receptor Ab–positive (AChR-MG) patients were treated with EFG according to the GENERATIVE protocol. Clinical evaluation, IgG and autoAb quantification, and circulating T-cell and B-cell subpopulation analyses by flow cytometry were performed at different time points. The expression of regulatory plasma cell–related candidate genes (CD38, lymphocyte-activation gene 3 [LAG3], IL-12a, Ebi3) was assessed by real-time PCR in peripheral blood mononuclear cells (PBMCs) from patients on treatment and in PBMCs either untreated or in vitro treated with an EFG-mimicking anti-FcRn monoclonal Ab (mAb) or with EFG (Vyvgart).
Results
A significantly increased percentage of CD19+/CD27+ memory B cells and CD27+/CD138+ plasma cells was observed at the end of EFG treatment cycle 1 and cycle 2 in patients with AChR-MG. Plasma cell increase, maintained up to cycle 3, significantly correlated with Quantitative Myasthenia Gravis score improvement. Moreover, PBMCs from EFG-treated patients showed overexpression of CD38, LAG3, and IL-12a genes, suggesting EFG's ability to induce non-pathogenic regulatory plasma cells. This ability was confirmed in vitro, because anti-FcRn mAb–treated and EFG-treated PBMCs displayed an up-regulation of CD38 and LAG3 compared with untreated cells.
Discussion
Our findings indicate an unknown immunoregulatory action of EFG in patients with AChR-MG, by unraveling a drug effect on B-cell differentiation, and suggest the induction of regulatory plasma cells as a further mechanism, beyond IgG reduction, associated with clinical improvement. A deep understanding of the immunologic effects of EFG can help to optimize its usage over time in individual patients and disclose biomarkers suitable for monitoring the long-term patient-specific response.
Introduction
Myasthenia gravis (MG) is a T cell–dependent, B cell–mediated autoimmune disease characterized by weakness and fatigability of skeletal muscles caused by autoantibodies (autoAbs) to neuromuscular junction proteins, most frequently the acetylcholine receptor (AChR) and rarely the muscle-specific kinase receptor (MuSK) or the low-density lipoprotein receptor–related protein 4.1,2 Patients negative for these autoAbs are defined as triple-seronegative.2
Pharmacologic treatment of MG is based on cholinesterase inhibitors and chronic general immunosuppression with corticosteroids and/or other immunosuppressive (IS) drugs, which provide symptom control but rarely lead to complete stable remission and cause considerable side effects.3 Moreover, a proportion (∼10%–15%) of patients is refractory to IS drugs,4,5 highlighting the need for more specific, effective, and well-tolerated therapies.
New biological drugs are promising therapeutic tools expected to modify the disease course and limit the use of corticosteroids as much as possible, because they target specific pathogenic molecules.1,6
The neonatal fragment crystallizable (Fc) receptor (FcRn), a major histocompatibility complex class I-like (MHC-I) receptor, is an essential component of the endolysosomal system promoting transplacental transfer of maternal Abs to the fetus.7,8 The FcRn binds IgGs in endothelial cells to prevent their lysosomal degradation and ensure their recycling and release in the circulation.7,8 Owing to the FcRn's ability to enhance half-life of IgGs, including autoAbs, several FcRn blockers have been developed for treating Ab-mediated autoimmune diseases.9
The first FcRn inhibitor to be investigated was efgartigimod (ARGX-113, [EFG]),10,11 approved for MG treatment in the United States in 2021, in Japan and Europe in 2022, and in China in 2023, after demonstration of its safety and efficacy in adults with generalized MG (gMG).12-16 EFG is an engineered humanized monoclonal IgG1 Fc fragment mutated at 5 residues to increase its affinity for the FcRn at both physiologic and acidic pH.17 The drug targets the FcRn, thereby competing with endogenous IgGs that are excluded from recycling and degraded by lysosomes; this in turn leads to decreased IgG levels, without altering other Igs (IgA, IgD, IgE, and IgM), the levels of which are not dependent on FcRn-mediated recycling.10
The biological impact of EFG and other FcRn inhibitors on immune processes beyond IgG recycling, and upstream of autoAb production, has not been investigated yet, although additional FcRn functions have been identified. Indeed, along with endothelial cells, FcRn is expressed in antigen-presenting cells, particularly dendritic cells, macrophages, and B cells,18-21 where its cross-linking by IgG-containing immune complexes initiates a cascade of events culminating in presentation/cross-presentation of antigenic peptides by MHC-II and I to CD4+ and CD8+ T cells that do not express FcRn.20 In addition, FcRn favors the production of inflammatory cytokines with evident implications in the regulation of the immune response in both health and disease.7,8,20,21
In this study, we explored whether FcRn inhibition by EFG may exert immunologic effects other than IgG reduction in patients with MG. The identification of other immunologic mechanisms not linked to IgG recycling could lead to the identification of biomarkers of efficacy suitable for further treatment personalization.
Methods
Patients and Biological Samples
This study included 9 anti-AChR Ab-positive (AChR-MG) patients with gMG (Table), followed up at the Fondazione IRCCS Istituto Neurologico Carlo Besta (FINCB) of Milan. EFG was administered according to the Expanded Early Access Program (EAP) to EFG (GENERATIVE [GENERalized myAsThenia graVis Efgartgimod]) (Version 1.0, 10 September 2021), as previously reported.22 EFG was administered at the dose of 10 mg/kg as a 1-hour intavenous (IV) infusion in cycles of 4 weekly infusions. The initial fixed period included 2 cycles, each followed by a 4-week fixed inter-treatment period. Afterward, according to the EAP protocol, patients were eligible to enter the flexible cyclical period during which EFG was given again as 4 weekly infusions at the discretion of the treating physician in case of worsening of Quantitative Myasthenia Gravis (QMG) and Myasthenia Gravis Activities of Daily Living (MG-ADL) scores.23,24
Table.
Main Clinical Features of Patients With Generalized MG Included in the Study
| AChR-MG (n = 9) | |
| Sex (F:M) | 6:3 |
| Age at onset, y (y, mean ± SD) | 39.33 ± 18.40 |
| Age at blood collection (y, mean ± SD) | 57.11 ± 12.09 |
| Ongoing therapies | |
| Anti-AChE, n | 8 |
| Prednisone, n | 4 |
| IS druga, n | 2 |
| Prednisone + IS drugb, n | 3 |
| Thymectomy, n | 6 |
| Thymomac, n | 3 |
| QMG score (mean ± SD) at | |
| T1 | 12.7 ± 3.5 |
| T2 | 9.0 ± 4.0 |
| T4 | 7.0 ± 3.9 |
| T6 | 7.2 ± 4.5 |
| MG-ADL score (mean ± SD) at | |
| T1 | 8.4 ± 3.3 |
| T2 | 3.2 ± 2.2 |
| T4 | 1.7 ± 2.1 |
| T6 | 2.7 ± 2.4 |
| Time from cycle 2 to cycle 3 (mo, mean ± SD)d | 3.1 ± 2.7 |
Abbreviations: AChE = acetylcholinesterase inhibitors; AChR = acetylcholine receptor; EFG = efgartigimod; IS = immunosuppressive; MG-ADL = Myasthenia Gravis Activities of Daily Living; QMG = Quantitative Myasthenia Gravis; SN = triple seronegative; T1 = baseline, i.e., before first infusion of EFG; T2 = last infusion of EFG cycle 1; T4 = last infusion of EFG cycle 2; T6 = last infusion of EFG cycle 3.
IS drugs included azathioprine and mycophenolate.
IS drugs included azathioprine and methotrexate.
Information on thymic histology was not available for 1 patient.
Time interval from the end of EFG cycle 2 to the beginning of cycle 3, variable according to worsening of MG.
Blood samples for serum and peripheral blood mononuclear cell (PBMC) isolation were collected at the 1st and 4th infusion of cycles 1 (T1, baseline; T2) and 2 (T3; T4), at the follow-up visit, 30 days after cycle 2, and at the 1st and 4th infusion of cycle 3 (T5; T6) (Figure 1). QMG and MG-ADL evaluation was performed at the same time points.
Figure 1. EFG Treatment Scheme and Time Line of Sample Collection.

The protocol of the Expanded Early Access Program (EAP, GENERATIVE) (Version 1.0, September 10, 2021) to EFG consisted of 2 cycles (fixed period) of 4 IV infusions (i.e., one infusion per week), followed by a 30-day follow-up at the end of each cycle. Cycle 3 (i.e., flexible period initiation) started at a variable time interval from cycle 2 end (3.1 ± 2.7 months), depending on disease worsening. Blood samples for serum and peripheral blood mononuclear cell isolation were collected from patients with MG at the following time points: baseline or T1, i.e., before the 1st infusion of cycle 1; T2, i.e., before the 4th infusion of cycle 1; T3, i.e., before the 1st infusion of cycle 2; T4, i.e., before the 4th infusion of cycle 2; follow-up, i.e., at the follow-up visit after cycle 2 and performed at 30 days after the end of the cycle; T5, i.e., before the 1st infusion of cycle 3; and T6, i.e., before the 4th infusion of cycle 3. EFG = efgartigimod; GENERATIVE = GENERalized myAsThenia graVis Efgartgimod; MG = myasthenia gravis.
Ramos-Blue cells (NF-κB/AP-1 reporter B lymphocytes, Invivogen) were used as positive control of FcRn immunofluorescence staining in B cells. They were cultured in Iscove's Modified Dulbecco's Medium, supplemented with 2 mM l-glutamine, 10% v/v heat-inactivated fetal bovine serum (FBS), 100 µg/mL of normocin, and 100 U/mL of penicillin/streptomycin.
Standard Protocol Approvals, Registrations, and Patient Consents
All patients signed the informed consent before enrollment in the GENERATIVE program, after the EAP approval by FINCB Ethical Committee, subsequently authorized by the Italian Medicines Agency. The study was approved by the Comitato Etico Territoriale (CET) Lombardia 4 (approval n. CET 21/24, Biomedical Science and Technology [BST] 32/24). All patients signed an informed consent form for using their biological samples for research.
Total IgG, IgG Subclass, and Autoantibody Quantification
Total IgGs were measured in serum using the Abbot Architect instrument. Serum samples (dilution 1:2,500) were also subjected to quantification of IgG1, IgG2, IgG3, and IgG4 using the Human IgG Subclass ELISA Kit (Invitrogen), following the manufacturer's instruction. Each sample was tested in duplicate, and optical density at 450 nm was determined with a microplate reader (Multiskan FC Microplate Photometer).
Anti-AChR Abs were assessed in serum by radioimmunoprecipitation.25
PBMC Isolation
PBMCs were isolated from fresh whole blood using the Ficoll-Paque PLUS (Cytiva) gradient centrifugation protocol; cell number was estimated by the Trypan blue (Sigma-Aldrich) dye exclusion method. PBMCs were analyzed by flow cytometry immediately after isolation; the remaining cells were frozen in FBS plus 10% dimethyl sulfoxide (Euroclone) and stored in liquid nitrogen for subsequent molecular analyses.
Isolation of CD138+ Plasma Cells
CD138+ plasma cells were positively selected and isolated from PBMCs using human CD138 MicroBeads (Miltenyi Biotec). In brief, at least 5 × 10⁶ PBMCs were incubated with the CD138 MicroBeads, according to the manufacturer's instructions, and then passed through a Magnetic Activated Cell Sorting (MACS) column in the magnetic field of a MACS separator. The purified CD138+ plasma cells were then eluted from the column and used for downstream applications.
Functional In Vitro Studies
Control and MG PBMCs were plated in a 96-well microplate (1 × 10⁶ cells/well) in Roswell Park Memorial Institute (RPMI) 1640 supplemented with 10% FBS, 1% non-essential amino acids, 1% sodium pyruvate, 1% l-glutamine, 1% penicillin-streptomycin, 0.1% 2-mercaptoethanol, and 1 µg/mL of concanavalin and kept at 37°C in a 5% CO2 atmosphere for 24 hours. PBMCs were then cultured in their medium under basal conditions or treated for additional 24 hours with (1) a mouse anti-FcRn sc-271745 monoclonal Ab (mAb) (1 µg/mL; Santa Cruz Biotechnology), or mouse IgG2a (1 µg/mL; Dako) as isotype negative control, and (2) EFG (Vyvgart, EFG alfa; dose I: 1 µg/mL; dose II: 2 µg/mL) or human IgG1 (1 µg/mL and 2 µg/mL; Invitrogen), with the latter used as a negative control because EFG is an IgG1 Fc fragment. After treatment, they were harvested and centrifuged for flow cytometry and gene expression analyses.
Flow Cytometry
After extraction from fresh blood, PBMCs (1.5 × 10⁶ cells) were stained with 1 µL/mL of Fixable Viability Dye eFluor 780 (Thermo Fisher Scientific) diluted in staining buffer, containing 1% phosphate-buffered saline, 2% bovine serum albumin (BSA), and 5 mM EDTA, for 30 minutes on ice in the dark. After centrifugation at 1,400 rpm for 7 minutes at 4°C and supernatant elimination, PBMCs were incubated on ice for 30 minutes with combinations of the following primary Abs (dilution 1:20): (1) mouse anti-CD19-Super Bright 702 (Invitrogen); (2) mouse anti-CD138/syndecan-1-PE (Invitrogen); (3) mouse anti-CD27-APC (Miltenyi); (4) mouse anti-CD45-Alexa Fluor 700 (Invitrogen); (5) mouse anti-CD3-FITC (BD Biosciences); (6) mouse anti-CD4-APC-eFluor 780 (Invitrogen), and (7) mouse anti-CD8a-PerCP-eFluor 710 (Invitrogen). Then, cells were washed and pelleted to proceed with flow cytometry analysis.
Using this protocol, untreated, EFG-treated, human IgG1–treated, anti-FcRn mAb–treated, and mouse IgG2a–treated PBMCs were stained with mouse anti-CD19-Super Bright 702.
All flow cytometry analyses were performed using the Attune N×T Flow Cytometer (Thermo Fisher Scientific). UltraComp eBeads Compensation Beads (Invitrogen) were used for compensation.
Real-Time PCR
Total RNA was extracted from PBMCs using the TRIzol method and from CD138+ plasma cells using the MirVana Total RNA Isolation Kit (Thermo Fisher Scientific), and its quality and concentration were evaluated using a NanoDrop 2000c spectrophotometer (Thermo Fisher Scientific). After retrotranscription with the SuperScript VILO cDNA Synthesis Kit, cDNAs were subjected to real-time PCR on the ViiA 7 Real-Time PCR System with predesigned functionally tested TaqMan gene expression assays specific for CD38, lymphocyte-activation gene 3 [LAG3], IL-12a, and Ebi3 transcripts (all reagents from Thermo Fisher Scientific). Data were expressed as relative gene expression values normalized with the endogenous 18S using the formula 2−ΔCt × 100.
Double Immunofluorescence
Ramos-Blue cells and MG PBMCs were fixed in 4% paraformaldehyde for 15 minutes, permeabilized with 0.1% Triton X-100, and treated with 5% BSA for 1 hour. Next, they were immunostained overnight at 4°C with primary Abs against FcRn (mouse anti-FcRn sc-271745; 1:100, Santa Cruz Biotechnology) and CD20 (rabbit anti-CD20; 1:400, Invitrogen). Coverslips were then incubated for 1 hour with a mixture of Alexa Fluor 488–conjugated goat anti-mouse and Alexa Fluor 546–conjugated goat anti-rabbit IgG secondary Abs (Thermo Fisher Scientific). Nuclei were stained with 4′,6-diamidino-2-phenylindole (dilution: 1:1,000; Thermo Fisher Scientific). As negative control, primary Abs were omitted. Images were acquired and analyzed using a laser scanning confocal microscope (60X; Leica, Tandem Confocal Scanner [TCS] SP8).
Statistical Analysis
Parametric or non-parametric distributed data, tested by the Shapiro-Wilk test, were analyzed with the paired T or Wilcoxon matched-pairs signed-rank test for comparison of 2 groups and with the Friedman or Kruskal-Wallis test with Dunn's multiple comparison tests for comparison among groups. Pearson or Spearman correlation coefficients were evaluated in correlation analyses. p Values < 0.05 were considered statistically significant. GraphPad Prism v8.0 software was used for data elaboration and statistical analyses.
Data Availability
Anonymized data not published within this article will be made available on reasonable request from any qualified investigator.
Results
EFG Induces Clinical Improvement
Patients with AChR-MG (Table) were treated with EFG according to the EAP protocol.22 Ongoing treatments included different combinations of anticholinesterase, corticosteroids, and IS drugs (Table) and remained unchanged during the study period (EFG cycles 1 to 3).
Improvement of QMG and MG-ADL scores was observed as early as cycle 1 and reconfirmed by cycles 2 and 3, with significant differences at T4 and T6 compared with the baseline (T1) for both scores (Figure 2). One patient was classified as non-responder (QMG scores: 9, 10, 9, and 8 at T1, T2, T4, and T6, respectively; MG-ADL scores: 2, 3, 4, and 3 at T1, T2, T4, and T6, respectively). In parallel, EFG reduced total IgGs as follows: 50.04% ± 33.86% and 42.77% ± 48.65% at T2 and T4, respectively (Figure 2). The levels of all the IgG isotypes were decreased by the treatment, as shown at T4 (eFigure 1).
Figure 2. Clinical Improvement in Patients With AChR-MG Treated With EFG.
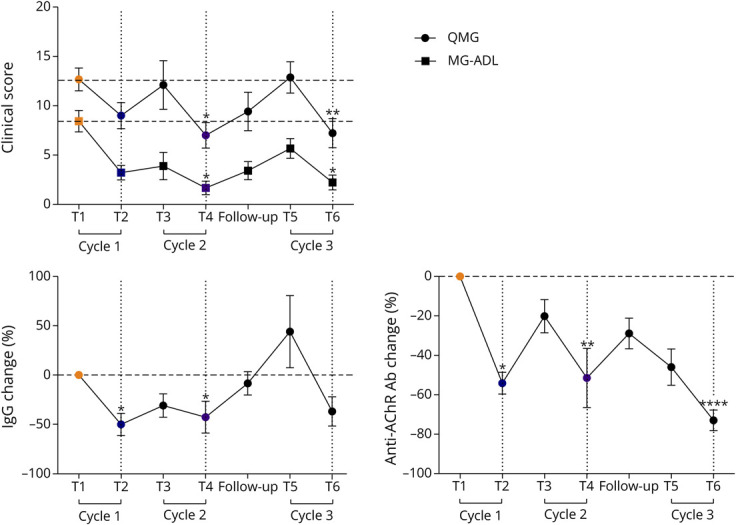
QMG and MG-ADL scores and percentage of total IgG and anti-AChR antibody changes in EFG-treated patients with AChR-MG (n = 9). In the graphs, the mean values ± SEM calculated for each measure in all the patients at each time point are shown. *p < 0.05, **p < 0.01, ****p < 0.0001, Friedman test with Dunn multiple comparison tests. AChR-MG = anti-acetylcholine receptor Ab–positive; EFG = efgartigimod; MG-ADL = Myasthenia Gravis Activities of Daily Living; QMG = Quantitative Myasthenia Gravis.
Anti-AChR autoAb levels were also decreased and were significantly lower than baseline levels at T2, T4, and T6 (Figure 2). However, from the end of each cycle until the start of the following one, IgG levels started to re-increase and further decrease on re-treatment (Figure 2). This trend was similar to that observed for anti-AChR Abs, although total IgG increase from the follow-up visit to the start of cycle 3 did not correspond to an increase in autoAbs (Figure 2).
EFG Increases Memory B Cells and Non-pathogenic Plasma Cells
Owing to the expression of FcRn in B cells,18,20 we explored the impact of its inhibition by EFG on circulating B-cell subpopulations in patients with AChR-MG (Table). Fresh PBMCs were analyzed by multiparametric flow cytometry during the treatment (Figure 1) to identify the following B-lymphocyte subpopulations (eFigure 2): (1) total B cells as CD19+, (2) naïve B cells as CD19+/CD27-, (3) memory B cells as CD19+/CD27+, and (4) plasma cells as CD27+/CD138+.26,27 We revealed a significant increase in the percentage of total CD19+ B cells in EFG-treated patients at the 4th infusion of cycle 1 (T2) compared with the baseline (T1) (Figure 3). These cells were proven to be CD19+/CD27+ memory, and not CD19+/CD27-naïve, B cells. Of interest, later in the treatment course, and specifically at the 4th infusion of cycle 2 (T4) and cycle 3 (T6), the same patients showed a significant increase in CD138+/CD27+ plasma cells compared with the baseline (Figure 3, eFigure 3, A and B), suggesting an EFG effect on B-cell activation and differentiation. EFG-induced CD138+/CD27+ plasma cells were mostly CD19− (percentage of CD19−vs CD19+ cells among CD138+/CD27+ cells at T4: 86.0 ± 11.6 vs 10.5% ± 7.7%) (eFigure 3C), indicating that they were mainly mature plasma cells or plasmablasts in an end-differentiation stage.27 Of note, after the follow-up visit, in the absence of EFG, memory B cells underwent a reduction and then a re-increase after the 1st infusion of cycle 3, whereas the percentage of plasma cells remained higher than baseline values up to T6 (Figure 3). We then assessed the behavior of memory B cells and plasma cells in each patient with AChR-MG and observed a trend toward increased levels at T2 and T4, respectively, compared with baseline (Figure 4A). Because the observed plasma cell increase did not correspond to an increase in anti-AChR Abs or to disease deterioration (Figure 2), we postulated that these cells were non-pathogenic/non-autoreactive plasma cells. Indeed, we did not find a significant correlation between plasma cell percentage and autoAb levels at T4, or at any time point during treatment (data not shown). On the contrary, the intra-patient plasma cell increase (T4/T1) significantly correlated with QMG score reduction at T4 (Figure 4B). The overall changes in clinical score values (QMG and MG-ADL scores), IgG and autoAb levels, and B-cell and plasma cell percentages during EFG treatment in patients with AChR-MG are illustrated in eFigure 4. These data supported the idea that non-autoreactive plasma cell induction by EFG could be a further mechanism, beyond IgG reduction, associated with AChR-MG improvement.
Figure 3. Increase in Memory B Cells and Plasma Cells in EFG-Treated Patients With AChR-MG.

Results of B-cell subpopulation analysis by flow cytometry in longitudinally collected PBMCs from patients with AChR-MG during EFG therapy. For T5 and T6, the analyses included 6 of the 9 patients. At each time point, the mean values ±SEM of the percentage of the following B-cell subpopulations have been reported: (1) total B cells as CD19+ cells, (2) naïve B cells as CD19+/CD27- cells, (3) memory B cells as CD19+/CD27+ cells, and (4) plasma cells as CD27+/CD138+ cells. A significant increase in the percentage of memory B cells was observed at T2 and of plasma cells at both T4 and T6 compared with the baseline. *p < 0.05, Kruskal-Wallis with uncorrected Dunn test. AChR-MG = anti-acetylcholine receptor Ab–positive; EFG = efgartigimod; PBMC = peripheral blood mononuclear cell.
Figure 4. Changes in Memory B Cells and Plasma Cells in Individual Patients and Correlation With Clinical Improvement and Increased Expression of Regulatory Plasma Cell Markers in EFG-Treated Patients With AChR-MG.

(A) Graphs showing the intra-patient behavior of CD19+/CD27+ memory B cells and CD138+/CD27+ plasma cells at T2 and T4, respectively, compared with the baseline (T1). *p < 0.05, paired t test. (B) Significant negative correlation estimated by Spearman correlation analysis (r: −0.81, p < 0.05) between QMG score changes (T4 vs T1) and the plasma cell increase (T4/T1) in patients with AChR-MG showing an increase in these cells at T4. (C and D) Real-time PCR analysis showing transcriptional levels of CD38 (C) and LAG3, IL-12a, and Ebi3 (D) genes in PBMCs of patients with AChR-MG (n = 8) before (T1) and on treatment with EFG (T4, i.e., 4th infusion of cycle 2). An upregulation of all genes was found at T4 compared with T1. In the “before-after” graph, data are expressed as relative expression values (2−∆Ct × 100) normalized against the endogenous control 18S. The line in red indicates a non-responder patient who did not undergo improvement on EFG therapy. The line in blue indicates a patient, initially a responder, but then requiring to begin cycle 3 of the drug earlier than the other patients. Differences between the 2 time points were significant for LAG3 after excluding the non-responder patient from the analyses (not shown). *p < 0.05, Wilcoxon matched-pairs signed-rank test. A significant positive correlation (r: 0.84; p < 0.01) was found between CD138+/CD27+ plasma cell percentage and transcriptional levels of CD38 at T4 by the Pearson correlation test (C). AChR-MG = anti-acetylcholine receptor Ab–positive; EFG = efgartigimod; PBMC = peripheral blood mononuclear cell.
EFG Does Not Affect Helper and Cytotoxic T Cells
According to data from the literature, FcRn is not expressed in T cells.20 However, considering the FcRn role in antigen presentation and cytokine production,7,20,21 we checked for possible variations in the frequency of CD4+ helper and CD8+ cytotoxic T cells in response to EFG treatment in patients with AChR-MG. These cells were assessed by flow cytometry in PBMCs (eFigure 5A) from the EFG-treated patients (Table) at baseline and during the fixed period. We did not observe significant changes in the CD4+ or CD8+ T-cell percentages at T2, T4, or the first follow-up visit compared with the baseline (eFigures 5B and 6), thus suggesting that EFG had no effect on the proportion of these cells in patients with AChR-MG.
EFG Increases Regulatory Plasma Cells
To confirm flow cytometry analyses at molecular levels and investigate the function of EFG-induced plasma cells in patients with AChR-MG, we performed real-time PCR analyses to assess the transcriptional levels of the following candidate genes in PBMCs before (T1) and after treatment (T4): (1) CD38, encoding a marker of plasma cells28; (2) LAG-3, encoding an inhibitory receptor acting as a marker of regulatory plasma cells with IS function29,30; (3) IL-12a (also known as p35), and (4) Ebi3 (Epstein-Barr virus–induced gene 3), encoding the 2 subunits of IL-35, an IL-12 family cytokine acting as IS protein associated with regulatory B and plasma cells.31-33
We found higher CD38 transcriptional levels at T4 compared with T1 in PBMCs from all patients with AChR-MG except for 2 (Figure 4C): the non-responder patient and a patient who required to begin cycle 3 earlier than other patients (0.7 vs 3.4 ± 2.7 months, Table). Of note, we observed a significant positive correlation between CD38 mRNA levels and plasma cell percentage in EFG-treated patients at T4 (Figure 4C), in line with flow cytometry data, hence supporting a drug effect in inducing B-cell differentiation.
According to the idea that EFG-induced plasma cells may have a non-pathogenic/non-autoreactive phenotype, we found LAG3 overexpression at T4 (compared with T1) in all patients except for the non-responder (Figure 4D). IL-12a and Ebi3 expressions were also increased, with significant results for IL-12a, in all patients, but not in the patient with an earlier disease deterioration (Figure 4D), who previously did not show CD38 upregulation (Figure 4C). Accordingly, gene expression levels of IL-12a at T4 positively correlated with the time interval between the end of cycle 2 and the start of cycle 3 (Spearman r = 0.74, p < 0.05; data not shown), and hence with persistence of EFG beneficial effects. Because both LAG3 and IL-35 are associated with regulatory plasma cells,29-33 LAG3, IL-12a, and Ebi3 upregulation by EFG in PBMCs supports the idea that the drug is able to induce plasma cells with a regulatory phenotype. Indeed, we provided direct evidence of LAG3 and IL-12a overexpression in CD138+ plasma cells isolated from PBMCs at T4 compared with T1 (eFigure 7). We therefore suggest a role, to be further investigated, of IL-12a and LAG3 as molecular biomarkers associated with clinical response to the drug.
Anti-FcRn Treatment Increases Expression of B Cells and Regulatory Molecules In Vitro
By immunofluorescence studies, we evaluated FcRn expression and the ability of an anti-FcRn mAb to bind the receptor, in Ramos-Blue cells (eFigure 8), analyzed as a B-cell model, and in CD20+ B cells from EFG-untreated patients with AChR-MG (Figure 5A, eFigure 9). Our data were in line with published reports on FcRn expression in B cells.18,20 Additional cells, negative for CD20, were FcRn-positive (Figure 5A, eFigure 9), according to FcRn expression in different immune system cells (e.g., monocytes).18 Control and MG PBMCs were treated with EFG (Vyvgart) or an anti-FcRn mAb, and separately with human IgG1 or mouse IgG2a as negative controls, and analyzed by flow cytometry (eFigure 10A). We observed a significant increase in the proportion of CD19+ B cells in PBMCs treated with EFG or the anti-FcRn mAb, but not with the negative controls, compared with untreated cells (Figures 5B and 6A, eFigure 10B). EFG effect was dose-dependent, with a higher CD19+ cell percentage observed in cells treated with a higher dose of the drug (2 µg/mL vs 1 µg/mL) (eFigure 11). Of interest, real-time PCR data revealed significantly higher CD38 and LAG3 transcriptional levels in PBMCs treated with EFG or the anti-FcRn mAb compared with untreated cells and cells treated with the relative negative controls (Figure 6B), thus supporting EFG's ability to stimulate B-cell expansion and differentiation into plasma cells with a regulatory phenotype, as observed in patients' PBMCs.
Figure 5. FcRn Expression in B Cells and In Vitro Effect of Anti-FcRn Treatment.

(A) Double immunofluorescence staining showing the expression of FcRn (green) in CD20+ (red) B cells of MG PBMCs collected at T1 (baseline). Magnification bars: 10 µm. (B) Representative overlay histograms of flow cytometry analysis performed to assess percentage of CD19+/CD27+ B cells in PBMCs from healthy controls (n = 2) and treatment-naïve patients with MG (n = 2) after 24-hour treatments performed in triplicate with (1) EFG (Vyvgart; dose I: 1 µg/mL) or human IgG1 as negative control and (2) an anti-FcRn mAb (sc-271745, Santa Cruz Biotechnology; 1 µg/mL) or mouse IgG2a as isotype control. Basal: untreated cells; Neg Control: unstained cells. EFG = efgartigimod; PBMC = peripheral blood mononuclear cell.
Figure 6. In Vitro Effects of Anti-FcRn Treatment on B-Cell Frequency and Expression of CD38 and LAG3.

(A) Percentage of CD19+ B cells measured by flow cytometry in PBMCs from healthy controls (CTR, n = 2, white dots) and treatment-naïve patients with MG (n = 2, black dots), after 24-hour treatments performed in triplicate with EFG (Vyvgart; dose I: 1 µg/mL) or human IgG1 as negative control and (2) an anti-FcRn mAb (sc-271745, Santa Cruz Biotechnology; 1 µg/mL) or mouse IgG2a as an isotype control. Data are expressed as mean ± SEM of percentage changes in treated PBMCs relative to untreated cells. An outlier value (−85%) in the group of IgG1-treated cells was excluded from the analyses, according to the Grubbs test. (B) Real-time PCR analysis of transcriptional levels of CD38 and LAG3 in PBMCs from healthy controls (CTR, n = 1, white dots) and treatment-naïve patients with MG (n = 2, black dots), after 24-hour treatments performed in triplicate with EFG or the anti-FcRn mAb and their relative controls. Data are presented as mean ± SEM of 2−∆Ct × 100 relative expression values normalized with the endogenous control 18S. *p < 0.05, ***p < 0.01, **p < 0.01, ***p < 0.001, the Friedman test with Dunn's multiple comparison tests. MG = myasthenia gravis; PBMC = peripheral blood mononuclear cell.
Discussion
Biological drugs blocking the FcRn have been developed to efficiently reduce autoAbs in patients with Ab-mediated autoimmune conditions, including MG.9-11,34 Indeed, the FcRn is responsible for recycling and enhancing the half-life of IgGs, including autoAbs, being able to protect them from lysosomal degradation.7,8,34 The Phase 3 ADAPT (NCT03669588) trial and its open-label extension study demonstrated that the FcRn-blocker EFG generated a rapid and meaningful improvement without relevant side effects in patients with gMG.14-16
A wealth of data indicated that FcRn, in addition to endothelial cells, is largely expressed in myeloid cells, such as monocytes, macrophages, and dendritic cells, and in B lymphocytes.18-21 Moreover, this receptor has been implicated in several immunologic processes, including potentiation of innate and adaptive immune responses, antigen presentation, and cytokine production.7,20,21
The aim of this study was to explore the possible immunologic impact of FcRn inhibition by EFG in patients with AChR-MG beyond Ig reduction. Specifically, we investigated the drug effects on B lymphocytes. First, we confirmed EFG efficacy in inducing clinical improvement, according with QMG and MG-ADL score reduction and IgG and autoAb level decrease in patients with AChR-MG from baseline to cycle 3. Then, flow cytometry analysis showed a significant increase in CD19+/CD27+ memory B cells at the last EFG infusion of cycle 1 (T2) and a significant increase in CD138+/CD27+ plasma cells later during treatment, and specifically at the time of the last infusion of cycle 2 (T4) and cycle 3 (T6). Of note, plasma cell percentages were higher than those observed at baseline throughout treatment (up to cycle 3). Because the induction of these cells was not accompanied by IgG or autoAb increase or MG relapse, we postulated that they may have a nonpathogenic/non-autoreactive phenotype. In the context of an autoimmune disease, an increment of plasma cells could represent a pathogenic event, due to possible autoAb production. However, it is well recognized that plasma cells with immunoregulatory properties may be generated under certain stimuli and have IS functions.30 It has been demonstrated that, in the context of IV immunoglobulin (IVIg) therapy, plasmacytosis correlated with a faster clinical improvement in Guillain-Barré syndrome.35 Moreover, some studies showed B-cell immunomodulation by IVIg, due to spontaneous IVIg internalization by B cells, and the ability of IVIg to alter activation, proliferation, and apoptosis of these cells.36-38 According to these observations, and with data showing that IgGs can induce B-cell anergy,38 IgG reduction by EFG could be associated with an increased B-cell expansion and differentiation.
B-cell expansion and differentiation could represent a negative (balancing) feedback mechanism aimed at restoring IgG levels reduced by EFG and then resulting in IgG production and increase, also as a consequence of drug withdrawal. This in turn might limit the recycling and half-life of anti-AChR Abs, potentially due to competition for the FcRn between non-pathogenic/non-autoreactive IgGs and autoAbs. Indeed, the observed increase in plasma cells at T4 was in line with a trend toward an overall increase of IgG levels after T4, continuing up to the start of cycle 3; this did not correspond to an increase in anti-AChR Ab levels but rather to a decrease, from the follow-up visit to the start of cycle 3.
In line with the above-mentioned hypothesis, we demonstrated an immunoregulatory phenotype of EFG-induced plasma cells, by showing an increased expression of CD38, a marker of B-cell differentiation,28 and LAG3,29,30 a specific marker of regulatory plasma cells, in circulating cells of patients with AChR-MG at the end of cycle 2 (T4) compared with the baseline. Remarkably, CD38 and LAG3 have been demonstrated to discriminate cells with a regulatory capacity and particularly with inhibitory function.29,30,39-41 Moreover, LAG3 expression was reported to be induced by IL-12a40 that, together with Ebi3, constitutes IL-35,31 the expression of which has been associated with suppressive functions of plasma cells.32 Of interest, IL-12a and Ebi3, and particularly IL-12a, were overexpressed in PBMCs of patients at T4 compared with the baseline, thus strengthening the EFG immunoregulatory effect. Notably, increased CD38 and LAG3 expression levels at T4 were not observed in a nonresponder patient; moreover, CD38, IL-12a, and Ebi3 transcriptional levels were not increased in a patient showing disease worsening earlier than other patients after cycle 2, thus suggesting a potential value, to be further explored in a wider patient cohort, of these plasma cell–related immunoregulatory transcripts as molecular biomarkers to monitor the response to EFG.
Because the increase in B cells and plasma cells by EFG could be an indirect effect of the drug related to IgG variation, but also a direct consequence of the drug binding FcRn in B cells, we treated PBMCs with an anti-FcRn mAb and separately with EFG to test the direct drug impact on these cells. We observed an increment of CD19+ cell percentage, accompanied by increased CD38 and LAG3 expression levels, in PBMCs treated with both the anti-FcRn mAb and EFG compared with cells untreated or treated with the negative controls. These in vitro data, combined with those from patients with AChR-MG, suggested that FcRn stimulation or blocking in B cells by EFG can lead to B-cell expansion and induction of plasma cells with a LAG3-related regulatory phenotype. Beyond the reduction of specific autoantibodies promoted by EFG, the observed cellular mechanisms may likely be operative in MuSK-MG, an issue we could not address in this study.
This study has some limitations and leaves open questions to be addressed in future research: (1) the number of EFG-treated patients is small, and the results should be replicated in larger patient cohorts, including patients with AChR-MG, those with MuSK-MG, and triple-seronegative patients; (2) the specificity and immunophenotypic profile of EFG-induced plasma cells need to be further characterized; (3) the potential contribution of these cells to the inter-patient variability in timing and rate of IgG “rebound/resynthesis” after EFG discontinuation also deserves further investigation in larger patient cohorts; (4) regulatory B-cell and plasma cell expansion as a potential mechanism implicated in EFG efficacy in IgG4 neurologic diseases, along with MuSK-MG, could be of interest to be explored; (5) whether genetic variability (e.g., sequence variants in the Fc Gamma Receptor and Transporter [FCGRT] gene)34 affects clinical and immunologic response to EFG is another issue to be clarified.
Our overall findings propose an immunoregulatory activity of EFG in patients with AChR-MG beyond IgG reduction. B-cell expansion and differentiation into plasma cells with a regulatory phenotype may represent an EFG-induced mechanism associated with disease improvement, to be further investigated on a longer clinical follow-up. In this regard, LAG3 and other molecules associated with regulatory plasma cells may have the potential as biological markers of EFG activity and improve the transition to personalization of treatment in MG.
Glossary
- Ab
autoantibody
- AChR
acetylcholine receptor
- autoAbs
autoantibodies
- BSA
bovine serum albumin
- CET
Comitato Etico Territoriale
- EAP
Expanded Early Access Program
- Ebi3
Epstein-Barr virus-induced gene 3
- EFG
efgartigimod
- FBS
fetal bovine serum
- Fc
fragment crystallizable
- FcRn
neonatal Fc receptor
- FINCB
Fondazione IRCCS Istituto Neurologico Carlo Besta
- FSC-A
forward scatter area
- FSC-H
forward scatter height
- GENERATIVE
GENERalized myAsThenia graVis Efgartgimod
- IS
immunosuppressive
- IVIg
Intravenous immunoglobulin
- LAG-3
lymphocyte-activation gene 3
- mAb
monoclonal Ab
- MG
myasthenia gravis
- MG-ADL
Myasthenia Gravis Activities of Daily Living
- MHC
major histocompatibility complex
- MuSK
muscle-specific kinase receptor
- PBMCs
peripheral blood mononuclear cells
- QMG
Quantitative Myasthenia Gravis
- SSC-A
side scatter area
- T1
first infusion of EFG cycle 1
- T2
last infusion of EFG cycle 1
- T3
first infusion of EFG cycle 2
- T4
last infusion of EFG cycle 2
- T5
first infusion of EFG cycle 3
- T6
last infusion of EFG cycle 3
Author Contributions
M.C. Tarasco: drafting/revision of the manuscript for content, including medical writing for content; major role in the acquisition of data; analysis or interpretation of data. E Rinaldi: major role in the acquisition of data; analysis or interpretation of data. R. Frangiamore: drafting/revision of the manuscript for content, including medical writing for content; major role in the acquisition of data. F. Vanoli: drafting/revision of the manuscript for content, including medical writing for content; major role in the acquisition of data. A. Berni: major role in the acquisition of data. N. Iacomino: analysis or interpretation of data. A. Canciello: major role in the acquisition of data. F. Andreetta: drafting/revision of the manuscript for content, including medical writing for content. E. Ciusani: major role in the acquisition of data. S. Bonanno: drafting/revision of the manuscript for content, including medical writing for content; analysis or interpretation of data. L. Maggi: drafting/revision of the manuscript for content, including medical writing for content. F. Baggi: drafting/revision of the manuscript for content, including medical writing for content; analysis or interpretation of data. R. Mantegazza: drafting/revision of the manuscript for content, including medical writing for content; study concept or design; analysis or interpretation of data. C. Antozzi: drafting/revision of the manuscript for content, including medical writing for content; study concept or design; analysis or interpretation of data. P. Cavalcante: drafting/revision of the manuscript for content, including medical writing for content; study concept or design; analysis or interpretation of data.
Study Funding
This work has been supported by the Fondazione Regionale per la Ricerca Biomedica (Regione Lombardia), Project ERAPERMED2022-258, GA 779282 under the frame of ERA PerMed, and by the Italian Ministry of Health (RRC).
Disclosure
R. Frangiamore has received funding for consulting and speaking from Alexion Pharmaceuticals, UCB, and Argenx. S. Bonanno has received funding for travel, meeting attendance, and advisory board participation from Alexion; Sanofi; Roche; and Biogen. L. Maggi has received funding for travel, meeting attendance, and advisory board participation from Alexion; Sanofi Genzyme; Amicus Therapeutics; Janssen; Argenx; Biogen; Lupin; Roche; patient-centered biopharmaceutical company (PTC) therapeutics; and UCB. F. Vanoli has received funding for travel, meeting attendance, and advisory board participation from Alexion; UCB Pharma; Argenx; and Sanofi. R. Mantegazza has received compensation for participating in advisory boards in relation to MG clinical trial designs, congress participations, and research support from Alexion Pharmaceuticals; ARGENX Pharma; UCB; and PIEM. C. Antozzi has received funding for travel, meeting attendance, and advisory board participation from Alexion; Momenta; Sanofi; Janssen; Argenx; and UCB. P. Cavalcante has received compensation for participating in advisory boards and speaking at scientific meetings from Alexion Pharmaceuticals. The authors are also part of the European Reference Network for rare neuromuscular diseases (ERN-NMD). Go to Neurology.org/NN for full disclosures.
References
- 1.Kaminski HJ, Sikorski P, Coronel SI, Kusner LL. Myasthenia gravis: the future is here. J Clin Invest. 2024;134(12):e179742. doi: 10.1172/JCI179742 [DOI] [PMC free article] [PubMed] [Google Scholar]
- 2.Lazaridis K, Tzartos SJ. Myasthenia gravis: autoantibody specificities in myasthenia gravis; implications for improved diagnostics and therapeutics. Front Immunol. 2020;11:212. doi: 10.3389/fimmu.2020.00212 [DOI] [PMC free article] [PubMed] [Google Scholar]
- 3.Narayanaswami P, Sanders DB, Wolfe G, et al. International consensus guidance for management of myasthenia gravis: 2020 update. Neurology. 2021;96(3):114-122. doi: 10.1212/WNL.0000000000011124 [DOI] [PMC free article] [PubMed] [Google Scholar]
- 4.Mantegazza R, Antozzi C. When myasthenia gravis is deemed refractory: clinical signposts and treatment strategies. Ther Adv Neurol Disord. 2018;11:1756285617749134. doi: 10.1177/1756285617749134 [DOI] [PMC free article] [PubMed] [Google Scholar]
- 5.Cortés-Vicente E, Álvarez-Velasco R, Paradas C, et al. Drug‐refractory myasthenia gravis: clinical characteristics, treatments, and outcome. Ann Clin Transl Neurol. 2022;9(2):122-131. doi: 10.1002/acn3.51492 [DOI] [PMC free article] [PubMed] [Google Scholar]
- 6.Cavalcante P, Mantegazza R, Antozzi C. Targeting autoimmune mechanisms by precision medicine in Myasthenia Gravis. Front Immunol. 2024;15:15-1404191. doi: 10.3389/fimmu.2024.1404191 [DOI] [PMC free article] [PubMed] [Google Scholar]
- 7.Pyzik M, Rath T, Lencer WI, Baker k, Blumberg RS. FcRn: the architect behind the immune and non-immune functions of IgG and albumin. J Immunol. 2015;194(10):4595-4603. doi: 10.4049/jimmunol.1403014 [DOI] [PMC free article] [PubMed] [Google Scholar]
- 8.Pyzik M, Kozicky LK, Gandhi AK, Blumberg RS. The therapeutic age of the neonatal Fc receptor. Nat Rev Immunol. 2023;23(7):415-432. doi: 10.1038/s41577-022-00821-1 [DOI] [PMC free article] [PubMed] [Google Scholar]
- 9.Zuercher AW, Spirig R, Baz Morelli A, Rowe T, Käsermann F. Next-generation Fc receptor–targeting biologics for autoimmune diseases. Autoimmun Rev. 2019;18(10):102366. doi: 10.1016/j.autrev.2019.102366 [DOI] [PubMed] [Google Scholar]
- 10.Ulrichts P, Guglietta A, Dreier T, et al. Neonatal Fc receptor antagonist efgartigimod safely and sustainably reduces IgGs in humans. J Clin Invest. 2018;128(10):4372-4386. doi: 10.1172/JCI97911 [DOI] [PMC free article] [PubMed] [Google Scholar]
- 11.Yang Y, Shen Z, Shi F, Wang F, Wen N. Efgartigimod as a novel FcRn inhibitor for autoimmune disease. Neurol Sci. 2024;45(9):4229-4241. doi: 10.1007/s10072-024-07460-5 [DOI] [PubMed] [Google Scholar]
- 12.Heo YA. Efgartigimod: first approval. Drugs. 2022;82(3):341-348. doi: 10.1007/s40265-022-01678-3 [DOI] [PMC free article] [PubMed] [Google Scholar]
- 13.Zai Lab and Argenx Announce Approval of VYVGART® (Efgartigimod Alfa Injection) for Generalized Myasthenia Gravis in China. Zai Lab. 2023. Accessed January 14, 2025. zailab.gcs-web.com/news-releases/news-release-details/zai-lab-and-argenx-announce-approval-efgartigimod-alfa-injection [Google Scholar]
- 14.Howard JF Jr, Bril V, Vu T, et al. Safety, efficacy, and tolerability of efgartigimod in patients with generalised myasthenia gravis (ADAPT): a multicentre, randomised, placebo-controlled, phase 3 trial. Lancet Neurol. 2021;20(7):526-536. doi: 10.1016/S1474-4422(21)00159-9 [DOI] [PubMed] [Google Scholar]
- 15.Howard JF Jr, Bril V, Vu T, et al. Long-term safety, tolerability, and efficacy of efgartigimod (ADAPT+): interim results from a phase 3 open-label extension study in participants with generalized myasthenia gravis. Front Neurol. 2024;14:14-1284444. doi: 10.3389/fneur.2023.1284444 [DOI] [PMC free article] [PubMed] [Google Scholar]
- 16.Dewilde S, Griffiths A, Qi CZ, et al. Post-hoc analyses from the ADAPT clinical study demonstrate aggregate sustained benefit of Efgartigimod in generalized myasthenia gravis. J Neurol Sci. 2024;466:123264. doi: 10.1016/j.jns.2024.123264 [DOI] [PubMed] [Google Scholar]
- 17.Vaccaro C, Zhou J, Ober RJ, Ward ES. Engineering the Fc region of immunoglobulin G to modulate in vivo antibody levels. Nat Biotechnol. 2005;23(10):1283-1288. doi: 10.1038/nbt1143 [DOI] [PubMed] [Google Scholar]
- 18.Zhu X, Meng G, Dickinson BL, et al. MHC class I-related neonatal Fc receptor for IgG is functionally expressed in monocytes, Intestinal macrophages, and dendritic cells. J Immunol. 2001;166(5):3266-3276. doi: 10.4049/jimmunol.166.5.3266 [DOI] [PMC free article] [PubMed] [Google Scholar]
- 19.Qiao SW, Kobayashi K, Johansen FE, et al. Dependence of antibody-mediated presentation of antigen on FcRn. Proc Natl Acad Sci U S A. 2008;105(27):9337-9342. doi: 10.1073/pnas.0801717105 [DOI] [PMC free article] [PubMed] [Google Scholar]
- 20.Baker K, Rath T, Pyzik M, Blumberg RS. The role of FcRn in antigen presentation. Front Immunol. 2014;5(5):408. doi: 10.3389/fimmu.2014.00408 [DOI] [PMC free article] [PubMed] [Google Scholar]
- 21.Pyzik M, Sand KMK, Hubbard JJ, Andersen JT, Sandlie I, Blumberg RS. The neonatal Fc receptor (FcRn): a misnomer? Front. Immunol. 2019;10(10):1540. doi: 10.3389/fimmu.2019.01540 [DOI] [PMC free article] [PubMed] [Google Scholar]
- 22.Frangiamore R, Rinaldi E, Vanoli F, et al. Efgartigimod in generalized myasthenia gravis: a real-life experience at a national reference center. Eur J Neurol. 2024;31(4):e16189. doi: 10.1111/ene.16189 [DOI] [PMC free article] [PubMed] [Google Scholar]
- 23.Bedlack RS, Simel DL, Bosworth H, Samsa G, Tucker-Lipscomb B, Sanders DB. Quantitative myasthenia gravis score: assessment of responsiveness and longitudinal validity. Neurology. 2005;64(11):1968-1970. doi: 10.1212/01.WNL.0000163988.28892.79 [DOI] [PubMed] [Google Scholar]
- 24.Muppidi S, Silvestri NJ, Tan R, Riggs K, Leighton T, Phillips GA. Utilization of MG-ADL in myasthenia gravis clinical research and care. Muscle Nerve. 2022;65(6):630-639. doi: 10.1002/mus.27476 [DOI] [PMC free article] [PubMed] [Google Scholar]
- 25.Andreetta F, Rinaldi E, Bartoccioni E, et al. Diagnostics of myasthenic syndromes: detection of anti-AChR and anti-MuSK antibodies. Neurol sci. 2017;38(suppl 2):253-257. doi: 10.1007/s10072-017-3026-2 [DOI] [PubMed] [Google Scholar]
- 26.Oleinika K, Mauri C, Salama AD. Effector and regulatory B cells in immune-mediated kidney disease. Nat Rev Nephrol. 2019;15(1):11-26. doi: 10.1038/s41581-018-0074-7 [DOI] [PubMed] [Google Scholar]
- 27.Stathopoulos P, Dalakas MC. Evolution of anti-B cell therapeutics in autoimmune neurological diseases. Neurotherapeutics. 2022;19(3):691-710. doi: 10.1007/s13311-022-01196-w [DOI] [PMC free article] [PubMed] [Google Scholar]
- 28.Sanz I, Chungwen W, Jenks SA, et al. Challenges and opportunities for consistent classification of human B cell and plasma cell populations. Front Immunol. 2019;18(10):2458. [DOI] [PMC free article] [PubMed] [Google Scholar]
- 29.Lino AC, Dang VD, Lampropoulou V, et al. LAG-3 inhibitory receptor expression identifies immunosuppressive natural regulatory plasma cells. Immunity. 2018;17;49(1):120-133.e9. doi: 10.1016/j.immuni.2018.06.007 [DOI] [PMC free article] [PubMed] [Google Scholar]
- 30.Fillatreau S. Natural regulatory plasma cells. Curr Opin Immunol. 2018;55:62-66. doi: 10.1016/j.coi.2018.09.012 [DOI] [PMC free article] [PubMed] [Google Scholar]
- 31.Ye C, Yano H, Workman CJ, Vignali DAA. Interleukin-35: structure, function and its impact on immune-related diseases. J Interferon Cytokine Res. 2021;41(11):391-406. doi: 10.1089/jir.2021.0147 [DOI] [PMC free article] [PubMed] [Google Scholar]
- 32.Shen P, Roch T, Lampropoulou V, et al. IL-35-producing B cells are critical regulators of immunity during autoimmune and infectious diseases. Nature. 2014;507(7492):366-370. doi: 10.1038/nature12979 [DOI] [PMC free article] [PubMed] [Google Scholar]
- 33.Veh J, Ludwig C, Schrezenmeier H, Jahrsdörfer B. Regulatory B cells —immunopathological and prognostic potential in humans. Cells. 2024;13(4):357. doi: 10.3390/cells13040357 [DOI] [PMC free article] [PubMed] [Google Scholar]
- 34.Dalakas MC, Spaeth PJ. The importance of FcRn in neuro-immunotherapies: from IgG catabolism, FCGRT gene polymorphisms, IVIg dosing and efficiency to specific FcRn inhibitors. Ther Adv Neurol Disord. 2021;14:1756286421997381. doi: 10.1177/1756286421997381 [DOI] [PMC free article] [PubMed] [Google Scholar]
- 35.Mori I, Parizot C, Dorgham K, et al. Prominent plasmacytosis following intravenous immunoglobulin correlates with clinical improvement in guillain-barré Syndrome. PLoS One. 2008;3(5):e2109. doi: 10.1371/journal.pone.0002109 [DOI] [PMC free article] [PubMed] [Google Scholar]
- 36.Proulx DP, Aubin E, Lemieux R, Bazin R. Spontaneous internalization of IVIg in activated B cells. Immunol Lett. 2009;124(1):18-26. doi: 10.1016/j.imlet.2009.03.012 [DOI] [PubMed] [Google Scholar]
- 37.Galeotti C, Kaveri SV, Bayry J. IVIG-mediated effector functions in autoimmune and inflammatory diseases. Int Immunol. 2017;29(11):491-498. doi: 10.1093/intimm/dxx039 [DOI] [PubMed] [Google Scholar]
- 38.Mitrevski M, Marrapodi R, Camponeschi A, et al. Intravenous immunoglobulin and immunomodulation of B-cell – in vitro and in vivo effects. Front Immunol. 2015;6:4. doi: 10.3389/fimmu.2015.00004 [DOI] [PMC free article] [PubMed] [Google Scholar]
- 39.Blair PA, Noreña LY, Flores-Borja F, et al. CD19+CD24hiCD38hi B cells exhibit regulatory capacity in healthy individuals but are functionally impaired in systemic lupus erythematosus patients. Immunity. 2010;32(1):129-140. doi: 10.1016/j.immuni.2009.11.009 [DOI] [PubMed] [Google Scholar]
- 40.Graydon CG, Mohideen S, Fowke KR. LAG3's enigmatic mechanism of action. Front Immunol. 2020;11:615317. doi: 10.3389/fimmu.2020.615317 [DOI] [PMC free article] [PubMed] [Google Scholar]
- 41.Hu S, Tao Y, Hu F, Liu X. Diminished LAG3+ B cells correlate with exacerbated rheumatoid arthritis. Ann Med. 2023;55(1):2208373. doi: 10.1080/07853890.2023.2208373 [DOI] [PMC free article] [PubMed] [Google Scholar]
Associated Data
This section collects any data citations, data availability statements, or supplementary materials included in this article.
Data Availability Statement
Anonymized data not published within this article will be made available on reasonable request from any qualified investigator.