

ABSTRACT
The triglyceride–glucose body mass index (TyG‐BMI) is an emerging composite metabolic indicator in cardiovascular research. However, the link between TyG‐BMI and target organ damage (TOD) in essential hypertension (EH) remains uncertain. This study investigated the association between TyG‐BMI and TOD in patients with EH. We conducted a retrospective cohort study involving 493 individuals with EH. Participants were divided at the cohort‐specific median into high and low TyG‐BMI groups. Over a median follow‐up of 23 months, 191 participants experienced TOD. Kaplan–Meier curves showed a significantly higher cumulative incidence of TOD in the high TyG‐BMI group than in the low TyG‐BMI group (p < 0.05). In multivariable logistic regression, TyG‐BMI remained an independent correlate of TOD (adjusted OR = 1.83, 95% CI: 1.08–3.10; p < 0.05). Least absolute shrinkage and selection operator–Cox regression further selected TyG‐BMI, age, and smoking status as key predictors of TOD. Subgroup analyses revealed that the TyG‐BMI–TOD association was stronger among younger or middle‐aged, normal‐weight, non‐diabetic, non‐smoking subjects (p < 0.05). Finally, the TyG‐BMI‐based model achieved predictive accuracy comparable to that of a conventional risk‐factor model. In conclusion, TyG‐BMI is independently associated with TOD in EH patients. Its predictive value closely mirrors that of combined traditional risk factors, highlighting TyG‐BMI as a promising clinical marker.
Keywords: hypertension, insulin resistance, target organ damage, triglyceride–glucose body mass index
1. Introduction
Essential hypertension (EH), a highly prevalent condition worldwide, represents not only a predominant risk factor for cardiovascular disease but also a key determinant of target organ damage (TOD) [1]. Persistent blood pressure (BP) elevation triggers endothelial dysfunction and vascular remodeling, precipitating TOD such as left ventricular hypertrophy, glomerulosclerosis, and atherosclerotic plaques [2]. Current cardiovascular risk assessment still relies mainly on isolated variables such as age, smoking, obesity, BP, glycemia, dyslipidemia, and other factors [3, 4, 5]. These static, one‐dimensional indices neither capture integrated metabolic imbalances nor meet the need for simple, low‐cost, reproducible tools for community follow‐up [6].
The triglyceride–glucose body mass index (TyG‐BMI) has recently emerged as a composite metabolic marker of growing interest [7, 8, 9]. TyG‐BMI combines the triglyceride–glucose (TyG) index, derived from fasting triglyceride and glucose levels, with body mass index (BMI), incorporating dysglycemia, dyslipidemia, and obesity into a single metric [10, 11]. Insulin resistance (IR) promotes myocardial hypertrophy, tubulointerstitial fibrosis, and large‐artery stiffening via oxidative stress and endothelial injury [12]. Elevated plasma free fatty acids and obesity‐related low‐grade inflammation accelerate these processes [13, 14]. Hypertension itself is a chronic metabolic disorder that interacts with these derangements, amplifying overall metabolic burden. Therefore, TyG‐BMI may provide a comprehensive measure of metabolic burden in hypertension and facilitate early prediction of TOD. However, evidence supporting TyG‐BMI as a TOD predictor in hypertension is limited, and its additional value over traditional models remains uncertain.
We performed a retrospective cohort study to clarify the association between TyG‐BMI and TOD in a population with EH. Additionally, a TyG‐BMI‐based prediction model was developed and validated, and its performance was compared with that of a conventional risk‐factor model to provide a simple, economical, and mechanistically grounded tool for risk stratification.
2. Methods
2.1. Experimental Protocol
We conducted a single‐center retrospective cohort study using the Hypertension Target Organ Damage and Its Risk Factors: Fuzhou Study database [15, 16]. The study was approved by the Ethics Committee of the First Affiliated Hospital of Fujian Medical University (Approval No. MRCTA, ECFAH of FMU [2020]306) and registered with the Chinese Clinical Trial Registry (October 28, 2020). All procedures complied with the Declaration of Helsinki, and written informed consent was obtained from each participant before enrolment.
2.2. Participants
This study included patients with EH from the Department of Geriatrics, First Affiliated Hospital of Fujian Medical University between August 2000 and May 2016. Hypertension was diagnosed in accordance with the 2018 Chinese Guidelines for the Prevention and Treatment of Hypertension [17]. Inclusion criteria were as follows: (1) hypertension evidenced by at least one of the following—seated clinic BP ≥ 140/90 mmHg on three separate occasions without antihypertensive treatment, a documented diagnosis treated with antihypertensive medication, 24‐h ambulatory BP mean ≥ 130/80 mmHg (daytime ≥ 135/85 mmHg or night‐time ≥ 120/70 mmHg), or home BP mean ≥ 135/85 mmHg; (2) age ≥ 18 years; and (3) at least three completed follow‐up visits. Participants were excluded if they met any of the following criteria: (1) secondary hypertension; (2) evidence of baseline TOD—including, but not limited to, left ventricular hypertrophy, microalbuminuria, or carotid plaque—or related complications such as previous stroke, myocardial infarction, heart failure, or peripheral arterial disease; (3) severe hepatic dysfunction; (4) malignancy; (5) pregnancy or lactation; (6) serious infection or autoimmune disease within the preceding 3 months; or (7) incomplete essential clinical, laboratory, or imaging data.
2.3. Follow‐Up and Outcome Definition
Follow‐up began in August 2000 and was implemented every 3–6 months through scheduled outpatient or inpatient visits, during which BP, laboratory indices, and imaging findings were recorded. Follow‐up ended on May 31, 2018. The median follow‐up was 23 (95% CI: 3–95) months. The primary endpoint was the first occurrence of TOD. TOD was defined as (1) cardiac injury, indicated by a left‐ventricular mass index (LVMI) ≥115 g/m2 in men or ≥95 g/m2 in women; (2) renal injury, defined as serum creatinine ≥115 µmol/L in men or ≥107 µmol/L in women, or a urine albumin‐to‐creatinine ratio (UACR) ≥30 mg/g; and (3) large‐artery injury, evidenced by a carotid intima‐media thickness (CIMT) ≥0.9 mm or by newly detected atherosclerotic plaque [17]. If multiple TOD events occurred, only the interval to the first event was analyzed. Patients who had not developed TOD or had been lost to follow‐up were censored on the date of their last documented contact.
2.4. Clinical Data Collection
Data for this study were sourced from the previously described database [15, 16]. Baseline characteristics comprised age, sex, weight, height, BP, heart rate, smoking, alcohol consumption, duration of EH, comorbidities, and family history of cardiovascular disease. BMI was calculated as weight (kg)/height2 (m2). Laboratory indices were measured following an overnight fast (≥8 h). Blood samples were drawn from the antecubital vein and analyzed using an ADVIA 2400 auto‐analyzer (Siemens, Germany) [15, 16]. The following parameters were assessed: total bilirubin, fasting plasma glucose (FPG), albumin, lactate dehydrogenase, alanine aminotransferase, creatinine, uric acid, triglycerides, total cholesterol, low‐density lipoprotein cholesterol (LDL‐C), high‐density lipoprotein cholesterol (HDL‐C), white blood cell count, hemoglobin, and platelet count. Urinary albumin was quantified using immunoturbidimetry (Roche P800, USA), while urinary creatinine was measured by colorimetric assay (Boehringer Mannheim 717, Germany), with the UACR subsequently calculated [16]. Carotid ultrasound and echocardiography were carried out with a LOGIQ 7 color‐Doppler system (GE, USA) by an experienced physician blinded to clinical data [18, 19]. The TyG index was derived as ln [triglycerides (mg/dL) × FPG (mg/dL)/2], and TyG‐BMI was obtained by multiplying the TyG index by BMI.
Of the 762 patients initially assessed, 493 were included in the final analysis after exclusions, loss to follow‐up, and missing data. Participants were divided into high (n = 247) and low (n = 246) TyG‐BMI groups according to the cohort median (209.5). The detailed group classification is presented in Figure 1.
FIGURE 1.
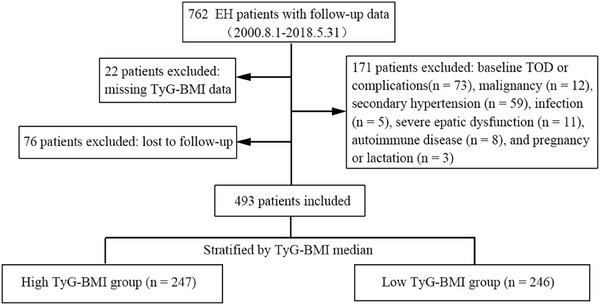
Flow diagram of participant inclusion and stratification. EH, essential hypertension; TOD, target organ damage; TyG‐BMI, triglyceride–glucose body mass index.
2.5. Statistical Analysis
All analyses were performed in R software (version 4.3.1). Normality of continuous variables was assessed with the Shapiro–Wilk test. Normally distributed variables were presented as mean ± standard deviation and compared with the Student's t‐test. Skewed data were summarized as median (interquartile range) and analyzed with the Mann–Whitney U test. Categorical variables were expressed as counts (percentages) and evaluated by the χ2 test. Kaplan–Meier curves compared the cumulative incidence of TOD between high‐ and low‐TyG‐BMI groups, and differences were tested with the log‐rank test. All multivariable models used a shared covariate pool comprising baseline characteristics that differed between TyG‐BMI strata and variables previously identified as confounders of TOD [5]. To reduce overfitting, we retained only clinically relevant covariates that showed a univariate association with TOD and no collinearity, defined as a variance inflation factor (VIF) ≤ 5. We next modeled the TyG‐BMI–TOD association using two complementary multivariable models: nested logistic regression and least absolute shrinkage and selection operator–Cox regression (LASSO–Cox). First, we entered the dichotomized TyG‐BMI (high vs. low) into nested multivariable logistic regression models to quantify its association with TOD. Model 1 was unadjusted; Model 2 adjusted for age and sex; Model 3 further adjusted for covariates selected from the predefined set using a forward‐conditional algorithm. Second, we applied LASSO–Cox regression to the full covariate set and selected the optimal penalty term (λ) via 10‐fold cross‐validation to identify informative predictors. Variables retaining non‐zero LASSO coefficients were entered into a multivariable Cox proportional‐hazards model, and the results were visualized in a nomogram. Model performance was evaluated in terms of discrimination, calibration, and clinical utility. Discrimination was characterized by Harrell's C‐index and the area under the curve (AUC) of the receiver operating characteristic (ROC) analysis. Calibration was assessed with 1000‐bootstrap calibration plots, and net clinical benefit was estimated by decision‐curve analysis (DCA). All metrics were reported at 1, 3, and 5 years. The new model was benchmarked against a conventional risk model that included sex, age, systolic BP, smoking, hypertension duration, diabetes mellitus, uric acid, LDL‐C, and BMI [3, 4, 5]. To explore robustness across clinically relevant strata, multivariable Cox subgroup analyses were conducted. Restricted cubic splines (RCS) with knots at the 5th, 35th, 65th, and 95th percentiles evaluated potential non‐linear associations between TyG‐BMI and the risk of developing TOD, following Harrell's recommendations [20]. All statistical tests were two‐sided, and p < 0.05 was considered statistically significant.
3. Results
3.1. Baseline Characteristics
Among the 493 enrolled hypertensive patients, 191 experienced TOD during follow‐up. Of these cases, 114 occurred in the high TyG‐BMI group and 77 in the low TyG‐BMI group. Compared to those with lower TyG‐BMI, individuals in the high TyG‐BMI category had a longer history of hypertension, a higher prevalence of diabetes, and more pronounced metabolic abnormalities, including elevated BMI, triglycerides, FPG, and TyG index, alongside lower HDL‐C (p < 0.05). Despite increased albumin and uric acid levels, the high TyG‐BMI group exhibited a lower LVMI than the low TyG‐BMI group (p < 0.05; Table 1).
TABLE 1.
Clinical characteristics of patients with EH stratified by TyG‐BMI.
| Variables | All (n = 493) | Low TyG‐BMI group (n = 246) | High TyG‐BMI group (n = 247) | p value |
|---|---|---|---|---|
| Female [n (%)] | 232 (47.06%) | 124 (50.41%) | 108 (43.72%) | 0.137 |
| Age (years) | 61.67 ± 11.65 | 62.17 ± 11.97 | 61.15 ± 11.32 | 0.332 |
| Smoking status [n (%)] | 141 (29.61%) | 63 (25.61%) | 78 (31.58%) | 0.143 |
| Drinking [n (%)] | 56 (11.62%) | 32 (13.01%) | 24 (9.72%) | 0.249 |
| FHEOCVD [n (%)] | 289 (58.62%) | 137 (55.69%) | 152 (61.54%) | 0.187 |
| Duration of EH (months) | 3 (0–10) | 2 (0–9) | 5 (0.5–10) | 0.003 |
| Diabetes mellitus [n (%)] | 68 (13.79%) | 21 (8.50%) | 47 (19.11%) | 0.001 |
| BMI (kg/m2) | 24.35 ± 3.02 | 22.33 ± 1.75 | 26.33 ± 2.11 | <0.001 |
| SBP (mmHg) | 150.90 ± 10.94 | 151.1 ± 10.91 | 150.73 ± 11.00 | 0.733 |
| DBP (mmHg) | 84.95 ± 12.04 | 85.45 ± 11.36 | 84.45 ± 12.67 | 0.360 |
| Heart rate (bp) | 72.02 ± 8.94 | 72.20 ± 9.12 | 71.85 ± 8.778 | 0.673 |
| WBC (×103/µL) | 6.10 ± 1.86 | 5.65 ± 1.54 | 6.56 ± 2.04 | <0.001 |
| Hemoglobin (g/dL) | 138.87± 15.00 | 137.79 ± 14.15 | 139.99 ± 15.80 | 0.125 |
| Platelets (×103/µL) | 223.81 ± 57.51 | 221.63 ± 52.77 | 226.06 ± 62.13 | 0.484 |
| TBil (µmol/L) | 14.20 ± 6.16 | 13.89 ± 6.34 | 14.50 ± 5.52 | 0.262 |
| Albumin (g/dL) | 45.21 ± 3.36 | 44.84 ± 3.56 | 45.59 ± 3.11 | 0.049 |
| Uric acid (µmol/L) | 348.17 ± 91.51 | 327.19 ± 83.95 | 369.05 ± 87.52 | <0.001 |
| Creatinine (µmol/L) | 72.69 ± 17.72 | 71.29 ± 16.39 | 74.08 ± 17.66 | 0.070 |
| Total cholesterol (mmol/L) | 4.99 ± 1.11 | 4.93 ± 1.09 | 5.05 ± 1.09 | 0.225 |
| Triglyceride (mmol/L) | 1.53 ± 0.91 | 1.21 ± 0.57 | 1.84 ± 1.08 | <0.001 |
| HDL‐C (mmol/L) | 1.37 ± 0.39 | 1.43 ± 0.42 | 1.32 ± 0.34 | 0.002 |
| LDL‐C (mmol/L) | 3.04 ± 0.98 | 3.02 ± 0.93 | 3.06 ± 0.98 | 0.585 |
| FSG (mmol/L) | 5.75 ± 1.23 | 5.53 ± 1.05 | 5.97 ± 1.35 | <0.001 |
| CIMT (cm) | 0.06 (0.05–0.06) | 0.06 (0.05–0.06) | 0.06 (0.05–0.06) | 0.352 |
| UACR (mg/g) | 6.99 (3.82–13.10) | 6.99 (4.00–12.38) | 6.86 (3.67–13.20) | 0.973 |
| LVMI (g/m2) | 80.51 ± 14.38 | 83.27 ± 13.24 | 77.77 ± 14.81 | <0.001 |
| ACEI/ARBs [n (%)] | 242 (49.09%) | 118 (47.97%) | 124 (50.20%) | 0.620 |
| β‐blockers [n (%)] | 113 (22.92%) | 48 (19.51%) | 65 (26.32%) | 0.072 |
| Calcium channel blockers [n (%)] | 241 (48.88%) | 125 (50.81%) | 116 (46.96%) | 0.393 |
| Diuretics [n (%)] | 144 (29.21%) | 68 (27.64%) | 76 (30.77%) | 0.455 |
| TyG | 8.70 ± 0.55 | 8.48 ± 0.45 | 8.93 ± 0.55 | <0.001 |
| TyG‐BMI | 211.85 ± 28.43 | 188.99 ± 14.16 | 234.63 ± 19.33 | <0.001 |
Note: p values compare the Low and High TyG‐BMI groups.
Abbreviations: ACEI, angiotensin‐converting enzyme inhibitor; ARB, angiotensin II receptor blocker; BMI, body‐mass index; CIMT, carotid intima‐media thickness; DBP, diastolic blood pressure; EH, essential hypertension; FHEOCVD, family history of early‐onset cardiovascular disease; FSG, fasting serum glucose; HDL‐C, high‐density lipoprotein cholesterol; LDL‐C, low‐density lipoprotein cholesterol; LVMI, left ventricular mass index; SBP, systolic blood pressure; TBil, total bilirubin; TyG, triglyceride–glucose index; TyG‐BMI, triglyceride–glucose body mass index; UACR, urinary albumin‐to‐creatinine ratio; WBC, white blood cell count.
3.2. Association Between TyG‐BMI and Risk of TOD
Kaplan–Meier curves indicated a significantly higher cumulative incidence of TOD in the high TyG‐BMI cohort than in the low TyG‐BMI cohort (p < 0.05; Figure 2). In multivariable logistic regression (Table 2), high TyG‐BMI was consistently associated with an increased risk of TOD across all models: the unadjusted model (Model 1: OR = 1.88, 95% CI: 1.30–2.72; p < 0.05), the model adjusted for age and sex (Model 2: adjusted OR = 1.93, 95% CI: 1.32–2.81; p < 0.05), and the fully adjusted model (Model 3: adjusted OR = 1.83, 95% CI: 1.08–3.10; p < 0.05; VIF values are listed in Table S1 and were all <2). LASSO–Cox regression further highlighted age, smoking, and TyG‐BMI as crucial determinants of TOD (Figure 3A). Although triglycerides, FPG, and BMI were entered as candidate predictors, the LASSO penalty shrank each coefficient to zero, excluding them from the final model. Subgroup analyses showed a stronger TyG‐BMI–TOD association in adults aged less than 60 years, subjects with BMI < 24 kg/m2, non‐smokers, and non‐diabetic patients (Figure 3B). RCS revealed a significant non‐linear relationship between TyG‐BMI and TOD risk (p < 0.05; Figure 4).
FIGURE 2.
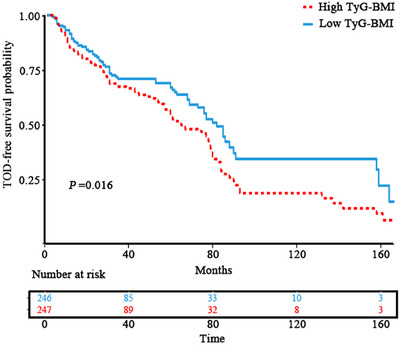
Kaplan–Meier curves for TOD‐free survival stratified by TyG‐BMI. TOD, target organ damage; TyG‐BMI, triglyceride–glucose body mass index.
TABLE 2.
Association between TyG‐BMI and target organ damage quantified by multivariable logistic regression.
| Model 1 | Model 2 | Model 3 | ||||
|---|---|---|---|---|---|---|
| Exposure | OR (95% CI) | p value | aOR (95% CI) | p value | aOR (95% CI) | p value |
| Low TyG‐BMI | Ref. | Ref. | Ref. | |||
| High TyG‐BMI | 1.88 (1.30–2.72) | 0.001 | 1.93 (1.32–2.81) | 0.001 | 1.83 (1.08–3.10) | 0.025 |
Note: TyG‐BMI was treated as a binary variable using the cohort median as the cut‐off. Covariates were selected using the forward conditional selection method. Model 1: unadjusted; Model 2: adjusted for age and sex; Model 3: adjusted for age, sex, duration of hypertension, mean arterial pressure, smoking, white blood cell count, albumin, uric acid, high‐density lipoprotein cholesterol, use of renin–angiotensin system blockers and calcium channel blockers, and left ventricular mass index.
FIGURE 3.
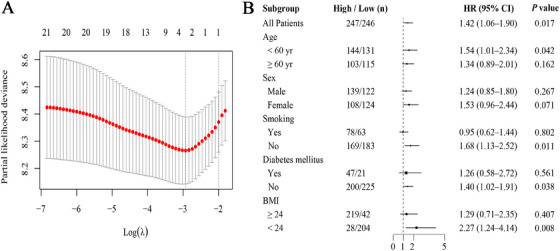
Multivariable selection and subgroup effects for the TyG‐BMI–TOD association. (A) Cross‐validated LASSO‐Cox identifies independent predictors of TOD. (B) Forest plot of hazard ratios for high versus low TyG‐BMI across prespecified subgroups. BMI, body mass index; CI, confidence interval; HR, hazard ratio; LASSO, least absolute shrinkage and selection operator; TOD, target organ damage; TyG‐BMI, triglyceride–glucose body mass index.
FIGURE 4.
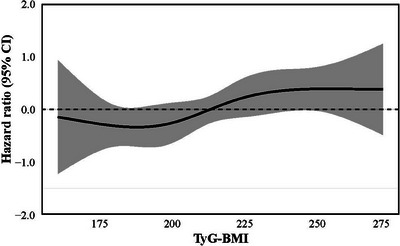
Restricted cubic spline illustrating the nonlinear association between TyG‐BMI and target organ damage. CI, confidence interval; TyG‐BMI, triglyceride–glucose body mass index.
3.3. Application and Validation of TyG‐BMI in TOD Prediction
Based on the variables selected by the LASSO–Cox model, we developed a nomogram to estimate TOD risk in patients with EH (Figure 5A). The resulting model yielded a C‐index of 0.68 (95% CI: 0.64–0.72), indicating acceptable discrimination. Similarly, ROC analysis showed satisfactory accuracy at 1, 3, and 5 years, with AUCs of 0.70 (95% CI: 0.66–0.74), 0.68 (95% CI: 0.64–0.72), and 0.71 (95% CI: 0.67–0.75), all comparable to those of the traditional model (p > 0.05; Figure 5C–E). Calibration plots further demonstrated close agreement between predicted and observed outcomes (Figure 5B). In terms of clinical utility, DCA indicated negligible differences in net benefit between the two models (p > 0.05; Figure 5F–H).
FIGURE 5.
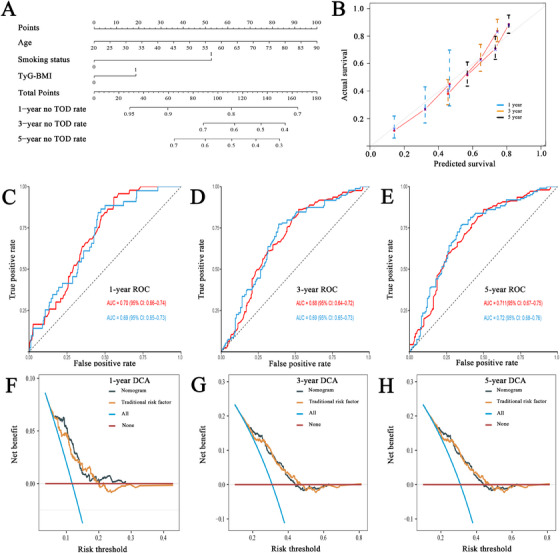
TyG‐BMI–based model for predicting TOD in essential hypertension. (A) Nomogram derived from LASSO‐Cox selected variables. (B) Calibration plot comparing predicted and observed 1‐, 3‐, and 5‐year risks. (C–E) Time‐dependent ROC curves at 1, 3, and 5 years. (F–H) DCA contrasting the TyG‐BMI model with a traditional risk factor model. AUC, area under the curve; CI, confidence interval; DCA, decision curve analysis; ROC, receiver operating characteristic; TOD, target organ damage; TyG‐BMI, triglyceride–glucose body mass index.
4. Discussion
This study investigated the relationship between TyG‐BMI and TOD in patients with EH. We found that a higher baseline TyG‐BMI significantly increased the risk of TOD during follow‐up and served as an independent predictor. Patients with high TyG‐BMI exhibited a markedly higher cumulative incidence of TOD than those with low TyG‐BMI. Building on this, LASSO–Cox regression identified TyG‐BMI as a key prognostic variable, underscoring its predictive superiority. The TyG‑BMI‑based model displayed solid discrimination, calibration, and net clinical benefit in internal validation, performing comparably to the conventional multifactorial model. Subgroup analyses revealed enhanced predictive power in younger adults, those with BMI < 24 kg/m2, non‐diabetics, and non‐smokers.
Our results corroborate an independent association between elevated baseline TyG‐BMI and a higher risk of subsequent TOD in patients with EH. Although direct evidence in EH is limited, prior investigations offer indirect support. In community‐based cohorts, TyG‐BMI correlates closely with incident hypertension. For instance, in 2561 middle‐aged and older adults, higher TyG‐BMI was linked to incident hypertension and higher systolic and diastolic BP [7]. Data from the National Health and Nutrition Examination Survey showed that each 10‐unit rise in TyG‐BMI raised hypertension risk by 4.3% [8]. Among 8231 stroke‐free older adults, combining TyG with BMI improved stroke prediction by 3.3% versus either metric alone [9]. Collectively, these findings suggest that TyG‐BMI anticipates both the development and trajectory of hypertension in the general population. Beyond hypertension, TyG‐BMI displays a non‐linear positive association with incident diabetes [11] and correlates with renal impairment and atherosclerotic risk in diabetes [10, 21]. Baseline TyG‐BMI has a U‐shaped relationship with all‐cause and cardiovascular mortality in diabetics [22], underscoring its complex impact. Within hypertensive populations, the TyG index itself correlates positively with markers of TOD—including LVMI, CIMT, β₂‐microglobulin, and cystatin‐C—and with overt cardiovascular events [23, 24, 25, 26]. Building on this body of work, our study expands the existing evidence by establishing a significant, threshold‐dependent association between baseline TyG‐BMI and TOD in a well‐characterized EH cohort. The risk of TOD rose sharply once TyG‐BMI exceeded a critical threshold, suggesting its potential utility for refined early risk stratification.
TyG‐BMI, computed from triglycerides, FPG, and BMI, reflects hyperglycemia, hypertriglyceridemia, and obesity, acting as a convenient surrogate for IR and overall adiposity [7, 8, 9]. Chronic IR drives hyperinsulinemia, which in turn induces endothelial dysfunction, sympathetic overactivity, and renin–angiotensin–aldosterone system overstimulation, leading to vasoconstriction, sodium and water retention, and inflammation that accelerate EH‐related TOD [12, 13, 27]. Concurrently, obesity contributes both mechanical stress and adipokine‐mediated low‐grade inflammation, which synergize with IR to exacerbate these pathophysiological processes [14]. Accordingly, an elevated TyG‐BMI functions as a comprehensive integrative marker of metabolic derangement that synergistically drives atherosclerosis, microvascular remodeling, and cardiac hypertrophy, thereby identifying hypertensive patients at markedly heightened risk of TOD [28]. Our data support this mechanism and confirm the composite marker's superiority. In the LASSO–Cox regression, none of the individual constituents—triglycerides, FPG, or BMI—retained a non‐zero coefficient once TyG‐BMI was included, indicating that the composite index encapsulates prognostic information unattainable by single indicators. By integrating three convergent metabolic axes into one dimensionless score, TyG‐BMI amplifies signal‐to‐noise, mitigates multicollinearity, and provides a parsimonious yet biologically coherent proxy for the “metabolic triad” driving hypertensive organ damage. Clinically, it utilizes routine laboratory parameters, requires no specialized testing, and thus offers a cost‐effective tool for early, mechanism‐informed risk stratification and targeted intervention in hypertension.
The TyG‐BMI model demonstrated moderate discriminatory performance, as evidenced by adequate C‐index and AUC values. Calibration plots showed reasonable concordance between predicted and observed risks, and DCA further validated its clinical utility across relevant thresholds. Moreover, its predictive accuracy was comparable to that of the conventional risk‐factor model. Notably, conventional models typically rely on a broad array of clinical and laboratory variables [5, 6], whereas the TyG‐BMI model requires only height, weight, and routinely measured fasting glucose and lipid parameters. This simplicity translates into greater feasibility for implementation, particularly in large‐scale metabolic screening or resource‐limited settings [7, 8, 9]. Given these advantages, the TyG‐BMI model offers clinicians a straightforward tool to identify metabolically high‐risk hypertensive patients early and enables targeted monitoring and intervention to prevent TOD.
Subgroup analyses indicated that the prognostic utility of TyG‐BMI varied across baseline risk strata. The association was more pronounced among younger adults, individuals with normal BMI, non‐diabetics, and non‐smokers. These patterns suggest that TyG‐BMI adds sensitive risk information when conventional factors are minimal. In younger patients, chronological age alone does not account for the observed variation in TOD risk. Instead, early metabolic imbalance is the pivotal driver, making TyG‐BMI useful for detecting latent IR and dyslipidemia [29]. In non‐obese patients, a high TyG‐BMI indicates metabolic obesity or covert IR, unveiling seemingly low‐risk yet truly high‐risk subjects. In universally obese cohorts, its stratifying power is limited by a ceiling effect [30]. Likewise, because diabetics already exhibit glucose dysregulation, TyG‐BMI adds little, whereas it clearly stratifies metabolic burden in non‐diabetics [31]. Smoking‐related inflammation and IR load may mask TyG‐BMI's independent effect, explaining its better discrimination in non‐smokers [4, 32]. Consequently, TyG‐BMI is most valuable for hypertensive patients with low conventional risk but subclinical metabolic derangements. Early intervention targeting IR and weight control in this subgroup may reduce future TOD.
Several limitations merit discussion. First, the single‐center retrospective design limits control of residual confounding and weakens causal inference. Second, the modest sample size and single‐source cohort may cause selection and information bias, reducing robustness. Third, the use of a composite endpoint encompassing cardiac, renal, and carotid TOD increased statistical power but introduced heterogeneity. Fourth, the model received only internal validation and awaits external confirmation. Fifth, as all participants were Chinese adults, differences in genetic background and metabolic profiles may limit the generalizability of the findings to other populations. Future studies should use multicenter, prospective, large‐scale, multi‐ethnic designs—ideally interventional or randomized—to validate these findings and strengthen external validity and causality.
5. Conclusions
In summary, this study is the first to evaluate the independent association between TyG‐BMI and TOD using a prognostic model in patients with EH, and demonstrates that this simple index performs comparably to conventional risk‐factor models. Owing to its simplicity, affordability, and ability to capture both IR and obesity, TyG‐BMI could facilitate early identification of metabolically burdened individuals with hypertension, thereby providing a practical tool for personalized risk stratification and targeted intervention.
Author Contributions
Junnan Ye, Xiaodong Huang: conceptualization, investigation, data curation, formal analysis, writing – original draft, visualization. Xiaodong Huang, Siyao Liu, Zhihong Xu, Mandong Pan, Jiyan Lin: investigation, data curation, funding acquisition. Liangdi Xie: conceptualization, methodology, funding acquisition, supervision, project administration, validation, writing – review & editing.
Ethics Statement
This study was approved by the Chinese Clinical Trial Registration Register and approved by the Ethics Committee of First Affiliated Hospital of Fujian Medical University (Approval No. MRCTA, ECFAH of FMU [2020]306). All methods were carried out in accordance with the national ethical principles of Good Clinical Practice, Declaration of Helsinki, and Ethical Review Methods for Biomedical Research on Human Beings.
Conflicts of Interest
The authors declare no competing interests.
Supporting information
Supplementary Table S1. VIFs for covariates in the multivariable model.
Acknowledgments
The authors appreciate the help of Yihua Shen, Tingting Zhou, Xiaoqi Cai, Heling Huang, Didi Huang, and all the participants in this study.
Xiaodong Huang and Junnan Ye contributed equally to this work and share first authorship.
Trial Registration Registration number: ChiCTR2000039448
Funding: This work was supported by the Xiamen Municipal Healthcare Guidance Program (Grant No. 3502Z20244ZD1049), the Rui E Emergency Medicine Research Foundation (Grant No. PUMF01010010‐2024‐01), and the Fujian University of Traditional Chinese Medicine School Project (Grant No. XB2024200).
Data Availability Statement
The datasets generated and analyzed during the current study are not publicly available due to privacy or ethical restrictions but are available from the corresponding author on reasonable request. The data were drawn from the Hypertension Target Organ Damage and Its Risk Factors – Fuzhou Study database.
References
- 1. Zhang W., Zhang S., Deng Y., et al., “Trial of Intensive Blood Pressure Control in Older Patients With Hypertension,” New England Journal of Medicine 385, no. 14 (2021): 1268–1279. [DOI] [PubMed] [Google Scholar]
- 2. Cai Z., Gong Z., Li Z., Li L., and Kong W., “Vascular Extracellular Matrix Remodeling and Hypertension,” Antioxid Redox Signaling 34, no. 10 (2021): 765–783. [DOI] [PubMed] [Google Scholar]
- 3. Wong N. D. and Sattar N., “Cardiovascular Risk in Diabetes Mellitus: Epidemiology, Assessment and Prevention,” Nature Reviews Cardiology 20, no. 10 (2023): 685–695. [DOI] [PubMed] [Google Scholar]
- 4. Magnussen C., Alegre‐Diaz J., and Al‐Nasser L. A., “Global Effect of Cardiovascular Risk Factors on Lifetime Estimates,” New England Journal of Medicine 393, no. 2 (2025): 125–138, 10.1056/NEJMoa2415879. [DOI] [PubMed] [Google Scholar]
- 5. Huang X. D., Lin J. Y., Huang X. W., Zhou T. T., and Xie L. D., “A Nomogram Based on Endothelial Function and Conventional Risk Factors Predicts Coronary Artery Disease in Hypertensives,” BMC Cardiovascular Disorders 23, no. 1 (2023): 217. [DOI] [PMC free article] [PubMed] [Google Scholar]
- 6. Andersson C., Johnson A. D., Benjamin E. J., Levy D., and Vasan R. S., “70‐Year Legacy of the Framingham Heart Study,” Nature Reviews Cardiology 16, no. 11 (2019): 687–698. [DOI] [PubMed] [Google Scholar]
- 7. Yan J., Zhang M. Z., and He Q. Q., “Association of Changes and Cumulative Measures of Triglyceride‐Glucose Index–Body Mass Index With Hypertension Risk: A Prospective Cohort Study,” BMC Public Health 24, no. 1 (2024): 2652. [DOI] [PMC free article] [PubMed] [Google Scholar]
- 8. Zhao L., Zheng L., Wang R., et al., “Association Between Triglyceride‐Glucose Combined With Body Mass Index and Hypertension in the NHANES 2017–2020,” Scientific Reports 15, no. 1 (2025): 9092. [DOI] [PMC free article] [PubMed] [Google Scholar]
- 9. Huo R. R., Liao Q., Zhai L., et al., “Interacting and Joint Effects of Triglyceride‐Glucose Index and Body Mass Index on Stroke Risk and the Mediating Role of TyG in Middle‐Aged and Older Chinese Adults: A Nationwide Prospective Cohort Study,” Cardiovascular Diabetology 23, no. 1 (2024): 30. [DOI] [PMC free article] [PubMed] [Google Scholar]
- 10. Zheng D., Cai J., Xu S., Jiang S., Li C., and Wang B., “The Association of Triglyceride‐Glucose Index and Combined Obesity Indicators With Chest Pain and Risk of Cardiovascular Disease in the American Population With Pre‐Diabetes or Diabetes,” Frontiers in Endocrinology 15 (2024): 1471535. [DOI] [PMC free article] [PubMed] [Google Scholar]
- 11. Qiao Q., Liang K., Wang C., et al., “J‐Shaped Association of the Triglyceride‐Glucose Body Mass Index With New‐Onset Diabetes,” Scientific Reports 14, no. 1 (2024): 13882. [DOI] [PMC free article] [PubMed] [Google Scholar]
- 12. Li Y., Liu Y., Liu S., et al., “Diabetic Vascular Diseases: Molecular Mechanisms and Therapeutic Strategies,” Signal Transduction and Targeted Therapy 8, no. 1 (2023): 152. [DOI] [PMC free article] [PubMed] [Google Scholar]
- 13. Khoi C. S., Lin T. Y., and Chiang C. K., “Targeting Insulin Resistance, Reactive Oxygen Species, Inflammation, Programmed Cell Death, ER Stress, and Mitochondrial Dysfunction for the Therapeutic Prevention of Free Fatty Acid‐Induced Vascular Endothelial Lipotoxicity,” Antioxidants 13, no. 12 (2024): 1486. [DOI] [PMC free article] [PubMed] [Google Scholar]
- 14. Saltiel A. R. and Olefsky J. M., “Inflammatory Mechanisms Linking Obesity and Metabolic Disease,” Journal of Clinical Investigation 127, no. 1 (2017): 1–4. [DOI] [PMC free article] [PubMed] [Google Scholar]
- 15. Huang X. D., Huang X. W., Pan M. D., Lin J. Y., and Xie L. D., “Effect of Early Endothelial Function Improvement on Subclinical Target Organ Damage in Hypertensives,” Scientific Reports 14, no. 1 (2024): 16078. [DOI] [PMC free article] [PubMed] [Google Scholar]
- 16. Huang X. D., Lin J. Y., Zhou T. T., Cai X. Q., and Xie L. D., “A Nomogram Based on Flow‐Mediated Dilation for Predicting Subclinical Target Organ Damage in Hypertensives,” Chinese Journal of Hypertension 31, no. 10 (2023): 937–944. [Google Scholar]
- 17. Joint Committee for Guideline Revision , “2018 Chinese Guidelines for Prevention and Treatment of Hypertension—A Report of the Revision Committee of Chinese Guidelines for Prevention and Treatment of Hypertension,” Journal of Geriatric Cardiology 16 (2019): 182–241. [DOI] [PMC free article] [PubMed] [Google Scholar]
- 18. Zhang L. Y., Li J. H., Shen Y. H., Xu G. Y., Han Y., and Xie L. D., “The Relationship Between Carotid Structural Abnormality and Arterial Stiffness in Patients With Prehypertension,” Chinese Journal of Hypertension 28, no. 12 (2020): 1179–1185. [Google Scholar]
- 19. Ye C., Wang T., Gong J., et al., “Development of a Nomogram for Screening the Risk of Left Ventricular Hypertrophy in Chinese Hypertensive Patients,” Journal of Clinical Hypertension 23, no. 6 (2021): 1176–1185. [DOI] [PMC free article] [PubMed] [Google Scholar]
- 20. Harrell F. E. Jr, Lee K. L., and Pollock B. G., “Regression Models in Clinical Studies: Determining Relationships Between Predictors and Response,” JNCI: Journal of the National Cancer Institute 80, no. 15 (1988): 1198–1202. [DOI] [PubMed] [Google Scholar]
- 21. Huang N., Lu B., Zhu Z. Z., et al., “Association Between Triglyceride‐Glucose Body Mass Index and Kidney Impairment in Patients With Type 2 Diabetes Mellitus,” Diabetes, Metabolic Syndrome and Obesity: Targets and Therapy 17 (2024): 3447–3453. [DOI] [PMC free article] [PubMed] [Google Scholar]
- 22. Xiao S., Zhang Q., Yang H. Y., Tong J. Y., and Yang R. Q., “Association Between Triglyceride‐Glucose Body Mass Index and All‐Cause and Cardiovascular Mortality in Diabetic Patients: A Retrospective Study From the NHANES Database,” Scientific Reports 14, no. 1 (2024): 13884. [DOI] [PMC free article] [PubMed] [Google Scholar]
- 23. Liu C., Chen X., and Zheng S., “PS‐P13‐2: Association Between Triglyceride‐Glucose Index and Target Organ Damage in Hypertensive Patients,” Journal of Hypertension 41, Suppl no. 1 (2023): e495. [Google Scholar]
- 24. Inan O., Sahiner E. S., and Ates I., “The Role of Triglyceride‐Glucose Index in Determining Subclinical Atherosclerosis in Patients With Primary Hypertension,” European Review for Medical and Pharmacological Sciences 26 (2022): 7125–7134. [DOI] [PubMed] [Google Scholar]
- 25. Dong J., Yang H., Zhang Y., Chen L., and Hu Q., “High Triglyceride‐Glucose Index Is Associated With Early Renal Impairment in Hypertensive Patients,” Frontiers in Endocrinology 13 (2022): 1038758. [DOI] [PMC free article] [PubMed] [Google Scholar]
- 26. Wang J., Huang X., Fu C., Sheng Q., and Liu P., “Association Between Triglyceride‐Glucose Index, Coronary Artery Calcification and Multivessel Coronary Disease in Chinese Patients With Acute Coronary Syndrome,” Cardiovascular Diabetology 21, no. 1 (2022): 187. [DOI] [PMC free article] [PubMed] [Google Scholar]
- 27. Lee D. H., Park J. E., Kim S. Y., Jeon H. J., and Park J. H., “Association Between the Triglyceride‐Glucose Index and Increased Blood Pressure in Normotensive Subjects: A Population‐Based Study,” Diabetology & Metabolic Syndrome 14, no. 1 (2022): 161. [DOI] [PMC free article] [PubMed] [Google Scholar]
- 28. Zheng Y., Yin G., Chen F., Lin L., and Chen Y., “Evaluation of Triglyceride‐Glucose Index and HOMA‐IR in Patients With Polycystic Ovary Syndrome,” International Journal of Women's Health 14 (2022): 1821–1829. [DOI] [PMC free article] [PubMed] [Google Scholar]
- 29. Buford T. W., “Hypertension and Aging,” Ageing Research Reviews 26 (2016): 96–111. [DOI] [PMC free article] [PubMed] [Google Scholar]
- 30. Zeng Z., Liu S., Xu H., Xu X., Liu X., and Zhao X., “Association of Triglyceride‐Glucose Index and Its Combination With Obesity Indices With Prehypertension in Lean Individuals: A Cross‐Sectional Study of Chinese Adults,” Journal of Clinical Hypertension 22, no. 6 (2020): 1025–1032. [DOI] [PMC free article] [PubMed] [Google Scholar]
- 31. Wu J., Lin X., Yin X., et al., “Comparison of Incidence of Metabolic Syndrome and Five Obesity‐ and Lipid‐Linked Indicators for Predicting Metabolic Syndrome Among Normal‐Weight and Overweight Adults,” Diabetes, Metabolic Syndrome and Obesity: Targets and Therapy 17 (2024): 3509–3520. [DOI] [PMC free article] [PubMed] [Google Scholar]
- 32. King C. C., Piper M. E., Gepner A. D., Fiore M. C., Baker T. B., and Stein J. H., “Longitudinal Impact of Smoking and Smoking Cessation on Inflammatory Markers of Cardiovascular Disease Risk,” Arteriosclerosis, Thrombosis, and Vascular Biology 37, no. 2 (2017): 374–379. [DOI] [PMC free article] [PubMed] [Google Scholar]
Associated Data
This section collects any data citations, data availability statements, or supplementary materials included in this article.
Supplementary Materials
Supplementary Table S1. VIFs for covariates in the multivariable model.
Data Availability Statement
The datasets generated and analyzed during the current study are not publicly available due to privacy or ethical restrictions but are available from the corresponding author on reasonable request. The data were drawn from the Hypertension Target Organ Damage and Its Risk Factors – Fuzhou Study database.