Abstract
We have studied the femtosecond hydration dynamics of Monellin, a protein with a single tryptophan residue at its surface. Tryptophan was selectively used as a probe of the dynamics, and through monitoring of its fluorescence Stokes shift with time we obtained the hydration correlation function, which decays due to rotational and translational motions of water at the protein surface and in bulk. The decay exhibits a “bimodal” behavior with time constants of 1.3 and 16 ps, mirroring relaxation of the free/quasifree water molecules and surface-bound water layer (minimum binding energy of 1–2 kcal/mol). The observed slow decay of 16 ps for tryptophan in the native protein differs by more than an order of magnitude from that of bulk water because of the dynamical exchange in the layer. To examine the effect of unfolding, we also studied hydration dynamics when Monellin was denatured in a 6 M guanidine hydrochloride solution and obtained a totally different behavior: 3.5 and 56 ps. Comparing with the results of experiments on free tryptophan in the same concentration of the denaturing solution, we conclude that the fast component of 3.5 ps comes from bulk-type solvation in the 6 M guanidine hydrochloride. However, the absence of the 16-ps decay and appearance of the 56-ps component reflects a more “rigid solvation,” which is likely to involve the motions of the protein backbone in the random-coiled state. With the help of polymer theory, this time scale is reproduced in agreement with experimental observations.
Water at the surface of a protein defines a molecular layer that has been termed “biological water” and exhibits unique characteristics. The structure and dynamics of such layers, which are determined by the hydrophobic and hydrophilic interactions with the residues exposed to the water in the folded state, are important for the stability of proteins as well as for the mechanisms of protein–protein and protein–ligand association (1). For example, the energetics and dynamics of water desolvation have been suggested to be a determining factor in the process of protein–ligand recognition (2). In molecular dynamics simulations, water molecules have been found to mediate or bridge the interaction between DNA and proteins through their hydrogen bonding (3).
In a recent communication (4), we described how the ultrafast Stokes shift of the fluorescence from a single tryptophan amino acid (Trp) at the surface of a protein can be used to probe the dynamics of the biological water layer. Briefly, we use a femtosecond UV pulse to selectively excite the indole chromophore of the Trp residue situated at the protein surface. Although the initial excitation might involve two overlapping transitions for the indole chromophore (1La and 1Lb), it has been demonstrated that any electronic mixing that leads to the 1La fluorescing state occurs in under 100 fs (5, 6); the 1La state of Trp has a significantly larger dipole moment than the ground state. Subsequent to the formation of this dipole by femtosecond excitation, the water molecules in the vicinity of the chromophore undergo a structural rearrangement toward a new free energy. The dynamics of this solvation process is mirrored in a dynamical shift of Trp's fluorescence spectrum (Stokes shift) and can be observed through the use of the frequency up-conversion technique with femtosecond resolution.
In our previous publication, we described how the hydration dynamics at the surface of the single-Trp protein Subtilisin Carlsberg occurs on two well separated time scales: 800 fs and 38 ps (4). These results elucidated that the water relaxation at the surface of the protein is dominated by two different types of trajectories: those ultrafast in nature and arising from water molecules that are free or quasifree and see little interaction with the protein surface at the moment of the femtosecond excitation (bulk-type solvation), and those which are slower, from bound water molecules, i.e., from those water molecules that interact strongly with hydration sites. As derived by Pal et al. (7), hydration time is directly related to the average residence time at the site.
In this paper, we report observations made on a different protein, Monellin, both in its native and denatured state. For the native state, we found that the picture of dynamically ordered water is robust, but the exchange with the bulk has a different time scale, 16 instead of 38 ps for Subtilisin Carlsberg; the bulk-type hydration occurs in 1.3 ps. This protein Monellin, which like Subtilisin Carlsberg contains a single water-exposed Trp, is a sweet-tasting protein originally isolated from the berries of the plant Dioscoreophyllum cumminsii (8, 9). On a molar basis, the protein is ≈50,000 times sweeter than sucrose and has been the subject of numerous studies aimed at understanding the mechanism of taste (10, 11).
Monellin consists of two polypeptide chains associated by interchain hydrogen bonding and hydrophobic interactions (12, 13). Chain A contains 45 residues, and chain B has 50 residues including a single Trp at position 3 from the N terminus. Although the crystal structure from the Protein Data Bank (PDB, ID code ) shows Monellin as a dimer, the characterization of this protein by electrophoresis and gel filtration showed that it exists as a monomer in solution (9). Further indication that Monellin is a monomer comes from comparisons with the protein Single-Chain Monellin (SCM), which has been shown to be in the monomer state by NMR (14); SCM is an analog of Monellin engineered by fusing the two chains in Monellin.
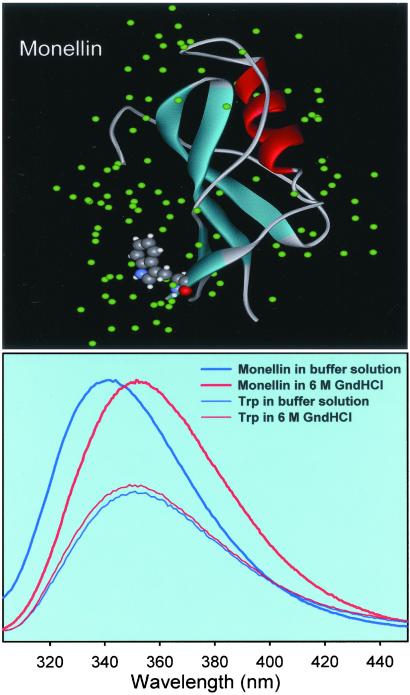
The structures of SCM and Monellin can be superimposed (13) and also show the same fluorescence spectrum, demonstrating that the Trp residue is in the same environment (15). In Fig. 1 Upper we have removed one of the two Monellin proteins from the PDB file and the associated crystal waters to display only a monomer structure with water in the crystal. As can be seen in this figure, the Trp moiety for this protein is significantly exposed to the solvent environment, and therefore the Stokes shift of its fluorescence with time can be used to study the dynamics of its hydration layer. The effect of the internal charges of the protein on the equilibrium spectral shift has been deduced using molecular dynamics methods by Vivian and Callis (16), and NMR studies (17) have given a time scale for hydration of more than 300 ps for a very similar Monellin-type protein. As discussed below, our resolution of 1.3 and 16 ps bimodality gives the full dynamics of the layer from the earliest times (bulk type) to the longest time measured (rigid water) and not the near static water in the structure, which has very long residence times.
Fig 1.
(Upper) X-ray crystal structure of the protein Monellin. The structure was downloaded from the PDB (ID code ) and processed with the program WEBLAB-VIEWERLITE to show only one of the monomers. In solution, Monellin exists as a monomer (9, 14). (Lower) Steady-state fluorescence spectra of 100 μM Monellin in a 0.1 M phosphate buffer (native state) and in a 6 M Gdn⋅HCl solution (denatured state). Also, we include fluorescence spectra of Trp in solution of the same concentration. The excitation wavelength was 295 nm.
Experimental Procedures
Up-Conversion.
The femtosecond fluorescence up-conversion setup used in these experiments is based on a double-pass β-barium-borate optical parametric amplifier pumped by a 1-kHz regeneratively amplified Ti:sapphire laser to generate near-IR pulses. The idler beam from the amplifier was sum-frequency-mixed in another β-barium-borate crystal with the laser fundamental to obtain pulses in the visible region. The visible pulses (≈600 nm) were sent through a prism sequence to compensate for the pulse dispersion. UV excitation pulses were obtained from second harmonic generation of the visible pulses in a third β-barium-borate crystal. The excitation pulses are easily tunable in the range of 280–305 nm with an intensity of ≈200 nJ. This beam then was sent into a rotating circular cell of 0.6-mm thickness containing the sample. The resulting emission was collected and refocused with a pair of parabolic mirrors.
Sum-frequency mixing with gate pulses from the laser fundamental at 800 nm was made in a noncollinear configuration in a 0.3-mm β-barium-borate crystal. The polarization of the excitation beam was set to the magic angle (54.7°) with respect to the acceptance axis of the up-conversion crystal (vertical) while the gate beam's polarization was set parallel to this axis using half-wave plates. The resulting deep-UV signal was isolated with a double-grating monochromator and detected with a photomultiplier tube. The response time in this noncollinear geometry is between 400 and 500 fs as determined from the up-conversion of Raman scattering by water in the range of 320–330 nm and from the analysis of the rise time of the up-conversion signals of a solution of biphenyl carboxylic acid in methanol or of 2-aminopurine in ethanol; a shorter response time of up to 200 fs has been obtained in this laboratory by using collinear arrangement (18).
Samples.
Trp, guanidine hydrochloride (Gdn⋅HCl), and the protein Monellin were purchased from Sigma–Aldrich and used without further purification. The purity of Monellin in the lyophilized powder form was 94% from SDS electrophoresis according to the supplier. The solutions were prepared in a 0.1 M phosphate buffer at pH 7.2 using water from a Nanopure (Dubuque, IA) system. The Monellin solutions were passed through a 0.45-μm (mesh) acrodisk filter to remove insoluble particles from the solution. All experiments were made at room temperature. The preparation of the Monellin solution in 6 M Gdn⋅HCl was made ≈1 day before the experiments to assure complete denaturation. We took absorption, fluorescence, and excitation spectra, and all are consistent with those of Monellin: of course the taste was very sweet!
Results and Discussion
Steady-State Spectroscopy.
The steady-state fluorescence spectra of a 100 μM solution of Monellin in buffer (native state) and in 6 M Gdn⋅HCl solution (denatured) are shown in Fig. 1 Lower for an excitation wavelength of 295 nm. The fluorescence of the protein solution has its maximum at 342 nm, in agreement with previous reports (19, 20). The fluorescence spectrum is practically unaltered for excitation wavelengths between 290 and 300 nm. The protein solution prepared in 6 M Gdn⋅HCl shows a significant red shift to 352 nm. This change is associated with the denaturation of the protein, leading to a randomization of the structure and probably a larger extent of Trp exposure to other residues/solvent. This shift upon denaturation has been reported previously (19). The fluorescence spectrum from a 6 mM solution of Trp in 6 M Gdn⋅HCl does not show significant differences with respect to the Trp solution in the buffer. These spectra are also included in Fig. 1 Lower.
Dynamics: Folded Monellin.
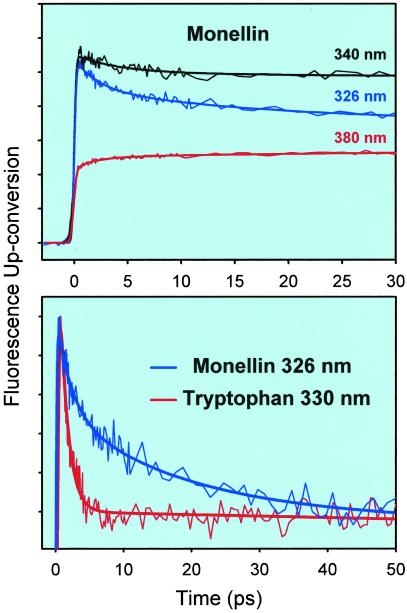
Fig. 2 Upper shows femtosecond-resolved fluorescence transients at three representative wavelengths for a 100 μM solution of Monellin in a 0.1 M phosphate buffer. A total of eight fluorescence wavelengths were examined ranging from 320 to 380 nm. To avoid the up-conversion of Raman scattering by water at Δν ≈ 3,400 cm−1, the excitation pulses were tuned in the range of 290–300 nm depending on the particular fluorescence wavelength. In this range, the excitation of the tyrosine residues of Monellin is minimal as verified by the steady-state studies. Also, we note that the excess vibrational energy in the Trp chromophore is not significant since the 0–0 transition for Trp lies at ≈295 nm (5).
Fig 2.
(Upper) Femtosecond-resolved fluorescence up-conversion traces from a solution of Monellin in a 0.1 M phosphate buffer at three fluorescence wavelengths. (Lower) Comparison of the normalized decays of the up-conversion signals for native Monellin at 326 nm and Trp at 330 nm in a 0.1 M phosphate buffer. In this plot, the long-time part of the signals was subtracted, and the remaining part was normalized for comparison.
The transients in Fig. 2 Upper are typical of solvation dynamics. On the blue edge of the spectrum the signals decay on different time scales depending on wavelength, while on the red edge the signal is seen to rise. In Fig. 2 Lower we compare the decays obtained at 326 nm in Monellin with the 330-nm decay from a solution of Trp, keeping similar difference from the corresponding equilibrium fluorescence maximum; Monellin at 330 nm is even slower (see below). The data in this figure are the result of subtracting the long decay component from the traces and of normalizing the remaining part. This procedure permits a direct comparison of the time scales on which the transients decay to their long time values and exhibit solvation effect at a single wavelength. As can be seen, the decay in Trp occurs in ≈1.2 ps, while for Monellin the signal decays with two longer time constants: ≈2 (50%) and ≈16 (50%) ps.
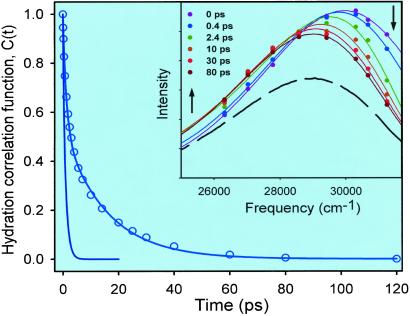
To construct time-resolved spectra, the up-conversion data were fitted to a sum of exponentials. In the fits, one of the time constants was set to 2.1 ns, which is the average lifetime of Monellin's fluorescence, taken from a previous lifetime measurement (21). The multiexponential decays from the fits were normalized by the factors F(ν)/Σai⋅τi, where F(ν) is the steady-state fluorescence intensity, ai are the preexponential factors, and τi are the decay times from the fits. The time-resolved spectra were fit to logarithm-normal functions to obtain the fluorescence peak at each delay time. The solvent response function or hydration correlation function C(t) = [ν(t) − ν(∞)]/[ν(0) − ν(∞)] is shown in Fig. 3, and the spectral evolution is displayed in the Inset, where we also include (as a dashed curve) the steady-state spectrum. The value of ν(∞) was taken as the frequency maximum at 120 ps. We note that for this system, the spectral evolution occurs within the first 80 ps.
Fig 3.
Time-resolved spectra (Inset) and hydration correlation function C(t) for Monellin in a 0.1 M phosphate buffer. The hydration correlation function obtained for free Trp in the same buffer is shown (solid line terminating at 20 ps). (Inset) We include the steady-state spectrum as a dashed curve.
The C(t) function is the sum of two exponentials with time constants of 1.3 (46%) and 16 (54%) ps; any sub-100-fs components in these dynamics are unresolved. The net spectral shift observed is 960 cm−1. In Fig. 3, we also present the solvent response function obtained for free Trp in the buffer (5). This function decays with time constants of 180 fs (20%) and 1.1 ps (80%). Clearly, the hydration dynamics for the Trp site at the surface of Monellin are significantly different from those in bulk water.
Our observation for Monellin is consistent with our previous study of the protein Subtilisin Carlsberg in which we also observed that hydration occurs with bimodality: 800 fs (61%) and 38 ps (39%). The bimodal solvation in Monellin shows that for this protein, the relaxation in the hydration shell near the Trp moiety also occurs through two different types of solvent trajectories: one (1.3 ps) that resembles that of free or quasifree water molecules and one (16 ps) associated with restricted water molecules that interact strongly with hydration sites near the probe.
To ascertain the degree of orientational rigidity of the Trp residue in Monellin, we obtained the fluorescence anisotropy decay at the wavelength of 370 nm for an excitation wavelength of 297 nm. For this, we took up-conversion scans with parallel and perpendicular polarizations of the pump beam and obtained the anisotropy as a function of delay time according to r(t) = [I∥(t) − I⊥(t)]/[I∥(t) + 2⋅I⊥(t)]. The anisotropy is observed to decay with a time constant of 32 ps to 63% of its t = 0 value of 0.24 (5, 6). After this time, r(t) remains constant for at least 300 ps (data not shown). The r(0) value we obtained with our excitation wavelength agrees with recent ultrafast anisotropy measurements of Trp and follows the sub-100-fs formation of the fluorescing state 1La (5, 6). The results of the anisotropy measurements indicate that hydration dynamics in Monellin occurs for a probe that is “restricted” in its motion.
The time scales for the two types of hydration trajectories are indicative of the distribution in residence times at the surface. Pal et al. have developed a model that considers the existence of an equilibrium between free or quasifree water molecules and those that are bound in the layer (7). In this model, the water molecules near the chromophore, which interact significantly with the protein surface, are in principle unable to relax in the presence of the instantaneously created dipole. However, the transient nature of hydrogen bonding to the surface allows them to eventually leave the surface. Accordingly, the time scale for this process is dictated by the residence time of the water molecules at the hydration sites of the protein. The free molecules are unrestricted in their rotational and translational motions.
In the limit where the rate for bound to free (kbf) transition is significantly slower than the rate for hydration in bulk water (τ )−1, corresponding to a sufficiently large activation energy separating the bound and the free states, it can be shown that
 |
 |
If the relaxation is bulk-type and there is no effect from the quasifree molecules in the layer, then τfast is determined primarily by the rotational diffusion. Because of the presence of the protein layer, (τfast)−1 has two contributions: one is from the rate of rotational relaxation, and the other is a term weighted by the rate of translational diffusion out of the hydration layer (reciprocal of the residence time for a quasibound molecule):
 |
Here, the rotational relaxation time can be calculated as τrot = (2DR)−1; with DR being the rotational diffusion constant. In bulk water, DR = 2.2 × 10¹¹ s−1 (22), yielding τrot ≈ 2.3 ps. But the long solvation-time constant is approximately half of this value, which is because translational diffusion becomes significant in the nearest neighbor shell (7). In the presence of the layer, free/quasifree molecules will have similar τrot or somewhat longer.
The second term (½L k2)τ
k2)τ contributes to the rate as a result of translational diffusion out of the layer; LH is the hydration layer thickness, and k is a distance parameter (wave-vector) that can be expressed as k = 2π/σ, where σ is the diameter of a water molecule (2.8 Å). τres is the residence time in the layer and can be calculated considering the diffusion of a quasifree molecule in the perpendicular direction of the protein surface. This residence time is given by τres = L
 /6D⊥ where the D⊥ is water's translational diffusion constant in the perpendicular direction from the surface. As an approximation, we can assume D⊥ =
  Dbulk (Dbulk ≈ 2.5 × 10⁻⁵ cm2/sec) (23). These values for rotational and translational contributions give a total solvation time of ≈1 ps, indicating that hydration from unbound (free and quasifree molecules) remains similar to that observed in the bulk.
The slow hydration mode, due to bound water molecules, is given directly by the rate of transition from bound to free states: τslow ≈ k (see above). For the proteins Monellin and Subtilisin Carlsberg, these τslow are the observed 16 and 38 ps, respectively. The effective binding energy determining the respective residence time is estimated to be at a minimum value of 1.2 kcal/mol for Monellin and 2.3 kcal/mol for Subtilisin Carlsberg, taking a potential energy function for the transition from bound to free state to be a double Morse potential. Details of the potential and the calculations are included in ref. 7.
Dynamics: Denatured Monellin.
To study how dynamics depend on the presence of a well defined landscape of hydration sites near the Trp residue, we have studied Monellin in its denatured state. The steady-state emission results for a solution of Monellin in 6 M Gdn⋅HCl show, as discussed above, a shift from 342 to 352 nm, indicative of denaturation. At such Gdn⋅HCl concentration, Monellin can be considered to exist as statistical random coils (21). From the density of the 6 M Gdn⋅HCl solution, we calculate that there is approximately one ion for every three water molecules. To establish how such a large concentration of ions alters solvation in the bulk, we have also studied the dynamics of free Trp in solution of the same concentration.
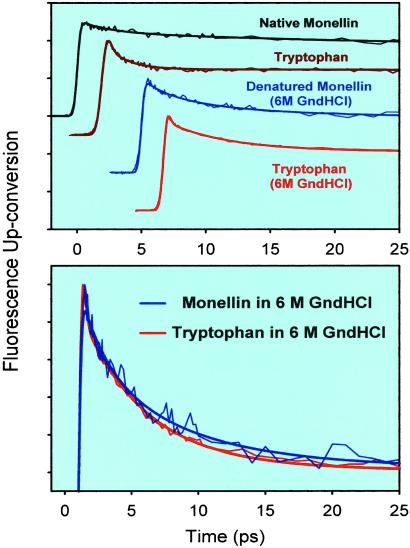
In Fig. 4 Upper, we show the up-conversion signals at 330 nm in the 0.1 M phosphate buffer (native Monellin and free Trp) together with those observed in the 6 M Gdn⋅HCl solution (denatured Monellin and free Trp). As can be seen, in the buffer, the decay at this individual wavelength for native Monellin is slower than for Trp. The results for Monellin (denatured) and Trp in the 6 M Gdn⋅HCl solution are noticeably similar on the time scale of a few picoseconds. This similarity is highlighted in Fig. 4 Lower, where we again have normalized the decaying part of the traces. We also note that the up-conversion signal for Trp in 6 M Gdn⋅HCl shows a much slower decay than for Trp in the buffer.
Fig 4.
(Upper) Up-conversion traces at 330 nm for solutions of Monellin and Trp in a 0.1 M phosphate buffer and in a 6 M Gdn⋅HCl (GndHCl) solution. (Lower) Comparison of the normalized decay portions of the up-conversion signals for Monellin and Trp in Gdn⋅HCl. Note that the time scale in this figure is only up to 25 ps.
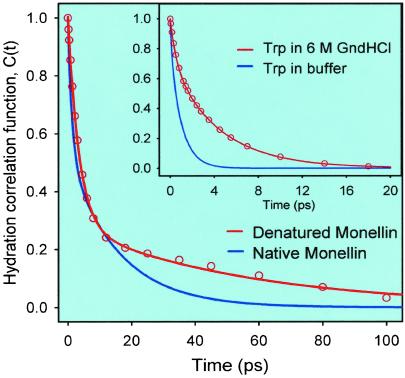
We constructed the hydration correlation function for Monellin (denatured) and Trp in 6 M Gdn⋅HCl following the same methodology described above. These results are presented in Fig. 5 (the results for free Trp are shown in Inset; we also include the corresponding function for bulk Trp and Monellin in the buffer). The hydration correlation function for the Trp/6 M Gdn⋅HCl solution shows a biexponential decay with τ1 = 570 fs (28%) and τ2 = 4.4 ps (72%). These time constants are significantly longer than those observed for Trp in buffer solution without the denaturant [τ1 = 180 fs (20%) and τ2 = 1.1 ps (80%)]. The change indicates that the presence of the ions significantly alters solvation dynamics, and the effect must be taken into account when considering the dynamics for denatured Monellin.
Fig 5.
Correlation functions for denatured Monellin and Trp in a 6 M Gdn⋅HCl solution. For comparison, we also show the corresponding functions for native Monellin and Trp in the buffer.
The C(t) function for denatured Monellin in Fig. 5 can be fitted to a biexponential decay with τ1 = 3.5 ps (72%) and τ2 = 56 ps (28%). The time constant of the fast part of the dynamics (3.5 ps) is increased from the value of 1.3 ps in native Monellin. Also, the contribution of the fast component to the total spectral shift significantly increases from 46 to 72%. Solvation dynamics of Trp in the 6 M Gdn⋅HCl solution occurs on a similar time scale to that of the fast component in denatured Monellin. From this comparison we conclude that the 3.5-ps component is due to bulk-type solvation around the Trp site in the random coil/6 M Gdn⋅HCl. It is important to note that the ≈16-ps component seen in native Monellin is completely absent, indicating that in the denatured state the dynamically ordered hydration layer indeed is disrupted.
Solvation of the Trp/6 M Gdn⋅HCl is significantly faster than the 56-ps decay observed for denatured Monellin. This much slower decay must be inhomogeneous due to “solvation” by ions and water molecules in collapsed pockets and/or to the relaxation of the coiled protein structure around the Trp moiety. In the denatured protein, we expect a large degree of inhomogeneity, which most likely will produce multiple solvation times; therefore, the 56-ps time scale should be taken as an average time, which might include even slower components outside our time window. It should be noted that such inhomogeneity is also reflected in parts of the spectrum that exhibit different probe lifetimes.
A simple model was advanced in ref. 7, which accounts for solvation energy fluctuations that are coupled to the dynamics of a random polymer chain. The model considers the chain's solvation energy time-correlation function to behave as a multiexponential with decay times given by Rouse chain-type homopolymer dynamics. The eigenvalues associated with the chain's normal modes yield time scales that range from ≈10 ps to ≈30 ns for a polymer of similar length to chain B in Monellin (50 units). Accordingly, our 56-ps component is a signature of these fluctuations in the time window (200 ps) scanned. The implication is that the hydration of Trp is directly or indirectly, through its degree of bulk exposure, controlled by the fluctuations of the structure of the random coil.
Conclusion
In summary, the results from two different proteins probed as native structures with a single native Trp amino acid, following an instantaneously created dipole at the surface of a protein, show that hydration has contributions from two types of trajectories: from water molecules that are basically free from interactions with the protein (100s of fs to ≈1 ps) and from those bound and that do interact significantly with surface sites but are in dynamical equilibrium in the layer (20–50 ps; see Fig. 6). The layer thickness was estimated (see ref. 4) to be less than 7 Å. The time scales for these two processes are well separated and can be observed distinctly with femtosecond resolution. This bimodal hydration pattern reflects characteristics of the dynamical ordering of water molecules at the surface.
Fig 6.
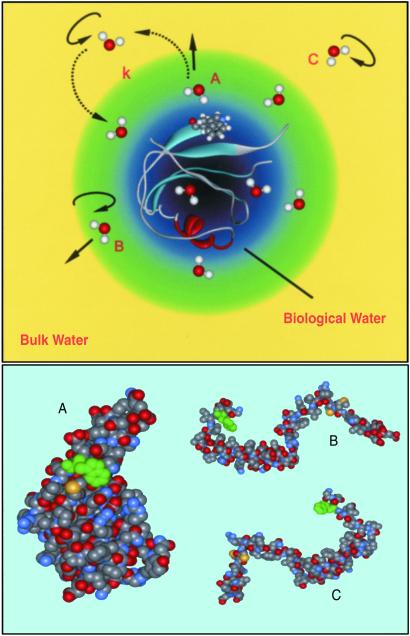
(Upper) Schematic depicting the existence of different types of water molecules associated with different hydration modes (see text). Water type (A) corresponds to molecules bound to the surface. Their dynamical exchange is represented with dashed arrows, and k denotes the exchange rates, kbf and kfb. Water types (B and C) are quasifree and free molecules, respectively, and contribute to hydration through their rotational and/or translational motions. (Lower) Space-filling models of the protein Monellin in its native state (A) and two of the possible denatured random coiled states (B and C); only Monellin's chain B is presented for the coils.
Molecular dynamics simulations (24, 25) of hydration of proteins are, in fact, consistent with the bimodality explained above. Our observed hydration-layer residence times (16 ps for Monellin and 38 ps for Subtilisin Carslberg) are reproduced theoretically for the distribution of binding energies typical of hydrogen bonding. For Monellin, molecular dynamics simulations have considered solvation, manifested in the spectral shifts, by both water and internal residues of the protein (internal Stark effect), and in this case ≈65% is due to the latter (16). However, as pointed out by the authors, a significant amount of the spectral shift due to the internal Stark effect is instantaneous in nature and not dynamical; the observations presented here correspond to a dynamical shift, which for the proteins occurs on the picosecond time scale.
Hydration times of more than 300 ps have been reported by using NMR methods (17). But as we detailed elsewhere (7), such very long times, without observation of the femtosecond early time behavior, reflect the near static water in the structure; resolving the full dynamics gives us the nature of hydration, at femtosecond early times (free/quasifree water) and on the picosecond time scale, on which the exchange between bonded and free water molecules takes place.
In the denatured state of the Monellin protein we found that the dynamics was drastically altered; the decay of the correlation function describing the fluctuations by the solvent and the residues becomes significantly longer, approximately by a factor of 4. We can account for this vast change when we consider polymer theory to describe the randomly coiled peptide chains. In Fig. 6 Lower we show the native structure of Monellin together with two possible random-coil conformations of chain B. From these structures it can be visualized how the presence of a hydration layer would be facilitated by a globular assembly, with its unique hydrophobicity, while for the random coils we expect a distribution of conformations, some of which might acquire hydration but through mediation by the fluctuations of their own structure(s).
The dynamical picture of hydration presented here is relevant to the function of the protein given the time scale and the form of the response. One of the primary processes in Monellin taste function is the recognition of another protein, namely G-protein complex. In this process, desolvation is controlled by the time scale of water in the layer. It is clear now that this time is shorter than the time for diffusion of the protein. Such dynamics make possible an efficient recognition but with the maintenance of the globular structure.
Acknowledgments
We thank Prof. Biman Bagchi for stimulating discussions and fruitful collaboration. This work was supported by the National Science Foundation.
Abbreviations
Gdn⋅HCl, guanidine hydrochloride
References
- 1. (1997) Chem. Rev. (Washington, D.C.) 97, 1231-1734. [Google Scholar]
- 2.Camacho C. J., Weng, Z., Vajda, S. & DeLisi, C. (1999) Biophys. J. 76, 1166-1178. [DOI] [PMC free article] [PubMed] [Google Scholar]
- 3.Reddy C. K., Das, A. & Jayaram, B. (2001) J. Mol. Biol. 314, 619-632. [DOI] [PubMed] [Google Scholar]
- 4.Pal S. K., Peon, J. & Zewail, A. H. (2002) Proc. Natl. Acad. Sci. USA 99, 1763-1768. [DOI] [PMC free article] [PubMed] [Google Scholar]
- 5.Shen X. & Knutson, J. R. (2001) J. Phys. Chem. B 105, 6260-6265. [Google Scholar]
- 6.Zhong D., Pal, S. K., Zhang, D., Chan, S. I. & Zewail, A. H. (2002) Proc. Natl. Acad. Sci. USA 99, 13-18. [DOI] [PMC free article] [PubMed] [Google Scholar]
- 7.Pal, S. K., Peon, J., Bagchi, B. & Zewail, A. H. (2002) J. Phys. Chem. B, in press.
- 8.Morris J. A. & Cagan, R. H. (1972) Biochim. Biophys. Acta 261, 114-122. [DOI] [PubMed] [Google Scholar]
- 9.Morris J. A., Martenson, R., Deibler, G. & Cagan, R. H. (1973) J. Biol. Chem. 248, 534-539. [PubMed] [Google Scholar]
- 10.Cagan R. H. (1973) Science 181, 32-35. [DOI] [PubMed] [Google Scholar]
- 11.Somoza J. R., Cho, J. M. & Kim, S.-H. (1995) Chem. Senses 20, 61-68. [DOI] [PubMed] [Google Scholar]
- 12.Ogata C., Hatada, M., Tomlinson, G., Shin, W. C. & Kim, S. H. (1987) Nature (London) 328, 739-742. [DOI] [PubMed] [Google Scholar]
- 13.Somoza J. R., Jiang, F., Tong, L., Kang, C. H., Cho, J. M. & Kim, S. H. (1993) J. Mol. Biol. 234, 390-404. [DOI] [PubMed] [Google Scholar]
- 14.Lee S.-Y., Lee, J.-H., Chang, H.-J., Cho, J. M., Jung, J.-W. & Lee, W. (1999) Biochemistry 38, 2340-2346. [DOI] [PubMed] [Google Scholar]
- 15.Sung Y.-H., Hong, H.-D., Cheong, C., Kim, J. H., Cho, J. M., Kim, Y.-R. & Lee, W. (2001) J. Biol. Chem. 276, 44229-44238. [DOI] [PubMed] [Google Scholar]
- 16.Vivian J. T. & Callis, P. R. (2001) Biophys. J. 80, 2093-2109. [DOI] [PMC free article] [PubMed] [Google Scholar]
- 17.Niccolai N., Padaccini, R., Scarselli, M., Bernini, A., Crescenzi, O., Spiga, O., Ciutti, A., Di Maro, D., Bracci, L., Dalvit, C. & Temussi, P. A. (2001) Protein Sci. 10, 1498-1507. [DOI] [PMC free article] [PubMed] [Google Scholar]
- 18.Qu X., Wan, C., Becker, H.-C., Zhong, D. & Zewail, A. H. (2001) Proc. Natl. Acad. Sci. USA 98, 14212-14217. [DOI] [PMC free article] [PubMed] [Google Scholar]
- 19.Brand J. G. & Cagan, R. H. (1977) Biochim. Biophys. Acta 493, 178-187. [DOI] [PubMed] [Google Scholar]
- 20.Brand J. G., Cagan, R. H. & Bayley, D. L. (1985) Proc. Soc. Exp. Biol. Med. 179, 76-82. [DOI] [PubMed] [Google Scholar]
- 21.Swaminathan R., Krishnamoorthy, G. & Periasamy, N. (1994) Biophys. J. 67, 2013-2023. [DOI] [PMC free article] [PubMed] [Google Scholar]
- 22.Roy S. & Bagchi, B. (1993) J. Chem. Phys. 99, 9938-9943. [Google Scholar]
- 23.Price W. S., Ide, H. & Arata, Y. (1999) J. Phys. Chem. A 103, 448-450. [Google Scholar]
- 24.Gu W. & Schoenborn, B. P. (1995) Proteins Struct. Funct. Genet. 22, 20-26. [DOI] [PubMed] [Google Scholar]
- 25.Rocchi C., Bizzarri, A. R. & Cannistraro, S. (1998) Phys. Rev. E Stat. Phys. Plasmas Fluids Relat. Interdiscip. Top. 57, 3315-3325. [Google Scholar]


