

Abstract
Background
Population neuroscience datasets provide an opportunity for researchers to estimate reproducible effect sizes for brain-behavior associations because of their large sample sizes. However, these datasets undergo strict quality control to mitigate sources of noise, such as head motion. This practice often excludes a disproportionate number of minoritized individuals.
Methods
We employ motion-ordering and motion-ordering+resampling (bagging) to test if these methods preserve functional MRI (fMRI) data in the Adolescent Brain Cognitive DevelopmentSM Study (N = 5,733). For the two methods, brain-behavior associations were computed as the partial Spearman’s Rank correlations (Rs) between functional connectivity and cognitive performance (NIH Cognition Toolbox) as well as externalizing and internalizing psychopathology (Child Behavior Checklist [CBCL]) while adjusting for participant sex assigned at birth and head motion.
Results
Black and Hispanic youth exhibited excess head motion relative to data collected from White youth, and were discarded disproportionately when using conventional approaches. Motion-ordering and bagging methods retained more than 99% of Black and Hispanic youth. Both methods produced reproducible brain-behavior associations across low-/high-motion racial/ethnic groups based on motion-limited fMRI data.
Conclusions
The motion-ordering and bagging methods are two feasible approaches that can enhance sample representation for testing brain-behavior associations and result in reproducible effect sizes in diverse populations.
Keywords: head motion, minoritized youth, inclusivity, reproducibility, scrubbing, brain-behavior
Introduction
Population neuroscience datasets made available through consortia efforts provide unprecedented opportunities for researchers to relate individual differences in brain functions (e.g., functional connectivity) to individual differences in behavior (e.g., general psychopathology, cognitive ability) with sufficient statistical power (1–3). These datasets have accelerated scientific discovery, improved reproducible research practices, and democratized the field by reducing the resources required to do research (4–7). However, despite the power that comes with the overall sample sizes available in consortia datasets, minoritized individual still tend to be disproportionally discarded through the standard pre-processing protocols typically used for MRI data analysis. As a result, studies on brain-behavior relationships have made relatively limited progress in identifying reproducible effects across diverse sociodemographic characteristics (8–10).
To minimize variations in MRI data acquisition across consortia sites, researchers apply strict quality control strategies to mitigate potential biases. One quality control strategy is to address the potential impact of participant head motion (1). Head motion can significantly inflate functional connectivity estimates across a diverse range of populations (11–17). This issue is exacerbated in studies of youth due to heightened in-scanner motion relative to adult populations and a robust negative correlation between head motion and age (11,18–21). Researchers exclude high-motion participants irrespective of their racial or ethnic backgrounds by employing a head motion threshold. However, these practices inadvertently tend to exclude minoritized youth disproportionately, due to lower adherence to mainstream protocols and a lack of culturally informed strategies to engage and retain racial/ethnic minorities in neuroimaging research, particularly those from underprivileged backgrounds (8,22,23).
The goals of the present study were to test: (1) the utility of two head motion mitigation methods (24) that attempt to retain high-motion minoritized youth using their motion-limited functional MRI data, and (2) whether it is possible to obtain reproducible brain-behavior associations using the motion-limited functional MRI data from high-motion youth. We sought to extend past work on head motion mitigation methods (13,14,24–27) by using a sample that was larger in size than previous studies, a sample with greater participant racial representation than past studies, head motion estimates across multiple functional MRI scans, and well-studied behaviors (past work focused on age).
We used data from the ABCD Study given its adequate sample size and census distribution of race/ethnicity (Black (14%), Hispanic (22%), and White (64%)) (28). We utilized motion-ordering and motion-ordering+resampling (bagging) for estimating functional connectivity to maximize participant inclusion from “high-motion” minoritized youth. Motion-ordering is ranking timepoints from least motion to most motion in motion-limited timeseries data. For motion-ordering, we computed the functional connectivity matrix of each participant using the top timepoints from (ordered) motion-limited timeseries data. Then, bagging is resampling randomly the motion-ordered timepoints several times. For bagging, we generated 500 bootstrapped samples with replacement for each participant using the top timepoints from (ordered) motion-limited timeseries data. We then computed the bagged functional connectivity matrix of each participant iteratively. To test whether these head motion mitigation methods retained high-motion youth, we looked at the proportion of participants included by race. Based on previous research (24), it is expected that the two proposed methods would retain a maximum number of high-motion participants across the 3 racial/ethnic groups as well as generating reproducible brain-behavior associations when including the high-motion youth.
To assess the validity of the two head motion mitigation methods, we examined the reproducibility of the brain-behavior associations as a function of N across the 3 racial/ethnic groups (1,24). We focused on brain-behavior relationships, specifically whole-brain functional connectivity with cognitive performance and psychopathology, as these are extensively studied using consortia datasets and present important opportunities to advance biological psychiatry (1,2,29–32). We used the edge level since methods such as connectome-based predictive modeling, network-based statistics, and canonical correlation analysis prioritize the most relevant edges in the functional connectome for computing brain-behavior relationships (33–36). To test whether these head motion mitigation methods supported reproducible brain-behavior relationships, we examined two metrics. First, we examined confidence intervals as a metric of sampling variability within participants from each racial/ethnic group. As sample sizes increase, variability tends to decrease and stabilize (1), which then is reflected in tighter confidence intervals. Second, we computed area under the curve (AUC) (24) as a metric of brain-behavior effect size. If the standard, motion-ordered, and bagged brain-behavior relationships are identical, then the confidence intervals will be identical, leading to a rate of change in AUC=0%. In practice, it is unlikely to achieve an AUC=0% due to individual variations that are present in standard, motion-ordered, and bagged functional connectivity estimates. Instead, we focused on obtaining comparable brain-behavior relationships using the standard, motion-ordered, and bagging methods, where the rates of change in AUC are within a statistically acceptable range.
We cannot hope to fully understand the biological basses of clinical conditions if we systematically exclude minoritized individuals due to biased pre-processing methods. Therefore, it is crucial to identify methods that retain as many high-motion minoritized youth as possible to develop a more inclusive understanding of the brains and behaviors of the populations represented in our data (37–40).
Methods and Materials
Participants
Complete demographic, behavioral, and imaging data from 5,733 youth were obtained from the ABCD Study Baseline Release (9–10 years) (28). Youth who belonged to one of the 3 racial/ethnic groups, Black, Hispanic, and White were included (Table 1); About 13% of the ABCD sample who belonged to other racial/ethnic categories were not included due to their limited sample sizes (Supplemental Methods S1). The present sample reflects participants who passed the MRI QC criteria described by the ABCD Data Analysis and Informatics Center (41) (DAIC; https://wiki.abcdstudy.org/release-notes/imaging/quality-control.html; imgincl_t1w_include=1; imgincl_rsfmri_include=1). The DAIC recommendations minimize data QC failure from biasing brain-behavior associations estimated from low-/high-motion participants. A total of 1,881 participants were not included based on the DAIC QC protocols, representing ~16% of the ABCD sample size. We further cross-checked the DAIC recommendations with the ABCD-BIDS Community Collection (ABCC) (42) to ensure the participants had existing preprocessed resting-state fMRI data. There were no statistical differences in race/ethnicity and sex assigned at birth when comparing participants our final sample with the participants who were not included in the analysis (Supplemental Methods S1).
Table 1.
Demographic, behavioral, and fMRI characteristics derived from the ABCD Study NIMH Data Archive Release 4.0.
| ABCD Study | Racial/Ethnic Groups | ||
|---|---|---|---|
|
| |||
| Black | Hispanic | White | |
| Scans | Baseline | Baseline | Baseline |
| Sample Size | 810 | 1,247 | 3,676 |
| Age (years) | 9–10 | 9–10 | 9–10 |
| ADIa | 1.1–124.5 | 1.1–124.6 | 1.1–125.7 |
| Sexb (Female:Male) (%) | 53:47 | 50:50 | 48:52 |
| NIH Cognition Toolboxc | 46–108 | 51–109 | 54–117 |
| CBCL-Externalizingd | 33–84 | 33–79 | 33–83 |
| CBCL-Internalizingd | 33–80 | 33–88 | 33–93 |
| Sites | 21 | 21 | 21 |
| Framese | 196–1,560 | 542–1,560 | 380–1,570 |
| tSNRf | 11.7–49.8 | 11.2–53.0 | 10.8–55.6 |
| Mean FDg (mm) | 0.04–2.1 | 0.04–2.2 | 0.03–2.4 |
ADI = Area Deprivation Index.
Participant sex denoted youth’s sex assigned at birth.
NIH Cognition Toolbox = National Institutes of Health Toolbox indexing cognitive performance.
CBCL = Child Behavior Checklist indexing externalizing and internalizing behaviors.
Frames = number of volumes acquired across 4 resting-state scans.
tSNR = temporal signal-to-noise ratio.
FD = Framewise Displacement. Note that the externalizing and internalizing CBCL and NIH Cognition Toolbox scores were T-standardized.
Behavioral Data
We focused on cognitive performance, externalizing psychopathology, and internalizing psychopathology (Supplemental Methods S2). The NIH Cognition Toolbox® (nihtoolbox.org/) was used to measure general cognitive performance based on the fluid and crystallized cognition composite scores of the youth (43–45). For each youth, the total composite score of the NIH Cognition Toolbox was obtained which was T-standardized. The Child Behavior Checklist (CBCL) is a parent report assessment that was used to measure externalizing and internalizing behaviors (46). The CBCL externalizing and internalizing scores of the youth were obtained from their respective syndrome scales that were subsequently T-standardized. There were significant differences in the distributions of the NIH Toolbox and CBCL-externalizing between the low-motion and high-motion youth (Figure S1).
MRI Preprocessing
All ABCD MRI data were processed with the ABCC (38) (https://github.com/DCAN-Labs/abcd-hcp-pipeline) (Supplemental Methods S4–S5). Standard fMRI BOLD preprocessing was further carried out using the ABCD-BIDS Pipeline (41,47) (Supplemental Methods S6). To identify “low-motion” youth in the ABCD Study, we applied a head motion threshold of mean FD<0.20 mm to the participants’ resting-state fMRI data across a maximum of 4 runs (14,18) (Supplemental Methods S7). Applying a head motion threshold of mean framewise displacement (FD)<0.20mm retained 3,342 participants, corresponding to ~58% of the total sample: White N=2,266, Black N=410, and Hispanic N=666. This threshold provided a reasonable balance between sample size requirement to achieve adequate statistical power for brain-behavior associations and good data quality standards to mitigate motion artifacts in such studies (13,14,41). Traditionally, a threshold <0.10mm is regarded as strict whereas a threshold >0.50mm is considered liberal (1,13,48,49). There is no one-threshold-fits-all populations as head motion varies by several factors including age (e.g., infants, adolescents, adults) and mental health diagnosis (11,13,21,50,51).
Functional Connectivity with Standard Method
For each youth, a whole-brain parcellation scheme was applied to extract their resting-state fMRI timeseries concatenated across a maximum of 4 runs. Functional connectivity was derived from the fMRI timeseries by computing and Fisher z-transforming the Pearson correlation coefficient (r) between all possible pairs of ROIs using an extended Gordon parcellation scheme (41,47,52) to construct their 352×352 functional connectivity matrices. This pipeline is referred to as the “standard method” (Supplemental Methods S8–S9).
Functional Connectivity with Motion-ordered and Bagging Methods
The motion-ordered and bagging methods were performed by applying a frame censoring procedure known as scrubbing (14,16,53,54) to identify and remove motion-corrupted timepoints (T) in the fMRI timeseries (Figures 1–2) (Supplemental Methods S10–S11). Each T was identified with a head motion threshold of FD>0.20mm (18). For each T, one preceding (T–1) and two succeeding (T +1, T+2) timepoints were censored in the fMRI timeseries to minimize the presence of residual motion and micro head movements. For each participant, we created subsets of the scrubbed timepoints that matched a threshold referred to as minTP to prevent participants from having varying number of motion-limited timepoints in their timeseries. The scrubbed timeseries were ranked by their lowest FD values and the top minTP-matched timepoints were selected. For the motion-ordered method, the functional connectivity matrix of each participant was computed using the minTP-matched timepoints (24). For bagging, 500 bootstrapped samples of size TP were generated with replacement for each participant using the minTP-matched timepoints (24). Iteratively, the bagged functional connectivity matrix of each participant was recomputed. A mean bagged functional connectivity matrix also was generated for each participant by averaging the 500 connectivity matrices. Both minTP and TP had identical sizes to prevent either parameter from influencing the brain-behavior associations.
Figure 1. Motion-ordered and Bagging methods.
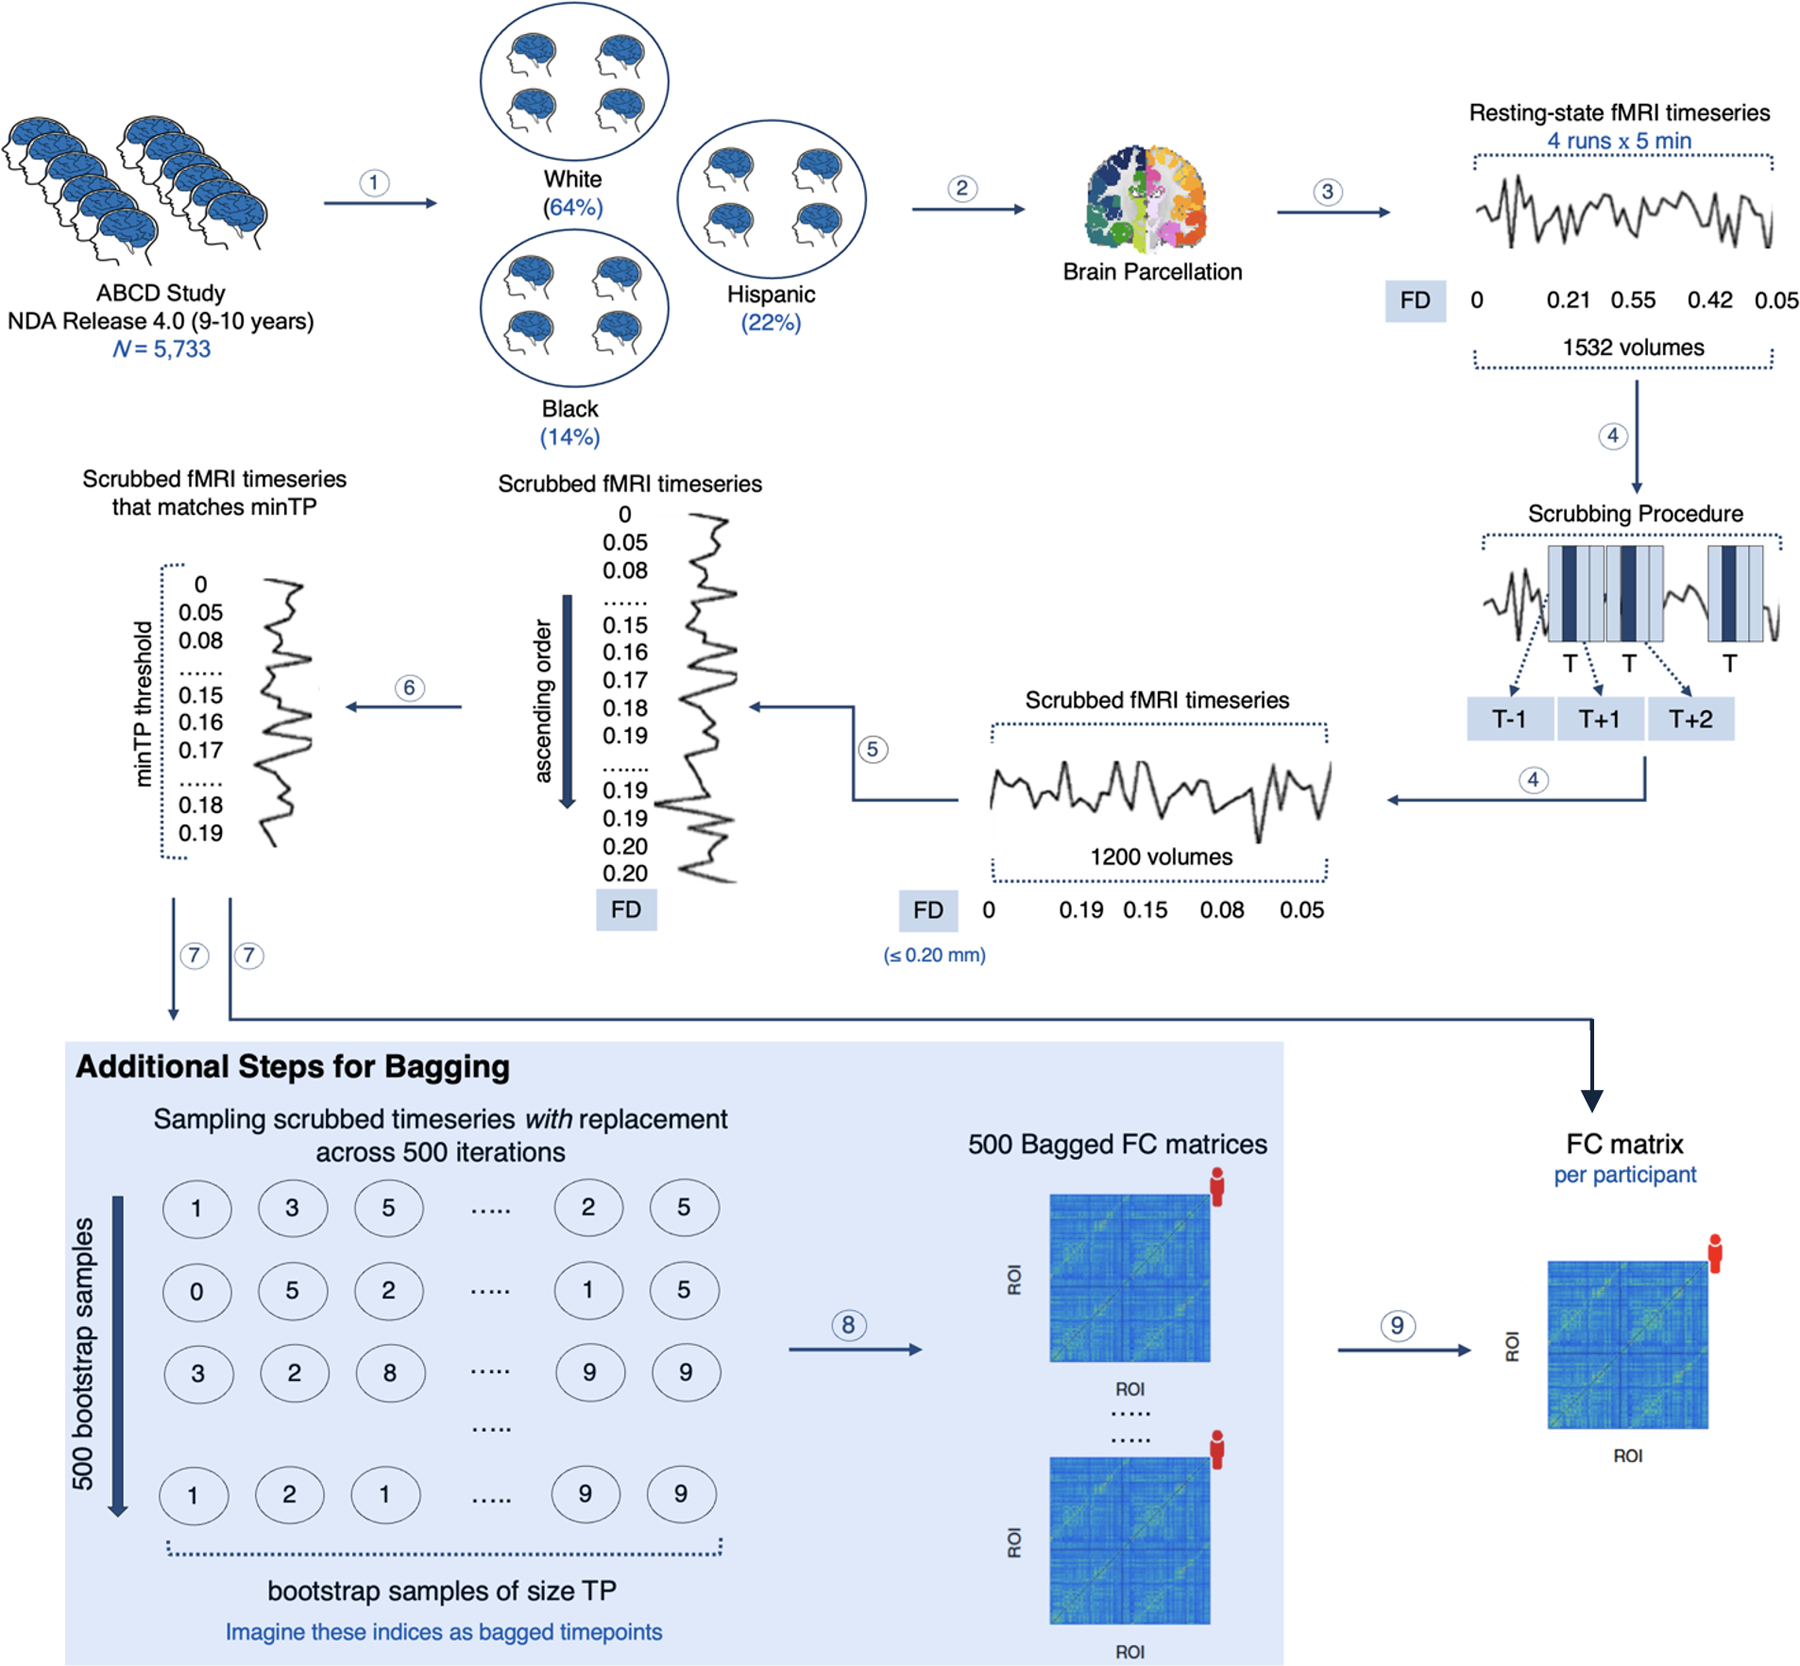
1. The participants in the ABCD Study were categorized into 3 racial/ethnic groups: White, Black, and Hispanic. 2. A whole-brain parcellation was applied to extract the resting-state fMRI timeseries of the youth concatenated across a maximum of 4 runs. 3. The framewise displacement (FD) was computed for every timepoint in the fMRI timeseries to quantify the amount of in-scanner motion for one volume relative to its preceding one. 4. Scrubbing was applied to identify and remove motion-corrupted timepoints (T) if their FD > 0.20 mm. For each T, one preceding (T) and two succeeding (T + 1, T + 2) timepoints were further censored. 5. For each youth, their scrubbed timeseries were ranked by their least FD values (0 → 0.20 mm). 6. A minTP threshold was imposed to prevent the youth from having different number of timepoints in their timeseries. 7. For the motion-ordered method, the functional connectivity (FC) of each participant was computed between all pairs of ROIs using Pearson correlation coefficient from the minTP-matched timepoints. For the bagging method, 500 bootstrapped timeseries samples of size TP were generated with replacement for each participant using the minTP-matched timepoints. 8. Iteratively, the functional connectivity (FC) between all pairs of ROIs was computed using Pearson correlation coefficient for the 500 bootstrapped samples. 9. A mean bagged functional connectivity (FC) matrix also was generated for each youth by averaging the 500 connectivity matrices. The motion-ordered and bagging methods are adapted from previous work29. The analysis code to this study can be found at https://github.com/JRam02/inclusivity.
Figure 2. Example of two participants’ resting-state fMRI timeseries data using the motion-ordered and bagging methods.

Top Panel: Participant A is identified as low-motion, which means their fMRI data likely has fewer motion-corrupted timepoints. Bottom Panel: Participant B is identified as high-motion, which means their fMRI data likely has more motion-corrupted timepoints. In both cases, all the motion-corrupted timepoints (T) are censored on the basis that their FD > 0.20 mm using a procedure known as scrubbing. For each identified T, its preceding and two succeeding timepoints also are removed. The scrubbed timeseries are then ranked by the lowest FD values such that the smallest value will be 0 and the largest value will be 0.20 mm. A minTP threshold is applied to select the same number of least motion-corrupted timepoints in the timeseries. In the present study, this minTP threshold (e.g., 100 timepoints) is chosen based on the extent to which we can retain the maximum number of low-/high-motion participants across the 3 racial/ethnic groups. If a participant has fewer scrubbed timepoints than the minTP threshold, they are not included in the subsequent analysis. Once the minTP-matched timepoints of all low-/high-motion participants are selected, the motion-ordered and bagging methods are applied. For the motion-ordered method, the functional connectivity matrix of each participant is computed using the minTP-matched timepoints. For bagging, 500 bootstrapped samples are generated with replacement for each participant using minTP-matched timepoints of size TP. Here, TP corresponds to the number of timepoints being bootstrapped with replacement from the minTP-matched timepoints. In the present study, both minTP and TP have identical sizes. For each participant, the bagged functional connectivity matrix is computed in an iterative manner.
Brain-behavior Associations with Standard, Motion-ordered, and Bagging Methods
The standard, motion-ordered, and bagged functional connectivity matrices for each participant were used to compute the partial Spearman’s Rank correlations (Rs) between connectivity patterns and behavior for cognitive performance (NIH Cognition Toolbox) and externalizing and internalizing psychopathology (Child Behavior Checklist [CBCL]) at the edge level (Supplemental Methods S3,S12). Participant sex assigned at birth and mean FD were treated as covariates when computing the brain-behavior correlations.
The brain-behavior relationships were obtained from the strongest edge (Rs) in the functional connectome after FDR correction (q=0.05) (55) across 61,776 edges (Figure S2). There was no edge that produced a significant association with CBCL-internalizing after FDR correction. Therefore, the brain-behavior analyses focused only on NIH Cognition Toolbox and CBCL-externalizing. We established the reproducibility of the standard brain-behavior associations for the 3 racial/ethnic groups across different sample sizes (1,24). Each sample size was bootstrapped without replacement over 500 iterations, where we randomly selected samples of the low-motion youth at 11 logarithmically-spaced intervals. For each sample size, the mean brain-behavior Rs and 95% CIs were plotted as a function of N.
We then performed the motion-ordered and bagged brain-behavior associations by computing Rs between connectivity patterns and NIH Toolbox and CBCL-externalizing using the scrubbed timeseries of the low-motion racial/ethnic groups. We used the same edge that shared the highest correlation strength with the standard method for the motion-ordered and bagging procedures. We used sampling variability to assess the reproducibility of the brain-behavior Rs using the motion-ordered and bagged functional connectivity matrices. For both methods, subsamples of participants were selected randomly for each low-motion racial/ethnic group without replacement over 500 iterations. The mean brain-behavior Rs and 95% CIs were plotted as a function of N. Then, we estimated the absolute ∆AUC to quantify the rate of change in AUC between the standard and motion-ordered as well as bagging methods. Finally, we evaluated the agreement of the standard and motion-ordered/bagged brain-behavior relationships using the Lin’s concordance coefficient (ρc) (56,57) across the 3 racial/ethnic groups. By definition, ρc measures the agreement between two variables from a set of bivariate data ranging from −1 (perfect discordance) to 1 (perfect concordance) (Supplemental Methods S14). It can be interpreted as a weighted version of Pearson correlation coefficient with ρc<0.20 denoting poor concordance and ρc>0.80 representing excellent concordance (58).
Results
Disproportionate exclusion of high-motion minoritized youth
We observed that a strict head motion threshold drastically reduced the sample sizes across racial/ethnic groups, relative to a liberal head motion threshold (Figure 3A). However, there was a disproportionate decline in the sample sizes of the Black and Hispanic groups regardless of the mean FD threshold. This was due to a significant difference in mean FD across the 3 racial/ethnic groups (see 59). Minoritized youth exhibited greater head motion relative to White youth (Figure 3B): Kruskal-Wallis test, H (2)=61.9, P<0.001; White median meanFD=0.16mm, Black median meanFD=0.20mm, and Hispanic median meanFD=0.19mm. We observed a gradual disproportionate decrease in the temporal signal-to-noise ratio (tSNR) of the Black and Hispanic youth when liberal mean FD thresholds were applied (Figure 3A). There also was a significant difference in the number of scrubbed timepoints across the 3 racial/ethnic groups. Minoritized youth had fewer number of scrubbed timepoints in their motion-limited fMRI timeseries relative to White youth (Figure 3A): Kruskal-Wallis test, H (2)=34.7, P<0.001; White median scrubbed timepoints=1,016, Black median scrubbed timepoints=936, and Hispanic median scrubbed timepoints=940. Since the majority of low-/high-motion participants had at least 100 scrubbed timepoints, we set the minTP and TP thresholds to 100 timepoints to maximize participant inclusivity across the 3 racial/ethnic groups.
Figure 3. Impact of head motion across racial and ethnic groups in the ABCD Study.

A. Left: Relationship between head motion thresholds and sample sizes. Head motion was quantified by mean framewise displacement (FD) such that mean FD ∈ {0.08, 0.20, 0.30, 0.40, 0.50}. Middle: Relationship between head motion thresholds and signal quality indexed by the temporal signal-to-noise ratio (tSNR). Mean FD ∈ {0.08, 0.20, 0.30, 0.40, 0.50}. Right: Relationship between number of scrubbed timepoints and sample sizes. Number of scrubbed timepoints ∈ {100, 200, 300, 400, 500, 600, 700, 800, 900, 1,000, 1,100, 1,200, 1,300, 1,400, 1,500}. B. Left: There was a significant difference in head motion across the 3 racial/ethnic groups. Right: There was a significant difference in the number of scrubbed timepoints across the 3 racial/ethnic groups.
Standard brain-behavior associations from low-motion racial and ethnic groups
We examined the reproducibility of the standard brain-behavior relationships as a function of N ranging from N=25 (typical) to maximum N of each group (large=250). We observed tightening of the 95% confidence interval (CI) as the sample sizes of the racial/ethnic groups grew from typical-to-large for both NIH Cognition Toolbox (Table 2) and CBCL-externalizing (Table 3). For NIH Cognition Toolbox, White , Black , and Hispanic . For CBCL-externalizing, White , Black , and Hispanic .
Table 2. Correlations between functional connectivity and NIH Cognition Toolbox obtained from the standard, motion-ordered, and bagging methods as a function of sample size across the 3 low-motion racial/ethnic groups.
The standard method corresponded to the brain-behavior associations derived from the full fMRI timeseries of the low-motion youth with a mean FD < 0.20 mm. The motion-ordered method corresponded to the brain-behavior associations derived from the scrubbed fMRI timeseries ranked and thresholded by their 100 least motion-corrupted timepoints (0 < FD < 0.20 mm) to construct the functional connectivity matrices of the low-motion youth. The bagging method corresponded to the brain-behavior associations derived from the scrubbed fMRI timeseries ranked and thresholded by their 100 least motion-corrupted timepoints (0 < FD < 0.20 mm) from which 100 timepoints were bootstrapped across 500 iterations to construct the functional connectivity matrices of the low-motion youth. The sample sizes were bootstrapped at 11 logarithmically-spaced N intervals: White N ∈ {25, 39, 62, 97, 152, 238, 374, 586, 920, 1444, 2266}; Black N ∈ {25, 33, 44, 58, 77, 101, 134, 177, 234, 310, 410}; Hispanic N ∈ {25, 35, 48, 67, 93, 129, 179, 249, 345, 480, 666}. For each low-motion racial/ethnic group and behavior, we computed a total of 11 intervals x 500 bootstrap N samples = 5,500 standard and motion-ordered correlations. For each low-motion racial/ethnic group and behavior, we computed a total of 11 intervals x 500 bootstrap N samples x 500 bootstrap timepoints = 2.75 million bagged correlations. For each racial/ethnic group, the brain-behavior Rs and 95% CI are shown as a function of sample size. The areas under the curve (AUC) for the brain-behavior associations also are displayed.
| ABCD Study | Brain-behavior relationships for NIH Cognition Toolbox | ||
|---|---|---|---|
|
| |||
| Standard | Motion-ordered | Bagging | |
| Low-motion White Youth | mean Rs [95% CI] | mean Rs [95% CI] | mean Rs [95% CI] |
| 25 | 0.10 [−0.32, 0.49] | 0.10 [−0.31, 0.50] | 0.11 [−0.28, 0.49] |
| 39 | 0.10 [−0.22, 0.42] | 0.088 [−0.23, 0.39] | 0.098 [−0.22, 0.43] |
| 62 | 0.097 [−0.14, 0.35] | 0.11 [−0.15, 0.34] | 0.094 [−0.17, 0.37] |
| 97 | 0.093 [−0.098, 0.29] | 0.11 [−0.077, 0.29] | 0.11 [−0.088, 0.28] |
| 152 | 0.11 [−0.057, 0.26] | 0.10 [−0.050, 0.26] | 0.11 [−0.038, 0.23] |
| 238 | 0.095 [−0.019, 0.21] | 0.11 [−0.011, 0.21] | 0.10 [−0.012, 0.23] |
| 374 | 0.10 [0.006, 0.19] | 0.099 [0.009, 0.20] | 0.11 [0.016, 0.19] |
| 586 | 0.10 [0.033, 0.18] | 0.11 [0.028, 0.17] | 0.11 [0.038, 0.17] |
| 920 | 0.10 [0.051, 0.15] | 0.11 [0.057, 0.15] | 0.11 [0.057, 0.15] |
| 1444 | 0.10 [0.073, 0.13] | 0.11 [0.074, 0.14] | 0.11 [0.076, 0.14] |
| 2266 | 0.10 [0.10, 0.10] | 0.11 [0.11, 0.11] | 0.11 [0.11, 0.11] |
| Area Under Curve (AUC) | 250.01 | 250.55 | 244.67 |
|
| |||
| Low-motion Black Youth | mean Rs [95% CI] | mean Rs [95% CI] | mean Rs [95% CI] |
| 25 | 0.13 [−0.29, 0.51] | 0.12 [−0.23, 0.52] | 0.13 [−0.33, 0.50] |
| 33 | 0.12 [−0.22, 0.42] | 0.13 [−0.19, 0.44] | 0.11 [−0.22, 0.42] |
| 44 | 0.12 [−0.17, 0.39] | 0.14 [−0.14, 0.42] | 0.13 [−0.17, 0.42] |
| 58 | 0.11 [−0.12, 0.33] | 0.12 [−0.16, 0.38] | 0.14 [−0.092, 0.39] |
| 77 | 0.12 [−0.096, 0.30] | 0.13 [−0.078, 0.33] | 0.12 [−0.11, 0.34] |
| 101 | 0.12 [−0.060, 0.29] | 0.13 [−0.050, 0.28] | 0.12 [−0.050, 0.28] |
| 134 | 0.12 [−0.017, 0.25] | 0.13 [−0.005, 0.27] | 0.11 [−0.029, 0.24] |
| 177 | 0.12 [0.003, 0.23] | 0.13 [0.013, 0.24] | 0.12 [0.007, 0.22] |
| 234 | 0.12 [0.034, 0.21] | 0.12 [0.031, 0.21] | 0.12 [0.033, 0.20] |
| 310 | 0.12 [0.067, 0.18] | 0.13 [0.073, 0.18] | 0.12 [0.069, 0.18] |
| 410 | 0.12 [0.12, 0.12] | 0.13 [0.13, 0.13] | 0.12 [0.12, 0.12] |
| Area Under Curve (AUC) | 85.33 | 86.21 | 85.55 |
|
| |||
| Low-motion Hispanic Youth | mean Rs [95% CI] | mean Rs [95% CI] | mean Rs [95% CI] |
| 25 | 0.049 [−0.34, 0.48] | 0.086 [−0.36, 0.51] | 0.062 [−0.39, 0.46] |
| 35 | 0.056 [−0.29, 0.38] | 0.063 [−0.27, 0.41] | 0.080 [−0.26, 0.40] |
| 48 | 0.056 [−0.24, 0.35] | 0.060 [−0.23, 0.33] | 0.064 [−0.22, 0.35] |
| 67 | 0.044 [−0.19, 0.25] | 0.058 [−0.14, 0.28] | 0.068 [−0.15, 0.29] |
| 93 | 0.056 [−0.14, 0.25] | 0.064 [−0.11, 0.25] | 0.064 [−0.11, 0.25] |
| 129 | 0.055 [−0.11, 0.21] | 0.066 [−0.091, 0.22] | 0.062 [−0.086, 0.21] |
| 179 | 0.052 [−0.065, 0.17] | 0.065 [−0.056, 0.18] | 0.064 [−0.066, 0.18] |
| 249 | 0.055 [−0.047, 0.15] | 0.066 [−0.032, 0.16] | 0.066 [−0.044, 0.16] |
| 345 | 0.054 [−0.035, 0.13] | 0.066 [−0.005, 0.15] | 0.064 [−0.010, 0.14] |
| 480 | 0.056 [0.004, 0.11] | 0.067 [0.021, 0.11] | 0.065 [0.018, 0.11] |
| 666 | 0.054 [0.054, 0.054] | 0.066 [0.066, 0.066] | 0.066 [0.064, 0.067] |
| Area Under Curve (AUC) | 123.47 | 117.35 | 118.78 |
Table 3. Correlations between functional connectivity and CBCL-externalizing obtained from the standard, motion-ordered, and bagging methods as a function of sample size across the 3 low-motion racial/ethnic groups.
The standard method corresponded to the brain-behavior associations derived from the full fMRI timeseries of the low-motion youth with a mean FD < 0.20 mm. The motion-ordered method corresponded to the brain-behavior associations derived from the scrubbed fMRI timeseries ranked and thresholded by their 100 least motion-corrupted timepoints (0 < FD < 0.20 mm) to construct the functional connectivity matrices of the low-motion youth. The bagging method corresponded to the brain-behavior associations derived from the scrubbed fMRI timeseries ranked and thresholded by their 100 least motion-corrupted timepoints (0 < FD < 0.20 mm) from which 100 timepoints were bootstrapped across 500 iterations to construct the functional connectivity matrices of the low-motion youth. The sample sizes were bootstrapped at 11 logarithmically-spaced N intervals: White N ∈ {25, 39, 62, 97, 152, 238, 374, 586, 920, 1444, 2266}; Black N ∈ {25, 33, 44, 58, 77, 101, 134, 177, 234, 310, 410}; Hispanic N ∈ {25, 35, 48, 67, 93, 129, 179, 249, 345, 480, 666}. For each low-motion racial/ethnic group and behavior, we computed a total of 11 intervals x 500 bootstrap N samples = 5,500 standard and motion-ordered correlations. For each low-motion racial/ethnic group and behavior, we computed a total of 11 intervals x 500 bootstrap N samples x 500 bootstrap timepoints = 2.75 million bagged correlations. For each racial/ethnic group, the brain-behavior Rs and 95% CI are shown as a function of sample size. The areas under the curve (AUC) for the brain-behavior associations also are displayed.
| ABCD Study | Brain-behavior relationships for CBCL-externalizing | ||
|---|---|---|---|
|
| |||
| Standard | Motion-ordered | Bagging | |
| Low-motion White Youth | mean Rs [95% CI] | mean Rs [95% CI] | mean Rs [95% CI] |
| 25 | 0.097 [−0.29, 0.46] | 0.064 [−0.34, 0.49] | 0.071 [−0.32, 0.44] |
| 39 | 0.10 [−0.19, 0.41] | 0.086 [−0.22, 0.39] | 0.067 [−0.26, 0.40] |
| 62 | 0.094 [−0.13, 0.33] | 0.063 [−0.20, 0.30] | 0.067 [−0.20, 0.30] |
| 97 | 0.092 [−0.099, 0.28] | 0.066 [−0.12, 0.25] | 0.068 [−0.12, 0.27] |
| 152 | 0.098 [−0.050, 0.25] | 0.072 [−0.078, 0.22] | 0.066 [−0.082, 0.22] |
| 238 | 0.095 [−0.033, 0.22] | 0.069 [−0.049, 0.18] | 0.073 [−0.042, 0.19] |
| 374 | 0.099 [0.007, 0.19] | 0.072 [−0.027, 0.16] | 0.070 [−0.023, 0.16] |
| 586 | 0.10 [0.031, 0.17] | 0.072 [−0.006, 0.14] | 0.070 [0.005, 0.15] |
| 920 | 0.098 [0.053, 0.14] | 0.070 [0.022, 0.12] | 0.070 [0.019, 0.12] |
| 1444 | 0.099 [0.068, 0.13] | 0.071 [0.038, 0.10] | 0.072 [0.041, 0.10] |
| 2266 | 0.099 [0.099, 0.099] | 0.071 [0.071, 0.071] | 0.071 [0.071, 0.072] |
| Area Under Curve (AUC) | 244.82 | 250.70 | 251.44 |
|
| |||
| Low-motion Black Youth | mean Rs [95% CI] | mean Rs [95% CI] | mean Rs [95% CI] |
| 25 | 0.055 [−0.35, 0.45] | 0.078 [−0.31, 0.48] | 0.039 [−0.36, 0.43] |
| 33 | 0.060 [−0.28, 0.38] | 0.063 [−0.30, 0.42] | 0.045 [−0.30, 0.39] |
| 44 | 0.056 [−0.23, 0.35] | 0.052 [−0.23, 0.36] | 0.050 [−0.22, 0.31] |
| 58 | 0.054 [−0.18, 0.27] | 0.056 [−0.18, 0.29] | 0.051 [−0.18, 0.28] |
| 77 | 0.048 [−0.15, 0.23] | 0.047 [−0.15, 0.26] | 0.046 [−0.16, 0.25] |
| 101 | 0.055 [−0.12, 0.22] | 0.055 [−0.10, 0.22] | 0.044 [−0.14, 0.22] |
| 134 | 0.061 [−0.065, 0.19] | 0.052 [−0.088, 0.17] | 0.053 [−0.094, 0.19] |
| 177 | 0.059 [−0.048, 0.16] | 0.055 [−0.055, 0.16] | 0.050 [−0.055, 0.17] |
| 234 | 0.063 [−0.023, 0.15] | 0.053 [−0.030, 0.14] | 0.053 [−0.026, 0.14] |
| 310 | 0.059 [0.007, 0.11] | 0.051 [−0.004, 0.11] | 0.052 [−0.005, 0.10] |
| 410 | 0.059 [0.059, 0.059] | 0.054 [0.054, 0.054] | 0.051 [0.049, 0.053] |
| Area Under Curve (AUC) | 82.69 | 84.96 | 85.52 |
|
| |||
| Low-motion Hispanic Youth | mean Rs [95% CI] | mean Rs [95% CI] | mean Rs [95% CI] |
| 25 | 0.061 [−0.34, 0.43] | 0.065 [−0.33, 0.45] | 0.053 [−0.37, 0.45] |
| 35 | 0.079 [−0.22, 0.43] | 0.058 [−0.29, 0.38] | 0.065 [−0.25, 0.37] |
| 48 | 0.089 [−0.20, 0.34] | 0.066 [−0.18, 0.35] | 0.073 [−0.21, 0.35] |
| 67 | 0.081 [−0.15, 0.31] | 0.067 [−0.17, 0.31] | 0.073 [−0.16, 0.32] |
| 93 | 0.086 [−0.091, 0.27] | 0.065 [−0.11, 0.27] | 0.067 [−0.11, 0.26] |
| 129 | 0.083 [−0.063, 0.23] | 0.064 [−0.082, 0.22] | 0.065 [−0.085, 0.22] |
| 179 | 0.082 [−0.036, 0.21] | 0.063 [−0.056, 0.19] | 0.073 [−0.039, 0.19] |
| 249 | 0.077 [−0.016, 0.16] | 0.064 [−0.034, 0.15] | 0.069 [−0.015, 0.16] |
| 345 | 0.082 [0.007, 0.14] | 0.068 [−0.008, 0.14] | 0.068 [−0.008, 0.14] |
| 480 | 0.082 [0.037, 0.13] | 0.066 [0.021, 0.11] | 0.067 [0.018, 0.11] |
| 666 | 0.082 [0.082, 0.082] | 0.066 [0.066, 0.066] | 0.066 [0.065, 0.068] |
| Area Under Curve (AUC) | 113.75 | 117.00 | 115.94 |
Motion-ordered and bagged brain-behavior associations from low-motion racial and ethnic groups
We next assessed the reproducibility of the motion-ordered and bagged brain-behavior relationships as a function of N ranging from N=25 (typical) to maximum N of each group (large). We observed tightening of the 95% CI as the sample sizes of the racial/ethnic groups increased from typical-to-large for NIH Cognition Toolbox (Table 2) and CBCL-externalizing (Table 3). The brain-behavior relationships were comparable to those obtained from the standard method. For NIH Cognition Toolbox, White , Black , and Hispanic using the motion-ordered method, and White , Black , and Hispanic using bagging. For CBCL-externalizing, White , Black , and Hispanic using the motion-ordered method, and White , Black , and Hispanic using bagging. For NIH Cognition Toolbox, ∆AUCmotion-ordered was as follows: White ∆AUC=0.22%, Black ∆AUC=1.03%, and Hispanic ∆AUC=4.96%. For NIH Cognition Toolbox, ∆AUCbagging was as follows: White ∆AUC=2.14%, Black ∆AUC=0.26%, and Hispanic ∆AUC=3.80%. For CBCL-externalizing, ∆AUCmotion-ordered was as follows: White ∆AUC=2.40%, Black ∆AUC=2.75%, and Hispanic ∆AUC=2.86%. For CBCL-externalizing, ∆AUCbagging was as follows: White ∆AUC=2.70%, Black ∆AUC=3.42%, and Hispanic ∆AUC=1.93%.
Retaining high-motion youth for inclusive and reproducible brain-behavior associations
We next tested whether motion-ordered and bagging methods can maximize participant inclusion for generating inclusive and reproducible brain-behavior associations. Instead of discarding all the “high-motion” youth based on common practices in brain-behavior association studies, such as applying a mean FD<0.20mm, we retained all low-/high-motion youth who had “usable” timepoints in their fMRI timeseries. To maximize participant inclusion, we retained all low-/high-motion youth who had a minimum of 100 least motion-corrupted timepoints in their scrubbed fMRI timeseries (Supplemental Methods S13). This procedure helped to retain a total of 5,732 participants, corresponding to ~99.98% of the total sample size: White N=3,675, Black N=810, and Hispanic N=1,247. This procedure maximized the representation of minoritized youth for subsequent brain-behavior analyses: Loss in White N:0.03%, Loss in Black N:0%, and Loss in Hispanic N:0%.
We reexamined the reproducibility of the motion-ordered and bagged brain-behavior associations as a function of N ranging from N=25 (typical) to maximum N of each group (large). We computed standard brain-behavior associations to compare the performances of the motion-ordered and bagging methods when including the high-motion youth. We observed similar tightening of the 95% CIs as sample size increased with the standard and motion-ordered methods (Figure 4) in addition to the standard and bagging methods (Figure 5) for NIH Cognition Toolbox and CBCL-externalizing. The standard, motion-ordered, and bagged brain-behavior associations remained comparable even when the “high-motion” youth were included. From the standard method and NIH Cognition Toolbox, White , Black , and Hispanic . From the motion-ordered method and NIH Cognition Toolbox, White , Black , and Hispanic . From bagging and NIH Cognition Toolbox, White , Black , and Hispanic . From the standard method and CBCL-externalizing, White , Black , and Hispanic . From the motion-ordered method and CBCL-externalizing, White , Black , and Hispanic . From bagging and CBCL-externalizing, White , Black , and Hispanic . The AUCmotion-ordered for NIH Cognition Toolbox were as follows: White ∆AUC=0.72%, Black ∆AUC=2.58%, and Hispanic ∆AUC=0.09%. For NIH Cognition Toolbox, ∆AUCbagging was as follows: White ∆AUC=0.55%, Black ∆AUC=3.03%, and Hispanic ∆AUC=3.87%. For CBCL-externalizing, ∆AUCmotion-ordered was as follows: White ∆AUC=3.05%, Black ∆AUC=2.15%, and Hispanic ∆AUC=3.03%. For CBCL-externalizing, ∆AUCbagging was as follows: White ∆AUC=0.37%, Black ∆AUC=2.00%, and Hispanic ∆AUC=1.47%.
Figure 4. Correlations between functional connectivity and (A-B) NIH Cognition Toolbox and (C-D) CBCL-externalizing obtained from the standard and motion-ordered methods as a function of sample size across the 3 low-/high-motion racial/ethnic groups.

The standard method corresponded to the brain-behavior associations derived from the full fMRI timeseries of the low-/high-motion youth that have been retained for the analyses without imposing an initial head motion threshold of mean FD < 0.20 mm. The motion-ordered method corresponded to the brain-behavior associations derived from the scrubbed fMRI timeseries of the low-/high-motion youth who were retained based on the assumption that they had a minimum of 100 least motion-corrupted timepoints. Their scrubbed fMRI timeseries were ranked by their lowest FD values and 100 least motion-corrupted timepoints (0 < FD < 0.20 mm) were selected to construct the functional connectivity matrices of the youth. The sample sizes were bootstrapped at 11 logarithmically-spaced N intervals: White N ∈ {25, 41, 68, 112, 184, 303, 499, 822, 1355, 2231, 3675}; Black N ∈ {25, 35, 50, 71, 100, 142, 201, 285, 404, 572, 810}; Hispanic N ∈ {25, 37, 55, 81, 119, 177, 261, 386, 571, 843, 1247}. For each low-/high-motion racial/ethnic group and behavior, we computed a total of 11 intervals x 500 bootstrap N samples = 5,500 standard and motion-ordered correlations. Solid teal and purple lines show the mean correlations from the 500 bootstrap samples for a given same size. Teal and purple shadings denote the minimum and maximum correlations across 500 bootstrap samples for a given sample size. Black dotted lines represent the lower and upper bounds of the 95% CIs for a given sample size. The areas under the curve (AUC) for the brain-behavior associations also are displayed.
Figure 5. Correlations between functional connectivity and (A-B) NIH Cognition Toolbox and (C-D) CBCL-externalizing obtained from the standard and bagging methods as a function of sample size across the 3 low-/high-motion racial/ethnic groups.
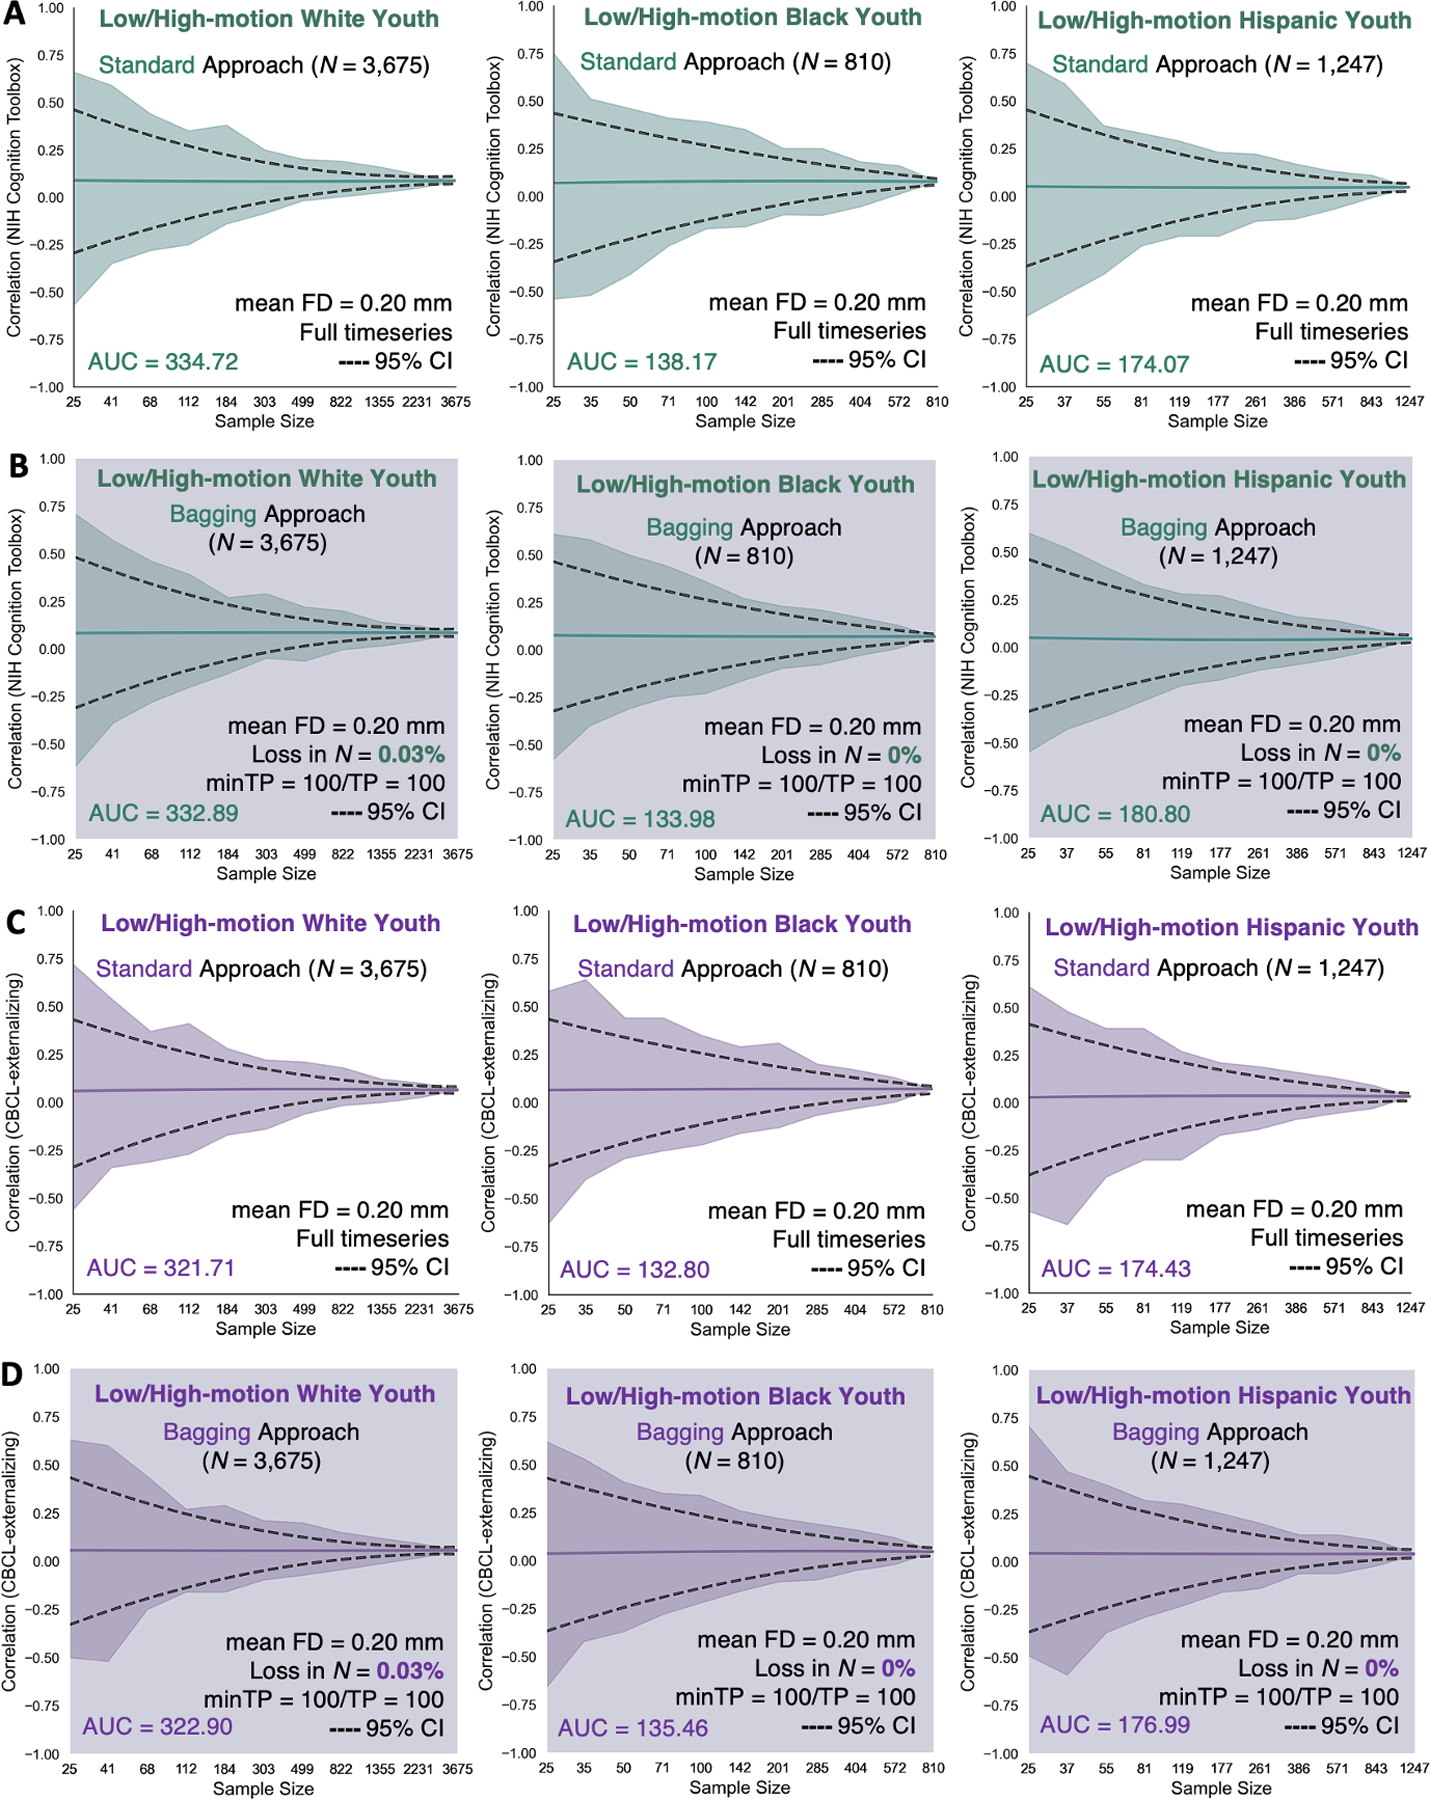
The standard method corresponded to the brain-behavior associations derived from the full fMRI timeseries of the low-/high-motion youth that have been retained for the analyses without imposing an initial head motion threshold of mean FD < 0.20 mm. The bagging method corresponded to the brain-behavior associations derived from the scrubbed fMRI timeseries of the low-/high-motion youth who were retained based on the assumption that they had a minimum of 100 least motion-corrupted timepoints. Their scrubbed fMRI timeseries were ranked by their lowest FD values and 100 least motion-corrupted timepoints (0 < FD < 0.20 mm) were selected from which 100 timepoints were bootstrapped across 500 iterations to construct the functional connectivity matrices of the youth. The sample sizes were bootstrapped at 11 logarithmically-spaced N intervals: White N ∈ {25, 41, 68, 112, 184, 303, 499, 822, 1355, 2231, 3675}; Black N ∈ {25, 35, 50, 71, 100, 142, 201, 285, 404, 572, 810}; Hispanic N ∈ {25, 37, 55, 81, 119, 177, 261, 386, 571, 843, 1247}. For each low-/high-motion racial/ethnic group and behavior, we computed a total of 11 intervals x 500 bootstrap N samples = 5,500 standard correlations. For each low-/high-motion racial/ethnic group and behavior, we computed a total of 11 intervals x 500 bootstrap N samples x 500 bootstrap timepoints = 2.75 million bagged correlations. Solid teal and purple lines show the mean correlations from the 500 bootstrap samples for a given same size. Teal and purple shadings denote the minimum and maximum correlations across 500 bootstrap samples for a given sample size. Black dotted lines represent the lower and upper bounds of the 95% CIs for a given sample size. The areas under the curve (AUC) for the brain-behavior associations also are displayed.
Concordance of standard and motion-ordered/bagged brain-behavior relationships from low-/high-motion youth
At N=25 (typical) and N=250 (large) sample sizes, we observed strong concordance between the standard and motion-ordered brain-behavior relationships for NIH Cognition Toolbox (0.76<ρc<0.83) and CBCL-externalizing (0.76<ρc<0.83) derived from the low-motion racial/ethnic groups (Figures 6–7). We observed similar concordance patterns at typical and large sample sizes when the high-motion youth were included for NIH Cognition Toolbox (0.76<ρc<0.82) and CBCL-externalizing (0.69<ρc<0.80) (Figures 6–7). Additionally, the concordance of the standard and bagged brain-behavior associations was consistent with those derived from the motion-ordered method at typical and large sample sizes (Figures S3–S4). Finally, the effect sizes produced by the standard, motion-ordered, and bagging methods were comparable using a single fMRI scan (Supplemental Methods S14; Figures S5–S9) and the weakest edge in the functional connectome (Figures S9–S13) with and without including the high-motion youth at typical and large sample sizes.
Figure 6. Bootstrap brain-behavior correlations obtained from the standard and motion-ordered methods at typical sample size (N = 25) with (A-B) and without (C-D) excluding the high-motion youth across the 3 racial/ethnic groups.

The teal and purple data points corresponded to bootstrap samples at N = 25 obtained from 500 iterations and these samples were used to compute the associations between functional connectivity and NIH Cognition Toolbox and CBCL-externalizing. The Lin’s concordance correlation coefficient (ρc) was computed to assess the reproducibility of the brain-behavior associations obtained from the standard and motion-ordered methods. The low-/high-motion youth were retained based on the assumption that they had a minimum of 100 least motion-corrupted timepoints in their fMRI timeseries.
Figure 7. Bootstrap brain-behavior correlations obtained from the standard and motion-ordered methods at large sample size (N = 250) with (A-B) and without (C-D) excluding the high-motion youth across the 3 racial/ethnic groups.

The teal and purple data points corresponded to bootstrap samples at N = 250 obtained from 500 iterations and these samples were used to compute the associations between functional connectivity and NIH Cognition Toolbox and CBCL-externalizing. The Lin’s concordance correlation coefficient (ρc) was computed to assess the reproducibility of the brain-behavior associations obtained from the standard and motion-ordered methods. The low-/high-motion youth were retained based on the assumption that they had a minimum of 100 least motion-corrupted timepoints in their fMRI timeseries.
Discussion
In modern neuroimaging research and specifically in the subfield of biological psychiatry, the quest for reproducible brain-behavior relationships has underscored a need for large sample sizes that can provide adequate statistical power. At the same time, consortia datasets undergo rigorous data quality control to mitigate the impact of noise, such as that produced by participant head motion, with strict thresholds for data inclusion. This also is a feature of research using neuroimaging data from smaller community-based samples, which often excludes high-motion participants despite the sample size. Unfortunately, applying strict head motion thresholds drastically reduces sample size, particularly in minoritized developmental cohorts. Here, replicating and extending previous work (24), we demonstrated the utility of motion-ordering and motion-ordering+resampling (bagging) methods for preserving fMRI data containing high levels of head motion. Although minoritized youth exhibited greater head motion relative to White youth, both methods retained more than 99% of all minoritized youth and produced inclusive and reproducible effect sizes across races/ethnicities. The motion-ordered and bagging methods enhance sample representation in brain-behavior association studies and help generate reproducible effect sizes across sociodemographically diverse cohorts.
We showed that fMRI data containing high head motion can be retained and used to compute meaningful brain-behavior associations for general cognitive performance and externalizing psychopathology. Applying the motion-ordered and bagging methods produced comparable brain-behavior correlations compared with the standard motion correction method when high-motion datasets collected from minoritized youth were retained. The effect sizes from the standard versus motion-ordered and bagging methods differed by a maximum of 7%. Some may consider this a small gain, but it is important to note that the proposed methods effect sizes were obtained by including more than 99% of White, Black, and Hispanic youth. This held true when using a single fMRI scan and the weakest edge in the functional connectome. This extends previous work (24) showing that we may not need to discard thousands of participants in consortia datasets, particularly across minoritized individuals, to produce meaningful brain-behavior associations. In practice, motion-ordering may be preferred for brain-behavior association studies due to its considerably lower computational demands relative to bagging (24). However, bagging may be particularly beneficial when deriving parameters/features for brain-behavior predictive models using short acquisition scans (60,61). Regardless of which method researchers opt to use, individuals do not need to be excluded, but rather that they can be retained if they have enough motion-limited timeseries data.
We focused on generating inclusive and reproducible brain-behavior relationships by retaining a large proportion of data collected from minoritized youth. Researchers also are interested in using brain-based models to predict behavior. However, predictive models often are trained on samples that lack diversity, resulting in poorer prediction of behaviors in minoritized individuals. Models trained on resting-state functional connectivity data have been found to predict a broad range of behaviors more accurately in White Americans relative to African Americans. Cognitive scores were found to be underpredicted in African Americans compared to White Americans in the ABCD Study, though predictive performance of the minoritized youth improved when the models were trained only on African Americans (62). In contrast, externalizing and internalizing behaviors were overpredicted in African Americans compared with White Americans (62). Brain-behavior models also can fail to predict behaviors from those who do not fit common neurocognitive profiles (63). Not only has model failure—misclassification of neurocognitive scores as low or high from functional connectivity—been shown to be generalizable across datasets, behaviors, and participant groups, it can be associated with sociodemographic variables (63). High-scoring participants belonging to non-White groups have been shown to be misclassified frequently as low-scoring and vice-versa for the White (not Hispanic/Latino) participants (63). Ultimately, before moving to prediction, it is important for researchers to enhance sample representation so that the data used to train these predictive models is inclusive. Our methods provide a way for improving the retention of minoritized individuals and securing a diverse sample.
Before concluding, it is important to note some limitations. First, we used ~50% of the ABCD Baseline Release. We followed DAIC and ABCC procedures to minimize potential artifacts from confounding brain-behavior associations, especially when retaining high-motion youth. However, investment in examining participant retention and potential bias across all stages of pre-processing is an important avenue for future research. Second, the proposed methods are effective for functional connectivity applications that do not rely on the continuity of the fMRI timeseries. The ranking of the motion-limited timepoints may not be desirable for traditional general linear models and intersubject correlations (64). Similarly, the two methods are not ideal for questions that aim to examine the test-retest reliability or spatial reproducibility of functional connectomes. While we retained high-motion youth using 100 motion-limited timepoints, achieving highly reliable and reproducible functional connectomes typically require much longer scan durations (36,65–71). Third, we need to replicate the motion-ordered and bagged brain-behavior associations in existing datasets that have a good representation of minoritized identities. The Human Connectome Project Development and Philadelphia Neurodevelopmental Cohort are large datasets that could potentially replicate the utility of these methods and extend the work to a broader age range to examine the impact of these methods on developmental change. Finally, the motion-ordered and bagging methods were developed to compute brain-behavior associations at the edge-level as a function of sample size. Given that edges in the functional connectome share variable behavioral relevance (36), some may not exhibit any meaningful relationship with a behavioral domain. There was no edge in the functional connectome that shared a significant association with internalizing. Future work could expand the proposed methods to examine their abilities in producing inclusive and reproducible brain-behavior associations at different levels of functional organization (e.g., component, network) (1).
In conclusion, we can generate inclusive and reproducible brain-behavior relationships using motion-limited fMRI data from low- and high-motion youth across races and ethnicities. It is our hope that these methods will reduce the tension between data quality standards and sample size requirements, and in doing so, mitigate against resource wastage and the unethical practice of discarding large numbers of participants who have given their time, effort, and trust to the research process. Ultimately, retaining high-motion minoritized populations offers the opportunity to uncover biological and clinical variability that might otherwise be missed due to underrepresentation—thereby advancing our ability to identify neural mechanisms that are relevant to these populations.
Supplementary Material
Acknowledgments
Data used in the preparation of this article were obtained from the ABCD Study® (abcdstudy.org/), held in the NIMH Data Archive (NDA). This is a multisite, longitudinal study designed to recruit more than 10,000 children aged 9–10 and follow them over 10 years into early adulthood. The ABCD Study is supported by the National Institutes of Health (NIH) and additional federal partners under award numbers: U01DA041048, U01DA050989, U01DA051016, U01DA041022, U01DA051018, U01DA051037, U01DA050987, U01DA041174, U01DA041106, U01DA041117, U01DA041028, U01DA041134, U01DA050988, U01DA051039, U01DA041156, U01DA041025, U01DA041120, U01DA051038, U01DA041148, U01DA041093, U01DA041089, U24DA041123, U24DA041147. The full list of federal supporters is available at https://abcdstudy.org/federal-partners.html. The complete lists of participating sites and study investigators can be found at https://abcdstudy.org/consortium_members/. The ABCD Consortium investigators designed and implemented the study and/or provided the data but did not necessarily participate in the analysis or writing of this report. This manuscript reflects the views of the authors and may not reflect the opinions or views of the NIH or ABCD Consortium investigators. Additional support for this work was made possible from NIEHS R01-ES032295, R01-ES031074, and R21DA057592. This work also obtained support from the Yale Kavli Institute for Neuroscience and the Wu Tsai Institute at Yale University. This work used the computational resources from the Masonic Institute for the Developing Brain (MIDB), Neuroimaging Genomics Data Resource (NGDR), and Minnesota Supercomputing Institute (MSI) at the University of Minnesota. We thank the ABCD JEDI Workgroup 3 (Responsible Use of ABCD Study Data) for the discussions regarding the motivations and findings of this study. This article has been posted as a preprint to bioRxiv (https://doi.org/10.1101/2024.06.22.600221).
Footnotes
Code Availability
The analysis code for the motion-ordered and bagging methods can be found at https://github.com/JRam02/bagging. The analysis code specific to this study can be found at https://github.com/JRam02/inclusivity. The code for processing the ABCD Study by the ABCD-BIDS Community Collection can be found at https://github.com/DCAN-Labs/abcd-hcp-pipeline. The MRI data analysis code can be found at https://github.com/ABCD-STUDY/nda-abcd-collection-3165.
CRediT Statement
Jivesh Ramduny: Conceptualization, Methodology, Validation, Formal analysis, Investigation, Data Curation, Writing — Original Draft, Writing — Review & Editing, Visualization. Lucina Q. Uddin: Investigation, Writing — Original Draft, Writing — Review & Editing. Tamara Vanderwal: Investigation, Writing — Original Draft, Writing — Review & Editing. Eric Feczko: Resources, Data Curation. Damien A. Fair: Resources, Data Curation. Clare Kelly: Methodology, Validation, Investigation, Writing — Review & Editing. Arielle Baskin-Sommers: Conceptualization, Methodology, Validation, Investigation, Writing — Original Draft, Writing — Review & Editing, Supervision, Project administration, Funding acquisition.
Disclosures
D.A.F has a financial interest in Turing Medical Inc. and may benefit financially if the company is successful in marketing FIRMM motion monitoring software products. D.A.F may receive royalty income based on FIRMM technology developed at Washington University School of Medicine and Oregon Health and Sciences University and licensed to Turing Medical Inc. D.A.F is a co-founder of Turning Medical Inc. These potential conflicts of interest have been reviewed and are managed by Washington University School of Medicine, Oregon Health and Sciences University, and the University of Minnesota. The other authors report no biomedical financial interests or potential conflicts of interest.
Data Availability
The ABCD Study is openly available following access permission granted to one or multiple NIMH Data Archive (NDA) Collections (https://nda.nih.gov/nda/access-data-info). The ABCD data repository grows and changes over time (https://nda.nih.gov/). The ABCD data used in this report came from the ABCD Collection 3165 and preprocessed using the ABCD-BIDS Community Collection from the DCAN Labs (https://nda.nih.gov/edit_collection.html?id=3165).
References
- 1.Marek S, Tervo-Clemmens B, Calabro FJ, Montez DF, Kay BP, Hatoum AS, et al. (2022): Reproducible brain-wide association studies require thousands of individuals. Nature 603:654–660. [DOI] [PMC free article] [PubMed] [Google Scholar]
- 2.Finn ES, Shen X, Scheinost D, Rosenberg MD, Huang J, Chun MM, et al. (2015): Functional connectome fingerprinting: Identifying individuals using patterns of brain connectivity. Nat Neurosci 18:1664–1671. [DOI] [PMC free article] [PubMed] [Google Scholar]
- 3.Rosenberg MD, Casey BJ, Holmes AJ. (2018): Prediction complements explanation in understanding the developing brain. Nat Commun 9:589. [DOI] [PMC free article] [PubMed] [Google Scholar]
- 4.Markiewicz CJ, Gorgolewski KJ, Feingold F, Blair R, Halchenko YO, Miller E, et al. (2021): The OpenNeuro resource for sharing of Neuroscience Data. eLife. 10. [DOI] [PMC free article] [PubMed] [Google Scholar]
- 5.Poldrack RA, Gorgolewski KJ. (2014): Making big data open: Data sharing in neuroimaging. Nat Neurosci 17:1510–1517. [DOI] [PubMed] [Google Scholar]
- 6.Milham MP, Craddock RC, Son JJ, Fleischmann M, Clucas J, Xu H, et al. (2018): Assessment of the impact of shared brain imaging data on the scientific literature. Nat Commun 9:2818. [DOI] [PMC free article] [PubMed] [Google Scholar]
- 7.Poline J-B, Breeze JL, Ghosh S, Gorgolewski K, Halchenko YO, Hanke M, et al. (2012): Data sharing in neuroimaging research. Front Neuroinform 6:9. [DOI] [PMC free article] [PubMed] [Google Scholar]
- 8.Ricard JA, Parker TC, Dhamala E, Kwasa J, Allsop A, Holmes AJ. (2023): Confronting racially exclusionary practices in the acquisition and analyses of neuroimaging data. Nat Neurosci 26:2251. [DOI] [PubMed] [Google Scholar]
- 9.Kopal J, Uddin LQ, Bzdok D. (2023): The end game: Respecting major sources of population diversity. Nat Methods 20:1122–1128. [DOI] [PubMed] [Google Scholar]
- 10.U.S. Census Bureau. (2021): American Community Survey. [Google Scholar]
- 11.Frew S, Samara A, Shearer H, Eilbott J, Vanderwal T. (2022): Getting the nod: Pediatric head motion in a transdiagnostic sample during movie- and resting-state fMRI. PLoS One 17. [DOI] [PMC free article] [PubMed] [Google Scholar]
- 12.Power JD, Mitra A, Laumann TO, Snyder AZ, Schlaggar BL, Petersen SE. (2014): Methods to detect, characterize, and remove motion artifact in resting state fMRI. Neuroimage 84:320–341. [DOI] [PMC free article] [PubMed] [Google Scholar]
- 13.Yan CG, Cheung B, Kelly C, Colcombe S, Craddock RC, Di Martino A, et al. (2013): A comprehensive assessment of regional variation in the impact of head micromovements on functional connectomics. Neuroimage 76:183–201. [DOI] [PMC free article] [PubMed] [Google Scholar]
- 14.Yan CG, Craddock RC, Zuo X-N, Zang Y-F, Milham MP. (2013): Standardizing the intrinsic brain: Towards robust measurement of inter-individual variation in 1000 functional connectomes. Neuroimage 80:246–262. [DOI] [PMC free article] [PubMed] [Google Scholar]
- 15.Van Dijk KR, Sabuncu MR, Buckner RL. (2012): The influence of head motion on intrinsic functional connectivity MRI. Neuroimage 59:431–438. [DOI] [PMC free article] [PubMed] [Google Scholar]
- 16.Power JD, Barnes KA, Snyder AZ, Schlaggar BL, Petersen SE. (2012): Spurious but systematic correlations in functional connectivity MRI networks arise from subject motion. Neuroimage 59:2142–2154. [DOI] [PMC free article] [PubMed] [Google Scholar]
- 17.Kelly C, Biswal BB, Craddock RC, Castellanos FX, Milham MP. (2012): Characterizing variation in the functional connectome: Promise and pitfalls. Trends Cogn Sci 16:181–188. [DOI] [PMC free article] [PubMed] [Google Scholar]
- 18.Satterthwaite TD, Wolf DH, Loughead J, Ruparel K, Elliott MA, Hakonarson H, et al. (2012): Impact of in-scanner head motion on multiple measures of functional connectivity: Relevance for studies of neurodevelopment in youth. Neuroimage 60:623–632. [DOI] [PMC free article] [PubMed] [Google Scholar]
- 19.Vanderwal T, Kelly C, Eilbott J, Mayes LC, Castellanos FX. (2015): Inscapes: A movie paradigm to improve compliance in functional magnetic resonance imaging. Neuroimage 122:222–232. [DOI] [PMC free article] [PubMed] [Google Scholar]
- 20.Vanderwal T, Eilbott J, Castellanos FX. (2019): Movies in the magnet: Naturalistic paradigms in developmental functional neuroimaging. Dev Cogn Neurosci 36:100600. [DOI] [PMC free article] [PubMed] [Google Scholar]
- 21.Engelhardt LE, Roe MA, Juranek J, DeMaster D, Harden KP, Tucker-Drob EM, Church JA. (2017): Children’s head motion during fMRI tasks is heritable and stable over time. Dev Cogn Neurosci 25:58–68. [DOI] [PMC free article] [PubMed] [Google Scholar]
- 22.George S, Duran N, Norris K. (2014): A systematic review of barriers and facilitators to minority research participation among African Americans, Latinos, Asian Americans, and Pacific Islanders. Am J Public Health 104. [DOI] [PMC free article] [PubMed] [Google Scholar]
- 23.Habibi A, Sarkissian AD, Gomez M, Ilari B. (2015): Developmental brain research with participants from underprivileged communities: Strategies for recruitment, participation, and retention. Mind Brain Educ 9:179–186. [Google Scholar]
- 24.Ramduny J, Vanderwal T, Kelly C. Data rescue in high-motion youth cohorts for robust and reproducible brain-behavior relationships. bioRxiv 2024.06.04.597447. [Google Scholar]
- 25.Parkes L, Fulcher B, Yücel M, Fornito A. (2018): An evaluation of the efficacy, reliability, and sensitivity of motion correction strategies for resting-state functional MRI. Neuroimage 171:415–436. [DOI] [PubMed] [Google Scholar]
- 26.Satterthwaite TD, Ciric R, Roalf DR, Davatzikos C, Bassett DS, Wolf DH. (2017): Motion artifact in studies of functional connectivity: Characteristics and mitigation strategies. Hum Brain Mapp 40:2033–2051. [DOI] [PMC free article] [PubMed] [Google Scholar]
- 27.Ciric R, Wolf DH, Power JD, Roalf DR, Baum GL, Ruparel K, et al. (2017): Benchmarking of participant-level confound regression strategies for the control of motion artifact in studies of functional connectivity. Neuroimage 154:174–187. [DOI] [PMC free article] [PubMed] [Google Scholar]
- 28.Casey BJ, Cannonier T, Conley MI, Cohen AO, Barch DM, Heitzeg MM, et al. (2018): The Adolescent Brain Cognitive Development (ABCD) study: Imaging acquisition across 21 sites. Dev Cogn Neurosci 32:43–54. [DOI] [PMC free article] [PubMed] [Google Scholar]
- 29.Mantwill M, Gell M, Krohn S, Finke C. (2022): Brain connectivity fingerprinting and behavioural prediction rest on distinct functional systems of the human connectome. Commun Biol 5(1):261. [DOI] [PMC free article] [PubMed] [Google Scholar]
- 30.Sripada C, Angstadt M, Taxali A, Clark DA, Greathouse T, Rutherford S, et al. (2021): Brain-wide functional connectivity patterns support general cognitive ability and mediate effects of socioeconomic status in youth. Transl Psychiatry 11(1):571. [DOI] [PMC free article] [PubMed] [Google Scholar]
- 31.Kurashige H, Kaneko J, Yamashita Y, Osu R, Otaka Y, Hanakawa T, et al. (2020): Revealing Relationships Among Cognitive Functions Using Functional Connectivity and a Large-Scale Meta-Analysis Database. Front Hum Neurosci 13:457. [DOI] [PMC free article] [PubMed] [Google Scholar]
- 32.Zhu J, Qiu A. (2022): Interindividual variability in functional connectivity discovers differential development of cognition and transdiagnostic dimensions of psychopathology in youth. Neuroimage 260:119482. [DOI] [PubMed] [Google Scholar]
- 33.Shen X, Finn ES, Scheinost D, Rosenberg MD, Chun MM, Papademetris X, et al. (2017): Using connectome-based predictive modeling to predict individual behavior from brain connectivity. Nat Protoc 12(3):506–518. [DOI] [PMC free article] [PubMed] [Google Scholar]
- 34.Serin E, Zalesky A, Matory A, Walter H, Kruschwitz JD. (2021): NBS-Predict: A prediction-based extension of the network-based statistic. Neuroimage 244:118625. [DOI] [PubMed] [Google Scholar]
- 35.Smith SM, Nichols TE, Vidaurre D, Winkler AM, Behrens TE, Glasser MF, et al. (2015): A positive-negative mode of population covariation links brain connectivity, demographics and behavior. Nat Neurosci 18(11):1565–7. [DOI] [PMC free article] [PubMed] [Google Scholar]
- 36.Noble S, Spann MN, Tokoglu F, Shen X, Constable RT, Scheinost D. (2017): Influences on the test–retest reliability of functional connectivity MRI and its relationship with behavioral utility. Cereb Cortex 27:5415–5429. [DOI] [PMC free article] [PubMed] [Google Scholar]
- 37.Tiego J, Martin EA, DeYoung CG, Hagan K, Cooper SE, Pasion R, et al. (2023): Precision behavioral phenotyping as a strategy for uncovering the biological correlates of psychopathology. Nat Ment Health 1(5):304–315. [DOI] [PMC free article] [PubMed] [Google Scholar]
- 38.Dhamala E, Yeo BTT, Holmes AJ. (2023): One Size Does Not Fit All: Methodological Considerations for Brain-Based Predictive Modeling in Psychiatry. Biol Psychiatry 93(8):717–728. [DOI] [PubMed] [Google Scholar]
- 39.Kotov R, Krueger RF, Watson D, Achenbach TM, Althoff RR, Bagby RM, et al. (2017): The Hierarchical Taxonomy of Psychopathology (HiTOP): A dimensional alternative to traditional nosologies. J Abnorm Psychol 126(4):454–477. [DOI] [PubMed] [Google Scholar]
- 40.Xia CH, Ma Z, Ciric R, Gu S, Betzel RF, Kaczkurkin A, et al. (2018): Linked dimensions of psychopathology and connectivity in functional brain networks. Nat Commun 9(1):3003. [DOI] [PMC free article] [PubMed] [Google Scholar]
- 41.Hagler DJ Jr, Hatton S, Cornejo MD, Makowski C, Fair DA, Dick AS, et al. (2019): Image processing and analysis methods for the Adolescent Brain Cognitive Development Study. Neuroimage 202:116091. [DOI] [PMC free article] [PubMed] [Google Scholar]
- 42.Feczko E, Conan G, Marek S, Tervo-Clemmens B, Cordova M, Doyle O, et al. Adolescent Brain Cognitive Development (ABCD) Community MRI Collection and Utilities. bioRxiv 2021.07.09.451638. [Google Scholar]
- 43.Hodes RJ, Insel TR, Landis SC, NIH Blueprint for Neuroscience Research. (2013): The NIH toolbox: setting a standard for biomedical research. Neurology 80. [DOI] [PMC free article] [PubMed] [Google Scholar]
- 44.Gershon RC, Wagster MV, Hendrie HC, Fox NA, Cook KF, Nowinski CJ. (2013): NIH toolbox for assessment of neurological and behavioral function. Neurology 80. [DOI] [PMC free article] [PubMed] [Google Scholar]
- 45.Bleck TP, Nowinski CJ, Gershon R, Koroshetz WJ. (2013): What is the NIH Toolbox, and what will it mean to neurology? Neurology 80:874–875. [DOI] [PubMed] [Google Scholar]
- 46.Achenbach TM, Rescorla LA. (2001): Manual for the ASEBA School-Age Forms & Profiles: An integrated system of multi-informant assessment. Burlington, VT: University of Vermont. [Google Scholar]
- 47.Miranda-Domínguez O, Perrone A, Earl E, Feczko E, Fair DA. DCAN BOLD Processing. OSF 2021. [Google Scholar]
- 48.Fair DA, Miranda-Dominguez O, Snyder AZ, Perrone A, Earl EA, Van AN, et al. (2020): Correction of respiratory artifacts in MRI head motion estimates. Neuroimage 208:116400. [DOI] [PMC free article] [PubMed] [Google Scholar]
- 49.Satterthwaite TD, Wolf DH, Loughead J, Ruparel K, Elliott MA, Hakonarson H, et al. (2012). Impact of in-scanner head motion on multiple measures of functional connectivity: relevance for studies of neurodevelopment in youth. Neuroimage 60(1):623–32. [DOI] [PMC free article] [PubMed] [Google Scholar]
- 50.Durston S, Tottenham N, Thomas KM, Davidson MC, Eigsti IM, Yang Y, et al. (2003): Differential patterns of striatal activation in young children with and without ADHD. Biol Psychiatry 53:871–878. [DOI] [PubMed] [Google Scholar]
- 51.Nebel MB, Lidstone DE, Wang L, Benkeser D, Mostofsky SH, Risk BB. (2022): Accounting for motion in resting-state fMRI: What part of the spectrum are we characterizing in autism spectrum disorder? Neuroimage 257:119296. [DOI] [PMC free article] [PubMed] [Google Scholar]
- 52.Gordon EM, Laumann TO, Adeyemo B, Huckins JF, Kelley WM, Petersen SE. (2016): Generation and evaluation of a cortical area parcellation from resting-state correlations. Cereb Cortex 26:288–303. [DOI] [PMC free article] [PubMed] [Google Scholar]
- 53.Power JD, Barnes KA, Snyder AZ, Schlaggar BL, Petersen SE. (2013): Steps toward optimizing motion artifact removal in functional connectivity MRI; a reply to Carp. Neuroimage 76:439–441. [DOI] [PMC free article] [PubMed] [Google Scholar]
- 54.Power JD, Schlaggar BL, Petersen SE. (2015): Recent progress and outstanding issues in motion correction in resting state fMRI. Neuroimage 105:536–551. [DOI] [PMC free article] [PubMed] [Google Scholar]
- 55.Benjamini Y, Hochberg Y. (1995): Controlling the false discovery rate: A practical and powerful approach to multiple testing. J R Stat Soc Series B Stat Methodol 57:289–300. [Google Scholar]
- 56.Lin LI. (1989): A concordance correlation coefficient to evaluate reproducibility. Biometrics 45:255. [PubMed] [Google Scholar]
- 57.Shinn M, Hu A, Turner L, Noble S, Preller KH, Ji JL, et al. (2023): Functional brain networks reflect spatial and temporal autocorrelation. Nat Neurosci 26:867–878. [DOI] [PubMed] [Google Scholar]
- 58.Altman DG. (1999): Practical Statistics for Medical Research. Chapman & Hall/CRC. [Google Scholar]
- 59.Cosgrove KT, McDermott TJ, White EJ, Mosconi MW, Thompson WK, Paulus MP, et al. (2022): Limits to the generalizability of resting-state functional magnetic resonance imaging studies of youth: An examination of ABCD study® baseline data. Brain Imaging Behav 16:1919–1925. [DOI] [PMC free article] [PubMed] [Google Scholar]
- 60.O’Connor D, Lake EMR, Scheinost D, Constable RT. (2021): Resample aggregating improves the generalizability of Connectome Predictive Modeling. Neuroimage 236:118044. [DOI] [PMC free article] [PubMed] [Google Scholar]
- 61.Wei L, Jing B, Li H. (2020): Bootstrapping promotes the RSFC-behavior associations: an application of individual cognitive traits prediction. Hum Brain Mapp 41:2302–2316. [DOI] [PMC free article] [PubMed] [Google Scholar]
- 62.Li J, Bzdok D, Chen J, Tam A, Ooi LQ, Holmes AJ, et al. (2022): Cross-ethnicity/race generalization failure of behavioral prediction from resting-state functional connectivity. Sci Adv 8. [DOI] [PMC free article] [PubMed] [Google Scholar]
- 63.Greene AS, Shen X, Noble S, Horien C, Hahn CA, Arora J, et al. (2022): Brain-phenotype models fail for individuals who defy sample stereotypes. Nature 609:109–118. [DOI] [PMC free article] [PubMed] [Google Scholar]
- 64.Nastase SA, Gazzola V, Hasson U, Keysers C. (2019): Measuring shared responses across subjects using intersubject correlation. Soc Cogn Affect Neurosci 14:667–685. [DOI] [PMC free article] [PubMed] [Google Scholar]
- 65.Ramduny J, Kelly C. (2024). Connectome-based fingerprinting: reproducibility, precision, and behavioral prediction. Neuropsychopharmacol [DOI] [PMC free article] [PubMed] [Google Scholar]
- 66.Noble S, Scheinost D, Constable RT. A decade of test-retest reliability of functional connectivity: A systematic review and meta-analysis. (2019): Neuroimage 203:116157. [DOI] [PMC free article] [PubMed] [Google Scholar]
- 67.Greene DJ, Marek S, Gordon EM, Siegel JS, Gratton C, Laumann TO, et al. Integrative and Network-Specific Connectivity of the Basal Ganglia and Thalamus Defined in Individuals. (2020): Neuron 105(4):742–758.e6. [DOI] [PMC free article] [PubMed] [Google Scholar]
- 68.Marek S, Greene DJ. Precision functional mapping of the subcortex and cerebellum. (2021): Curr Opin Behav Sci 40:12–8. [DOI] [PMC free article] [PubMed] [Google Scholar]
- 69.Marek S, Siegel JS, Gordon EM, Raut RV, Gratton C, Newbold DJ, et al. Spatial and Temporal Organization of the Individual Human Cerebellum. (2018): Neuron 100:977–993.e7. [DOI] [PMC free article] [PubMed] [Google Scholar]
- 70.Shah LM, Cramer JA, Ferguson MA, Birn RM, Anderson JS. Reliability and reproducibility of individual differences in functional connectivity acquired during task and resting state. (2016): Brain Behav 6:e00456. [DOI] [PMC free article] [PubMed] [Google Scholar]
- 71.Gordon EM, Laumann TO, Gilmore AW, Newbold DJ, Greene DJ, Berg JJ, et al. Precision functional mapping of individual human brains. (2017): Neuron 95:791–807. [DOI] [PMC free article] [PubMed] [Google Scholar]
Associated Data
This section collects any data citations, data availability statements, or supplementary materials included in this article.
Supplementary Materials
Data Availability Statement
The ABCD Study is openly available following access permission granted to one or multiple NIMH Data Archive (NDA) Collections (https://nda.nih.gov/nda/access-data-info). The ABCD data repository grows and changes over time (https://nda.nih.gov/). The ABCD data used in this report came from the ABCD Collection 3165 and preprocessed using the ABCD-BIDS Community Collection from the DCAN Labs (https://nda.nih.gov/edit_collection.html?id=3165).