

Abstract
Azobenzenes are versatile photoswitches that can be used to generate elaborate optical tools, including photopharmaceuticals. However, the targeted application‐guided design of new photoswitches with specific properties remains challenging. We have developed synthetic protocols for derivatives of the dfdc (di‐ortho‐fluoro‐di‐ortho‐chloro) azobenzene scaffold with chemical alterations in the para‐/ortho‐positions and performed an in‐depth study into the effects of their structures on their photophysical properties with an emphasis on the n → π* absorption band using NMR, UV–vis, and X‐ray analysis. The data was used to establish and validate a computational approach that allows to compute realistic UV–vis spectra by combining TD‐DFT excited‐state calculations from 6000 thermally accessible structures generated through MD simulations while considering the high structural flexibility of ortho‐substituted azobenzenes. We added 15 new visible light‐operated photoswitches to the toolbox for the development of optical devices with relaxation rates across multiple orders of magnitude and identified several examples with stronger bathochromic shifts than the dfdc azobenzene lead structure. Our combined experimental and computational study forms the foundation for the advanced in silico design and synthesis of new highly red‐shifted photoswitches. To showcase the potential of dfdc azobenzenes for the development of chemical tools, we synthesized dfdc‐OptoBI‐1 and demonstrated its biological activity as a red light‐operated activator of TRPC6 channels in HEK293 cells.
Keywords: Chemical probe development, In silico design, Photophysical properties, Red‐shifted azobenzenes
Our platform is built on a combination of chemical synthesis, NMR, UV–vis, and quantum chemical studies. The dfdc azobenzene scaffold provides efficient photoswitching with red light and the ability to fine‐tune relaxation times. A TD‐DFT‐based workflow allows the in silico design of photoswitches with properties tailored to desired applications. The strong potential is demonstrated by the development of a red light‐operated TRPC6 activator.

Introduction
Azobenzenes are versatile photoswitches that can be cycled between their cis‐ and trans‐configurations with light.[ 1 , 2 ] Due to their small size, robust photoswitching, synthetic accessibility, and low rate of photobleaching, they serve as excellent building blocks for the generation of elaborate optical tools.[ 3 , 4 , 5 , 6 ] Photopharmaceuticals, for example, contain azobenzene fragments as ON and OFF switches which allow for the control of biological functions with the spatiotemporal precision of light.[ 6 , 7 , 8 , 9 ] To elicit the full potential of these optical tools and to apply them to complex animal tissues, it is crucial to use tissue‐penetrating, non‐hazardous red or near‐infrared (NIR) light within the bio‐optical window (650–950 nm).[ 10 , 11 ] It is highly desirable to have access to an arsenal of photoswitches with candidates that are subject to thermal relaxation rates spanning multiple orders of magnitude for the less stable isomers. Slow‐relaxing photopharmaceuticals allow photoswitching between the two isomers through light pulses whereby the established photostationary state (PSS), i.e., the established cis:trans ratios, is retained over prolonged time periods. Fast‐relaxing azobenzenes require constant illumination with high intensity light for photoswitching to outcompete the thermal relaxation, which becomes difficult in deeper tissue layers.[ 12 ] However, they allow for bidirectional switching by alternating between irradiation to access the metastable state and relaxation in the dark. This holds a key advantage in case the photoswitching wavelength to access the less stable isomer falls within the biooptical window while the back‐switching requires higher energy light. In addition, the availability of a toolbox of red‐shifted azobenzene substitution patterns with relaxation half‐lives at varying time scales is beneficial to optimize photoresponsive tools to tailored applications.[ 13 ]
The thermal stability of the metastable isomer and the illumination range of azobenzenes are strongly influenced by their substitution pattern.[ 12 ] With the exception of the diazocine substitution pattern,[ 14 , 15 ] the trans‐isomer is slightly more stable than the cis [ 16 , 17 ] isomer and can be reached through thermal relaxation in the dark. A strategy to shift the isomerization to longer wavelengths entails the implementation of electron‐active structural modifications or substituting one phenyl ring for a heterocycle.[ 18 , 19 ] For example, the modification of an azobenzene group with an electron‐rich substituent shifts the trans‐to‐cis isomerization (π → π* excitation band) into the blue range of the visible spectrum and due to the rapid relaxation rate of this substitution pattern, the back‐isomerization proceeds in the dark.[ 18 ] By using a “push–pull” system, the effects that were found for electron‐rich azobenzenes are increased, which is highlighted by the cis‐isomerization with green light and a faster relaxation rate in the dark.[ 20 ] A predominant approach to allow for photoswitching with visible light is the implementation of a tetra‐ortho‐substitution pattern with electron‐active substituents.[ 21 , 22 , 23 , 24 ] This causes the n → π* transition bands between the two isomers to separate in the visible range. The underlying mechanisms can be divided into two categories: 1) A decrease in the electron density around the diazene unit, which stabilizes the n molecular orbital and leads to a hypsochromic shift by increasing the gap to the π* molecular orbital.[ 25 , 26 ] For the tetra‐ortho‐fluoro (tof) substitution pattern, for instance, this effect has a stronger impact on the cis‐state[ 26 ] which leads to a significantly increased thermal stability and enables addressing the n → π* transition to effect a cis‐ to trans‐isomerization with blue light, while allowing to selectively address the absorption band in the trans‐state to effect a cis‐isomerization with green light.[ 23 , 26 ] 2) With an increasing size of the ortho‐substituents, their repulsive interaction with the nitrogen lone pairs destabilizes the n molecular orbital, which is accompanied by a bathochromic shift through a decreased gap to the π* molecular orbital.[ 21 , 22 , 25 , 27 ] For tetra‐ortho‐chloro (toc) azobenzenes, the latter effect is stronger pronounced for the trans‐isomer, which enables the use of lower energy light to address the n → π* excitation band.[ 25 ] The resultant advantage of the toc azobenzene over the tof substitution pattern is the ability to induce a trans‐to‐cis isomerization with deep red light, which is, however, accompanied by a twisted conformation of the trans‐isomer out of the plane and a decrease in the stability of the cis isomer. Both tof and toc azobenzenes allow for near‐quantitative, bidirectional photoswitching by irradiation with visible light.[ 22 , 25 , 26 , 27 ] For tof azobenzenes, additional substitution with electron‐withdrawing groups lower n orbital energies, which results in a shift of the n → π* band toward longer wavelengths for the trans‐isomer relative to the cis‐isomer, while electron‐donating substituents have the opposite effect.[ 23 , 26 ] A study that established general principles for the design of toc azobenzenes reported a red‐shift for electron‐withdrawing and electron‐donating groups.[ 27 ]
The hybrid di‐ortho‐fluoro di‐ortho‐chloro (dfdc) azobenzene combines the advantageous properties of both the toc and tof pattern, including trans‐to‐cis isomerization with deep red light. Compared to toc substitution, it exhibits an increased separation of the n → π* excitation band between the trans‐ and cis‐isomer, which enables generating near‐quantitative PSS with high levels of trans‐ and cis‐isomers with a broader range of wavelengths. The reduced bulk of fluorine compared to chlorine leads to a near‐planar structure of the trans‐isomer and thereby establishes a closer resemblance to azobenzene (1) compared to the twisted conformation that is present with the toc substitution.[ 25 ] It was hypothesized that this feature is important to consider when red‐shifting preexisting photopharmaceuticals by exchanging azobenzene (1) for a substituted photoswitch.[ 25 , 28 ] The near‐bistable nature of both isomers is retained from the tof pattern.[ 25 ]
Due to their excellent photophysical properties, we were intrigued by the potential of the dfdc pattern as a foundation to build a toolbox of modified azobenzenes suitable for in vivo photopharmacology with excitation wavelengths within the bio‐optical window and examples with varying cis‐isomer stability levels. This study is important to assess substitution‐dependent changes in the photophysical properties that occur with modifications necessary to incorporate the photoswitches into light‐responsive tools. Our approach focused on the development of synthetic protocols for derivatives of the dfdc azobenene scaffold with various chemical alterations in the para‐/ortho‐positions and examining the effect of these substitutions on extent as well as shift of the n → π absorption band, the stability of this cis‐isomer and the resistance of both isomers toward reduction via glutathione (GSH), which is a potential deactivation mechanism of azobenzene photoswitches in vivo.[ 29 ]
In order to rationalize the experimental results and to allow for the design of new highly red‐shifted azobenzenes by predicting the impact of alternate substitutions on the photophysical properties, we used our data to establish and validate a computational platform that consists of a combination of quantum‐chemical methodologies. Remarkably, this platform allows us to calculate the UV–vis traces of the n → π* transitions, including the separation between the isomers and the extent of the excitation band tails. The term “extent of the excitation band tails” refers to the point that the absorption of the compound nears zero and is thus too low to allow productive photoswitching with the respective wavelength of light. We computed 55 distinct photoswitches and selected 20 candidates, which were synthesized as well as characterized (Figure 1). Our overall library was categorized into purely ortho‐substituted (1–16) and combinations between ortho‐ and para‐modifications (17–55). The latter was split into four categories: ortho‐halogenated azobenzenes that contain electron‐poor para‐substituents (17–37), electron‐rich para‐substituents (38–41), push–pull para‐substituents (42–49) and diverse meta‐substituents (50–55). The azobenzene cores were synthesized via the formation of diazonium salts followed by a nucleophilic addition (9, 46, and 49), oxidative aniline dimerization (2, 3, 4, and 12), or through a Bayer–Mills reaction (17, 18, 19, 20, 21, 22, 23, 24, 28, 38, 39, and 48) (cf. Supporting Information I for details). We found that with an increasing density of ortho‐substituents on the aniline and/or nitrosobenzene reaction components, the Bayer–Mills reaction becomes less likely to give the desired product. As such, a di‐ortho‐fluoro azobenzene core was established in the synthesis of 3, 4, 12, 17, 19, 20, 21, 22, 24, 28, 38, and 39 followed by late‐stage chlorination or bromination. Except for the compounds 1, 2, 4, 9, and 22, the chlorine atoms were introduced through a palladium‐catalyzed C–H di‐ortho‐chlorination or tetra‐ortho‐chlorination procedure that we have previously developed (cf. Supporting Information I for synthetic details).[ 25 , 28 ] As such, our study has significantly extended the substrate scope of this procedure and we found that electron‐rich azobenzenes are not well tolerated. This feature necessitated to synthesize amine‐substituted derivatives, such as 38, 39, and 48, by chlorinating the corresponding nitro derivatives 19 and 64, respectively, and performing a reduction. The reduction of a nitro group in the presence of a diazene unit, however, proved challenging and the use of Na2S was found to be uniquely suited to this task, albeit each substrate required the optimization of the temperature to avoid the cleavage of the N═N bond. For the synthesis of the dfdb azobenzene derivatives 4 and 22, we identified that two C–H bromination methods were suitable[ 30 , 31 ] but, although excess of the bromination reagent was used, a mono‐bromination occurred, which required to iteratively resubject the substrate to suitable conditions. An electron‐rich phenol ring is present in the push–pull azobenzene 48, which is a precursor to 46. This feature excluded the use of the C–H chlorination procedure while employing starting materials with two ortho‐substituents was not tolerated by the Bayer–Mills reaction. To circumvent these difficulties, we demonstrated that the formation of diazonium salts followed by a nucleophilic addition is excellently suited to synthesize the push–pull scaffold 48. To support the characterization of the chemical structures, X‐ray analyses were performed with the cis‐configuration of tof (2, CCDC 2387092), toc (6, CCDC 2387095) as well as carboxymethyl dfdfc (21, CCDC 2387093) and the trans‐configuration of nitro dfdc (19, CCDC 2387091) as well as the symmetrical carboxymethyl dfdc (28, CCDC 2387094) azobenzene (cf. Supporting Information II, Chapter 8).[ 32 ] Next, we experimentally determined the photophysical properties of the azobenzene derivatives and compared our data to the computational results (cf. Supporting Information III).
Figure 1.

Studied azobenzene substitution patterns: computed (blue) and computed as well as synthesized (camel).
Results and Discussion
Photophysical Study
In general, the extent and localization of the n → π* excitation bands on the azobenzene derivatives were visualized through UV–vis analyses and verified through photoswitching by illuminating the dark‐adapted compounds with light. The exact cis/trans ratios obtained with specific wavelengths were determined through NMR analysis. To ensure that the UV–vis results are comparable to the NMR data, we performed both experiments using a 500 µM concentration of the azobenzenes in a 9:1 DMSO/H2O or DMSO‐d 6/D2O mixture. Depending on the thermal stability, the relaxation half‐lives of the cis‐isomer were determined through UV–vis or NMR analysis. To assess their potential utility for in vivo applications, we investigated the stability of the azobenzene derivatives in presence of GSH in an 8:2 DMSO/PBS pH 7.4 mixture by UV–vis analysis at 37 °C.
Ortho‐Substituted Azobenzenes
To enable a direct comparison between new and literature‐known azobenzenes, we examined the tof (2), toc (6), and tetra‐ortho‐methoxy (tom) (9) substitutions as well as dfdc (3), our lead modification, using our setup.[ 21 , 22 , 25 , 26 ] We performed irradiation experiments with affordable, commercially available UV (365 nm, 0.11 mW mm−2), blue (450 nm, 0.53 mW mm−2), green (525 nm, 0.52 mW mm−2), red (650 nm, 1.12 mW mm−2), and near‐infrared (near‐IR) (740 nm, 1.18 mW mm−2) light‐emitting diodes (LEDs) to ensure the reproducibility of our results beyond our laboratory and the photoswitch community. Due to the broad beam angle of the LEDs, however, the irradiation interfered with the simultaneous measurement of an UV–vis spectra. Considering the high thermal stability of most azobenzene derivatives within our library, pausing the irradiation for the duration of a measurement (∼10 s) did not lead to a deviation in the UV–vis spectrum. However, for compounds with very short thermal half‐lives, such as the push–pull azobenzenes 48 and 49 as well as the nitro‐para‐substituted azobenzene 19, we used a more elaborate irradiation set‐up, namely the pE‐4000, with a focused optical beam of its built‐in LEDs to yield intensities of 50.1 mW mm−2 for 660 nm, 9.95 mW mm−2 for 525 nm, 50.3 mW mm−2 for 460 nm, and 50.4 mW mm−2 for 365 nm.[ 33 ]
Except for azobenzene (1) and tof azobenzene (2), which do not show photoswitching with deep red light,[ 25 ] the highest photoconversion to the cis‐isomer for the literature‐known ortho‐substituted derivatives was obtained by irradiation with 650 nm (3: trans:cis = 8:92 after 120 min; 6: trans:cis = 18:82 after 30 min; 9: trans:cis = 10:90 after 60 min). With increasing wavelengths, the absorption of the azobenzenes is decreasing, which leads to higher irradiation times and impacts the overall trans:cis ratio. To assess the extent of the n → π* band tail, the 740 nm near‐IR LED was applied to the dark‐adapted compound, which produced a trans:cis ratio of 72:28 after 1 d and 42:58 after 4 d for 3, 71:29 after 1 d, and 15:85 after 4 d for tom azobenzene (9) as well as 79:21 after 1 d and 22:78 after 4 d for toc azobenzene (6). Azobenzene (1) demonstrated the lowest molar absorption coefficient ε at the respective λ max (n → π) for the trans isomer and PSS with the highest cis‐content followed by dfdb (4), toc (6), dfdc (3), and tof (2) with tom (9) showing the highest absorbance (cf. Table 1). In contrast to azobenzene (1: t 1/2 = 3.16 h at 55 °C) and toc azobenzene (6: t 1/2 = 9 h at 55 °C), the thermal relaxation of the cis‐isomer is slowed to 3.97 h at 90 °C for tetra‐ortho‐fluoro (2), 3.7 h at 90 °C for dfdc azobenzene (3), and 3.27 h at 90 °C for tom azobenzene (9).
Table 1.
λ max (n → π*), the molar absorption coefficient ε at λ max (n → π*) and half‐life t 1/2 of the cis‐isomer from experimental and computational data.
| Experimental | Computational | ||||||||
|---|---|---|---|---|---|---|---|---|---|
| λ max (nm) | ε [] | t 1/2 (dark) cis → trans | λ max (nm) | t 1/2 cis → trans | |||||
| No. | trans (100%) | cis (PSS) | trans (100%) | cis (PSS) | Measured | Extrapolated (rt) | trans (100%) | cis (100%) | (rt) |
| 1 | 446 | 435 (64%) | 0.05 | 0.09 (64%) | 3.16 h (55 °C) | 211 h | 455 | 457 | 267 d |
| 2 | 449 | 417 (92%) | 0.11 | 0.15 (92%) | 3.97 h (90 °C) | 7.65 y | 465 | 435 | 3760 y |
| 3 | 455 | 426 (92%) | 0.08 | 0.14 (92%) | 3.7 h (90 °C) | 5.16 y | 481 | 439 | 598 y |
| 4 | 461 | 429 (83%) | 0.06 | 0.10 (83%) | 1.82 h (90 °C) | 2.16 y | 485 | 448 | 241 y |
| 6 | 461 | 442 (82%) | 0.07 | 0.12 (82%) | 9.03 h (55 °C) | 31.3 d | 493 | 461 | 1.41 y |
| 9 | 462 | 429 (92%) | 0.15 | 0.16 (92%) | 3.27 h (90 °C) | 12.3 y | 485 | 444 | 167 000 y |
| 12 | – | 434 (90%) | – | 0.09 (90%) | 60.1 min (70 °C) | 44.4 d | 485 | 444 | 1065 y |
| 17 | 460 | 428 (95%) | 0.01 | 0.02 (95%) | 69.6 min (90 °C) | 131 d | 490 | 444 | 43.4 d |
| 19 | 467 | 451 a) | 0.09 | 0.10 a) | 12.6 s (rt) | 12.6 s | 488 | 444 | 8.43 h |
| 20 | 461 | – | 0.15 | – | 25.7 min (rt) | 25.7 min | 510 | 450 | 27.1 h |
| 21 | 464 | 429 (100%) | 0.09 | 0.17 (100%) | 44.0 min (90 °C) | 104 h | 490 | 444 | 156 d |
| 22 | 467 | 432 (89%) | 0.08 | 0.14 (89%) | 27.9 min (90 °C) | 52.2 d | 485 | 455 | 40.8 d |
| 23 | 463 | 447 (87%) | 0.06 | 0.11 (87%) | 1.95 h (45 °C) | 23.6 h | 508 | 467 | 10.5 h |
| 24 | 465 | 428 (99%) | 0.09 | 0.16 (99%) | 79.0 min (90 °C) | 317 d | 488 | 444 | 8.51 y |
| 28 | 465 | 429 (77%) | 0.04 | 0.06 (77%) | 38.8 min (55 °C) | 40.3 h | 495 | 452 | 122 d |
| 38 | 380 b) , c) | 493 (73%) b) , d) | 1.98 | 0.39 (50%) | 52.2 min (60 °C) | 6.16 h | 463 | 446 | 229 d |
| 39 | 448 | 434 (90%) | 0.12 | 0.18 (90%) | 46.2 min (90 °C) | 246 d | 478 | 441 | 43.1 y |
| 46 | 467 | 439 (93%) | 0.07 | 0.10 (93%) | 4.31 h (45 °C) | 59.6 h | 481 | 446 | 90.1 h |
| 48 | – | – | – | – | 33.0 s (rt) | 33 s | 493 | 476 | 14.9 s |
| 49 | 397 b) , c) | 429 b) , d) | 1.40 | 0.53 d) | 0.12 s (rt) | 0.12 s | 481 | 446 | 42.5 h |
λ max (n → π*) was determined from a 500 µM solution for 100% trans and the highest cis‐content, including the PSS states that were measured using NMR analysis.
Irradiation with 525 nm light.
λ max was determined from a 50 µM solution.
Irradiation with 365 nm light.
Due to the strong overlap between the π → π* and n → π* bands in the UV–vis spectrum, these values cannot be unambiguously assigned to the n → π* band.
First, two design strategies were investigated to further increase the red‐shifted absorption spectrum of the dfdc azobenzene: 1) Substituting the two chlorine atoms for the larger bromine to generate the di‐ortho‐fluoro di‐ortho‐bromo (dfdb) azobenzene (4), which potentially increases the repulsive overlap with the nitrogen lone pairs; and 2) increasing the extent of the π system by using naphthyl groups (12) in place of the phenyl moieties within the azobenzene core. UV–vis analysis shows a bathochromic shift of the absorption maximum of the n → π* band from 426 nm for the PSS with the highest cis‐isomer content of the dfdc version (3) to 429 nm for the cis‐isomer of the dfdb azobenzene (4) and 434 nm for the cis‐isomer of the naphthalene‐derived 12 (cf. Table 1). Both photoswitches show faster photoswitching with 650 nm red light (cf. Figure 2). Naphthyl‐derived 12 is the most promising ortho‐substituted photoswitch, reaching its PSS with the highest cis‐content after merely 15 min (trans:cis = 10:90), while the dfdb 4 required 1 h (trans:cis = 17:83) and the dfdc 3 required 2 h (trans:cis = 8:92). Remarkably, at the same time, the dfdc azonaphthalene (12) afforded quantitative photoswitching to the trans‐isomer with 450 nm blue light. To assess whether the n → π band tail was extended into the near‐IR region, 740 nm light was subjected to the dark‐adapted compound, which produced a trans:cis ratio of 62:38 after 1 d and 28:72 after 6 d for dfdc azonaphthalene (12) as well as 70:30 after 1 d for dfdb azobenzene (4). The thermal half‐life of the cis‐isomer of dfdb 4 is 1.82 h at 90 °C, which is similar to dfdc azobenzene (3), while it is accelerated to t 1/2 = 60.1 min at 70 °C for dfdc azonaphthalene (12).
Figure 2.

a) UV–vis spectra and NMR analysis‐derived PSS (trans:cis ratios) of a) dfdc azobenzene 3, b) dfdb azobenzene 4, and c) dfdc azonaphthalene 12 (500 µM in DMSO‐d 6/D2O (9:1)).
It was discovered that the highly red‐shifted n → π absorption band tails of ortho‐substituted azobenzenes are a result of the molecular motion‐induced adaptation of near‐planar geometries of trans‐isomers that are twisted out of the plane. These transient conformational changes increase the overlap between the bulky ortho substituents and the n molecular orbitals, which concomitantly destabilizes the n molecular orbital and decreases the gap of the n to the π* orbitals.[ 25 ] As such, we reasoned that an increase in the temperature, which increases the rate of the molecular motions, could lead to faster photoswitching. Please note that, for this experiment, the irradiation was performed in a water bath, which decreased the overall light intensity that reached the sample and thus led to longer irradiation times. Remarkably, our hypothesis was valid for the dfdb azobenzene (4), whereby an increase in the temperature shortens the irradiation time with 650 nm light needed to reach the highest cis‐content from 4 h at 25 °C (trans:cis = 18:82) to 2 h at 37 °C (trans:cis = 21:79) and further to 1 h at 50 °C (trans:cis = 23:77). This difference can already be observed after 15 min, where the observed cis‐content is 9% at 25 °C, 35% at 37 °C, and 45% at 50 °C (cf. Supporting Information II, Chapter 1). Dfdc azobenzene (3) shows no significant temperature‐dependent changes in photoswitching. After 15 min, the cis‐content is 25% at 25 °C, 36% at 37 °C, and 32% at 50 °C, while the irradiation time necessary to reach the PSS with the highest cis‐isomer level is 2 h at 25 °C (trans:cis = 13:87), 1.5 h at 37 °C (trans:cis = 20:80), and 2.5 h at 50 °C (trans:cis = 11:89). It is worth noting that this experiment could not provide a rational outcome with toc azobenzene (6), since the thermal relaxation of the cis‐isomer competes with photoswitching at elevated temperatures.
Electron‐Poor Para‐Substituents
With the exception of nitro groups, the introduction of an electron‐deficient para‐substituent leads to a red‐shift of the n → π* band tail. Irradiating with 650 nm, therefore, leads to a faster photoconversion to the cis‐isomer and using 740 nm additionally allows to reach PSS with a higher cis‐content than for the corresponding non‐para‐substituted dfdc, dfdb, and toc azobenzenes. In most cases, the cis‐isomers have a high thermal stability (cf. Supporting Information II, Chapter 5). A substitution with a nitro group, however, increases the relaxation rates (19: t 1/2 = 12.6 s at rt). Complementing nitro dfdc azobenzene 19 with a carboxylic acid moiety on the opposite para‐position (20) slows the relaxation to t 1/2 = 25.7 min at rt while the same compound without the nitro group, i.e., azobenzene carboxylic acid has a long‐lived cis‐isomer (17: t 1/2 = 69.6 min at 90 °C). While the increased relaxation times did not allow us to analyze the exact PSS by NMR, UV–vis analysis shows that the highest cis‐content was reached with green and purple light. This finding highlights the ability to design dfdc‐based azobenzenes with relaxation rates across a broad time frame that spans multiple orders of magnitude, allowing versatile and highly tunable control for diverse applications.
Small changes in the electronic nature of the para‐substituent on dfdc azobenzene, such as moving from a carboxylic acid (17) to a methyl ester (21) or a methyl amide (24), result in a slight change in the photochemical behavior (cf. Figure 3) but are associated with a clear shift in the molar absorption coefficient ε (cf. Table 1). While all three derivatives show high photoconversion to the cis‐state after irradiation with 650 nm (trans:cis ratios for 17: 5:95 after 45 min; 21: 0:100 after 45 min, and 24; 1:99 after 45 min), the photoconversion with 740 nm differs from 21 (84% cis after 2 d) to 24 (64% cis after 2 d) based on the relative electron‐withdrawing properties of the substituent. While the methyl ester (21) or a methyl amide (24) substituent compared to the nonsubstituted dfdc azobenzene (3) leads to a slight increase, the carboxylic acid substituent (17) is associated with a strong decrease in the absorption (cf. Table 1). In addition, 17 suffered from a low solubility in DMSO‐d 6/D2O (9:1), which led to a precipitation out of the solution during extended measurements, hindering the determination of PSS through irradiation with 740 nm light over 2 days. All three isomers (17, 21, and 24) have long‐lived cis‐isomers whereby an increase of the relaxation half‐life can be observed from methyl ester (21, t 1/2 = 44.0 min at 90 °C) to carboxylic acid (17, t 1/2 = 69.6 min at 90 °C) and methyl amide (24, t 1/2 = 79 min at 90 °C).
Figure 3.

UV–vis spectra and NMR analysis‐derived PSS (trans:cis ratios) of a) dfdc carboxylic acid 17, b) dfdc methyl ester 21, c) dfdc methyl amide 24, d) dfdc di‐methyl ester 28, e) dfdb methyl ester 22, and f) toc methyl ester 23 (500 µM in DMSO‐d 6/D2O (9:1)).
The addition of a second methyl ester at the opposite para‐position (28) leads to a faster conversion to the cis‐isomer (77% cis after 15 min) in comparison to the mono para‐substituted methyl ester 21 (63% cis after 15 min), even though the molar absorption coefficient ε at the respective λ max (n → π) for the trans isomer and PSS with the highest cis‐content is strongly decreased (cf. Table 1). While illuminating with 525 nm (trans:cis = 58:42) and 650 nm (trans:cis = 23:77) shows a lower maximal fraction of the cis‐isomer than 21, 28 enables quantitative photoswitching to trans with 365 nm and 450 nm (trans:cis = 100:0) (cf. Figure 3). To assess whether the n → π* band tail was extended into a more red‐shifted region, 740 nm light was subjected to the dark‐adapted 28, which produced a trans:cis ratio of 48:52 after 1 d and 20:80 after 2 d. In comparison to the mono‐substituted methyl carboxylate 21, the relaxation of the disubstituted methyl ester 28 is slightly accelerated from t 1/2 = 44.0 min at 90 °C to t 1/2 = 38.8 min at 55 °C.
To assess slight changes in the ortho‐substitution pattern toward the photophysical behavior and thereby complement the results gained from the analysis of the unsubstituted dfdc (3), dfdb (4), and toc (6) azobenzenes, we synthesized derivatives with an electron‐active methyl carboxylate substituent, namely dfdb 22 and toc azobenzene 23, to compare to the dfdc version 21. All methyl ester derivatives show a faster photoconversion and lead to a higher cis‐content with 650 and 740 nm light than their nonsubstituted derivatives. At 650 nm, the highest cis‐content reached for 21: 100% after 45 min, 22: 89% after 45 min, and 23: 87% after 15 min, while at 740 nm, the highest cis‐content reached for 21: 81% after 2 d, 22: 54% after 1 d, and 23: 81% after 2 d. Even though the dfdb substitution pattern has the faster photoconversion, the extent of the cis‐isomer that can be reached is significantly lower compared to the dfdc substitution pattern. The carboxylate dfdc 21 and dfdb 22 have a slightly increased absorption compared to the purely ortho‐substituted derivatives 3 and 4, respectively, whereas toc 23 retains the molar absorptivity of 6 (cf. Table 1).
While the half‐lives of the dfdb methyl carboxylate 22 and corresponding dfdc analogue 21 lie within the same order of magnitude with t 1/2 = 27.9 min at 90 °C and 44.0 min at 90 °C, respectively, the toc substitution pattern (23) has a significantly higher relaxation rate of the cis‐isomer with t 1/2 = 1.95 h at 45 °C. These trends in the changes of the thermal half‐lives between 21, 22, and 23 are reflected in the ortho‐substituted azobenzenes 3, 4, and 6 with hydrogen atoms at both the para‐positions.
Electron‐Rich Para‐Substituents
In general, the introduction of an amine or acetamide substituent impedes the photoconversion with near‐IR light at 740 nm. While irradiating amide 39 (highest cis‐content is 90% after 1 h) with 650 nm produces similar results to the standard dfdc azobenzene (3), it requires a prolonged illumination of 7 d to reach the highest level of the cis‐isomer of 59% with 740 nm as opposed to dfdc azobenzene 3 of 52% after 4 d. These results are in line with the fact that, albeit we have added the acetamide substituent (39) to the electron‐donating category, its Hammett substituent constant σ P is 0.00, which establishes a close relationship to the hydrogen‐substituted 3.[ 34 ] The amine 38 shows no photoconversion with 740 nm and reaches a PSS with a maximal cis content of 49% with 650 nm, which requires an illumination time of 60 min (cf. Figure 4). Irradiation with 365 nm light produces the PSS with the highest cis‐isomer content of 73% for the electron‐rich 38. The molar absorption coefficient ε of amine 38 is significantly higher than that of amide 39. The absorbance of the latter (39) is marginally increased in comparison to dfdc azobenzene 3 (cf. Table 1). The half‐life of cis‐38 is decreased to t 1/2 = 52.2 min at 60 °C compared to cis‐39, which is near‐bistable with t 1/2 = 46.2 min at 90 °C.
Figure 4.

UV–vis spectra (50 µM in DMSO/H2O (9:1)) and NMR analysis‐derived (500 µM in DMSO‐d 6/D2O (9:1)) PSS (trans:cis ratios) of a) dfdc amine 38 and b) dfdc amide 39.
Push–Pull Para‐Substituents
The introduction of an electron‐donating hydroxy and an electron‐withdrawing carboxylic acid substituent at opposite para‐positions established the dfdc azobenzene 49 and a di‐methylation thereof yielded 46 with a strong and moderate push–pull effect, respectively. Compared to the electron‐poor dfdc methyl ester 21, the installation of an additional methoxy group in para‐position impedes its photoconversion with 740 nm and accelerates the photoconversion with 650 nm to a trans:cis ratio of 7:93 after 15 min. At the same time, the thermal stability of the cis‐isomer is decreased to a half‐life of t 1/2 = 4.31 h at 45 °C.
Since no toc‐derived azobenzene that hosts an electron‐donating and an electron‐withdrawing substituent on opposite para‐positions has been included in the key study that established general principles for the design of toc azobenzenes,[ 27 ] we decided to additionally prepare 48. The strong push–pull characteristics of toc‐derived 48 and dfdc‐derived 49 lead to very low thermal stabilities with t 1/2 = 33 s for cis‐48 and t 1/2 = 0.12 s for cis‐49 at room temperature. These fast relaxation rates did not allow to determine a PSS through NMR analysis. UV–vis analysis of toc‐azobenzene 48 did not show significant photoconversion, while dfdc azobenzene 49 showed significant photoconversion with 365 nm after an extended irradiation time of 5.5 h (cf. Figure 5). Due to a strong overlap between the n → π* and π → π* absorption bands, the transitions could not be clearly distinguished from each other for the azobenzene derivative 49 and for the trans‐isomer of 48 (cf. Figure 5). While the molar absorption coefficient ε, compared to dfdc azobenzene 3 is decreased for 46 with a moderate push–pull effect, the stronger electron‐donating and ‐withdrawing groups on 48 lead to a strongly increased absorbance (cf. Table 1).
Figure 5.

UV–vis spectra (50 µM in DMSO/H2O (9:1)) and NMR analysis‐derived (500 µM in DMSO‐d 6/H2O (9:1)) PSS (trans:cis ratios) of a) toc 48, b) dfdc 49, and c) dfdc 46 (50 µM in DMSO/H2O (9:1)).
Quantum Yields
We further investigated the isomerization process by determining the quantum yields (Φ E→Z, 650 nm), which are derived from UV–vis and NMR measurements (cf. Supporting Information II, Chapter 7).[ 23 ] In short, the trans → cis isomerization is induced by irradiation at 650 nm, a wavelength characterized by generally low absorbance for azobenzenes, and the absorption is measured at the λ max (n → π*) of the PSS with the highest possible cis‐content (see Table 2 for the specific λ max values) at regular intervals along with the corresponding trans:cis ratios via NMR analysis. The quantum yields were found to be in the range of 0.001–0.011 (cf. Table 2). For the four investigated ortho‐substitution patterns dfdc (3), dfdb (4), toc (6), and tom (9), we observe the highest value for toc (6) with Φ E→Z, 650 nm = 0.00446 followed by dfdb (4) with Φ E→Z, 650 nm = 0.00299. The introduction of a para‐substituent increases the quantum yield with the electron‐poor methyl ester 21 (Φ E→Z, 650 nm = 0.00395) having a stronger influence than the electron‐rich amide 39 (Φ E→Z, 650 nm = 0.00215). The greatest quantum yield was found for the push–pull azobenzene 46 (Φ E→Z, 650 nm = 0.0114), which is reflected in the short irradiation time required to generate a trans:cis ratio of 7:93.
Table 2.
Quantum yields of the trans → cis isomerization (Φ E→Z) measured in DMSO/H2O (9:1) while irradiating with 650 nm and measuring the absorbance at λ max (cis).
| Molecule | λ max (nm) | Quantum yield (Φ E→Z at 650 nm) |
|---|---|---|
| 3 | 426 (92% cis) | 0.00126 |
| 4 | 429 (83% cis) | 0.00299 |
| 6 | 442 (82% cis) | 0.00446 |
| 9 | 429 (92% cis) | 0.00222 |
| 21 | 429 (100% cis) | 0.00395 |
| 39 | 434 (90% cis) | 0.00215 |
| 46 | 439 (93% cis) | 0.0114 |
Stability Toward Glutathione
The ability of GSH to reduce and thereby inactivate the photoswitching ability of azobenzenes impedes their use in vivo.[ 29 ] As such, we investigated the stability of our azobenzene library in the presence of GSH. To a solution of 50 µM azobenzene in an 8:2 mixture of DMSO and phosphate‐buffered saline (PBS) at pH 7.4 was subjected to 10 mM GSH. All samples were studied in their dark‐adapted (trans) and illuminated (PSS were selected with a high cis content) state to assess differences in their stability toward GSH. We discovered that illumination with 365 nm leads to a decomposition of GSH itself with t 1/2 = 2.75 h at 37 °C (cf. Supporting Information II, Chapter 4).
Sulfasazaline is an azobenzene‐based small molecule prodrug that is not metabolically stable within the body. In fact, its mechanism of action relies on the reduction of the diazene group in vivo, which generates the active drug.[ 35 , 36 ] Prior studies described para‐substituted derivatives of the red‐shifted tom azobenzene (9) with, e.g., amine and amide groups, that are unstable in the presence of GSH.[ 21 , 22 , 37 ] Since tom azobenzene (9) itself is stable in our assay, we reason that para‐substituents can impede the stability of certain azobenzene scaffolds. As such, we have collectively assessed the stability of all synthesized compounds toward GSH.
Apart from the derivatives that hosted a nitro substituent, all investigated tetra‐ortho‐halogenated azobenzenes with varying functional groups in para‐position remained stable. The nitro‐substituted trans‐ 19 (cf. Figure 6) had a half‐life of 112 min in the presence of GSH. For the cis‐isomer, a two‐step process was observed with half‐lives of = 20 min and = 160 min. The addition of an acid group on the opposite para‐position yielded azobenzene 20 with a shortened half‐life of t 1/2 = 69 min for both isomers.
Figure 6.

Stability against GSH of a) the stable 39 and b) the unstable 19 (50 µM in 8:2 DMSO/PBS pH 7.4 with 10 mM GSH).
Computational Study
In order to augment and understand the experimental findings, a comprehensive quantum‐mechanical investigation was carried out for each compound in both their cis‐ and trans‐configuration. We decided to use the PBEh‐3c[ 38 ] composite scheme, which provides a consistent description of bonding and nonbonding interactions, molecular geometries, and excitation energies for a reasonable computational cost. This relatively modest computational cost, coupled with our recent advancements regarding highly efficient evaluation of hybrid‐density functional theory implemented in the FermiONs++ program,[ 39 , 40 , 41 , 42 , 43 , 44 ] allows us to go beyond minimum energy geometries. We optimized the geometry of all conformers and all possible transition structures regarding the thermal cis→trans relaxation, providing reaction energies and barriers using the most stable conformers (cf. Table 3). These computed barriers correspond to the available experimental free energy barriers with a relative error (trends between different compounds) of approximately 2 kcal mol−1 (cf. Supporting Information III).
Table 3.
Computed (Comp.) reaction energies and barriers (energy differences of most stable conformers corrected for zero‐point vibrational energies; TS – cis for barriers; trans – cis for energies) as well as experimental (Exp.) free energy barriers for thermal cis→trans back‐relaxation.
| cis→trans reaction energy (kcal mol−1) | cis→trans reaction barrier (kcal mol−1) | ||
|---|---|---|---|
| Molecule | Comp. | Exp. | Comp. |
| 1 | −11.5 | 25.6 | 27.2 |
| 2 | −6.3 | 28.6 | 32.2 |
| 3 | −5.2 | 28.5 | 31.1 |
| 4 | −5.2 | 28.0 | 30.6 |
| 6 | −5.4 | 26.3 | 27.6 |
| 9 | −2.9 | 28.4 | 34.4 |
| 12 | −5.1 | 26.0 | 31.5 |
| 17 | −5.0 | 27.7 | 26.2 |
| 19 | −5.1 | 19.2 | 24.4 |
| 20 | −5.6 | 22.0 | 24.1 |
| 21 | −5.0 | 27.4 | 26.9 |
| 22 | −5.1 | 27.0 | 26.1 |
| 23 | −5.4 | 24.5 | 23.5 |
| 24 | −5.0 | 27.8 | 28.7 |
| 28 | −5.7 | 24.6 | 27.9 |
| 38 | −7.3 | 23.3 | 27.2 |
| 39 | −6.0 | 27.4 | 29.6 |
| 46 | −6.1 | 25.0 | 24.8 |
| 48 | −7.4 | 19.7 | 18.9 |
| 49 | −6.2 | 16.4 | 24.3 |
Our previous results highlighted that the excitation wavelengths of ortho‐substituted azobenzenes are dependent on molecular motion‐dependent conformational flexibility.[ 25 ] As such, we performed ab initio MD simulations[ 45 ] for each of the 55 azobenzene derivatives, which then allowed us to compute more realistic UV–vis spectra using the whole ensemble of accessible structures obtained by the MD stimulation. By assembling a full spectrum out of 6000 individual TD‐DFT excited‐state[ 46 ] calculations per compound, we take the high structural flexibility of the investigated ortho‐substituted azobenzenes into account, particularly the nearly free rotation around both C─N bonds caused by the bulky ortho‐substituents. Finally, in order to quantify the effect of this structural flexibility on the UV–vis spectra, we computed Pearson correlation coefficients between structural features and photo‐properties. More technical details and the comprehensive data for each molecule are provided in Supporting Information III.
While significant effort has been dedicated to the development of machine learning potentials and their application to azobenzenes, we opted against a blind, large‐scale exploration.[ 47 ] Instead, it is our goal to build a “human”—not “machine”—understanding of azobenzene photochemistry and illuminate the systematic effects of various substitution patterns. This understanding provides guidance for the targeted design of biologically active photoswitches. As such, the computational study reveals a number of noteworthy trends and insights:
The mechanism for the thermal back‐relaxation can best be understood by considering the computed structures depicted in Figure 7a,b whereby the transition state features a linear C─N─N bond, and the two aryl rings are configured perpendicular to each other. This transition state is stabilized by negative charges on one side and positive charges on the opposite side. This rationalizes the shorter half‐life times of para‐substituted derivatives and, particularly, the push–pull variants 42–49 (cf. Table 1). Since this stabilization is only possible with para‐substituents, the meta‐substitution in compounds 50–55 has only little impact on thermal stability.
Likewise, the excitation energy of the n → π* band is only marginally impacted by meta‐substitution, instead being much stronger influenced by ortho‐ and para‐substituents. In particular, bulky electron‐active ortho‐substituents destabilize the occupied n orbital, mostly comprised of the lone pairs of the diazene nitrogens, via Pauli repulsion (cf. Figure 7d,e) This effect, however, only applies to the trans‐isomer, where the lone pairs reside close to the ortho‐substituents. This explains the observed ∼50 nm cis‐trans split in the maximum of the n → π* band for all investigated ortho‐substituted azobenzenes. Considering the bathochromic shift of the n → π* bands with electron‐poor para‐substituents, it is best explained by their stabilizing effect on the π* orbital through a delocalization in the π system. This delocalization is not possible with meta‐substituents due to its low probability density caused by the node in meta‐position, rationalizing the generally small impact of meta‐substitution.
Overlaying the experimental UV–vis spectra with computed spectra (cf. Figure 8), systematically shifted to account for systematic errors, shows remarkably good matching (for more details, see Supporting Information III). Please note in Figure 8 that the highest level of the cis‐isomer is reached with 365 nm for standard azobenzene (1) and 650 nm for dfdc (3) as well as toc azobenzene (6) while the highest level of the trans‐isomer is reached through thermal relaxation in the dark. In particular, the cis/trans separation matches well between computed and experimental spectra. Since our methodology takes structural flexibility into account, we were able to predict realistic line widths. Especially the broadened peak of toc azobenzene (6) matches quite accurately between theory and experiments.
In addition to naturally broad spectra, our sampling‐based approach provides detailed insights into the impact of specific structural parameters on the UV–vis spectra. The dihedral angles ψ (rotation around N─N bond) and ϕ (rotation around C─N bond, Figure 7c) are of particular interest due to their influence on the photoswitching behavior.[ 25 ] The correlations between those parameters and the excitation energy of the n → π* transition are provided in Figure 9. The high flexibility with respect to the C─N‐bond rotation (ϕ) due to the introduction of bulky ortho substituents that twist the planar conformation of trans‐azobenzene (trans‐1) (cf. Figure 9a) is clearly visible when comparing with trans‐3 (cf. Figure 9b), where the latter spans a much larger space of accessible structures.
Pearson correlation plots (cf. Figure 10) reveal a strong correlation between ϕ and the excitation energy. In particular, in‐plane configurations (cos(ϕ) = 0) of aryl rings with respect to the C─N─N plane lead to a reduction of the excitation energy (red‐shift), which may be explained by the delocalization of the π* orbital into the aryl rings, which requires a planar configuration. In addition, this effect is significantly stronger (higher correlation coefficient in Figure 10c) where the aryl ring is substituted with an electron‐poor group in para‐position, as compared to azobenzene (1) (cf. Figure 10a) and dfdc (3) (cf. Figure 10b). This is due to the resonance effect of the electron‐pulling substituent in 21 requiring conjugation of the π systems to be effective, which is only realized in planar geometries.
Figure 7.

a) Resonance structures for the transition state of the thermal relaxation of 1. b) Optimized structure for the transition state of the thermal relaxation of 3. c) Definition of dihedral angles ψ and ϕ. d) Occupied NTO for n → π* excitation of dfdc azobenzene (3). e) virtual NTO for n → π* excitation of dfdc azobenzene (3).
Figure 8.

Comparison of computational and experimental UV–vis spectra of a) azobenzene (1), b) dfdc azobenzene (2), and c) toc azobenzene (6).
Figure 9.
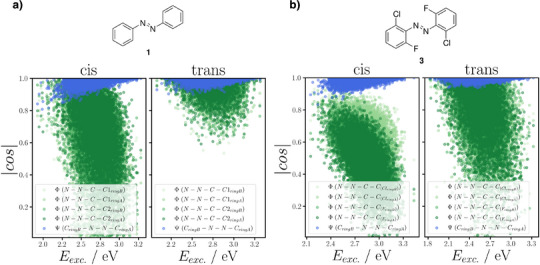
Correlation plots for cis‐ (left) and trans‐conformers (right) of a) azobenzene (1) and b) dfdc azobenzene (3) showing the relationship between excitation energy (X‐axis) and the cosine‐transformed dihedral angles (|cos| = 1 represents planar geometries; |cos| = 0 represent perpendicular geometries) in azobenzenes (Y‐axis). Green points represents the dihedral angles ϕ, measuring the rotation around the C─N bond, while blue points correspond to the central dihedral angle ψ, measuring the rotation around the N═N bond (see Figure 7c for angle definitions).
Figure 10.
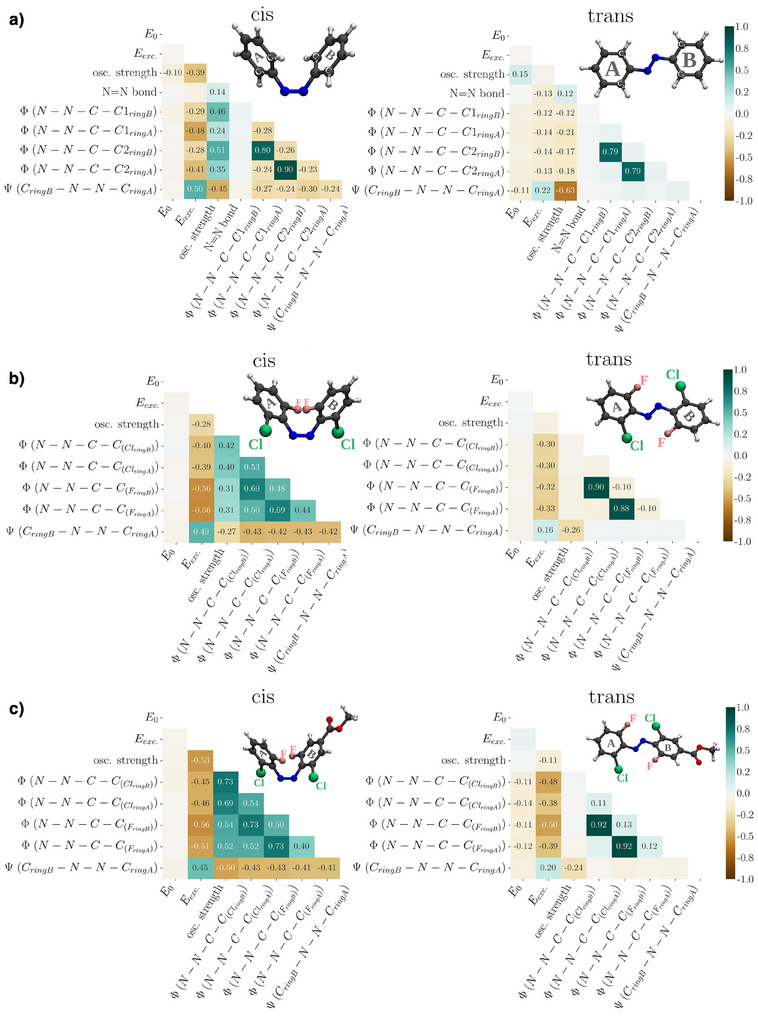
Heatmaps for cis‐ (left) and trans‐conformers (right) of a) azobenzene (1), b) dfdc azobenzene (3), and c) dfdc azobenzene with a methyl ester substitution in para‐position (21). The heatmaps show Pearson correlation coefficients between pairs of variables in the dataset. The color scale represents the strength and direction of the correlations: values close to +1 (darker brown tones) indicate strong positive correlations, values close to −1 (darker turquoise tones) indicate strong negative correlations, and values near 0 (light cream tones to white) reflect little to no correlation. Each cell corresponds to the correlation coefficient computed from 6000 thermally accessible structures that were generated through MD simulations.
Biological Study
To assess whether dfdc azobenzenes are suitable for the development of optical tools, such as photopharmaceuticals, we synthesized dfdc‐OptoBI‐1—a photoswitchable derivative of OptoBI‐1, a known activator of the transient receptor potential canonical (TRPC) channels TRPC3 and TRPC6.[ 48 , 49 ] Using our standard methods to determine the PSS showed that dfdc‐OptoBI‐1 behaves similarly to nonsubstituted dfdc azobenzene 3. The highest fraction of the cis‐isomer is reached by irradiation with 650 nm (trans:cis = 11:89) followed by green (trans:cis = 19:81) and UV light (trans:cis = 29:71) while blue light produces high levels of the trans‐isomer (trans:cis = 78:22) (cf. Figure 11a). Thermal relaxation of cis‐dfdc‐OptoBI‐1 proceeds with a half‐life of 409.7 min at 60 °C. To study the biological activity of dfdc‐OptoBI‐1, we performed whole‐cell patch‐clamp recordings on HEK293T cells overexpressing TRPC6 (cf. Figure 11b–d). Photoswitching was induced using LED illumination. In the presence of 10 µM dfdc‐OptoBI‐1, switching from blue light (440 nm) to red light (623 nm) resulted in a gradual increase or decrease in TRPC6‐mediated currents at +100 and −100 mV, respectively, indicating that red light indeed activates the TRPC6 channel (cf. Figure 11b). Switching back to blue light led to a rapid return to baseline current levels, demonstrating that the photoswitching process is reversible. Additionally, illumination with UV light (365 nm) caused a rapid activation of TRPC6 currents. Subsequent switching from UV to blue light again resulted in fast deactivation of the currents. Both red and UV light induced comparable current amplitudes and current–voltage relationships (cf. Figure 11c,d), suggesting that both wavelengths activate a similar fraction of channels and result in a comparable channel open probability. Kinetic analysis revealed that red light‐induced TRPC6 activation proceeds with a half‐life time constant of τ 1/2 = 1381 ms while UV light‐induced activation proceeds with τ 1/2 = 56 ms. Please note that the photophysical characterization of the azobenzene derivatives was performed with affordable, commercially available LEDs to ensure the reproducibility of our results beyond our laboratory and the photoswitch community, which showed that full isomerization of dfdc‐OptoBI‐1 with 650 nm was achieved after 1 h. In contrast, using high‐powered red light LEDs in biological experiments, remarkably, enables full activation of the TRPC6 channel within ∼70 s. This suggests that red light stimulation could be used together with in vivo models to study channel activity in medical contexts.
Figure 11.

PSS of dfdc‐OptoBI‐1 and electrophysiological whole‐cell measurement in HEK293T cells overexpressing TRPC6. a) UV–vis spectra (500 µM in DMSO/H2O (9:1)) and NMR analysis‐derived (500 µM in DMSO‐d 6/D2O (9:1)) structure and PSS (trans:cis ratios) of dfdc‐OptoBI‐1. b) Representative current‐time course at holding potentials of ±100 mV in the presence of 10 µM dfdc‐OptoBI‐1. Light stimulation was performed by illumination with LEDs. Blue bars represent illumination with 440 nm, red bars with 623 nm, and magenta bars with 365 nm. The half‐life time constants for the activation and deactivation kinetics are τ 1/2 = 1354 ms for activation with red light, τ 1/2 = 58 ms for activation with UV light and τ 1/2 = 55 ms for first and τ 1/2 = 88 ms for the second deactivation with blue light at +100 mV. At −100 mV, the half‐life time constants are τ 1/2 = 1381 ms for activation with red light, τ 1/2 = 56 ms for activation with UV light and τ 1/2 = 74 ms for first and τ 1/2 = 85 ms for second deactivation with blue light. Arrows show time points of selected current–voltage relationships. c) and d) Corresponding current–voltage relationships.
Conclusion
To harness ortho‐substituted azobenzenes for the development of red light‐responsive optical devices, we have established synthetic protocols for derivatives of the dfdc azobenzene scaffold with various chemical alterations in the para‐/ortho‐positions. These scaffolds were subjected to an in‐depth analysis using a combination of quantum‐mechanical, NMR, and UV–vis studies to investigate the influence of the azobenzene substitution patterns toward their photophysical properties. To eliminate one of the key obstacles for the use of the synthesized photoswitches in vivo, we have assessed their stability toward GSH, which is known to chemically reduce and thereby inactivate the photoswitching ability of azobenzenes. Remarkably, we found that, apart from nitro‐substituted derivatives, all synthesized compounds were stable to this reducing agent.
To account for the conformational flexibility of the ortho‐substituted azobenzenes, we used ab initio MD simulations, which allowed us to predict entire UV–vis spectra with realistic line width. This approach was validated using our experimental data and provides a key advancement to the field by forming the foundation for the advanced in silico design of new red‐shifted azobenzene‐based photoswitches. With this method, we deduced that the photochemical behavior of azobenzenes depends strongly on the substitution pattern in the ortho‐ and para‐positions, while meta‐substituents have only a minor influence.
The combined experimental and computational results showed that the substitution of dfdc azobenzenes in the para‐position with electron‐poor substituents leads to a red shift by providing an accelerated photoconversion to the cis‐conformation through light irradiation within the bio‐optical window (650 nm). As key factors, we identified stabilizing effects on the π* orbital and a decrease of the n → π* excitation energy, while electron‐rich para‐substituents cause a blue shift. By exploring the conformational flexibility and visualizing Pearson correlation matrices, we pinpoint important structural characteristics that influence the photoconversion. Our analysis shows that in‐plane trans‐configurations display the highest redshift. Remarkably, we discovered that accelerating the molecular motions by raising the temperature in dfdb azobenzene (4) samples, which concomitantly increases the occurrence of near‐planar conformations leads to enhanced photoswitching using red‐shifted wavelengths.
Examples that stood out among the experimentally investigated photoswitches were 12 and 28 for the ability to quantitatively switch to the trans‐state with 450 nm blue light and fast photoswitching to high levels of the cis‐isomer with 650 nm (90% for 12 and 77% for 28 after 15 min). Fast photoswitching with 650 nm light was also observed for the push–pull azobenzene 46 (93% after 15 min). Dfdc azobenzenes with one electron‐withdrawing group, particularly 21 and 24 (≥99% after 45 min) enabled quantitative photoswitching with deep red light (650 nm).
In general, the cis‐isomers of the dfdc and dfdb azobenzenes have a higher thermal stability than the standard and toc azobenzenes. The introduction of a para‐substituent results in a shortened half‐life due to the destabilization of the transition state, which is stabilized by negative charges on one aryl ring while stabilizing positive charges on the opposing aryl ring. This destabilization effect is particularly evident for the push–pull azobenzenes. All of this was rationalized by computations and confirmed through experiments.
Understanding the effect of the substitution pattern toward the photoabsorption, the thermal relaxation, the stability toward GSH in biological samples, and the influence of the structural flexibility allows us to predict photophysical properties of azobenzenes ahead of their synthesis. Our study serves as a foundational platform to guide the design, preparation, and optimization of photoswitches based on the desired application‐dependent photophysical properties and, particularly, enable the generation of optical tools that can be operated with red light.
Remarkably, since our first report on the dfdc azobenzene substitution pattern, their application for the development of optical devices has been investigated. A computational study has assessed the use of this substitution pattern to generate photoswitchable anion receptors with enhanced optical properties,[ 50 ] while an experimental study has described phase change materials for the controlled heat storage and triggered release.[ 51 ] In the latter, the dfdc azobenzene allowed the spontaneous energy storage with filtered sunlight while achieving a high thermal stability of Z isomers.
To showcase that the described azobenzene derivatives can be employed to generate red light‐operated photopharmaceuticals, which allow isomerization in biologically relevant time frame, we have incorporated the dfdc substitution pattern into OptoBI‐1 to generate dfdc‐OptoBI‐1. OptoBI‐1 is a photoswitchable chemical probe that has been used to control TRPC3 and TRPC6 channels with the spatiotemporal precision of light. By using whole‐cell patch‐clamp recordings on HEK293T cells overexpressing TRPC6, we demonstrated that, remarkably, the installation of the dfdc substitution pattern retains the biological activity of OptoBI‐1 and allows full activation of the TRPC6 channel with red light within ∼70 s. Altogether, our experiments validate dfdc‐OptoBI‐1 as a novel chemical tool for precise spatiotemporal control of TRPC6 channel activity that constitutes a major advancement that holds the potential for future applications in organs, tissues, and living organisms.
Supporting Information
Full details about the experimental procedures and the structural analysis (Supporting Information I, PDF) as well as photostationary states, reversible photoswitching, stability against GSH, and thermal relaxation measurements (Supporting Information II, PDF) are available. X‐ray crystallographic data of cis‐tof (2, CCDC 2387092), cis‐toc (6, CCDC 2387095), cis‐carboxymethyl dfdc (21, CCDC 2387093), trans‐dfdc (19, CCDC 2387091), and trans‐symmetrical carboxymethyl dfdc (28, CCDC 2387094) azobenzene were uploaded to the CCDC database.[ 23 , 25 , 26 , 32 , 52 , 53 , 54 , 55 , 56 , 57 , 58 , 59 , 60 ] Full details about the used quantum‐chemical methods, ab initio MD simulations and TD‐DFT calculations. Summaries of the computed spectroscopical and thermochemical properties for the cis‐ and trans‐isomers of all compounds are available. Details about the correlation analysis and Pearson correlation matrices for selected compounds with different substitution patterns (1, 3, 4, 6—no meta/para‐substituents; 21, 28—electron‐poor para substituents, 39—electron‐rich para‐substituents, and 46—push–pull substituents). Computed absorption spectra and natural transition orbitals for all molecules in the trans‐ and cis‐configurations are included. Benchmarks of computed reaction barriers and excitation energies employing different density functionals are available (cf. Supporting Information III, PDF).[ 38 , 39 , 46 , 61 , 62 , 63 , 64 , 65 , 66 , 67 , 68 , 69 , 70 , 71 , 72 , 73 , 74 , 75 , 76 , 77 , 78 , 79 , 80 , 81 , 82 , 83 ] The .xyz files for optimized structures and MD trajectories have been deposited to Zenodo (https://doi.org/10.5281/zenodo.15441450). Full details on the biological investigation of dfdc‐OptoBI‐1 are available (Supporting Information IV, PDF).
Conflict of Interests
The authors declare no conflict of interest.
Supporting information
Supporting Information
Supporting Information
Supporting Information
Supporting Information
Acknowledgements
The authors thank C. Glas for her help with the NMR measurements, Prof. Dr. Oliver Thorn‐Seshold for hosting reversible photoswitching measurements, and Dr. J. Kussmann (LMU Munich) for providing a development version of the FermiONs++ program package. DBK is grateful to the Fonds der Chemischen Industrie for a Liebig fellowship. This project was further funded by the Deutsche Forschungsgemeinschaft (DFG) via the project no. ME 2456/4‐1 to MMyS and the SFB TRR152 (P26, INST 86/2137‐1, grant no. 239283807) to DBK and US. CO acknowledges financial support by the DFG through the “e‐conversion” cluster of excellence (EXC 2089/1‐390776260), grant CRC 325 “Assembly Controlled Chemical Photocatalysis” (grant no. 444632635), and additional support as Max‐Planck‐Fellow at the Max Planck Institute for Solid State Research (MPI‐FKF) Stuttgart. HL acknowledges financial DFG through the Walter Benjamin Program (grant no. 529879166). The authors thank local research clusters and centers such as the Center of Nanoscience (CeNS) for providing communicative networking structures.
Open access funding provided by Universitat Wien/KEMÖ.
Lützel K., Laqua H., Sathian M. B., Nißl B., Szántó J. K., Senser C.‐A., Savasci G., Allmendinger L., Kicin B., Ruf V., Kammerer D., Lohmüller T., Karaghiosoff K., Ali A. M., Storch U., Mederos y Schnitzler M., Ochsenfeld C., Konrad D. B., Angew. Chem. Int. Ed. 2025, 64, e202501779. 10.1002/anie.202501779
Contributor Information
Prof. Dr. Ursula Storch, Email: ursula.storch@chemie.uni-regensburg.de.
Prof. Dr. Michael Mederos y Schnitzler, Email: mederos@lrz.uni-muenchen.de.
Prof. Dr. Christian Ochsenfeld, Email: c.ochsenfeld@fkf.mpg.de.
Prof. Dr. David B. Konrad, Email: david.benjamin.konrad@univie.ac.at.
Data Availability Statement
The data that support the findings of this study are available in the Supporting Information of this article.
References
- 1. Bandara H. M. D., Burdette S. C., Chem. Soc. Rev. 2012, 41, 1809–1825. [DOI] [PubMed] [Google Scholar]
- 2. Hartley G. S., Nature 1937, 140, 281–281. [Google Scholar]
- 3. Merino E., Chem. Soc. Rev. 2011, 40, 3835. [DOI] [PubMed] [Google Scholar]
- 4. Dong L., Feng Y., Wang L., Feng W., Chem. Soc. Rev. 2018, 47, 7339–7368. [DOI] [PubMed] [Google Scholar]
- 5. Brieke C., Rohrbach F., Gottschalk A., Mayer G., Heckel A., Angew. Chem. Int. Ed. 2012, 51, 8446–8476. [DOI] [PubMed] [Google Scholar]
- 6. Hüll K., Morstein J., Trauner D., Chem. Rev. 2018, 118, 10710–10747. [DOI] [PubMed] [Google Scholar]
- 7. Beharry A. A., Woolley G. A., Chem. Soc. Rev. 2011, 40, 4422. [DOI] [PubMed] [Google Scholar]
- 8. Fuchter M. J., J. Med. Chem. 2020, 63, 11436–11447. [DOI] [PubMed] [Google Scholar]
- 9. Kobauri P., Dekker F. J., Szymanski W., Feringa B. L., Angew. Chem. Int. Ed. 2023, 62, e202300681. [DOI] [PubMed] [Google Scholar]
- 10. Weissleder R., Nat. Biotechnol. 2001, 19, 316–317. [DOI] [PubMed] [Google Scholar]
- 11. Smith A. M., Mancini M. C., Nie S., Nat. Nanotechnol. 2009, 4, 710–711. [DOI] [PMC free article] [PubMed] [Google Scholar]
- 12. Dong M., Babalhavaeji A., Samanta S., Beharry A. A., Woolley G. A., Acc. Chem. Res. 2015, 48, 2662–2670. [DOI] [PubMed] [Google Scholar]
- 13. Küllmer F., Vepřek N. A., Borowiak M., Nasufović V., Barutzki S., Thorn‐Seshold O., Arndt H.‐D., Trauner D., Angew. Chem. Int. Ed. 2022, 61, e202210220; [DOI] [PMC free article] [PubMed] [Google Scholar]; Angew. Chem. 2022, 134, e202210220. [DOI] [PMC free article] [PubMed] [Google Scholar]
- 14. Siewertsen R., Neumann H., Buchheim‐Stehn B., Herges R., Näther C., Renth F., Temps F., J. Am. Chem. Soc. 2009, 131, 15594–15595. [DOI] [PubMed] [Google Scholar]
- 15. Hammerich M., Schütt C., Stähler C., Lentes P., Röhricht F., Höppner R., Herges R., J. Am. Chem. Soc. 2016, 138, 13111–13114. [DOI] [PubMed] [Google Scholar]
- 16. Gagliardi L., Orlandi G., Bernardi F., Cembran A., Garavelli M., Theor. Chem. Acc. 2004, 111, 363–372. [DOI] [PubMed] [Google Scholar]
- 17. Merino E., Ribagorda M., Beilstein J. Org. Chem. 2012, 8, 1071–1090. [DOI] [PMC free article] [PubMed] [Google Scholar]
- 18. Kienzler M. A., Reiner A., Trautman E., Yoo S., Trauner D., Isacoff E. Y., J. Am. Chem. Soc. 2013, 135, 17683–17686. [DOI] [PMC free article] [PubMed] [Google Scholar]
- 19. Steinmüller S. A. M., Odaybat M., Galli G., Prischich D., Fuchter M. J., Decker M., Chem. Sci. 2024, 15, 5360–5367. [DOI] [PMC free article] [PubMed] [Google Scholar]
- 20. Broichhagen J., Schönberger M., Cork S. C., Frank J. A., Marchetti P., Bugliani M., Shapiro A. M. J., Trapp S., Rutter G. A., Hodson D. J., Trauner D., Nat. Commun. 2014, 5, 5116. [DOI] [PMC free article] [PubMed] [Google Scholar]
- 21. Beharry A. A., Sadovski O., Woolley G. A., J. Am. Chem. Soc. 2011, 133, 19684–19687. [DOI] [PubMed] [Google Scholar]
- 22. Samanta S., Beharry A. A., Sadovski O., McCormick T. M., Babalhavaeji A., Tropepe V., Woolley G. A., J. Am. Chem. Soc. 2013, 135, 9777–9784. [DOI] [PubMed] [Google Scholar]
- 23. Knie C., Utecht M., Zhao F., Kulla H., Kovalenko S., Brouwer A. M., Saalfrank P., Hecht S., Bléger D., Chem. Eur. J. 2014, 20, 16492–16501. [DOI] [PubMed] [Google Scholar]
- 24. Kerckhoffs A., Christensen K. E., Langton M. J., Chem. Sci. 2022, 13, 11551–11559. [DOI] [PMC free article] [PubMed] [Google Scholar]
- 25. Konrad D. B., Savasci G., Allmendinger L., Trauner D., Ochsenfeld C., Ali A. M., J. Am. Chem. Soc. 2020, 142, 6538–6547. [DOI] [PMC free article] [PubMed] [Google Scholar]
- 26. Bléger D., Schwarz J., Brouwer A. M., Hecht S., J. Am. Chem. Soc. 2012, 134, 20597–20600. [DOI] [PubMed] [Google Scholar]
- 27. Lameijer L. N., Budzak S., Simeth N. A., Hansen M. J., Feringa B. L., Jacquemin D., Szymanski W., Angew. Chem. Int. Ed. 2020, 59, 21663–21670. [DOI] [PMC free article] [PubMed] [Google Scholar]
- 28. Konrad D. B., Frank J. A., Trauner D., Chem. Eur. J. 2016, 22, 4364–4368. [DOI] [PubMed] [Google Scholar]
- 29. Boulègue C., Löweneck M., Renner C., Moroder L., ChemBioChem 2007, 8, 591–594. [DOI] [PubMed] [Google Scholar]
- 30. Liu Q., Luo X., Wei S., Wang Y., Zhu J., Liu Y., Quan F., Zhang M., Xia C., Tetrahedron Lett. 2019, 60, 1715–1719. [Google Scholar]
- 31. John A., Nicholas K. M., J. Org. Chem. 2012, 77, 5600–5605. [DOI] [PubMed] [Google Scholar]
- 32. Deposition numbers CCDC 2387092 (for 2), CCDC 2387095 (for 6), CCDC 2387091 (for 19), CCDC 2387093 (for 21), and CCDC 2387091 (for 28) contain the supplementary crystallographic data for this paper. These data are provided free of charge by the joint Cambridge Crystallographic Data Centre and Fachinformationszentrum Karlsruhe Access Structures service.
- 33. Baumgartner B., Glembockyte V., Gonzalez‐Hernandez A. J., Valavalkar A., Mayer R. J., Fillbrook L. L., Müller‐Deku A., Zhang J., Steiner F., Gross C., Reynders M., Munguba H., Arefin A., Ofial A., Beves J. E., Lohmueller T., Dietzek‐Ivanšic B., Broichhagen J., Tinnefeld P., Levitz J., Thorn‐Seshold O., ChemRxiv. 2024, 10.26434/chemrxiv-2024-vm4n3. [DOI] [Google Scholar]
- 34. Hansch C., Leo A., Taft R. W., Chem. Rev. 1991, 91, 165–195. [Google Scholar]
- 35. Fan X., Hao H., Shen X., Chen F., Zhang J., J. Hazard. Mater. 2011, 190, 493–500. [DOI] [PubMed] [Google Scholar]
- 36. Gaginella T. S., Walsh R. E., Dig. Dis. Sci. 1992, 37, 801–812. [DOI] [PubMed] [Google Scholar]
- 37. Dong M., Babalhavaeji A., Collins C. V., Jarrah K., Sadovski O., Dai Q., Woolley G. A., J. Am. Chem. Soc. 2017, 139, 13483–13486. [DOI] [PubMed] [Google Scholar]
- 38. Grimme S., Brandenburg J. G., Bannwarth C., Hansen A., J. Chem. Phys. 2015, 143, 054107. [DOI] [PubMed] [Google Scholar]
- 39. Kussmann J., Ochsenfeld C., J. Chem. Phys. 2013, 138, 134114. [DOI] [PubMed] [Google Scholar]
- 40. Kussmann J., Ochsenfeld C., J. Chem. Theory Comput. 2015, 11, 918–922. [DOI] [PubMed] [Google Scholar]
- 41. Peters L. D. M., Kussmann J., Ochsenfeld C., J. Chem. Theory Comput. 2017, 13, 5479–5485. [DOI] [PubMed] [Google Scholar]
- 42. Kussmann J., Laqua H., Ochsenfeld C., J. Chem. Theory Comput. 2021, 17, 1512–1521. [DOI] [PubMed] [Google Scholar]
- 43. Laqua H., Kussmann J., Ochsenfeld C., J. Chem. Phys. 2021, 154, 214116. [DOI] [PubMed] [Google Scholar]
- 44. Laqua H., Dietschreit J. C. B., Kussmann J., Ochsenfeld C., J. Chem. Theory Comput. 2022, 18, 6010–6020. [DOI] [PubMed] [Google Scholar]
- 45. Niklasson A. M. N., Steneteg P., Odell A., Bock N., Challacombe M., Tymczak C. J., Holmström E., Zheng G., Weber V., J. Chem. Phys. 2009, 130, 214109. [DOI] [PubMed] [Google Scholar]
- 46. Casida M. E., in Recent Advances in Density Functional Methods, World Scientific, Singapore, 1995, pp. 155–192. [Google Scholar]
- 47. Axelrod S., Shakhnovich E., Gómez‐Bombarelli R., Nat. Commun. 2022, 13, 3440. [DOI] [PMC free article] [PubMed] [Google Scholar]
- 48. Keck M., Hermann C., Lützel K., Gudermann T., Konrad D. B., y Schnitzler M. M., Storch U., iScience 2024, 27, 111008. [DOI] [PMC free article] [PubMed] [Google Scholar]
- 49. Tiapko O., Shrestha N., Lindinger S., de la Cruz G. G., Graziani A., Klec C., Butorac C., Graier W. F., Kubista H., Freichel M., Birnbaumer L., Romanin C., Glasnov T., Groschner K., Chem. Sci. 2019, 10, 2837–2842. [DOI] [PMC free article] [PubMed] [Google Scholar]
- 50. Lv S., Li X., Yang L., Ren H., Jiang J., Chem. Phys. 2021, 548, 111246. [Google Scholar]
- 51. Shi Y., Gerkman M. A., Qiu Q., Zhang S., Han G. G. D., J. Mater. Chem. A 2021, 9, 9798–9808. [Google Scholar]
- 52. Bruker Instrument Service v3.0.21 , n.d.
- 53. SAINT V8.18C , 2011.
- 54. APEX2 V2012.4‐3 , n.d.
- 55. SHELXS‐97: Program for Crystal Structure Solution 1997.
- 56. SHELXL‐97: Program for the Refinement of Crystal Structures 1997.
- 57. Platon: A Multipurpose Crystallographic Tool 1999.
- 58. Hansen M. J., Lerch M. M., Szymanski W., Feringa B. L., Angew. Chem. Int. Ed. 2016, 55, 13514–13518. [DOI] [PubMed] [Google Scholar]
- 59. Fujimoto R. A., Mcquire L. W., Monovich L. G., Mugrage B. B., Parker D. T., Duzer J. H. V., Wattanasin S., WO2004048314A1, 2004.
- 60. Runtsch L. S., Barber D. M., Mayer P., Groll M., Trauner D., Broichhagen J., Beilstein J. Org. Chem. 2015, 11, 1129–1135. [DOI] [PMC free article] [PubMed] [Google Scholar]
- 61. Pracht P., Grimme S., Bannwarth C., Bohle F., Ehlert S., Feldmann G., Gorges J., Muller M., Neudecker T., Plett C., Spicher S., Steinbach P., Wesolowski P. A., Zeller F., J. Chem. Phys. 2024, 160, 114110. [DOI] [PubMed] [Google Scholar]
- 62. Grimme S., Bannwarth C., Shushkov P., J. Chem. Theory Comput. 2017, 13, 1989–2009. [DOI] [PubMed] [Google Scholar]
- 63. Bannwarth C., Ehlert S., Grimme S., J. Chem. Theory Comput. 2019, 15, 1652–1671. [DOI] [PubMed] [Google Scholar]
- 64. Grimme S., Bannwarth C., Caldeweyher E., Pisarek J., Hansen A., J. Chem. Phys. 2017, 147, 161708. [DOI] [PubMed] [Google Scholar]
- 65. Kussmann J., Beer M., Ochsenfeld C., Wiley Interdiscip. Rev. Comput. Mol. Sci. 2013, 3, 614–636. [Google Scholar]
- 66. Kastner J., Carr J. M., Keal T. W., Thiel W., Wander A., Sherwood P., J. Phys. Chem. A 2009, 113, 11856–11865. [DOI] [PubMed] [Google Scholar]
- 67. Lu Y., Farrow M. R., Fayon P., Logsdail A. J., Sokol A. A., Catlow C. R. A., Sherwood P., Keal T. W., J. Chem. Theory Comput. 2019, 15, 1317–1328. [DOI] [PubMed] [Google Scholar]
- 68. Bussi G., Donadio D., Parrinello M., J. Chem. Phys. 2007, 126, 014101. [DOI] [PubMed] [Google Scholar]
- 69. Perdew J. P., Burke K., Ernzerhof M., Phys. Rev. Lett. 1996, 77, 3865–3868. [DOI] [PubMed] [Google Scholar]
- 70. Adamo C., Barone V., J. Chem. Phys. 1999, 110, 6158–6170. [Google Scholar]
- 71. Ernzerhof M., Scuseria G. E., J. Chem. Phys. 1999, 110, 5029–5036. [Google Scholar]
- 72. Weigend F., Ahlrichs R., Phys. Chem. Chem. Phys. 2005, 7, 3297. [DOI] [PubMed] [Google Scholar]
- 73. Goerigk L., Hansen A., Bauer C., Ehrlich S., Najibi A., Grimme S., Phys. Chem. Chem. Phys. 2017, 19, 32184–32215. [DOI] [PubMed] [Google Scholar]
- 74. Silva‐Junior M. R., Schreiber M., Sauer S. P. A., Thiel W., J. Chem. Phys. 2008, 129, 104103. [DOI] [PubMed] [Google Scholar]
- 75. Truong T. N., Stefanovich E. V., Chem. Phys. Lett. 1995, 240, 253–260. [Google Scholar]
- 76. Barone V., Cossi M., J. Phys. Chem. A 1998, 102, 1995–2001. [Google Scholar]
- 77. Mueller M., Hansen A., Grimme S., J. Chem. Phys. 2023, 158, 014103. [DOI] [PubMed] [Google Scholar]
- 78. Furness J. W., Kaplan A. D., Ning J., Perdew J. P., Sun J., J. Phys. Chem. Lett. 2020, 11, 8208–8215. [DOI] [PubMed] [Google Scholar]
- 79. Rohrdanz M. A., Martins K. M., Herbert J. M., J. Chem. Phys. 2009, 130, 054112. [DOI] [PubMed] [Google Scholar]
- 80. Mardirossian N., Head‐Gordon M., J. Chem. Phys. 2015, 142, 074111. [DOI] [PubMed] [Google Scholar]
- 81. Mardirossian N., Head‐Gordon M., Phys. Chem. Chem. Phys. 2014, 16, 9904. [DOI] [PubMed] [Google Scholar]
- 82. Tajti A., Tulipán L., Szalay P. G., J. Chem. Theory Comput. 2020, 16, 468–474. [DOI] [PubMed] [Google Scholar]
- 83. Schirmer J., Phys. Rev. A 1982, 26, 2395–2416. [Google Scholar]
Associated Data
This section collects any data citations, data availability statements, or supplementary materials included in this article.
Supplementary Materials
Supporting Information
Supporting Information
Supporting Information
Supporting Information
Data Availability Statement
The data that support the findings of this study are available in the Supporting Information of this article.