

Abstract
The mechanisms by which mRNA sequences specify translational control remain poorly understood in mammalian cells. Here we generate a transcriptome-wide atlas of translation efficiency (TE) measurements encompassing more than 140 human and mouse cell types from 3,819 ribosomal profiling datasets. We develop RiboNN, a state-of-the-art multitask deep convolutional neural network, and classic machine learning models to predict TEs in hundreds of cell types from sequence-encoded mRNA features. While most earlier models solely considered the 5′ untranslated region (UTR) sequence, RiboNN integrates how the spatial positioning of low-level dinucleotide and trinucleotide features (that is, including codons) influences TE, capturing mechanistic principles such as how ribosomal processivity and tRNA abundance control translational output. RiboNN predicts the translational behavior of base-modified therapeutic RNA and explains evolutionary selection pressures in human 5′ UTRs. Finally, it detects a common language governing mRNA regulatory control and highlights the interconnectedness of mRNA translation, stability and localization in mammalian organisms.
Protein abundances are determined by the complex interplay of steady-state mRNA levels, mRNA translation rates and protein turnover rates. Numerous machine learning (ML) models have been developed to model the sequence-encoded features that influence steady-state levels of mammalian mRNAs from both the perspectives of transcriptional regulation1–6 and mRNA turnover7. However, most attempts to model translational regulation from mRNA sequence have focused on bacteria and yeast8–13. Although such models do exist for mammals, most focus on the functional roles of specific regions such as the 5′ untranslated region (UTR)14–16 or coding region sequence (CDS)17–19, despite the recognition that the full mRNA sequence (that is, including 3′ UTRs) jointly influences translation20–23. Several models consider full-length mRNA but have either only implicitly modeled translational regulation24,25 or have evaluated only a limited set of cell types while achieving modest performance (r2 ≈ 0.40)26,27. Modeling translational regulation more precisely among diverse cell types would elucidate the functional consequences of synonymous, missense and noncoding mutations in mRNA. Consequently, this would advance the goals of identifying the mechanistic underpinnings of ribosome occupancy and protein abundance quantitative trait loci (rQTL and pQTL, respectively)28,29, diagnosing pathogenic genetic variants and designing more translationally competent mRNA therapeutics and gene therapies.
Global translation rates can be estimated through several strategies, including fitting translation rate parameters from differential equations, using measurements of mRNA and protein abundances as well as mRNA half-life30,31; computing protein-to-mRNA ratios (PTRs)24,25,32; polysome profiling, in which ribosomal fractions are run on a sucrose gradient and mRNAs within each fraction are sequenced to estimate their approximate ribosomal loading14,15,21,33; and ribosome profiling (that is, Ribo-seq), normalizing ribosome density to RNA abundance as a metric for translation efficiency (TE)34. Of these techniques, the first two strategies are both indirect estimates of translation rate. Notably, inferred translation rates from the differential equation modeling strategy were shown to be poorly related to experimentally measured rates35, limiting the accuracy of this approach. Moreover, PTRs are partially confounded by protein degradation rates and protein secretion24,25,32. Therefore, of these four methods, polysome and ribosome profiling are considered more direct methods of assessing translation rates35.
In eukaryotes, translation is regulated at the initiation and elongation steps36,37, which can be modulated by cis-acting sequences. In particular, cis-regulation of translation initiation has historically been the focus due to its recognition as the rate-limiting step of translation38. The propensity for secondary structure near the 5′ mRNA cap, the sequence context of the translation initiation codon, the presence of upstream short open reading frames (ORFs) and binding sites for various RNA-binding proteins (RBPs) provide concrete mechanisms of translational regulation via cis-acting elements predominantly in 5′ UTRs39. Notably, the protein-coding sequence is also a key determinant of TE. Relatively more is known in unicellular organisms; in particular, codon usage differs substantially across genes, with more abundant proteins using a biased set of codons40,41. The most widely recognized mechanism for codon-specific influence on translation relates to differences in the active pool of corresponding tRNAs42–44. Coding sequence differences are also suggested to impact protein expression through secondary structure-mediated mechanisms that do not correlate with tRNA abundance45. Moreover, nonsynonymous coding variants can alter translation independently from tRNA abundance, translation initiation efficiency or overall mRNA structure via the interaction of the encoded peptide with the ribosome exit tunnel46. Parallel work in vertebrate organisms established a link between translation and RNA stability; for instance, certain codons that slow down translation are associated with unstable mRNA17,47–52. Taken together, these studies reveal that the entire mRNA sequence can potentially modulate translation through a variety of mechanisms. However, the contribution of specific functional regions in determining translation of endogenous mRNAs has yet to be described quantitatively. A precise measurement of translation rate would enable a clear-eyed examination of how different sequence properties and functional regions modulate translation rates relative to one another.
Despite the widespread abundance of ribosomal profiling datasets, attempts to examine the relative contribution of sequence and structural features to the specification of translation rate have been hampered by their inaccessibility in a unified resource. In this study, we systematically assembled a compendium of 1,282 human and 995 mouse ribosome profiling datasets, matched to corresponding RNA-sequencing (RNA-seq) data, to derive more precise TE measurements in mammalian cells. Using enhanced measurements of TE, we derived improved sequence-based models to improve the predictability of TE from RNA sequence. Our model RiboNN, a deep convolutional neural network, can predict the effects of RNA sequences, including base-modified, therapeutically delivered mRNA, on translational regulation, in agreement with functional measurements derived from massively parallel reporter assays and population genetic data demarcating regions of evolutionary constraint. RiboNN reconciles several limitations of existing models, possessing the following properties: it models the impact of the full-length mRNA sequence on TE in numerous cell types; it exhibits superior performance in predicting TE from mRNA sequence; it identifies the location-dependent effects of short, dinucleotide and trinucleotide features (that is, including codons) as the key sequence features explaining model performance; and it helps to quantify the relative contributions of different functional regions on TE, a feat that has largely been evaluated qualitatively in the past. Finally, it postulates the existence of a common language underpinning mRNA translation, stability and localization in mammalian organisms.
Results
Preparation of a compendium of human and mouse TE datasets
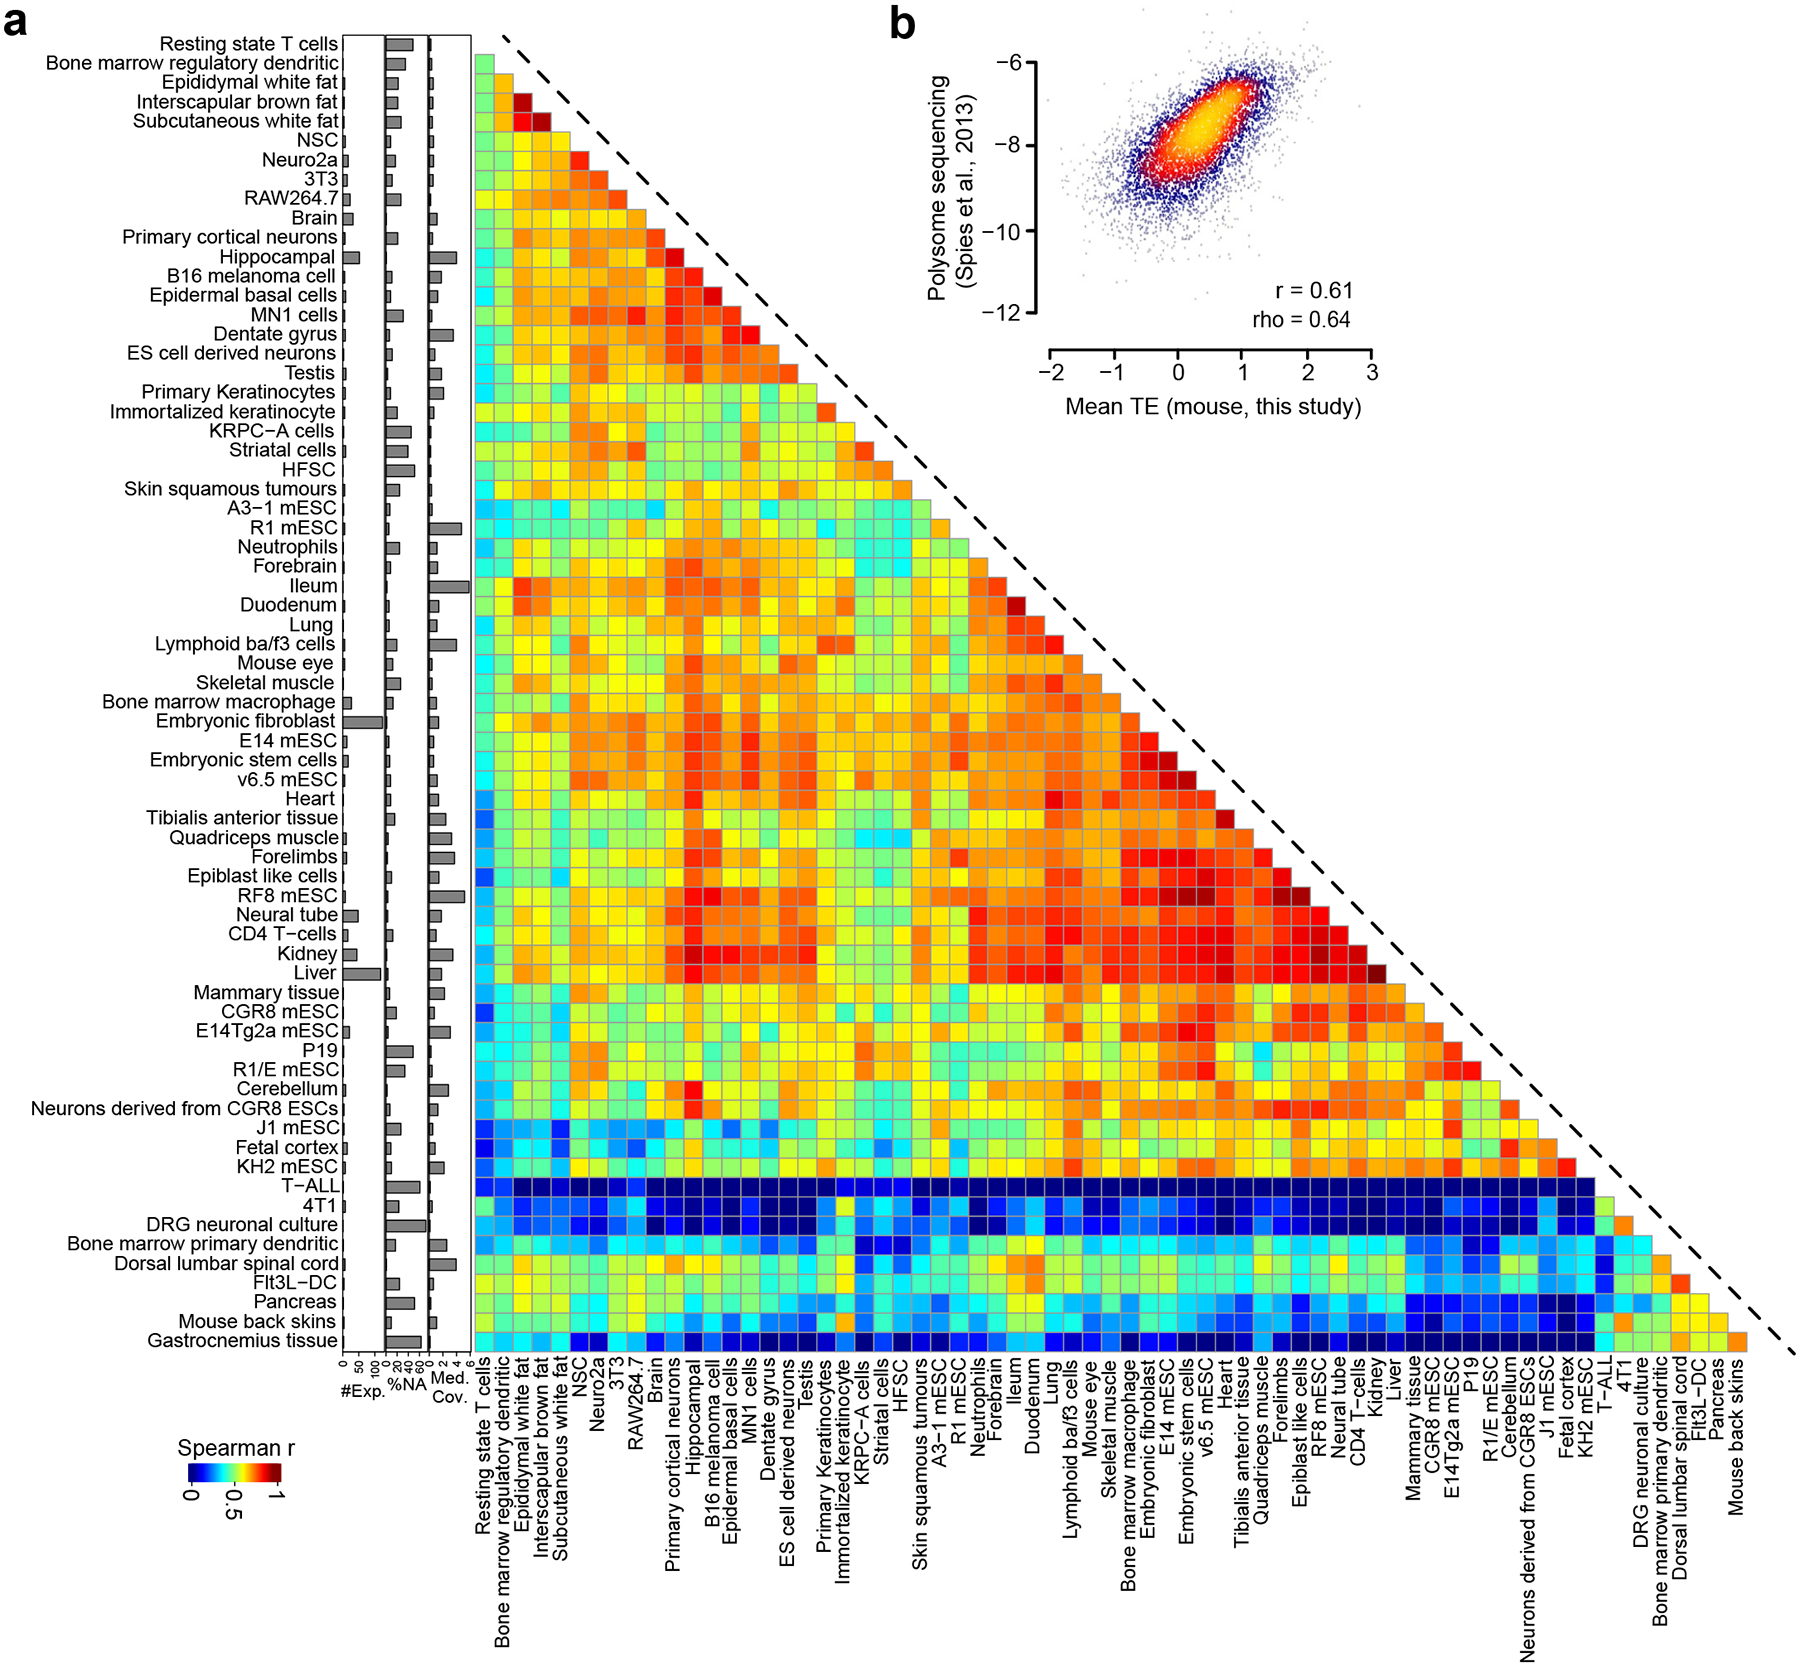
To construct a comprehensive, high-quality dataset of TE measurements, we systematically compiled 3,819 human and mouse ribosome profiling datasets from the Gene Expression Omnibus database. We filtered these into 1,282 human and 995 mouse samples representing matched ribosome profiling and RNA-seq data from numerous tissues and cell types. We then uniformly processed the datasets using an open-source bioinformatics pipeline53. We required each sample to pass the following quality control filters: (1) ≥70% of ribosome-protected fragments (RPFs) mapped to the CDS and (2) transcripts globally had a minimum average read coverage of 0.1× (detailed in companion study54). This yielded 1,076 human and 835 mouse ribosome profiling datasets. We then calculated TE using a compositional regression approach that overcomes the mathematical biases associated with the commonly used log-ratio approach55,56 (Fig. 1a and Methods). We summarized the datasets by averaging TEs across samples belonging to the same cell types, yielding matrices of 10,348 genes × 78 cell types for the human and 10,870 genes × 68 cell types for the mouse (Fig. 1a and Supplementary Tables 1 and 2). Each cell type varied in quality with respect to the number of missing genes (Supplementary Fig. 1), in part due to factors such as variable sequencing depth and number of samples averaged. This resource enabled us to assess the degree to which TEs are similar among different mRNAs across cell types. We calculated the Spearman correlation coefficient (ρ) between the TEs of transcripts across all possible pairs of human cell types (Fig. 1b). We observed that most of the cell types were highly correlated to each other, with a small subset possessing low correlation to most other cell types (Fig. 1b). This subset appeared to have lower data quality, as measured by a low median read coverage, leading to a large proportion of missing values (Fig. 1b). The high correlation between most cell types is suggestive of common translational regulation mechanisms across most cell types. Parallel results were observed for the inter-cell-type comparisons in the mouse (Extended Data Fig. 1a).
Fig. 1 |. Integrative analysis of thousands of human and mouse ribosomal profiling datasets measuring TE.

a, Schematic representation showing the workflow of transcriptome-wide TE calculations for the human and mouse, using paired RNA-seq and ribosome profiling datasets. b, Heatmap of Spearman correlation coefficients comparing TEs derived from each pair of 78 human cell types. Cell types are clustered using hierarchical clustering. Right: barplots show quality control data for the human cell type shown in each row. iPSC, induced pluripotent stem cells; HCC, hepatocellular carcinoma; OSCC, oral squamous cell carcinoma; HSPC, hematopoietic stem and progenitor cells; hESC, human embryonic stem cells; HMECs, human mammary epithelial cells. c, Comparison of mean TEs (that is, averaged across human cell types) for mRNAs derived from this study relative to alternative measurements of translational output measured in prior studies21,25,32. The Pearson (r) and Spearman (ρ) correlation coefficients between each pair of measurements are also shown.
To validate the biological relevance of TEs relative to other methods to measure translational regulation, we compared the TE across cell types with previously reported PTR ratios25,32,57 and ribosome load (number of ribosomes per transcript), as measured by polysome sequencing in HEK293T cells21. We normalized the ribosome load to CDS length because longer CDSs can accommodate more translating ribosomes. Given the strong correlation based on the dataset of origin (Supplementary Fig. 2), we evaluated the relationship between the means of each dataset. The ribosome load and mean PTR across tissues25 were positively correlated with our mean TE (r = 0.42, ρ = 0.4 and r = 0.52, ρ = 0.51, respectively; Fig. 1c). However, the mean PTR reported from a recent study32 was weakly negatively correlated with our mean TE (r = −0.36, ρ = −0.41; Fig. 1c). These PTR measurements were highly discordant with other datasets as well, suggesting that the most parsimonious explanation is the relatively lower reliability of this PTR dataset32. Even stronger correlations were observed between mouse mean TE and ribosome load in mouse 3T3 cells33 (r = 0.61, ρ = 0.64; Extended Data Fig. 1b). Together, these results suggest that our TE scores are informative of protein synthesis rates in both organisms.
Classical ML models to predict TE
To evaluate the predictability of our TE measurements, we trained regression models on precomputed sets of sequence-encoded features derived from the mRNA. The feature sets considered include the following: (1) the lengths of the 5′ UTR, CDS, 3′ UTR and entire transcript; (2) nucleotide frequencies of all regions; (3) codon frequencies; (4) amino acid frequencies; (5) k-mer frequencies of length 2–6 in the 5′ UTR, CDS and 3′ UTR regions; (6) the frequency of each nucleotide found in the wobble position; (7) the nucleotide identity at the −3, −2, −1, +4 and +5 Kozak positions; (8) dicodon counts found to affect TE in yeast44 and (9) multiple secondary structure features. For benchmarking purposes, we also considered biochemical features, defined as those derived from experimental measurements such as crosslinking with immunoprecipitation followed by sequencing (CLIP-seq) and RNA immunoprecipitation followed by sequencing (RIP-seq)7 (Methods).
To identify which feature sets usefully contributed to the prediction of mean TE across all human cell types, we used an iterative method that compared the cross-validated (CV) performance of a light gradient-boosting machine (LGBM) model trained with a specific feature set to one trained without it. If the model including the feature set performed statistically significantly better on ten held-out data folds than the model without it, that feature set was deemed useful (Methods). The feature sets found to be useful include the following: (1) regional and total sequence lengths, (2) UTR nucleotide frequencies, (3) codon frequencies, (4) amino acid frequencies and (5) the 3-mer frequencies of the 5′ UTR (Fig. 2a). All remaining feature sets did not further contribute to TE prediction (‘other’ in Fig. 2a), including secondary structure features, in contrast to prior findings45.
Fig. 2 |. A classical ML approach to predict mammalian TEs from mRNA sequence.

a, UpSet plot showing the r2 measured on ten held-out CV folds of LGBM models that predict the mean TE across human cell types using various feature sets (n = 10,242 total genes among the tenfold). Colored feature sets are indicative of those that contributed to the optimal sequence-only model. Median r2 and statistically significant differences in performance between pairs of models are indicated. P values were calculated using one-sided, paired t tests adjusted with a Bonferroni correction. NS, nonsignificant p values. All additional feature sets considered, but that did not have a significant improvement on performance, are labeled as ‘other’. b,c, Scatter plots comparing the predicted and observed mean TEs, averaged across cell types, for both the human (b) and mouse (c). The r2, Pearson (r) and Spearman (ρ) correlation coefficients, integrating the results across ten CV folds, are also shown. d,e, Importance of the features used by the optimal sequence-only model (shown as a red bar in a for both the human (d) and mouse (e)). For a given feature, importance was measured as the sum total information gain across all splits using the feature, averaged across all folds. The colors of the bars correspond to the mean Spearman ρ, averaging ρ values between the features and TE values from each cell type. Feature names are colored according to the feature set to which they belong.
Given this set of selected features, we compared the following three additional ML approaches to assess their relative performance: lasso, elastic net and random forest. We confirmed that LGBM performed the best (Supplementary Fig. 3a). We then trained LGBM models on all 78 human and 68 mouse cell types. The correlation between the mean TE and average over the predictions of each cell type was r = 0.78 for human and r = 0.74 for mouse (Fig. 2b,c). The r2 (averaged across the held-out folds) for predicting the mean TE across cell types was 0.61 and 0.55 for the human and mouse, respectively (Fig. 2b,c). Cell types with poorer data quality, such as a lower fraction of detectable genes, generally led to models with inferior performance (Supplementary Fig. 4). Although the hand-crafted feature sets could not easily include positional information, the regression models were still able to achieve impressive performance. We benchmarked our human LGBM model against two prior models, both of which consider only 5′ UTR information and were trained on HEK293T data. We found that Optimus14 achieved fourfold to sixfold inferior results (r2 = 0.12 on HEK293T TE; r2 = 0.10 on mean TE) relative to LGBM; similarly, the FramePool16 model also achieved twofold to fourfold inferior results (r2 = 0.18 on HEK293T TE; r2 = 0.17 on mean TE; Supplementary Fig. 3b–e).
Next, we sought to identify the relative importance of individual features for our optimal LGBM model. Several of the top-ranked features were consistent with those reported in the literature (Fig. 2d,e). For instance, both the human and mouse models capture (1) the known negative correlation between TE and both total mRNA sequence length and CDS length24,58–61, detected in polysome sequencing and PTR data as well (Supplementary Fig. 5a); (2) the known importance of AUG (often associated with upstream ORFs (uORFs)) and GGC trinucleotides in the 5′ UTR62–64; and (3) to the best of our knowledge, the previously unknown positive correlations of codons AAG (lysine) and GAU (aspartic acid) as well as the negative correlations of codons AGG (arginine) and AGC (serine). Overall, the mean feature importance across cell lines was highly correlated between the human and mouse (r = 0.95, ρ = 0.95; Supplementary Fig. 5b). Taken together, these results demonstrate the robust predictive power of specific sequence-encoded features on mammalian TE, underscoring the influence of nucleotide composition and sequence length across different cell types.
A deep neural network to predict TE from mRNA sequence
Given that deep-learning-based approaches can capture positionally aware contributions of sequence features and reveal degenerate motifs that are arduous to consider in classical ML models, we compared the performance of deep-learning models on the aforementioned tasks. Specifically, we trained multitask, deep convolutional neural networks to simultaneously predict TEs in all cell types examined. The input to our models consisted of a one-hot encoding of the mRNA sequence (up to a maximum of 13,318 nucleotides (nt)), along with binary variables indicating the first reading frame of a codon for each nucleotide; the output layer consisted of multitask predictions for the TEs of either 78 human or 68 mouse cell types (Fig. 3a).
Fig. 3 |. Performance and interpretation of deep learning models predicting mammalian TEs from mRNA sequence.

a, Architecture of RiboNN, a deep multitask convolutional neural network trained to predict TEs of mRNAs in numerous cell types from an input of the mRNA sequence and an encoding of the first frame of each codon. b,c, Performance of RiboNN in predicting human (b) and mouse (c) mean TEs, averaged across cell types. The r2, Pearson (r) and Spearman (ρ) correlation coefficients, integrating the results across ten CV folds, are also shown. d, Comparison of different model training strategies for predicting TEs in individual cell types using r2 measured on ten held-out CV folds (n = 10,242 total genes among the tenfold). The following approaches were examined: LGBM trained on a single task, RiboNN trained in either a multitask or single-task setting and RiboNN trained in a multitask setting but then fine-tuned on a single task (that is, a transfer learning approach). The center of the boxes corresponds to the median (the 50th percentile). The lower and upper hinges correspond to the first and third quartiles (the 25th and 75th percentiles). The upper whisker extends from the hinge to the largest value no further than 1.5× interquartile range (IQR; or distance between the first and third quartiles) from the hinge. The lower whisker extends from the hinge to the smallest value at most 1.5× IQR of the hinge. Data beyond the end of the whiskers are plotted individually. e, Metagene plot summarizing the absolute value of attribution scores, averaging across all mRNAs, for percentiles along the 5′ UTR, CDS and 3′ UTR. mRNAs were grouped into one of four equally sized bins according to their mean TE. f, Insertional analysis of 16 dinucleotides and the AUG motif. Motifs were inserted into each of 100 equally spaced positional bins along the 5′ UTR, CDS and 3′ UTRs of each mRNA. Indicated is the average predicted change in TE for each bin plotted along a metagene. g, Same as f, except it performs analysis for 61 codons (excluding the 3 stop codons) inserted into the first reading frame along the length of the CDS. h–k, Scatter plots showing the relationship between the codon influence (that is, the predicted effect size of each inserted codon, averaged across all positional bins) from the human RiboNN model with that of the mouse model (h), mean codon stability coefficients49 (i), A-site ribosome occupancy scores69 (j) and tRNA abundances70 (k). Pearson (r) and Spearman (ρ) correlation coefficients are also shown.
We first repurposed a hybrid convolutional and recurrent deep neural network architecture (Saluki) designed to predict mRNA stability7, removing the splice site channel. In addition, we trained a new model named RiboNN, in which we removed the gated recurrent unit layer in Saluki but increased the number of convolution/max-pooling blocks from six to ten to further compress mRNA sequence length by ~1,000-fold (Fig. 3a and Extended Data Fig. 2). A hyperparameter search testing a different number of such blocks and different batch sizes showed no statistical differences in performance relative to the hyperparameters we selected (Supplementary Fig. 6). To facilitate the learning of important features (for example, Kozak sequence) near the start codon, we fixed the start codon position in the input by aligning the mRNA sequences at the start codon. To accommodate the variability in mRNA sequence length, both the 5′ and 3′ ends of mRNAs shorter than 13,318 nt were padded with Ns (Fig. 3a). RiboNN achieved an r2 (averaged across held-out folds) of 0.62 for predicting the mean TE across the human cell types. As observed previously for LGBM models, the r2 degraded for cell types with poorer data quality (Extended Data Fig. 3). Sequence homology among intraspecies paralogs did not drastically inflate the results, because removing mRNAs in the test that were highly homologous sequences to those in the training set led to highly similar r2 values (Supplementary Fig. 7). The performance of the modified Saluki and RiboNN models was similar across cell types, with RiboNN slightly outperforming the modified Saluki (P = 2.9 × 10⁻¹⁰, paired Wilcoxon signed-rank test; Extended Data Fig. 3). Moreover, deleting the codon labels or fixing the mRNA sequences at the 5′ end (that is, rather than the start codon) each resulted in significantly lower r2 in most cell types (P < 2.2 × 10⁻¹⁶ for both paired Wilcoxon signed-rank tests; Extended Data Fig. 3).
We independently trained RiboNN to predict TEs in 68 mouse cell types. Like the human models, the mouse model exhibited variable performance among cell types, in a manner dependent on data quality. Overall, RiboNN achieved r2 (averaged across held-out folds) of 0.61 for predicting the mean TE across mouse cell types (Extended Data Fig. 4a). The mouse and human RiboNN models worked almost as well when generating predictions across species as within species, suggesting an evolutionary conservation of the principles learned (Extended Data Fig. 4b,c). This performance could not be explained merely due to the interspecies training on orthologous sequences, because the sequence homology between mRNA pairs across species was typically weak (that is, <50%), and the variance in prediction errors for mRNAs with the highest homology was akin to those with low homology (Extended Data Fig. 4d,e). The final human and mouse models displayed r2 of 0.62 and 0.61, respectively, in predicting mean TEs averaged across cell types (Fig. 3b,c), suggesting that RiboNN learned principles of translational regulation for endogenous mRNAs. Reinforcing our prior results (Fig. 2a), considering a set of RNA structural motifs alongside our human RiboNN model did not significantly enhance its performance relative to RiboNN alone (Supplementary Fig. 8a,b). However, a weak but detectable signal was apparent for RNA G-quadruplexes (RG4s) as a structural motif that could further explain the data (Supplementary Fig. 8c), opening the possibility that RiboNN may not comprehensively capture the effect of all such motifs.
The availability of TEs measured in various cell types provided the possibility of testing multiple modeling strategies to improve TE prediction for specific cell types. To further improve model performance, we compared single-task models and multitask models fine-tuned to a single task (that is, a transfer learning approach) on 12 randomly selected cell types exhibiting a wide distribution of r2 values (Supplementary Tables 3 and 4). Interestingly, single-task RiboNN models outperformed the multitask model for most of the cell types but were, in turn, outperformed by multitask models fine tuned to a single task (Fig. 3d). These results highlight the power of transfer learning as an effective strategy to enable information sharing between models. Although RiboNN and LGBM displayed comparable prediction performance, RiboNN nevertheless has distinct advantages with respect to its convenient application for transcriptome-wide TE prediction, circumventing the need to precompute features and enabling a more computationally efficient path toward the inference of genetic variant effects. Furthermore, evaluating the features that contribute to RiboNN’s success in predicting TE may uncover new principles of translational control that may have otherwise been overlooked.
To interpret the principles learned by RiboNN, we tested its predictive behavior in different contexts. Saliency maps are commonly used to explain deep learning model predictions by highlighting the input variables that contribute most toward the predicted label65,66. First, for each nucleotide of every human mRNA, we calculated attribution scores contributing to the prediction of mean TE across all the cell types, multiplying these with the one-hot encoding of each mRNA sequence to evaluate the predicted contribution of the input nucleotides. Averaging across all mRNAs, we generated a metagene plot using these scores, evaluating the attributed effect size (that is, absolute value) of each position along the length of each functional region of mRNA (Fig. 3e and Extended Data Fig. 5a). mRNAs were grouped into one of four equally sized bins according to their measured mean TE (high, medium, low and very low). This analysis revealed that 5′ UTR sequences and CDS incorporate the greatest per-nucleotide information density (~67% and 31%, respectively) in predicting translational output, followed by the 3′ UTR having the least contribution (2%). Taking into consideration the average length of each functional region, our model predicted a total global contribution of 22%, 73% and 5% for the 5′ UTR, CDS and 3′ UTR, respectively. In addition, RiboNN learned position-specific contributions to TE prediction. Specifically, the identity of the first ten codons demonstrated an approximately twofold greater impact compared to codons positioned toward the middle of the ORF (70–80 amino acids) in both human and mouse (Extended Data Fig. 5a). These general observations were consistent for the mouse, which exhibited a 67%, 31% and 2% per-nucleotide information density and 23%, 73% and 4% total global contribution for the 5′ UTR, CDS and 3′ UTR, respectively (Extended Data Fig. 5b). The positional importance of the early coding region was similarly greater in mice (Extended Data Fig. 5c), suggestive of an evolutionarily conserved principle among mammalian species.
We further examined our attribution scores using TF-MoDISco-lite67 to identify the most significant motifs associated with TE prediction for both human and mouse RiboNN models. Our analysis revealed that short, degenerate motifs, including CC, GG, CG and AUGs upstream and downstream of the main ORF, are predictive of translation output (Extended Data Fig. 5d,e). Inspired by this finding, we performed an insertional analysis of all 16 dinucleotides and AUG to evaluate the model’s behavior upon inserting each of these short motifs along the full length of each mRNA. We observed varying influences on TE among different motifs and across different functional regions of mRNA for the same motif. Insertion of AUG and GG in the 5′ UTR demonstrated the strongest negative effect on TE prediction for both human and mouse models, while UU, AA and UA exhibited the strongest positive effect (Fig. 3f and Supplementary Fig. 9a). Notably, the impact of upstream AUG (uAUG) on TE became increasingly negative as it approached the start codon, whereas CG showed a progressively positive effect. Albeit smaller in magnitude, most of the effects seemed to be maintained in the 3′ UTR, especially for regions proximal to the stop codon, suggestive of a position-dependent modulatory role for downstream AUGs and other dinucleotides. Taken together, these results establish that RiboNN captures the positional effects of nucleotide compositions along the entirety of the mRNA.
mRNAs with high TE are typically enriched for optimal codons18,68. To ascertain whether RiboNN has also learned this property, we reiterated our insertional analysis using 61 codons (excluding the three stop codons) inserted into the first reading frame along the length of each ORF. Similar to our previous findings, the model attributed different effect sizes to codons depending on their position along the ORF, with the greatest predicted effects occurring near the start codon (Fig. 3g and Supplementary Fig. 9b). GCU (alanine), GGU (glycine), GAU (aspartic acid) and AAC (asparagine) exhibited the strongest positive effects on TE; conversely, AGG, AGA (arginine), UCA (serine) and UUA (leucine) showed the most negative impact44.
Based on the insertional analysis, we calculated the mean codon influence (that is, across the ORF) on TE for each of the 61 nonstop codons and observed a strong correlation between the scores derived from human and mouse RiboNN models (r = 0.95, ρ = 0.95; Fig. 3h), indicating evolutionary conservation of predicted codon function on TE and the models’ ability to learn these reproducibly from completely independent datasets. Given the close link between codon usage and other aspects of RNA metabolism, we compared the correlation of RiboNN-based codon influence scores with several other metrics. We observed a strong positive correlation with mean codon stability coefficients49, which measure the association between codons and mRNA stability (Fig. 3i); a moderate negative correlation to propensity of ribosomes to have open A-sites69, which is indicative of ribosomes in the pre-accommodation state and hence slower elongation (Fig. 3j); and a moderate positive correlation with tRNA abundance70, which measures the availability of the cognate tRNA in the cellular pool (Fig. 3k). The correlations persisted when the scores of codons encoding the same amino acid were averaged, although no obvious trend existed with respect to hydropathy or charge of the amino acid (Extended Data Fig. 6). These findings underscore the complex interplay of multiple mechanisms that determine the fate of mRNAs in protein production.
Applications to therapeutic mRNA and genetic variants
Given RiboNN’s strong performance in predicting TE for endogenous mRNAs, we assessed its ability to generalize to orthogonal measures of TE and predict the impact of mRNA sequence variants on TE. Mean ribosome load, measured via polysome profiling, serves as an alternative metric of the translation rate of specific mRNAs, whether endogenous or therapeutic. Unlike ribosome profiling, mean ribosome load can differentiate translation differences between multiple RNA transcript isoforms of a given gene21,71,72. RiboNN, which was modeled on the full length of mRNAs, can be easily adapted to predict such isoform-specific TEs. The HEK293T RiboNN model demonstrated r2 = 0.34 and r2 = 0.69 between predicted TEs and mean ribosome loads measured for endogenous transcripts, which is within the realm of the reproducibility of measurement between labs (r = 0.73; Fig. 4a). Moreover, RiboNN could partially predict differences in mean ribosome load among pairs of transcript isoforms for the same gene, as measured by polysome profiling21 (r = 0.41; Supplementary Fig. 10a). These results indicate that our model effectively captured the relationships between isoform diversity and translational regulation.
Fig. 4 |. RiboNN predicts the impact of RNA modifications, genetic variants and reporter constructs on translation.

a, Comparison of HEK293T-predicted TEs relative to mean ribosome load as measured by polysome profiling21,111. b–d, Performance of RiboNN fine-tuned to predict the ribosomal recruitment score (that is, association of the 80S ribosomal subunit) to a panel of m1Ψ-modified 5′ UTRs linked to enhanced green fluorescent protein (EGFP) (b), their corresponding endogenous ORFs (c) or the paired difference between the endogenous and EGFP ORF (d)63. The Pearson (r) and Spearman (ρ) correlation coefficients between each pair of measurements are also shown. e, Relationship between the observed strength of negative selection of uAUG-associated point mutations, as measured by the mutability-adjusted proportion of singletons score74, and the RiboNN-predicted effect size. uAUG mutations were binned into categories based on the type of ORF created, distance to CDS start position and association to Kozak consensus sequences of varying strength74. The dot or star indicates the mean value for each group. Error bars represent confidence intervals calculated using bootstrapping74 (Methods). f,g, In silico mutagenesis results of two 5′ UTR regions of MORC2 (f) and CDKN2A (g). ‘Gain’ alludes to a predicted increase in TE for the mutation, while ‘loss’ refers to the opposite. Plotted are the sequence logo of the wild-type sequence, with nucleotide height proportional to the average predicted gain in TE (top row); the maximum predicted gain or loss across all possible mutations at each position (middle row); or a heatmap of all predicted TE changes for all possible mutations (bottom row). Positions of wild-type uAUG are highlighted in purple at the top. The known disease-associated variant is boxed.
In addition to endogenous mRNAs, polysome profiling has been used to measure translation from reporter constructs and base-modified mRNAs, as these can substantially influence protein output73. We next tested RiboNN’s ability to predict mean ribosome load in a massively parallel reporter assay dataset that assessed the function of thousands of 5′ UTRs in parallel14. Although RiboNN was never trained on polysome profiling or reporter data, its predicted TEs were still associated with mean ribosome load, achieving an r2 of 0.14–0.15 for reporter mRNAs without modified bases and an r2 of 0.09–0.10 for reporter mRNAs with either Ψ-modified or N1-methylpseudouridine (m1Ψ)-modified nucleotides (Supplementary Fig. 10b–d). Its poorer performance relative to Optimus14 and FramePool16 was not surprising given that the latter two were trained directly on these datasets. Thus, to more fairly benchmark RiboNN against these models, we benchmarked all three on a third-party dataset that measured ribosome recruitment scores for mRNAs with m1Ψ-modified 5′ UTRs linked to different ORFs63. RiboNN was weakly predictive of this data (r2 = 0.17 for 5′ UTRs linked to EGFP; r2 = 0.19 for 5′ UTRs linked to endogenous ORFs; Supplementary Fig. 11a,b). Leveraging the paired measurement of endogenous ORF and EGFP, we observed r2 = 0.11 between changes in TE and changes in ribosome recruitment scores resulting from swapping the ORFs (Supplementary Fig. 11c). In contrast, prior 5′ UTR-based models could not predict differences among 5′ UTRs linked to different ORFs. Depending on the ORFs tested, Optimus14 performed twofold to sevenfold worse (r2 = 0.08 on EGFP ORF; r2 = 0.03 on endogenous ORFs) than RiboNN; likewise, FramePool16 performed twofold to fivefold worse (r2 = 0.08 on EGFP ORF; r2 = 0.04 on endogenous ORFs; Supplementary Fig. 11d–g). Given the limited predictive power of all three models, we examined whether fine-tuning our RiboNN model on these data could improve performance (that is, via transfer learning). Indeed, fine-tuning improved performance by twofold to threefold relative to the original model (r2 = 0.49 for 5′ UTRs linked to EGFP; r2 = 0.50 for 5′ UTRs linked to endogenous ORFs; r2 = 0.28 for predicting ORF-dependent 5′ UTR effects; Fig. 4b–d). These improvements could not be explained by merely retraining RiboNN from scratch, illustrating the power of transfer learning in this context (Supplementary Fig. 11h). Collectively, these findings underscore RiboNN’s ability to integrate information from both 5′ UTR and ORF regions while predicting the translational regulation of therapeutically relevant mRNA.
Using the entire mRNA sequence enables the examination of how differences in sequence, including disease-associated variants, influence TE at single-nucleotide resolution. Given that 5′-UTR variants that generate or disrupt uORFs can lead to disease and are key cis-regulators of tissue-specific translation74, we first assessed RiboNN’s ability to predict the impact of uAUG-associated point mutations. The RiboNN-predicted effect size had a strong association with the strength of negative selection, as indicated by the mutability-adjusted proportion of singletons score74 (Fig. 4e). Variants creating uAUGs that result in overlapping ORFs (oORFs) or elongated CDSs exhibited a substantially higher impact on the TE of downstream protein-coding genes; moreover, uAUGs generated within 50 nt of the CDS had a greater effect size than those created further upstream (Fig. 4e). The effect size is slightly elevated if uAUG-creating variants arise in the context of strong Kozak consensus sequences relative to moderate or weak ones (Fig. 4e). These findings reveal that RiboNN learned positional and contextual features of uAUGs, both in function and evolutionary constraint.
Next, we conducted in silico mutagenesis on the 5′ UTR regions of several disease-associated genes. MORC2, a gene implicated in Charcot–Marie–Tooth disease75, has a long 5′ UTR region with a large number of uAUGs. Reinforcing earlier results (Fig. 4e), RiboNN predicted that loss-of-function mutations in CDS-proximal uAUGs would have a greater effect size relative to distal uAUGs (Fig. 4f). For the gene RDH12, associated with inherited retinal disease, RiboNN successfully predicted the negative impact of a uAUG-creating SNP (−123 C>T), which had been experimentally validated to reduce translation76 (Extended Data Fig. 7a). Additionally, the gene CDKN2A has a reported G>T mutation at base −34 in its 5′ UTR that creates a uAUG reported to decrease translation, leading to predisposition to melanoma77. RiboNN consistently predicted decreased TE for this variant (Fig. 4g). The ability of RiboNN to correctly predict the impact of TE of variants extended beyond those associated with uAUGs. For example, the SNPs −127 C>T and −9 G>A in the 5′ UTR of the ENG gene, associated with hereditary hemorrhagic telangiectasia, have been reported to reduce the expression levels of ENG78, consistent with the decreased TE predicted by RiboNN (Extended Data Fig. 7b). For FGF13, a gene associated with congenital intellectual disability, the −32 C>G mutation reduces translation79. RiboNN also predicted a negative effect of this SNP on TE and indicated that a C>A mutation at the same position might have an even greater impact on TE (Extended Data Fig. 7c). However, for SNP −94 G>A in BCL2L13, RiboNN predicted an increase in TE, contrary to the reported decrease in protein expression80 (Extended Data Fig. 8). Finally, we evaluated five cancer-associated 5′ UTR mutations in genes intersecting our gene set, which were previously implicated in prostate cancer using luciferase assays81. Of these, four of five mutations (ADAM32 (−61 C>T), NUMA1 (−36 G>T), QARS (−14 C>T) and AKT3 (−75 G>A)) showed the same predicted direction of TE change as the experimental measurements (Extended Data Figs. 9–10). Interestingly, most of these mutations did not generate a uAUG, demonstrating the model’s ability to predict TE changes driven by mechanisms beyond uAUG creation. Collectively, these results suggest that RiboNN could offer an additional form of evidence to infer the regulatory impact of SNPs on disease-associated genes.
Stability, translation and localization: a common language
Given the strong positive correlation between the RiboNN’s mean codon influence on TE and the previously estimated codon influence on mRNA stability (Fig. 3i), we further assessed the relationship between TE and mRNA stability. Indeed, both the predicted and experimentally measured mean TE, as well as mRNA stability from a previous study7 were positively correlated in humans and mice (r > 0.31, ρ > 0.32; Fig. 5a and Supplementary Fig. 12). Similar patterns were also observed between mRNA stability, polysome profiling and PTR data, except for the PTR dataset32 previously observed to be an outlier (Supplementary Fig. 12a and Fig. 1c). Consistent with the predicted underlying role of codons influencing both TE and stability, mean TE (as predicted by RiboNN) was positively correlated with mRNA stability (r = 0.38, ρ = 0.36; Fig. 5b); conversely, mRNA stability (as predicted by Saluki7 was positively correlated with TE (r = 0.40, ρ = 0.40; Fig. 5c). Taken together, these results suggest an interconnectedness between mRNA stability and translational regulation that can be learned by sequence-based ML models from diverse and independent datasets.
Fig. 5 |. Interrelationships between mRNA translation, turnover and subcellular localization.

a–c, Scatter plots showing the relationship between mean TE and mRNA stability7 (a), predicted mean TE and mRNA stability (b), and predicted stability and mean TE (c). Pearson (r) and Spearman (ρ) correlation coefficients are also indicated. d–f, Boxplots of TE (left) and residual TE (that is, representing the difference between TE and the predicted TE, right) for mRNAs binned according to their subcellular localization. Shown are the distributions for mRNAs encoding nonmembrane (excluding secreted) proteins that are enriched in TG (TG+, n = 1,086), rough ER (ER+, n = 745), CY (CY+, n = 1,299) or no apparent localization (none, n = 2,754)83 (d); membrane/secreted mRNAs either with (SP+, n = 92) or without (SP−, n = 289) signal peptides120 or all others (none, n = 9,552; e); or mRNAs enriched in cytosolic P-bodies (PB+, n = 93) or not (none, n = 1,543)84 (f). P values were computed by comparing the behavior of mRNAs localized to the specified compartment relative to those not localized (that is, labeled ‘None’) using a two-sided Mann–Whitney test adjusted with a Bonferroni correction. The center of the boxes in d–f corresponds to the median (the 50th percentile). The lower and upper hinges correspond to the first and third quartiles (the 25th and 75th percentiles). The upper whisker extends from the hinge to the largest value no further than 1.5× IQR (or distance between the first and third quartiles) from the hinge. The lower whisker extends from the hinge to the smallest value at most 1.5× IQR of the hinge. Data beyond the end of the whiskers are plotted individually.
mRNAs localized to certain subcellular compartments, such as the endoplasmic reticulum (ER) membrane, tend to be differentially translated82,83. We sought to evaluate these findings in the context of our predictive model, assessing both TEs and their associated residuals (mean TE − predicted mean TE) for mRNAs localizing to different compartments. For mRNAs encoding nonmembrane (excluding secreted) proteins, we observed a substantially higher residual TE for ER-enriched mRNAs; additionally, cytosolically enriched mRNAs exhibited a higher TE, although this signal was largely explained by the model (Fig. 5d). When considering mRNAs encoding both nonmembrane and membrane or secretory proteins, a higher TE was observed for ER-enriched mRNAs (P < 0.01). This is consistent with the result that mRNAs encoding membrane or secreted proteins tended to have higher TE, even for those lacking a signal peptide sequence (Fig. 5e). Nevertheless, membrane/secreted proteins harboring a signal peptide possessed a strongly positive residual on average (Fig. 5e), indicating that RiboNN was unable to model the association between signal peptides and TE. This was unsurprising as the model was trained on ~10K mRNA sequences, and the number of mRNA sequences encoding signal peptides is combinatorially explosive.
Given past work finding a relationship between mRNA stability and localization18, we evaluated whether unexplained variation in TE from RiboNN’s predictions could also be linked to mRNA localization. Because less stable mRNAs tend to be translationally repressed and enriched in mRNA processing bodies84 (P-bodies), we expected that mRNAs enriched in P-bodies to have lower mean TE compared to other mRNAs. This indeed appeared to be the case (Fig. 5f); however, there was no difference in the residual between mRNAs enriched in P-bodies (‘PB+’) and others (‘none’), indicating that the model already learned that mRNAs enriched for localization to P-bodies were associated with differential TE (Fig. 5f). Collectively, our results thereby establish a common language governing mRNA decay, translational regulation and subcellular localization.
Discussion
In this study, we developed deep learning models that use entire mRNA sequences to predict TE. These models were trained using data synthesized from thousands of ribosome profiling and matched RNA-seq experiments across >140 human and mouse cell types. Our models explain over 70% of the variation in TE in specific cell lines, achieving a mean r2 across cell types of 0.62. This represents a 1.3- to 4.4-fold performance improvement relative to previously developed models in mammals, which achieved a maximum r2 of 0.46 (range = 0.14–0.46)16,26,27,85. Furthermore, unlike earlier efforts that were limited to a few cell types, our approach enabled the development of models for a substantially larger and more diverse set of cell types.
Recent research has primarily relied on reporter constructs to dissect regulatory elements of translation14,15,64,86,87. Due largely to technological limitations, such experiments use easily detectable and fixed coding regions, such as GFP, attached to variably engineered 5′ UTRs, and are typically limited to one or few cell types. Critically, these reporter constructs lack the full complement of proteins that normally accompany endogenous mRNAs throughout their lifecycle88, which influences RNA metabolism89. Consequently, predictive models based on reporter assays offer limited insights into the translation of endogenous mRNAs, explaining less than 25% of variation in their TE16,27. In contrast, our model demonstrates superior performance in predicting the translation of endogenous mRNAs and also appears to predict the behavior of therapeutic RNAs63.
Our predictive modeling approaches are particularly valuable as they provide a quantitative assessment of factors determining TE. By analyzing the position and identity of sequence elements, we were able to ascertain their relative importance in making accurate predictions. Our model highlights the dominant influence of 5′ UTRs and coding sequences in determining TE. The nucleotide compositions of 5′ UTRs heavily influenced the prediction of TE. Short, AU-rich sequences were generally associated with higher TE, whereas the impact of GC-rich sequences was negative but position-dependent. Intriguingly, recent massively parallel reporter assays conducted in both zebrafish and human cells, using different readouts to measure translation, have identified a similar pattern63,64. This concordance suggests that these particular regulatory features observed in reporter constructs are reflective of those in endogenous transcripts.
RiboNN also learned the well-established role of uAUGs in repressing the translation of the main coding sequence14,62,80,90. Specifically, a shorter distance between the uAUG and the start codon was associated with a reduced TE of the main coding sequence, consistent with the depletion of uAUGs near CDS start sites85. Furthermore, uAUGs closer to the start codon are more likely to produce oORFs. Such oORFs, which are under more stringent selective pressure in human populations74, tend to inhibit the TE of the main CDS more than uORFs entirely contained within the 5′ UTR, which may allow for reinitiation following uORF translation termination62.
In addition to learning the well-established role of uAUGs, our model unexpectedly predicts that downstream AUGs in 3′ UTRs reduce TE, particularly when close to the stop codon. Readthrough of stop codons can lead to C-terminal extensions, which decrease protein abundance91. The underlying mechanisms likely involve both proteasomal degradation91,92 and reduced translation due to ribosome stalling93,94. Alternatively, downstream AUGs can be translated due to inefficient recycling of terminating ribosomes that subsequently reinitiate95. Although the impact of such events on the TE of the main ORF remains incompletely understood, a recent study suggested that translation of downstream ORFs can act as translational activators96. While our findings might appear to contradict this finding, it is conceivable that there is a distance-dependent relationship, where AUGs near stop codons are inhibitory due to their effects on recycling efficiency or readthrough, whereas ORFs positioned further downstream could have activating effects. Although our models detect specific signals in 3′ UTRs, particularly near the stop codon, overall, RiboNN predicts that 3′ UTRs generally have a minimal impact on TE. Our results do not imply that 3′ UTR-dependent regulation is unimportant for specific genes97 or particular contexts such as in early vertebrate development98,99. However, the overall contribution of 3′ UTRs to translation control is likely limited, consistent with several transcriptome-wide analyses33,100.
A major finding from our study is the dominant influence of the coding sequence on TE predictions. Particularly, sequences proximal to the N-termini were found to be about twice as important in determining TE, a feature learned by RiboNN independently from both mouse and human datasets. Interestingly, recent work using reporter constructs and single-molecule analyses suggested that the identity of amino acids in early coding regions can affect protein synthesis efficiency, potentially through mechanisms related to translation elongation46. While the N-terminus-proximal codons were more important at a per-residue level, the identity of codons across the entire CDS contributed to TE predictions. Factors such as the charge of the nascent polypeptide in the exit tunnel of the ribosome101,102, the pairs of codons in the decoding center44,103 and availability of charged tRNAs corresponding to specific codons104 have all been linked to altered translation elongation. Despite these mechanisms that can alter decoding rates, there is debate over whether the average elongation rate across different mRNAs varies substantially105,106. Critically, recent studies implicate codon usage in modulating initiation efficiency through differences in ribosome decoding rates107,108. Given the importance of the entire CDS for the accuracy of RiboNN, our results suggest that both codon and amino acid compositions are critical for determining the TE of endogenous mRNAs.
Translation elongation dynamics have emerged as an important contributor to mRNA stability as well17,18,47–51. The codon-specific effects identified by RiboNN in predicting TE closely mirror their impact on mRNA stability. For instance, the codons AGA and AGG, which were found to exert substantial mRNA-destabilizing effects7,109, also negatively impact TE, as inferred by RiboNN. Additionally, during the maternal-to-zygotic transition, mRNAs enriched with codons that enhance mRNA stability also show higher TE17. However, the relationship between translation and mRNA decay remains debated110, as increased TE and ribosome flux can also facilitate mRNA decay, which would predict a negative correlation between the two111. Specifically, slower elongation rates may result in mRNA degradation through either transiently slowed ribosomes112,113 or ribosome collisions, which can activate the ribosome quality control pathway114. While these mechanisms have been primarily explored using reporter constructs, recent studies have also demonstrated their relevance to endogenous transcripts115. Detailed investigation into the translation-dependent and independent contributions to mRNA decay remains an active area of research116. Future studies are likely to uncover condition-specific effects on mRNA stability that vary with TE.
A potential limitation of our work is that it solely considers the primary sequence to predict TE. In our analyses using the LGBM and RiboNN models, the inclusion of several secondary structure-related features did not enhance performance. This might be explained by several possibilities. First, the primary sequence itself is highly predictive of secondary structure, potentially capturing these influences implicitly. Second, prior results may have overstated the importance of RNA structure because they did not appropriately account for nucleotide composition45. Third, the list of structural motifs and features we computed, based on predicted free energy, does not accurately reflect the true secondary structures of these RNAs. Considering this last point, developing more precise secondary structure features could lead to further improvements in prediction accuracy. However, an independent analysis focused on RG4s, considered to be the most stable RNA structure that could block ribosome scanning117, suggested a weak but detectable translational inhibition for putative RG4-containing transcripts relative to RiboNN’s predictions. These findings would require further validation, considering the counteracting evidence that RG4s are globally unfolded in mammalian cells56.
Another avenue for improvement could involve providing RiboNN with explicit knowledge of protein sequences. Including amino acid composition information improved the performance of the LGBM model, and our analyses revealed systematic bias in predicted TE for proteins harboring signal peptides. Thus, a deep learning model that accesses both nucleotide and amino acid sequences (that is, summarized protein-based information) may further enhance TE prediction. Nevertheless, because our models currently explain 62% of the variability in mean TE across a wide array of cell types, we can establish an upper bound on the impact of such features. This estimate is likely conservative, as some portion of the unexplained variance in these measurements is attributable to measurement error.
We would also like to note that TE, as defined in our study and typically used in the literature, does not equate to the rate of protein synthesis; rather, it reflects differences in ribosome occupancy relative to mRNA abundance. While recent work with reporter constructs suggested that increased ribosome load may not linearly relate to protein output111, both our work and previous studies34,118 indicate that TE is positively associated with protein abundance and synthesis rates for endogenous transcripts. Theoretical models of translation also support the general positive relationship between protein synthesis and TE59,119.
Overall, RiboNN achieves state-of-the-art prediction of TE in humans and mice, elucidating key principles that underpin accurate predictions, including the relative importance of various molecular aspects. These predictive models distill our knowledge into a coherent framework and have the potential to advance bioengineering applications. Substantially, RiboNN can generate functional predictions on genetic variants in the human population, giving insight into the mechanisms constraining molecular evolution and underpinning genetic diseases. Overall, these advancements have implications for both genetic diagnostics and the design and optimization of mRNA and gene therapies, positioning our model at the forefront of these rapidly evolving domains. Looking ahead, we anticipate that future work will use multimodal approaches to simultaneously predict all facets of gene expression—RNA abundance, stability and translation—from primary mRNA sequence, given the interconnectedness of these phenomena.
Methods
Generation of human and mouse TE compendia
To calculate cell-type-specific TEs, we initially selected 1,282 human and 995 mouse ribosome profiling datasets with matched RNA-seq data. These were screened for a series of quality control steps to retain high-quality samples. Quality control criteria included ensuring average transcript coverage exceeded 0.1× and reads mapping to CDS constituted more than 70% of the total. The remaining 1,076 human and 835 mouse ribosome profiling samples were further processed using the winsorization method to minimize the impact of PCR bias54. Genes with sufficient counts per million (>1 in more than 70% of samples) of RPFs were retained, and transcripts without poly(A) tails were removed. Experimental variables, such as the inclusion of elongation inhibitors, can lead to technical artifacts, manifesting as increased RPF density around start and stop codons121. To mitigate such biases, we only considered RPFs whose 5′ end mapped either after the first 10 nts or before the last 35 nts of the CDS. These RPFs were summed to determine the CDS count for each transcript53. An identical counting method was used for RNA-seq data. Total CDS counts for both RNA-seq and ribosome profiling were normalized using a centered log-ratio. TE was defined as the residual obtained from a compositional linear regression for each transcript in each sample54. For each transcript, if either the RNA-seq or ribosome profiling read count was 0 in all samples from a specific cell line, we assigned not available (NA) to its TE in the corresponding cell line. Finally, we calculated the average TE for each transcript in each cell line across all samples.
Features considered in classical ML models
The length features included the log10 of the 5′ UTR, CDS, 3′ UTR and total transcript lengths. Nucleotide frequency included the percentage composition of the 5′ UTR, CDS, 3′ UTR and full sequence. Codon and amino acid frequencies were calculated as the percentage within the CDS and included annotated stop codons. K-mer frequencies (for k-mers of size two through six) were computed separately for each region and normalized by the total k-mer count. Additional feature classes included the frequency of each nucleotide in the wobble position of all codons, a one-hot encoding of the nucleotide identity surrounding the start codon (at the −3, −2, −1, +4 and +5 positions), the counts of 20 dicodons found to affect TE in yeast44 and several secondary-structure-related metrics. To capture secondary structure, sequences for the 5′-most 60 nt of the transcript and a 60 nt window centered on the start codon (that is, last 30 nt of the 5′ UTR and first 30 nt of the CDS) were extracted from the APPRIS v2 primary transcript references122. If the 5′-UTR length was <30 nt, the first 60 nt of the transcript were used instead. Secondary structure features were enumerated in these regions using seqfold v0.7.17 (https://github.com/Lattice-Automation/seqfold, https://zenodo.org/records/7986470) at a temperature of 37 °C. These features were the min ΔG, number of hairpins, number of loops, number of bifurcations, number of bulges, max stem length, max loop length and position of the first stem. Hairpins with a stem length <3 or loop length >10 were not enumerated. Some of the sequence-derived and biochemical features used previously7 were also tested separately and in combination with the abovementioned sequence features. The sequence-derived features include G/C content, intron length, ORF exon junction density, predictions for mammalian microRNA targets and the average binding score of mammalian RBPs. The biochemical features include the measured mRNA half-life; number of CLIP, enhanced CLIP and photoactivatable-ribonucleoside-enhanced CLIP peaks of various RBPs; and the enrichment of RBP binding relative to a control immunoprecipitation measured by RIP-seq7.
Classical ML model benchmarking
The lasso, elastic net, random forest (scikit-learn v1.0.2)123 and LGBM (lightgbm v3.2.1)124 regression models were trained using tenfold CV. Performance was measured as the mean of the r2 values across held-out test folds. Throughout this study, r2 (that is, the coefficient of determination) was computed as the square of the Pearson correlation. For lasso and elastic net, the training data were further split into five CV folds to find the optimal α (lasso and elastic net) and L1 ratio (elastic net) hyperparameters. The default hyperparameters given were used for LGBM, with the exception of the ‘gain’ option for use with importance calculations. Random forest used the same number of trees and maximum leaf nodes as LGBM. Comparisons between model types (Extended Data Fig. 3) and feature sets (Fig. 2a) were deemed significant with one-sided, paired t tests, adjusted by a Bonferroni correction. We measured feature importance as the total information gain across all LGBM tree splits using that feature, averaged across all folds. In Fig. 2b,c, the importance was further averaged over all cell lines. To determine if a feature had a positive or negative effect on prediction, the Spearman correlation between the feature and cell-type-specific TE was used.
RiboNN model architecture, training and interpretation
The input mRNA sequences were aligned at the start codons, with the maximum 5′ UTR size set to 1,381 nt and the maximum combined CDS and 3′ UTR size to 11,937 nt. Sequences were padded at the 5′ and 3′ ends with ‘N’ and one-hot encoded (with ‘N’ encoded by a vector of four 0s). We added a fifth channel, labeling the first nucleotide of each codon in the CDS7.
The architecture of RiboNN consisted of a Conv1D input layer, a ‘tower’ of ten convolution blocks and a head of two linear layers (Extended Data Fig. 2), with each convolution block including the following operations: (1) layer normalization sandwiched by transpose actions, (2) ReLU activation, (3) 1D convolution with kernel width 5, (4) dropout and (5) max pooling with width 2. Overall, the model consisted of 250,382 learnable parameters. The output layer had one or multiple neurons for single-task and multitask learning, respectively.
Following Saluki’s training procedure7, we trained the RiboNN multitask model with the MSE loss function using the AdamW optimizer on batches of 64 randomly selected examples, a gradually decreasing learning rate between 0.001 and 0.0000001, β1 of 0.9 and β2 of 0.998. We clipped gradients to a global norm of 0.5. We used a dropout probability of 0.3 throughout. After each epoch, the model was evaluated on the held-out validation set in batches of 128 sequences. We trained each model for 200 epochs, saving checkpoints along the way. After 200 epochs, the model parameters from the checkpoint with the highest validation r2 were saved as the final model parameters. We trained the mouse and human models independently using a nested CV strategy. Specifically, we randomly split the full set of human or mouse transcripts into tenfolds of similar sizes and trained nine models for each of the ten held-out CV folds (using ninefold CV on the inner folds), producing a total of 90 trained models. For each of the nine models from the inner folds, we retained the top five models ranked based on their validation r2 performance. When running RiboNN in ‘prediction’ mode, we computed the mean of these 50 models to represent the ensemble prediction.
Transfer learning was implemented by replacing the linear head of our pretrained multitask model with a new single-task two-layer linear head. We froze all preceding layers and trained the new linear head for 50 epochs, followed by unfreezing all of the layers and training the entire network for another 150 epochs. To prevent circularity during transfer learning (for example, use of the same gene in the tissue-specific TE test set as was considered in the multitask model training set), we fine-tuned the pretrained multitask model on the matched train/test splits.
We used the saliency method66 within the PyTorch Captum library (v.0.6.0)125 to compute the attribution scores for each nucleotide of the input sequence with respect to the predicted mean TE. For each of the test sets from our tenfold CV procedure, we averaged the attribution scores from the top five trained models.
To generate the metagene plot of attribution scores, we followed the methods established in prior work7.
Insertional motif analysis with RiboNN
Using attribution scores as input, we ran TF-MoDISco-lite67 on each functional region (5′ UTR, ORF and 3′ UTR) independently to identify the motifs most strongly influencing the predicted mean TE. Gradient correction was applied by subtracting the mean attribution score across four encoding channels66. The motifs were ranked based on the number of sequences (that is, seqlets) supporting the enrichment of each motif.
As performed in earlier work7, the insertional analysis was performed by dividing each functional region of a valid mRNA into 100 evenly spaced positional bins. Each k-mer examined (that is, the 16 dinucleotides and AUG) was inserted into one of these bins, replacing the reference sequence to maintain the mRNA’s original length. A valid mRNA was defined as one with a 5′ UTR length ≥100 nt, a CDS length ≥500 nt and a 3′ UTR length ≥500 nt7. For each insertion, the predicted change in mean TE relative to the corresponding wild-type mRNA was recorded. To quantify the impact of each motif across diverse sequence contexts, the predicted changes in mean TE across all valid mRNAs were averaged for each of the 300 positional bins. Identical insertional analysis was performed for the 61 nonstop codons, except that each codon was inserted into the first reading frame of the ORF.
Impact of uAUG-creating variants with RiboNN
From an earlier study74, we downloaded the list of variants that create uAUGs and selected the canonical transcript based on the gnomAD v2 annotation126 for each gene for further analysis. For each uAUG-creating variant considered, we verified that its gene name matched the list of canonical transcripts and that the distance from each uAUG variant to the start of its CDS was accurately annotated. This led to a set of 15,184 uAUG variants that were categorized into two groups based on their effects and contexts as previously annotated74. The effect group comprised variants that create out-of-frame oORFs (n = 2,784), elongate the CDSs (n = 1,350) or generate uORFs (n = 9,263). The context group included variants located at a distance of ≥50 nt from the CDS (n = 11,113), <50 nt from the CDS (n = 2,284) or associated with a strong (n = 2,237), moderate (n = 6,559) or weak (n = 4,601) Kozak consensus sequence. To assess the impact of each variant on TE, we recorded the change in predicted TE relative to the wild-type mRNA reference sequence. The confidence intervals were calculated using bootstrapping74—for each round, we randomly picked n variants with replacement from the original list of n and calculated the mean of ΔTE. We repeated this 10,000 times and used the 5th and 95th percentiles as the confidence intervals.
In silico mutagenesis analysis of disease genes with RiboNN
We performed in silico mutagenesis analysis7 on the 5′ UTR regions of genes associated with various diseases to predict the impact of genetic variants on TE. For each nucleotide position, we substituted the reference nucleotide with each of the three possible alternative alleles and computed the predicted ΔTE.
Subcellular localization analysis
Based on prior results83, we categorized 5,884 nonmembrane (excluding secreted) protein-encoding mRNAs as enriched in TIS granules (TG+, n = 1,086), the rough ER (ER+, n = 745), the cytosol (CY+, n = 1,299) or exhibiting no apparent localization (2,754). Human proteins with a subcellular location term of ‘membrane’, ‘secreted’, ‘endoplasmic reticulum’ or ‘Golgi apparatus’ in the UniProtKB database120, as of 13 July 2023, were considered as membrane/secreted. Human proteins with signal peptides were downloaded from UniProtKB120 on 2 March 2024. Membrane/secreted proteins with and without annotated signal peptides were considered as SP+ and SP−, respectively. For our analysis of P-body-enriched mRNAs, we examined a total of 1,636 mRNAs84, of which 93 exhibited P-body enrichment based on prior results84. P values from Mann–Whitney–Wilcoxon test, two-sided with Bonferroni correction, were performed to show statistical significance.
Extended Data
Extended Data Fig. 1 |. Intercomparison of mouse cell types.
a, Same as Fig. 1b, except for the display results for 68 mouse cell types. b, Scatter plot to show the correlation between mouse mean TE from this study and ribosomal loading measured in 3T3 cells33. Pearson (r) and Spearman (ρ) correlation coefficients are indicated.
Extended Data Fig. 2 |. Visualization of the RiboNN model architecture.

Shown is a layer-by-layer graph of the RiboNN architecture, with input/output dimensions labeled for each layer. The ConvBlock in the broken-line box was applied 10 times in total to compress the sequence length. Light yellow nodes reflect input/output tensors, light blue nodes reflect functions, light green nodes reflect modules and numbers in parentheses reflect tensor dimensions.
Extended Data Fig. 3 |. Performance of deep learning models on all human cell types.

These panels mirror those shown in Supplementary Fig. 4, except they show the performance of multitask deep learning models with one of four architectures: (1) our final RiboNN architecture, (2) our RiboNN architecture, ablating the input channel recording codon positions, (3) our RiboNN architecture, anchoring all mRNAs at their 5′ end instead of at start codons and (4) the Saluki architecture7, removing the splice site input channel. For each architecture, the r2 values were measured on ten held-out CV folds (n = 10,242 total genes among the ten folds). The center of the boxes corresponds to the median (the 50th percentile). The lower and upper hinges correspond to the first and third quartiles (the 25th and 75th percentiles). The upper whisker extends from the hinge to the largest value no further than 1.5× IQR (interquartile range, or distance between the first and third quartiles) from the hinge. The lower whisker extends from the hinge to the smallest value at most 1.5× IQR of the hinge. Data beyond the end of the whiskers are plotted individually.
Extended Data Fig. 4 |. Performance of RiboNN on mouse cell types.

a, These panels mirror those shown in Supplementary Fig. 4, except they show the performance of our multitask RiboNN model on mouse cell types using r2 measured on ten held-out CV folds (n = 10,242 total genes among the ten folds). The center of the boxes corresponds to the median (the 50th percentile). The lower and upper hinges correspond to the first and third quartiles (the 25th and 75th percentiles). The upper whisker extends from the hinge to the largest value no further than 1.5× IQR (interquartile range, or distance between the first and third quartiles) from the hinge. The lower whisker extends from the hinge to the smallest value at most 1.5× IQR of the hinge. Data beyond the end of the whiskers are plotted individually. b,c, Scatter plots showing the relationships between our mouse RiboNN predictions to the observed mean TEs for human mRNAs (b) as well as the relationships between our human RiboNN predictions to the observed mean TEs for mouse mRNAs (c). Pearson (r) and Spearman (ρ) correlation coefficients are also shown. d,e, Scatter plots showing the relationships between sequence homology, considering the interspecies pair of mRNAs with the maximum homology, and the residual prediction error between the TE from one species and TE predicted from the alternative species. This was shown for human (d) and mouse (e) mean TE data. ‘Max homology %’ was computed as follows: (1) all human–mouse mRNA pairs were locally aligned using the ‘pairwiseAlignment’ function from the Biostrings (version 2.70.2) R package129 (‘match: 1, mismatch: −3, gap open: −2 and gap extend: −1’) and (2) for each mRNA, the final value was computed using the highest scoring alignment from the other species, calculating the maximum homology score divided by mRNA length.
Extended Data Fig. 5 |. Interpretation of human and mouse RiboNN models.

a, Attribution score plot for human RiboNN model focusing on specific regions along valid mRNAs (defined in Methods). The windows include the first 50 nt of the 5′ UTR, 50 nt upstream to 250 nt downstream of the start codon, 250 nt upstream and 250 nt downstream of the stop codon and the last 250 nt of the 3′ UTR. The absolute values of attribution scores were averaged across all valid mRNAs, which were grouped into one of four equally sized bins according to their mean TE. b, Metagene plot for the absolute value of attribution scores derived from the mouse RiboNN model, averaged across all mRNAs, for percentiles along the 5′ UTR, CDS and 3′ UTR. mRNAs were grouped into one of four equally sized bins according to their mean TE. c, Same as a, except it reflects results from the mouse RiboNN model. d,e, Enriched motifs learned by human (d) and mouse (e) RiboNN models for each functional region of mRNA. Motifs are ranked by the number of seqlets67 supporting each motif.
Extended Data Fig. 6 |. Amino acid-level-based correlation among codon influence scores.

a–c, Scatter plots showing the relationship between the amino acid-level-based codon influence (that is, the predicted effect size of each inserted codon, averaged across all positional bins and across codons for each amino acid) from the human RiboNN model and the mouse model (a), A-site ribosome occupancy scores69 (b) and mean codon stability coefficients49 (c). Pearson (r) and Spearman (ρ) correlation coefficients are also shown. The properties of amino acids are labeled by different colors for hydrophobicity and by different shapes for charge. The error bar represents the standard error across codons encoding the same amino acid. To compute amino acid-level scores, we computed the mean score among codons encoding the same amino acid. All 61 non-stop codons were included in the amino acid-based analysis.
Extended Data Fig. 7 |. In silico mutagenesis of disease-associated gene 5′ UTRs.

a–c, In silico mutagenesis of 5′ UTR regions of RDH12 (a), ENG (b) and FGF13 (c). Positions of wild-type uAUG are highlighted in purple at the top. The known disease-associated variants are boxed. Single-point mutations resulting in predicted TE differences are shown alongside annotations reflecting the corresponding gain or loss of TE.
Extended Data Fig. 8 |. In silico mutagenesis of disease-associated gene 5′ UTRs.

Continuation of results from Extended Data Fig. 7, except with BCL2L13.
Extended Data Fig. 9 |. In silico mutagenesis of cancer-associated gene 5′ UTRs.

a–d, In silico mutagenesis of 5′ UTR regions of ADAM32 (a), NUMA1 (b), COMT (c) and QARS (d). Positions of wild-type uAUG are highlighted in purple at the top. The known cancer-associated variants are boxed. Single-point mutations resulting in predicted TE differences are shown alongside annotations reflecting the corresponding gain or loss of TE.
Extended Data Fig. 10 |. In silico mutagenesis of cancer-associated gene 5′ UTRs.

Continuation of results from Extended Data Fig. 9, except with AKT3.
Supplementary Material
Supplementary information The online version contains supplementary material available at https://doi.org/10.1038/s41587-025-02712-x.
Acknowledgements
We thank I. Hoskins (UT Austin) for the code and data to generate secondary structure features and M. Miladi (Sanofi) for providing critical feedback. We thank C. Thoreen and W. Gilbert (Yale University) for sharing their data before publication. Research reported in this publication was supported in part by the National Institute of General Medical Sciences of the National Institutes of Health under award R35GM150667 (to C.C.). This work was also supported by the National Institutes of Health (grant HD110096) and the Welch Foundation (grant F-2027-20230405 to C.C.). C.C. was a CPRIT Scholar in Cancer Research supported by the CPRIT (grant RR180042).
Footnotes
Online content
Any methods, additional references, Nature Portfolio reporting summaries, source data, extended data, supplementary information, acknowledgements, peer review information; details of author contributions and competing interests; and statements of data and code availability are available at https://doi.org/10.1038/s41587-025-02712-x.
Reporting summary
Further information on research design is available in the Nature Portfolio Reporting Summary linked to this article.
Competing interests
D.Z., J.W., F.U.-M. and V.A. are employees of Sanofi and may hold shares and/or stock options in the company. The other authors declare no competing interests.
Extended data is available for this paper at https://doi.org/10.1038/s41587-025-02712-x.
Data availability
We provide the processed data without restriction in supplementary tables herein.
Code availability
Code and pretrained models are available on Zenodo127 and GitHub (https://github.com/Sanofi-Public/RiboNN/). Our classic ML model code is available on Zenodo128 and GitHub (https://github.com/CenikLab/TE_classic_ML).
References
- 1.Agarwal V & Shendure J Predicting mRNA abundance directly from genomic sequence using deep convolutional neural networks. Cell Rep. 31, 107663 (2020). [DOI] [PubMed] [Google Scholar]
- 2.Zhou J et al. Deep learning sequence-based ab initio prediction of variant effects on expression and disease risk. Nat. Genet 50, 1171–1179 (2018). [DOI] [PMC free article] [PubMed] [Google Scholar]
- 3.Avsec Ž et al. Effective gene expression prediction from sequence by integrating long-range interactions. Nat. Methods 18, 1196–1203 (2021). [DOI] [PMC free article] [PubMed] [Google Scholar]
- 4.Kelley DR et al. Sequential regulatory activity prediction across chromosomes with convolutional neural networks. Genome Res. 28, 739–750 (2018). [DOI] [PMC free article] [PubMed] [Google Scholar]
- 5.Wang J & Agarwal V How DNA encodes the start of transcription. Science 384, 382–383 (2024). [DOI] [PubMed] [Google Scholar]
- 6.Linder J, Srivastava D, Yuan H, Agarwal V & Kelley DR Predicting RNA-seq coverage from DNA sequence as a unifying model of gene regulation. Nat. Genet 57, 949–961 (2025). [DOI] [PMC free article] [PubMed] [Google Scholar]
- 7.Agarwal V & Kelley DR The genetic and biochemical determinants of mRNA degradation rates in mammals. Genome Biol. 23, 245 (2022). [DOI] [PMC free article] [PubMed] [Google Scholar]
- 8.Gingold H & Pilpel Y Determinants of translation efficiency and accuracy. Mol. Syst. Biol 7, 481 (2011). [DOI] [PMC free article] [PubMed] [Google Scholar]
- 9.Zur H & Tuller T Predictive biophysical modeling and understanding of the dynamics of mRNA translation and its evolution. Nucleic Acids Res. 44, 9031–9049 (2016). [DOI] [PMC free article] [PubMed] [Google Scholar]
- 10.Nieuwkoop T et al. Revealing determinants of translation efficiency via whole-gene codon randomization and machine learning. Nucleic Acids Res. 51, 2363–2376 (2023). [DOI] [PMC free article] [PubMed] [Google Scholar]
- 11.Shao B et al. Riboformer: a deep learning framework for predicting context-dependent translation dynamics. Nat. Commun 15, 2011 (2024). [DOI] [PMC free article] [PubMed] [Google Scholar]
- 12.Tian T, Li S, Lang P, Zhao D & Zeng J Full-length ribosome density prediction by a multi-input and multi-output model. PLoS Comput. Biol 17, e1008842 (2021). [DOI] [PMC free article] [PubMed] [Google Scholar]
- 13.Tunney R et al. Accurate design of translational output by a neural network model of ribosome distribution. Nat. Struct. Mol. Biol 25, 577–582 (2018). [DOI] [PMC free article] [PubMed] [Google Scholar]
- 14.Sample PJ et al. Human 5′ UTR design and variant effect prediction from a massively parallel translation assay. Nat. Biotechnol 37, 803–809 (2019). [DOI] [PMC free article] [PubMed] [Google Scholar]
- 15.Cao J et al. High-throughput 5′ UTR engineering for enhanced protein production in non-viral gene therapies. Nat. Commun 12, 4138 (2021). [DOI] [PMC free article] [PubMed] [Google Scholar]
- 16.Karollus A, Avsec Ž & Gagneur J Predicting mean ribosome load for 5′UTR of any length using deep learning. PLoS Comput. Biol 17, e1008982 (2021). [DOI] [PMC free article] [PubMed] [Google Scholar]
- 17.Bazzini AA et al. Codon identity regulates mRNA stability and translation efficiency during the maternal-to-zygotic transition. EMBO J. 35, 2087–2103 (2016). [DOI] [PMC free article] [PubMed] [Google Scholar]
- 18.Hanson G & Coller J Codon optimality, bias and usage in translation and mRNA decay. Nat. Rev. Mol. Cell Biol 19, 20–30 (2018). [DOI] [PMC free article] [PubMed] [Google Scholar]
- 19.Li S et al. CodonBERT large language model for mRNA vaccines. Genome Res. 34, 1027–1035 (2024). [DOI] [PMC free article] [PubMed] [Google Scholar]
- 20.Szostak E & Gebauer F Translational control by 3′-UTR-binding proteins. Brief. Funct. Genomics 12, 58–65 (2013). [DOI] [PMC free article] [PubMed] [Google Scholar]
- 21.Floor SN & Doudna JA Tunable protein synthesis by transcript isoforms in human cells. eLife 5, e10921 (2016). [DOI] [PMC free article] [PubMed] [Google Scholar]
- 22.Schlusser N, González A, Pandey M & Zavolan M Current limitations in predicting mRNA translation with deep learning models. Genome Biol. 25, 227 (2024). [DOI] [PMC free article] [PubMed] [Google Scholar]
- 23.Li S et al. mRNA-LM: full-length integrated SLM for mRNA analysis. Nucleic Acids Res. 53, gkaf044 (2025). [DOI] [PMC free article] [PubMed] [Google Scholar]
- 24.Vogel C et al. Sequence signatures and mRNA concentration can explain two-thirds of protein abundance variation in a human cell line. Mol. Syst. Biol 6, 400 (2010). [DOI] [PMC free article] [PubMed] [Google Scholar]
- 25.Eraslan B et al. Quantification and discovery of sequence determinants of protein-per-mRNA amount in 29 human tissues. Mol. Syst. Biol 15, e8513 (2019). [DOI] [PMC free article] [PubMed] [Google Scholar]
- 26.Eisen TJ, Li JJ & Bartel DP The interplay between translational efficiency, poly(A) tails, microRNAs, and neuronal activation. RNA 28, 808–831 (2022). [DOI] [PMC free article] [PubMed] [Google Scholar]
- 27.Li JJ, Chew G-L & Biggin MD Quantitative principles of cis-translational control by general mRNA sequence features in eukaryotes. Genome Biol. 20, 162 (2019). [DOI] [PMC free article] [PubMed] [Google Scholar]
- 28.Battle A et al. Genomic variation. Impact of regulatory variation from RNA to protein. Science 347, 664–667 (2015). [DOI] [PMC free article] [PubMed] [Google Scholar]
- 29.Cenik C et al. Integrative analysis of RNA, translation, and protein levels reveals distinct regulatory variation across humans. Genome Res. 25, 1610–1621 (2015). [DOI] [PMC free article] [PubMed] [Google Scholar]
- 30.Schwanhäusser B et al. Global quantification of mammalian gene expression control. Nature 473, 337–342 (2011). [DOI] [PubMed] [Google Scholar]
- 31.Jovanovic M et al. Immunogenetics. Dynamic profiling of the protein life cycle in response to pathogens. Science 347, 1259038 (2015). [DOI] [PMC free article] [PubMed] [Google Scholar]
- 32.Hernandez-Alias X, Benisty H, Radusky LG, Serrano L & Schaefer MH Using protein-per-mRNA differences among human tissues in codon optimization. Genome Biol. 24, 34 (2023). [DOI] [PMC free article] [PubMed] [Google Scholar]
- 33.Spies N, Burge CB & Bartel DP 3′UTR-isoform choice has limited influence on the stability and translational efficiency of most mRNAs in mouse fibroblasts. Genome Res. 23, 2078–2090 (2013). [DOI] [PMC free article] [PubMed] [Google Scholar]
- 34.Ingolia NT, Ghaemmaghami S, Newman JRS & Weissman JS Genome-wide analysis in vivo of translation with nucleotide resolution using ribosome profiling. Science 324, 218–223 (2009). [DOI] [PMC free article] [PubMed] [Google Scholar]
- 35.Li JJ, Bickel PJ & Biggin MD System wide analyses have underestimated protein abundances and the importance of transcription in mammals. PeerJ. 2, e270 (2014). [DOI] [PMC free article] [PubMed] [Google Scholar]
- 36.Gorgoni B, Marshall E, McFarland MR, Romano MC & Stansfield I Controlling translation elongation efficiency: tRNA regulation of ribosome flux on the mRNA. Biochem. Soc. Trans 42, 160–165 (2014). [DOI] [PubMed] [Google Scholar]
- 37.Sonenberg N & Hinnebusch AG Regulation of translation initiation in eukaryotes: mechanisms and biological targets. Cell 136, 731–745 (2009). [DOI] [PMC free article] [PubMed] [Google Scholar]
- 38.Jackson RJ, Hellen CUT & Pestova TV The mechanism of eukaryotic translation initiation and principles of its regulation. Nat. Rev. Mol. Cell Biol 11, 113–127 (2010). [DOI] [PMC free article] [PubMed] [Google Scholar]
- 39.Hinnebusch AG, Ivanov IP & Sonenberg N Translational control by 5′-untranslated regions of eukaryotic mRNAs. Science 352, 1413–1416 (2016). [DOI] [PMC free article] [PubMed] [Google Scholar]
- 40.Sharp PM & Li WH An evolutionary perspective on synonymous codon usage in unicellular organisms. J. Mol. Evol 24, 28–38 (1986). [DOI] [PubMed] [Google Scholar]
- 41.Presnyak V et al. Codon optimality is a major determinant of mRNA stability. Cell 160, 1111–1124 (2015). [DOI] [PMC free article] [PubMed] [Google Scholar]
- 42.Torrent M, Chalancon G, de Groot NS, Wuster A & Madan Babu M Cells alter their tRNA abundance to selectively regulate protein synthesis during stress conditions. Sci. Signal 11, eaat6409 (2018). [DOI] [PMC free article] [PubMed] [Google Scholar]
- 43.Weinberg DE et al. Improved ribosome-footprint and mRNA measurements provide insights into dynamics and regulation of yeast translation. Cell Rep. 14, 1787–1799 (2016). [DOI] [PMC free article] [PubMed] [Google Scholar]
- 44.Gamble CE, Brule CE, Dean KM, Fields S & Grayhack EJ Adjacent codons act in concert to modulate translation efficiency in yeast. Cell 166, 679–690 (2016). [DOI] [PMC free article] [PubMed] [Google Scholar]
- 45.Mauger DM et al. mRNA structure regulates protein expression through changes in functional half-life. Proc. Natl Acad. Sci. USA 116, 24075–24083 (2019). [DOI] [PMC free article] [PubMed] [Google Scholar]
- 46.Verma M et al. A short translational ramp determines the efficiency of protein synthesis. Nat. Commun 10, 5774 (2019). [DOI] [PMC free article] [PubMed] [Google Scholar]
- 47.Burke PC, Park H & Subramaniam AR A nascent peptide code for translational control of mRNA stability in human cells. Nat. Commun 13, 6829 (2022). [DOI] [PMC free article] [PubMed] [Google Scholar]
- 48.Narula A, Ellis J, Taliaferro JM & Rissland OS Coding regions affect mRNA stability in human cells. RNA 25, 1751–1764 (2019). [DOI] [PMC free article] [PubMed] [Google Scholar]
- 49.Forrest ME et al. Codon and amino acid content are associated with mRNA stability in mammalian cells. PLoS ONE 15, e0228730 (2020). [DOI] [PMC free article] [PubMed] [Google Scholar]
- 50.Wu Q et al. Translation affects mRNA stability in a codon-dependent manner in human cells. eLife 8, e45396 (2019). [DOI] [PMC free article] [PubMed] [Google Scholar]
- 51.Hia F et al. Codon bias confers stability to human mRNAs. EMBO Rep. 20, e48220 (2019). [DOI] [PMC free article] [PubMed] [Google Scholar]
- 52.Zhu X, Cruz VE, Zhang H, Erzberger JP & Mendell JT Specific tRNAs promote mRNA decay by recruiting the CCR4-NOT complex to translating ribosomes. Science 386, eadq8587 (2024). [DOI] [PMC free article] [PubMed] [Google Scholar]
- 53.Ozadam H, Geng M & Cenik C RiboFlow, RiboR and RiboPy: an ecosystem for analyzing ribosome profiling data at read length resolution. Bioinformatics 36, 2929–2931 (2020). [DOI] [PMC free article] [PubMed] [Google Scholar]
- 54.Liu Y et al. Translation efficiency covariation across cell types is a conserved organizing principle of mammalian transcriptomes. Preprint at bioRxiv 10.1101/2024.08.11.607360 (2024). [DOI] [Google Scholar]
- 55.Larsson O, Sonenberg N & Nadon R Identification of differential translation in genome wide studies. Proc. Natl Acad. Sci. USA 107, 21487–21492 (2010). [DOI] [PMC free article] [PubMed] [Google Scholar]
- 56.Guo JU & Bartel DP RNA G-quadruplexes are globally unfolded in eukaryotic cells and depleted in bacteria. Science 353, aaf5371 (2016). [DOI] [PMC free article] [PubMed] [Google Scholar]
- 57.Wang D et al. A deep proteome and transcriptome abundance atlas of 29 healthy human tissues. Mol. Syst. Biol 15, e8503 (2019). [DOI] [PMC free article] [PubMed] [Google Scholar]
- 58.Rogers DW, Böttcher MA, Traulsen A & Greig D Ribosome reinitiation can explain length-dependent translation of messenger RNA. PLoS Comput. Biol 13, e1005592 (2017). [DOI] [PMC free article] [PubMed] [Google Scholar]
- 59.Fernandes LD, de Moura APS & Ciandrini L Gene length as a regulator for ribosome recruitment and protein synthesis: theoretical insights. Sci. Rep 7, 17409 (2017). [DOI] [PMC free article] [PubMed] [Google Scholar]
- 60.Witte F et al. A trans locus causes a ribosomopathy in hypertrophic hearts that affects mRNA translation in a protein length-dependent fashion. Genome Biol. 22, 191 (2021). [DOI] [PMC free article] [PubMed] [Google Scholar]
- 61.Thompson MK, Rojas-Duran MF, Gangaramani P & Gilbert WV The ribosomal protein Asc1/RACK1 is required for efficient translation of short mRNAs. eLife 5, e11154 (2016). [DOI] [PMC free article] [PubMed] [Google Scholar]
- 62.Dever TE, Ivanov IP & Hinnebusch AG Translational regulation by uORFs and start codon selection stringency. Genes Dev. 37, 474–489 (2023). [DOI] [PMC free article] [PubMed] [Google Scholar]
- 63.Lewis CJT et al. Quantitative profiling of human translation initiation reveals elements that potently regulate endogenous and therapeutically modified mRNAs. Mol. Cell 85, 445–445 (2024). [DOI] [PMC free article] [PubMed] [Google Scholar]
- 64.Strayer EC et al. NaP-TRAP reveals the regulatory grammar in 5′UTR-mediated translation regulation during zebrafish development. Nat. Commun 15, 10898 (2024). [DOI] [PMC free article] [PubMed] [Google Scholar]
- 65.Alqaraawi A, Schuessler M, Weiß P, Costanza E & Berthouze N Evaluating saliency map explanations for convolutional neural networks: a user study. Preprint at https://arxiv.org/abs/2002.00772 (2020).
- 66.Simonyan K, Vedaldi A & Zisserman A Deep inside convolutional networks: visualising image classification models and saliency maps. Preprint at https://arxiv.org/abs/1312.6034 (2013).
- 67.Shrikumar A et al. Technical note on transcription factor motif discovery from importance scores (TF-MoDISco) version 0.5.6.5 Preprint at https://arxiv.org/abs/1811.00416 (2018).
- 68.Chu D et al. Translation elongation can control translation initiation on eukaryotic mRNAs. EMBO J. 33, 21–34 (2014). [DOI] [PMC free article] [PubMed] [Google Scholar]
- 69.Wu CC-C, Zinshteyn B, Wehner KA & Green R High-resolution ribosome profiling defines discrete ribosome elongation states and translational regulation during cellular stress. Mol. Cell 73, 959–970 (2019). [DOI] [PMC free article] [PubMed] [Google Scholar]
- 70.Gogakos T et al. Characterizing expression and processing of precursor and mature human tRNAs by hydro-tRNAseq and PAR-CLIP. Cell Rep. 20, 1463–1475 (2017). [DOI] [PMC free article] [PubMed] [Google Scholar]
- 71.Sterne-Weiler T et al. Frac-seq reveals isoform-specific recruitment to polyribosomes. Genome Res. 23, 1615–1623 (2013). [DOI] [PMC free article] [PubMed] [Google Scholar]
- 72.Ritter AJ, Draper JM, Vollmers C & Sanford JR Long-read subcellular fractionation and sequencing reveals the translational fate of full-length mRNA isoforms during neuronal differentiation. Genome Res. 34, 2000–2011 (2024). [DOI] [PMC free article] [PubMed] [Google Scholar]
- 73.Nachtergaele S & He C Chemical modifications in the life of an mRNA transcript. Annu. Rev. Genet 52, 349–372 (2018). [DOI] [PMC free article] [PubMed] [Google Scholar]
- 74.Whiffin N et al. Characterising the loss-of-function impact of 5′ untranslated region variants in 15,708 individuals. Nat. Commun 11, 2523 (2020). [DOI] [PMC free article] [PubMed] [Google Scholar]
- 75.Sevilla T et al. Mutations in the MORC2 gene cause axonal Charcot–Marie–Tooth disease. Brain 139, 62–72 (2015). [DOI] [PubMed] [Google Scholar]
- 76.Dueñas Rey A et al. Combining a prioritization strategy and functional studies nominates 5′UTR variants underlying inherited retinal disease. Genome Med. 16, 7 (2024). [DOI] [PMC free article] [PubMed] [Google Scholar]
- 77.Liu L et al. Mutation of the CDKN2A 5′ UTR creates an aberrant initiation codon and predisposes to melanoma. Nat. Genet 21, 128–132 (1999). [DOI] [PubMed] [Google Scholar]
- 78.Damjanovich K et al. 5′UTR mutations of ENG cause hereditary hemorrhagic telangiectasia. Orphanet J. Rare Dis 6, 85 (2011). [DOI] [PMC free article] [PubMed] [Google Scholar]
- 79.Pan X et al. 5′-UTR SNP of FGF13 causes translational defect and intellectual disability. eLife 10, e63021 (2021). [DOI] [PMC free article] [PubMed] [Google Scholar]
- 80.Lee DSM et al. Disrupting upstream translation in mRNAs is associated with human disease. Nat. Commun 12, 1515 (2021). [DOI] [PMC free article] [PubMed] [Google Scholar]
- 81.Lim Y et al. Multiplexed functional genomic analysis of 5′ untranslated region mutations across the spectrum of prostate cancer. Nat. Commun 12, 4217 (2021). [DOI] [PMC free article] [PubMed] [Google Scholar]
- 82.Stephens SB & Nicchitta CV Divergent regulation of protein synthesis in the cytosol and endoplasmic reticulum compartments of mammalian cells. Mol. Biol. Cell 19, 623–632 (2008). [DOI] [PMC free article] [PubMed] [Google Scholar]
- 83.Horste EL et al. Subcytoplasmic location of translation controls protein output. Mol. Cell 83, 4509–4523 (2023). [DOI] [PMC free article] [PubMed] [Google Scholar]
- 84.Hubstenberger A et al. P-body purification reveals the condensation of repressed mRNA regulons. Mol. Cell 68, 144–157 (2017). [DOI] [PubMed] [Google Scholar]
- 85.Chew G-L, Pauli A & Schier AF Conservation of uORF repressiveness and sequence features in mouse, human and zebrafish. Nat. Commun 7, 11663 (2016). [DOI] [PMC free article] [PubMed] [Google Scholar]
- 86.Jia L et al. Decoding mRNA translatability and stability from the 5′ UTR. Nat. Struct. Mol. Biol 27, 814–821 (2020). [DOI] [PubMed] [Google Scholar]
- 87.Akirtava C, May GE & McManus CJ Deciphering the landscape of cis-acting sequences in natural yeast transcript leaders. Nucleic Acids Res. 53, gkaf165 (2025). [DOI] [PMC free article] [PubMed] [Google Scholar]
- 88.Choi Y et al. Time-resolved profiling of RNA binding proteins throughout the mRNA life cycle. Mol. Cell 84, 1764–1782 (2024). [DOI] [PubMed] [Google Scholar]
- 89.Singh G, Pratt G, Yeo GW & Moore MJ The clothes make the mRNA: past and present trends in mRNP fashion. Annu. Rev. Biochem 84, 325–354 (2015). [DOI] [PMC free article] [PubMed] [Google Scholar]
- 90.May GE et al. Unraveling the influences of sequence and position on yeast uORF activity using massively parallel reporter systems and machine learning. eLife 12, e69611 (2023). [DOI] [PMC free article] [PubMed] [Google Scholar]
- 91.Arribere JA et al. Translation readthrough mitigation. Nature 534, 719–723 (2016). [DOI] [PMC free article] [PubMed] [Google Scholar]
- 92.Kramarski L & Arbely E Translational read-through promotes aggregation and shapes stop codon identity. Nucleic Acids Res. 48, 3747–3760 (2020). [DOI] [PMC free article] [PubMed] [Google Scholar]
- 93.Yordanova MM et al. AMD1 mRNA employs ribosome stalling as a mechanism for molecular memory formation. Nature 553, 356–360 (2018). [DOI] [PubMed] [Google Scholar]
- 94.Hashimoto S, Nobuta R, Izawa T & Inada T Translation arrest as a protein quality control system for aberrant translation of the 3′-UTR in mammalian cells. FEBS Lett. 593, 777–787 (2019). [DOI] [PubMed] [Google Scholar]
- 95.Sherlock ME, Baquero Galvis L, Vicens Q, Kieft JS & Jagannathan S Principles, mechanisms, and biological implications of translation termination–reinitiation. RNA 29, 865–884 (2023). [DOI] [PMC free article] [PubMed] [Google Scholar]
- 96.Wu Q et al. Translation of small downstream ORFs enhances translation of canonical main open reading frames. EMBO J. 39, e104763 (2020). [DOI] [PMC free article] [PubMed] [Google Scholar]
- 97.Mayr C Evolution and biological roles of alternative 3′UTRs. Trends Cell Biol. 26, 227–237 (2016). [DOI] [PMC free article] [PubMed] [Google Scholar]
- 98.Subtelny AO, Eichhorn SW, Chen GR, Sive H & Bartel DP Poly(A)-tail profiling reveals an embryonic switch in translational control. Nature 508, 66–71 (2014). [DOI] [PMC free article] [PubMed] [Google Scholar]
- 99.Ozadam H et al. Single-cell quantification of ribosome occupancy in early mouse development. Nature 618, 1057–1064 (2023). [DOI] [PMC free article] [PubMed] [Google Scholar]
- 100.Gruber AR et al. Global 3′ UTR shortening has a limited effect on protein abundance in proliferating T cells. Nat. Commun 5, 5465 (2014). [DOI] [PubMed] [Google Scholar]
- 101.Requião RD, Barros GC, Domitrovic T & Palhano FL Influence of nascent polypeptide positive charges on translation dynamics. Biochem. J 477, 2921–2934 (2020). [DOI] [PubMed] [Google Scholar]
- 102.Dao Duc K & Song YS The impact of ribosomal interference, codon usage, and exit tunnel interactions on translation elongation rate variation. PLoS Genet. 14, e1007166 (2018). [DOI] [PMC free article] [PubMed] [Google Scholar]
- 103.Ahmed N et al. Pairs of amino acids at the P- and A-sites of the ribosome predictably and causally modulate translation–elongation rates. J. Mol. Biol 432, 166696 (2020). [DOI] [PMC free article] [PubMed] [Google Scholar]
- 104.Kirchner S & Ignatova Z Emerging roles of tRNA in adaptive translation, signalling dynamics and disease. Nat. Rev. Genet 16, 98–112 (2015). [DOI] [PubMed] [Google Scholar]
- 105.Ingolia NT, Lareau LF & Weissman JS Ribosome profiling of mouse embryonic stem cells reveals the complexity and dynamics of mammalian proteomes. Cell 147, 789–802 (2011). [DOI] [PMC free article] [PubMed] [Google Scholar]
- 106.Riba A et al. Protein synthesis rates and ribosome occupancies reveal determinants of translation elongation rates. Proc. Natl. Acad. Sci. USA 116, 15023–15032 (2019). [DOI] [PMC free article] [PubMed] [Google Scholar]
- 107.Barrington CL et al. Synonymous codon usage regulates translation initiation. Cell Rep. 42, 113413 (2023). [DOI] [PMC free article] [PubMed] [Google Scholar]
- 108.Lyons EF et al. Translation elongation as a rate limiting step of protein production. Preprint at bioRxiv 10.1101/2023.11.27.568910 (2024). [DOI] [Google Scholar]
- 109.Chen KY, Park H & Subramaniam AR Massively parallel identification of sequence motifs triggering ribosome-associated mRNA quality control. Nucleic Acids Res. 52, 7171–7187 (2024). [DOI] [PMC free article] [PubMed] [Google Scholar]
- 110.Bicknell AA & Ricci EP When mRNA translation meets decay. Biochem. Soc. Trans 45, 339–351 (2017). [DOI] [PubMed] [Google Scholar]
- 111.Bicknell AA et al. Attenuating ribosome load improves protein output from mRNA by limiting translation-dependent mRNA decay. Cell Rep. 43, 114098 (2024). [DOI] [PubMed] [Google Scholar]
- 112.Mishima Y, Han P, Ishibashi K, Kimura S & Iwasaki S Ribosome slowdown triggers codon-mediated mRNA decay independently of ribosome quality control. EMBO J. 41, e109256 (2022). [DOI] [PMC free article] [PubMed] [Google Scholar]
- 113.Bae H & Coller J Codon optimality-mediated mRNA degradation: linking translational elongation to mRNA stability. Mol. Cell 82, 1467–1476 (2022). [DOI] [PMC free article] [PubMed] [Google Scholar]
- 114.Inada T Quality controls induced by aberrant translation. Nucleic Acids Res. 48, 1084–1096 (2020). [DOI] [PMC free article] [PubMed] [Google Scholar]
- 115.Matsuo Y et al. RQT complex dissociates ribosomes collided on endogenous RQC substrate SDD1. Nat. Struct. Mol. Biol 27, 323–332 (2020). [DOI] [PubMed] [Google Scholar]
- 116.Mercier BC et al. Translation-dependent and -independent mRNA decay occur through mutually exclusive pathways defined by ribosome density during T cell activation. Genome Res. 34, 394–409 (2024). [DOI] [PMC free article] [PubMed] [Google Scholar]
- 117.Leppek K, Das R & Barna M Functional 5′ UTR mRNA structures in eukaryotic translation regulation and how to find them. Nat. Rev. Mol. Cell Biol 19, 158–174 (2018). [DOI] [PMC free article] [PubMed] [Google Scholar]
- 118.Liu T-Y et al. Time-resolved proteomics extends ribosome profiling-based measurements of protein synthesis dynamics. Cell Syst. 4, 636–644 (2017). [DOI] [PMC free article] [PubMed] [Google Scholar]
- 119.Shah P, Ding Y, Niemczyk M, Kudla G & Plotkin JB Rate-limiting steps in yeast protein translation. Cell 153, 1589–1601 (2013). [DOI] [PMC free article] [PubMed] [Google Scholar]
- 120.The UniProt Consortium. UniProt: the universal protein knowledgebase in 2021. Nucleic Acids Res. 49, D480–D489 (2021). [DOI] [PMC free article] [PubMed] [Google Scholar]
- 121.Gerashchenko MV & Gladyshev VN Translation inhibitors cause abnormalities in ribosome profiling experiments. Nucleic Acids Res. 42, e134 (2014). [DOI] [PMC free article] [PubMed] [Google Scholar]
- 122.Rodriguez JM et al. APPRIS: selecting functionally important isoforms. Nucleic Acids Res. 50, D54–D59 (2022). [DOI] [PMC free article] [PubMed] [Google Scholar]
- 123.Pedregosa F et al. Scikit-learn: machine learning in Python. J. Mach. Learn. Res 12, 2825–2830 (2011). [Google Scholar]
- 124.Ke G et al. LightGBM: a highly efficient gradient boosting decision tree. In Proc. 31st International Conference on Neural Information Processing Systems (eds von Luxburg U & Guyon I) 3146–3154 (Curran Associates, 2017). [Google Scholar]
- 125.Kokhlikyan N et al. Captum: a unified and generic model interpretability library for PyTorch. Preprint at https://arxiv.org/abs/2009.07896 (2020).
- 126.Gudmundsson S et al. Addendum: the mutational constraint spectrum quantified from variation in 141,456 humans. Nature 597, E3–E4 (2021). [DOI] [PMC free article] [PubMed] [Google Scholar]
- 127.Zheng D, Wang J & Agarwal V RiboNN: a deep learning model to predict translation efficiency from mRNA sequence. Zenodo 10.5281/zenodo.15360345 (2025). [DOI] [Google Scholar]
- 128.Persyn L, Liu Y & Cenik C Classic TE prediction model. Zenodo 10.5281/zenodo.15360966 (2025). [DOI] [Google Scholar]
- 129.Pagès H, Aboyoun P, Gentleman R & DebRoy S Biostrings: efficient manipulation of biological strings. Bioconductor 10.18129/B9.bioc.Biostrings (2025). [DOI] [Google Scholar]
Associated Data
This section collects any data citations, data availability statements, or supplementary materials included in this article.
Supplementary Materials
Data Availability Statement
We provide the processed data without restriction in supplementary tables herein.
Code and pretrained models are available on Zenodo127 and GitHub (https://github.com/Sanofi-Public/RiboNN/). Our classic ML model code is available on Zenodo128 and GitHub (https://github.com/CenikLab/TE_classic_ML).