Abstract
Chemotherapy resistance is a key obstacle in the treatment of triple-negative breast cancer (TNBC). Single-cell RNA sequencing (scRNA-seq) plays a pivotal part in revealing the mechanism of drug resistance in tumors. This work aimed to explore the molecular events driving TNBC resistance based on scRNA-seq data. Breast cancer (BC) scRNA-seq data GSE176078 was sourced from the GEO database. Nine TNBC samples were analyzed. The cellular composition and differentially expressed genes of TNBC were clarified through dimension reduction, clustering, and cell annotation. Drug-resistant and sensitive epithelial cell clusters in malignant epithelial cells were identified, with their heterogeneity analyzed. Key genes driving drug-resistant epithelium were screened and KEGG enrichment analysis was undertaken. The expression of Ubiquitin Carboxy-Terminal Hydrolase L1 (UCHL1) in TNBC was examined. The effect and molecular mechanism of UCHL1 on cisplatin (CDDP) resistance in TNBC was confirmed by constructing CDDP-resistant cell lines. We successfully identified resistant and sensitive cell clusters in malignant epithelial cells of TNBC and screened for the greatly upregulated gene UCHL1 in the resistant epithelium. KEGG analysis revealed its enrichment in the ferroptosis signaling pathway. Further analyses demonstrated the upregulation of UCHL1 in CDDP-resistant TNBC cells. Knocking down UCHL1 potentiated the sensitivity of TNBC cells to CDDP treatment and reinforced ferroptosis. The ferroptosis inhibitor Ferrostatin-1 reversed the inhibitory effect of UCHL1 knockdown on CDDP resistance. UCHL1 reinforces CDDP resistance in TNBC by suppressing ferroptosis. The study brings new insights into the drug-resistance mechanism of TNBC.
Keywords: single-cell RNA sequencing, UCHL1, ferroptosis, cisplatin resistance, triple-negative breast cancer
Introduction
Breast cancer (BC) is the leading cancer killer threatening global women’s health.(1) Triple-negative breast cancer (TNBC) is the most aggressive subtype of BC.(2) TNBC lacks targets for effective endocrine therapy and targeted therapy because it does not express estrogen (ER), progesterone (PR), and human epidermal growth factor 2 (HER2).(3) In the past few decades, chemotherapy has been the main treatment for TNBC, represented by paclitaxel/anthracycline drugs. However, considering the increasing cardiotoxicity and resistance of anthracycline drugs, researchers have shifted their focus to platinum-based drugs [such as cisplatin (CDDP), carboplatin, and oxaliplatin)] or their combination with other treatment modalities (such as other chemotherapy drugs, molecular targeted therapy, and immunotherapy). Although platinum-based anticancer drugs are not the first-line treatment for TNBC, literature has reported that they have good anti-tumor effects: CDDP can induce TNBC heat shock by activating the MEG3/NLRP3/caspase-1/GSDMD pathway.(4) MiR-320c is downregulated in TNBC patients, and miR-320c mimetic and oxaliplatin can effectively inhibit the progression of TNBC.(5) However, the emergence of primary or acquired drug resistance has greatly limited the efficiency of chemotherapy, resulting in high metastasis rates and dismal prognosis in TNBC patients.(6) Therefore, elucidating the potential molecular mechanisms of CDDP resistance in TNBC is an urgent issue to be solved at present.
Ferroptosis is an iron-dependent form of cell death characterized by the consumption of glutathione (GSH) and the accumulation of reactive oxygen species (ROS).(7) Ferroptosis has been proven to play a key part in tumor suppression to provide new opportunities for cancer treatment. A variety of small molecules and clinical drugs approved by the US Food and Drug Administration have activated ferroptosis in cancer cells, and these ferroptosis inducers can hinder tumor progression in various experimental cancer models, demonstrating the anti-tumor potential of ferroptosis inducers.(8) In addition, ferroptosis is also closely linked to chemotherapy resistance in multiple cancers. Drug-resistant tumor cells often exhibit high sensitivity to ferroptosis. Drug resistance of cancer cells may be reversed by regulating ferroptosis.(9) For example, inducing ferroptosis can enhance the therapeutic effect of CDDP on gastric cancer and overcome resistance.(10) In TNBC, Song et al.(11) discovered that repression of ferroptosis can reduce the CDDP sensitivity of cancer cells. Therefore, elucidating the linkage between ferroptosis and CDDP resistance will bring new insights into cancer treatment.
Ubiquitin Carboxy-Terminal Hydrolase L1 (UCHL1) is a ubiquitin C-terminal hydrolase that belongs to the deubiquitin (DUB) enzyme family and has the functions of modulating cell proliferation, differentiation, and transcription regulation.(12) Currently, UCHL1 is upregulated in a variety of cancers, including TNBC, and has a bearing on the aggressive progression of tumors.(13,14) In addition, UCHL1 is also involved in HER2 + BC(15) and non-small cell lung cancer (NSCLC).(16) Interestingly, UCHL1 functions as a tumor suppressor in ovarian cancer (OC) and can overcome the CDDP resistance of OC cells.(17) However, the function of UCHL1 in CDDP resistance in TNBC remains unclear.
Recent single-cell sequencing (scRNA-seq) based on cellular and molecular features has deepened our understanding of the mechanisms of drug resistance in tumors.(18,19) In this research, we identified drug-resistant and sensitive cell clusters in TNBC using the publicly available human sequencing dataset GSE176078. Through differential gene screening, the key gene UCHL1 driving drug-resistant epithelium was obtained, and its considerably enriched signal pathways were analyzed. Further cell experiments confirmed the impact and regulatory mechanism of UCHL1 on CDDP resistance sensitivity in TNBC. Our results provided references for understanding the heterogeneity of TNBC and the mechanisms affecting chemotherapy resistance, thus offering new targets for improving prognosis in TNBC patients.
Materials and Methods
Collection of scRNA-seq data
The published BC single-cell data GSE176078 was downloaded from the Gene Expression Omnibus (GEO) database,(20) which included 26 primary BC types with 3 major clinical subtypes, including 12 ER + BC, 5 HER2 + BC, and 9 TNBC patients. Among them, TNBC samples were selected for data analysis, including 38,147 cells.
Quality control and analysis of scRNA-seq data
Single-cell data were controlled using the Seurat (ver. 5.0) package to exclude low-quality cells. We excluded genes detected in <3 cells, cells with a total number of detected genes <300, cells with a total number of detected genes ≥5,000, cells with a number of RNA molecules ≥10,000, as well as cells with a percentage of mitochondrial genes ≥10. Then, the normalized data after quality control was standardized using the NormalizeData function. The top 2,000 highly variable genes were obtained using the FindVariableFeatures function. The ScaleData function was utilized to linearly transform highly variable genes. RunPCA was utilized to do the principal component analysis (PCA) on 2,000 genes to reduce data dimensions. The elbowplot was employed to determine the number of principal components. Samples were batch-corrected using the harmony (ver. 1.2) package. Single cells were clustered using the Louvain algorithm. By utilizing tSNE and UMAP, dimensionality and visualization were undertaken. We employed cell type markers to manually annotate main cell groups, identified sub-clusters of each major cell type to assess the microenvironment, and clustered each type of cell separately again. With comprehensive enrichment analysis and cell marker genes in different functional states in the literature, manual annotation was undertaken. We employed the FindAllMarkers function to identify important genes. Standards (|Log2FC| >0.5, P. adj <0.05) were set to screen out DEGs between different groups.
Identification of epithelial cell clusters
After the initial annotation, all epithelial cells were extracted and employed to calculate the large-scale chromosome copy number variation (CNV) scores of the epithelial cells using the inferCNV software package. T cells were selected as reference cells. Default parameters were determined (cutoff = 0; denoise = 0.2). The CNV score was calculated as the quadratic sum of the CNV regions. Epithelial cells were divided into malignant and non-malignant cell clusters based on CNV scores.
According to the KEGG gene set MISMATCH REPAIR (including 23 genes associated with DNA damage repair: EXO1, LIG1, MLH1, MLH3, MSH2, MSH3, MSH6, PCNA, PMS2, POLD1, POLD2, POLD3, POLD4, RFC1, RFC2, RFC3, RFC4, RFC5, RPA1, RPA2, RPA3, RPA4, and SSBP1), AUCell, and AddModuleScore were employed to calculate the MISMATCH_REPAIR_Score for each malignant epithelial cell cluster. Clusters were divided into drug-resistant epithelial cell clusters and sensitive epithelial cell clusters based on the score.
Pseudo-timing analysis
To reveal the differences between drug-resistant and sensitive epithelial cells, Monocle (ver. 2.32) software was utilized to analyze cell trajectories and the differentiation process.(21) Finally, the trajectory was visualization through the plot_cell_trajectory function.
Metabolic pathway analysis and gene enrichment analysis
Metabolic pathway activity analysis was based on the average expression levels of metabolic genes in different cell types.(22) Based on the specific genes identified, the Kyoto Encyclopedia of Genes and Genomes (KEGG) enrichment analysis(23) on the specific genes was undertaken by utilizing the online tool David.(24)
Analysis of target gene expression based on the Cancer Genome Atlas (TCGA) database
We downloaded BC mRNA expression data and corresponding clinical typing data from the TCGA database,(25) extracted target gene expression data, and analyzed the expression differences of target genes in different BC subtypes and normal tissues.
Cell cultivation and construction of drug-resistant strains
Normal breast epithelial cell line MCF10A and TNBC cell lines MDA-MB-231, MDA-MB-436, and BT549 were obtained from Wuhan Sunncell Biotechnology (Wuhan, China). MCF10A cells were placed in an MCF 10A cell-specific medium (Wuhan Sunncell Biotechnology). MDA-MB-231 and MDA-MB-436 cells were kept in the DMEM medium (Gibco, Thermo Fisher Scientific, Waltham, MA) supplemented with 10% fetal bovine serum (FBS, Gibco) and 1% penicillin-streptomycin. BT549 cells were placed in the RPMI1640 medium (Gibco) supplemented with 10% FBS, 10 μg/ml recombinant human insulin solution (Wuhan Sunncell Biotechnology), and 1% penicillin-streptomycin, and placed in a humidified incubator at 37°C containing 5% CO2. CDDP-resistant TNBC cell lines were obtained by continuous exposure to CDDP at doses of 0.5 μg/ml to 3 μg/ml for at least 6 months.(26)
Cell transfection and drug treatment
The short hairpin RNA of UCHL1 (sh-UCHL1) and its negative control (sh-NC) were purchased from GenePharma (Shanghai, China). Cells were transfected with the above shRNA with the help of Lipofectamine 2,000 (Thermo Fisher Scientific) for 48 h. Cells were incubated with the ferroptosis inhibitor Ferrostatin-1 (10 μM; MedChemExpress, Monmouth Junction, NJ) for 24 h to suppress ferroptosis.
Quantitative polymerase chain reaction (qPCR)
Total RNA in cells was extracted using TRIzol reagent (Beyotime, Shanghai, China), and the concentration and quality of RNA were determined on a NanoDrop one micro ultraviolet-visible spectrophotometer (Thermo Fisher Scientific). cDNA was synthesized by BeyoRTTMII First Strand cDNA Synthesis Kit (Beyotime), and then PCR reactions were conducted on the ABI PRISM 7500 system (Applied Biosystems, Waltham, MA) using the SYBR Premix Ex Taq II Kit (Takara Bio, Kusatsu, Japan). The 2−ΔΔCt method was utilized to determine the relative expression level of the target gene mRNA, with GAPDH serving as an internal reference. The primers are listed in Table 1.
Table 1.
Primer sequence in qPCR
| Gene | Sequence (5'→3') | |
|---|---|---|
| UCHL1 | Forward Primer | AGAGCTGAAGGGACAAGAAG |
| Reverse Primer | CTTGATTATTGGCCACTGCG | |
| GAPDH | Forward Primer | ACAACTTTGGTATCGTGGAAGG |
| Reverse Primer | GCCATCACGCCACAGTTTC | |
CCK-8 assay
TNBC cells from different treatment groups were seeded on 96-well cell culture plates (4 × 10³ cells/well) and incubated with different concentrations of CDDP (0.1, 1, 5, 10, 25, 50, and 100 μM) for 48 h. Then, 10 μl of CCK-8 solution (Beyotime) was put into each well. After 4 h of incubation, the absorbance values of each well were examined at 450 nm using a microplate reader (Thermo Fisher Scientific). Cell viability was calculated. Based on the cell viability data of different concentrations of CDDP treatment groups, the relation curve between CDDP concentration and cell viability was drawn. The IC50 values of CDDP on cells (the CDDP concentration at which cell viability was inhibited by 50%) in different treatment groups were calculated using GraphPad Prism 8.0 software.
Colony formation assay
TNBC cells were seeded in 12-well cell culture plates (400 cells/well) and treated with 10 μM CDDP for 24 h. After incubating for an additional 10 days, an appropriate amount of 75% ethanol was introduced. Cells were fixed for 15 min. 75% ethanol was discarded and cells were stained with 0.1% crystal violet (Solarbio, Beijing, China) for 10 min. The staining solution was removed. The culture plate was rinsed slowly with clear water to remove the excess staining solution. After drying, a camera (Nikon, Tokyo, Japan) was employed to take photos and count the colonies.
Apoptosis analysis via flow cytometry
Apoptosis was assessed by utilizing the Annexin V-FITC Apoptosis Detection Kit (Beyotime). First, cells were put on a 6-well cell culture plate (1 × 10⁵ cells/well) and treated with 10 μM CDDP for 24 h. The cells after trypsinization, PBS buffer washing, and centrifugation were collected. 195 μl Annexin V-FITC binding solution was added to resuspend the cells. 5 μl Annexin V-FITC and 10 μl PI staining solution were added, gently mixed, and incubated at room temperature in the dark for 10 min. The level of apoptosis was analyzed using a NovoCyte flow cytometer (Agilent, Santa Clara, CA).
Lipid ROS assessment
Cells were seeded in 6-well cell culture plates (1 × 10⁵ cells/well), then 10 μM BBODIPY-581/591C11 (Thermo Fisher Scientific) was added and incubated for 30 min. Next, lipid ROS levels were tested in flow cytometry.
Determination of lipid oxidation (MDA), GSH, and Fe2+ content
The levels of MDA, GSH, and Fe2+content in cells were detected with the use of the lipid MDA detection kit (Beyotime), the GSH detection kit (Abbkine, Atlanta, GA), and the Cell Ferrous Iron Colorimetric Assay Kit (Elabscience, Houston, TX).
Statistical analysis
All experiments were independently repeated at least three times. Experimental data were analyzed using GraphPad Prism 8.0 software and displayed as mean ± SD. Student’s t test was employed for comparing differences between the two groups, and a one-way analysis of variance was for comparing differences between multiple groups. P<0.05 indicated a significant difference.
Results
TNBC single-cell atlas based on public databases
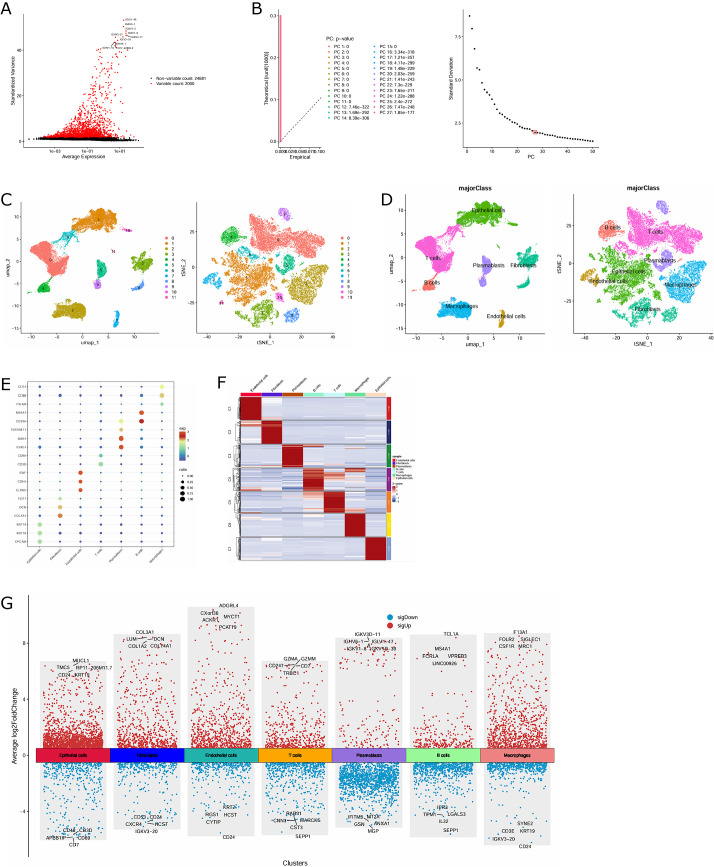
We selected 9 TNBC samples from the BC single-cell dataset GSE176078 for data analysis, with a total of 38,147 cells included. After quality control screening of the above scRNA-seq data, 37,748 cells and 2,000 highly variable genes were obtained (Fig. 1A). PCA was undertaken to determine available dimensions and screen for relevant genes. 27 principal components with p<0.05 were selected for subsequent analysis (Fig. 1B). Subsequently, using tSNE and UMAP for dimensionality reduction, the cells in TNBC were divided into 12 distinct clusters (Fig. 1C). The main cell populations of these clusters were manually denoted using cell type markers, and a total of 7 main cell types were obtained, including epithelial cells, T cells, B cells, plasmablasts, fibroblasts, macrophages, and endothelial cells, with epithelial cells, T cells, and macrophages accounting for the largest proportion (Fig. 1D). The expression ratio and intensity of specific marker genes in each cell population were displayed in bubble plots (Fig. 1E). The heat map of the top 100 genes in each cell cluster was graphed (Fig. 1F). Then, we employed the FindAllMarkers function to identify and screen for DEGs between different cell populations (Fig. 1G).
Fig. 1.
Construction of TNBC single-cell map based on scRNA-seq data. (A) 2,000 highly variable genes. (B) 27 principal components with P<0.05 were determined by PCA. (C) Dimension reduction and visualization of 12 cell clusters in TNBC through tSNE and UMAP. (D) Annotated 12 cell clusters in TNBC based on marker genes for specific cell types. (E) Bubble chart of the expression ratio and intensity of marker genes used to distinguish cell types in each cell cluster. (F) Heat map of the top 100 genes of different TNBC cell clusters. (G) Volcanic map of DEGs between different cell populations.
Identification of malignant and drug-resistant epithelial cell clusters
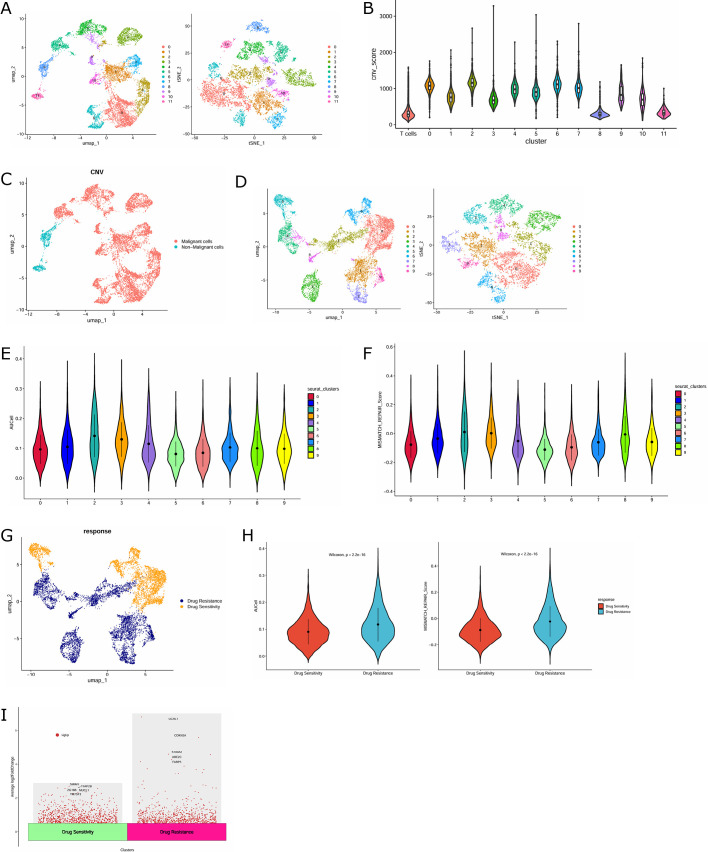
Given that TNBC is derived from breast epithelial cells, we re-performed cluster analysis on the labeled 10,074 epithelial cells and clustered them into 12 clusters by using tSNE and UMAP methods (Fig. 2A). InferCNV analysis was undertaken with T cells as reference cells. By calculating the CNV scores, clusters 0, 1, 2, 3, 4, 5, 6, 7, 9, and 10 were found to have dramatic differences compared with the reference cells. Therefore, the above clusters were defined as malignant epithelial cells (Fig. 2B). The distribution of malignant and non-malignant cells in epithelial cells was demonstrated by UMAP maps (Fig. 2C). The malignant epithelial cells were again re-clustered and divided into 10 clusters (Fig. 2D). Afterwards, the AUCell package and Addmodulescore function were applied to further identify malignant epithelial cells as drug-resistant clusters (clusters 1, 2, 3, 4, 7, 8, and 9) and non-resistant clusters (clusters 0, 5, and 6) (Fig. 2E–G). Drug-resistant cell clusters exhibited higher MISMATCH_REPAIR scores than non-resistant clusters, confirming the rationality of our cell classification (Fig. 2H). In addition, we analyzed the DEGs in drug-resistant and sensitive epithelial cells. As shown in Fig. 2I, UCHL1, CDKN2A, S100A2, UBE2C, and FABP5 were dramatically upregulated genes in drug-resistant epithelial cells.
Fig. 2.
Identification of malignant and drug-resistant epithelial cell clusters. (A) Dimension reduction and visualization of 12 cell clusters in TNBC epithelial cells by tSNE and UMAP. (B) Violin chart of CNV scores for different epithelial cell clusters. (C) UMAP map of malignant and non-malignant epithelial cells among epithelial cells. (D) Dimension reduction and visualization of 10 cell clusters in malignant tumor cells through tSNE and UMAP. (E, F) Violin graph of AUCell and MISMATCH_REPAIR scores for different malignant tumor cell clusters. (G) UMAP map of resistant and non-resistant clusters in malignant tumor cells. (H) Violin plot of AUCell and MISMATCH_REPAIR scores for resistant and non-resistant clusters. (I) Volcano map of genetic differences between drug-resistant and sensitive epithelial cells.
Pseudo-time and metabolic analysis of differentiation between resistant and sensitive epithelial cell clusters
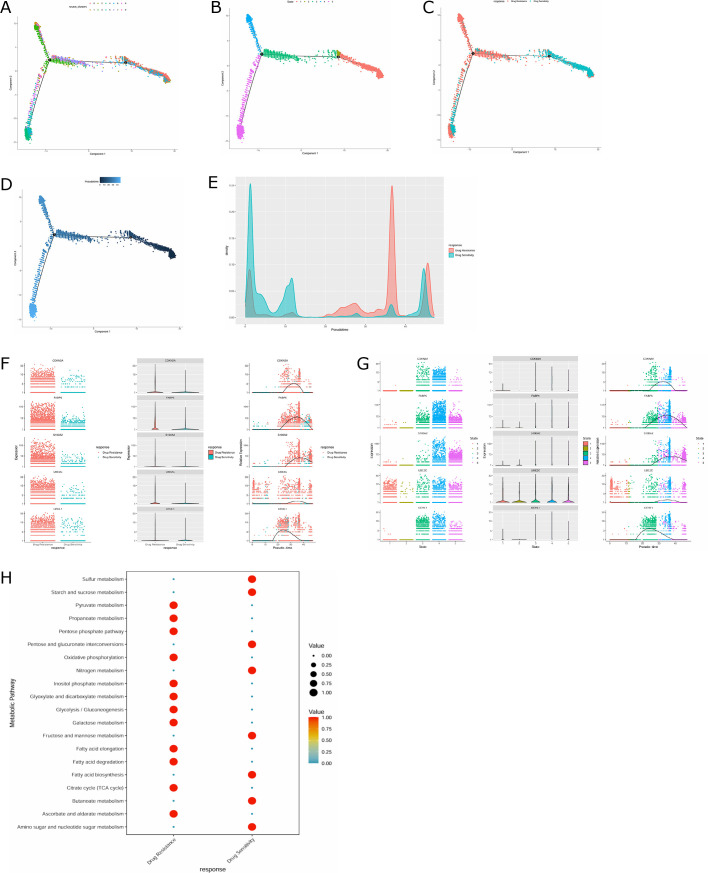
Next, we applied Monocle2 to the pseudo-temporal analysis to dig out the development trajectories of different cells. The cluster distribution in the trajectory diagram revealed three branches of malignant epithelial cells (Fig. 3A). The differentiation trajectory map manifested that malignant epithelial cells had five main cell states (Fig. 3B). Drug-resistant epithelial cells were mainly distributed in the third and fourth states (Fig. 3C). Figure 3D shows the temporal sequence of differentiation of different cell clusters, with darker cells gradually transitioning to lighter cells, indicating that drug-sensitive cells were in the early stage of cell development and differentiated into drug-resistant cells along the development trajectory. Drug-resistant cell clusters were mainly located in late cell development (Fig. 3E). In addition, we also analyzed the expression changes on the Timeline of five genes (UCHL1, CDKN2A, S100A2, UBE2C, and FABP5) that were remarkably up-regulated in drug-resistant epithelial cells. The results showed that the expression of UCHL1 elevated greatly in later cell development (Fig. 3F and G).
Fig. 3.
Trajectory analysis and metabolic analysis of drug-resistant and sensitive epithelial cells. (A) Trajectory diagram of malignant epithelial cell clusters. (B) Trajectory map of the status of malignant epithelial cells. (C) Trajectory map of drug-resistant and sensitive epithelial cells. (D) Trajectory diagram of cell differentiation time. (E) The peak density of drug-resistant and sensitive epithelial cells on the Timeline. (F, G) The expression changes on a timeline of five genes (UCHL1, CDKN2A, S100A2, UBE2C, and FABP5) that were significantly up-regulated in drug-resistant epithelial cells. (H) Analysis of metabolic pathways in drug-resistant and sensitive epithelial cells.
The metabolic pathways of drug-resistant and sensitive epithelial cells were further analyzed using the metabolism package. The results uncovered that compared with drug-sensitive epithelial cells, metabolic pathways such as pyruvate metabolism, pentose phosphate pathway, oxidative phosphorylation, and glycolysis/gluconeogenesis were considerably enriched in drug-resistant epithelial cells (Fig. 3H).
Identification of key genes driving TNBC resistance in epithelial cells
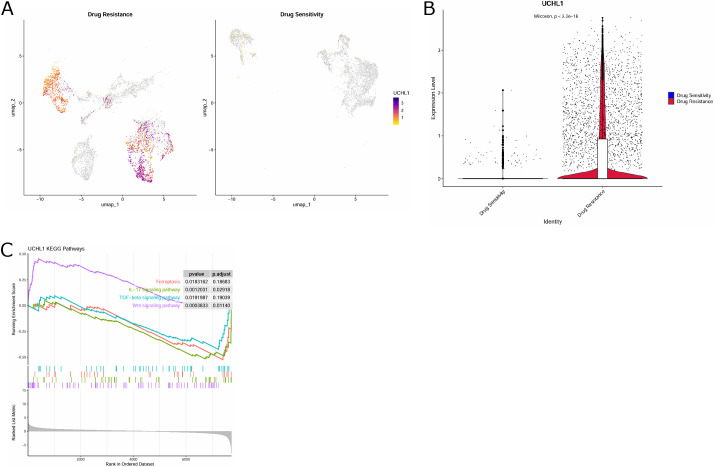
UCHL1 reinforces chemotherapy resistance in a variety of cancers.(15,16) Combined with the above results, we believe that UCHL1 may play a pivotal part in TNBC-resistant malignant epithelium. Next, by further visualizing the expression of UCHL1 in drug-resistant and sensitive epithelial cells through UMAP, we observed that UCHL1 had a higher expression level in drug-resistant cell clusters compared with drug-sensitive epithelial cells (Fig. 4A). UCHL1 was considerably over-expressed in drug-resistant cell clusters (Fig. 4B). The above results further suggested that UCHL1 may be implicated in TNBC resistance. Moreover, we also launched KEGG enrichment analysis on UCHL1 to probe into possible pathways through which UCHL1 affected TNBC resistance. UCHL1 was greatly enriched in the ferroptosis signaling pathway (Fig. 4C). In summary, UCHL1 is a key gene driving resistant malignant epithelium in TNBC.
Fig. 4.
Identification of key genes driving drug resistance in epithelial cells. (A) UMAP map showing UCHL1 expression in drug-resistant and sensitive epithelial cells. (B) Violin diagram showing differences in UCHL1 expression in drug-resistant and sensitive epithelial cells. (C) KEGG enrichment analysis on UCHL1.
Target gene UCHL1 is highly upregulated in TNBC
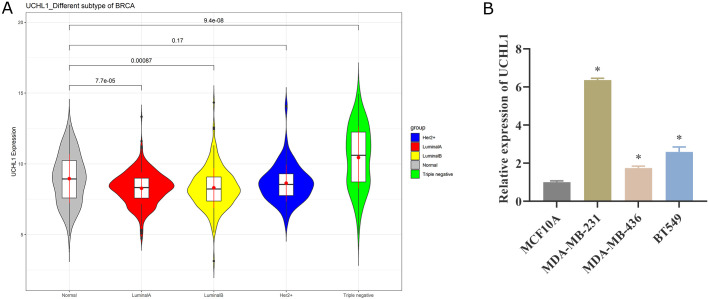
We utilized the TCGA database to assess the expression of UCHL1 in four BC subtypes. Compared with normal adjacent cancer tissues, the expression of UCHL1 declined in Luminal A BC and Luminal B BC, while UCHL1 was considerably high in TNBC (Fig. 5A). We further examined the expression difference of UCHL1 in normal breast epithelial cells MCF10A and TNBC cells MDA-MB-231, MDA-MB-436, and BT549 by qPCR, and discovered that UCHL1 expression was up-regulated in all three TNBC cell lines (Fig. 5B). Collectively, UCHL1 is highly expressed in TNBC.
Fig. 5.
UCHL1 is up-regulated in TNBC. (A) Expression of UCHL1 in normal tissues adjacent to cancer and four BC subtypes based on TCGA database. (B) qPCR was used to detect the expression difference of UCHL1 in normal breast epithelial cells MCF10A and TNBC cells MDA-MB-231, MDA-MB-436, and BT549.
Knockdown of UCHL1 represses CDDP resistance in TNBC
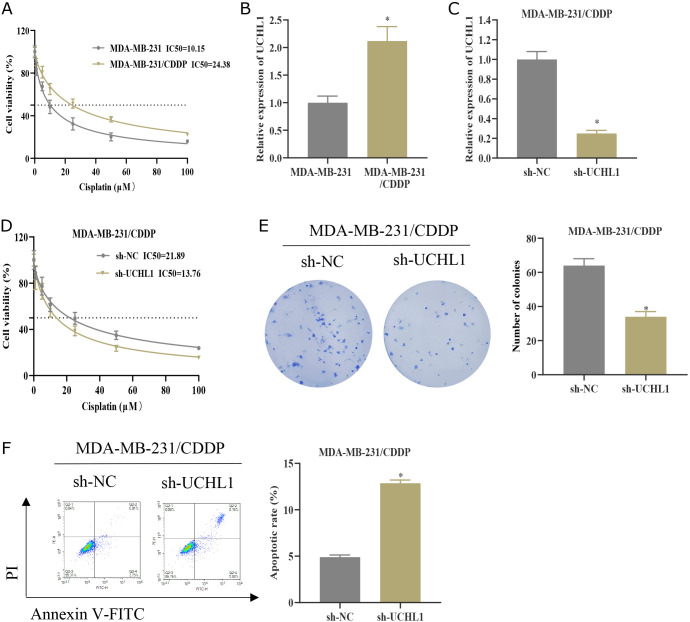
We probed into the impact of UCHL1 on CDDP resistance in TNBC at the cellular level. MDA-MB-231 was first exposed to increasing concentrations of CDDP to build a CDDP-resistant cell line MDA-MB-231/CDDP. The IC50 value of MDA-MB-231/CDDP was higher than that of the corresponding CDDP-sensitive cells (Fig. 6A).(27) Moreover, the expression of UCHL1 was dramatically upregulated in MDA-MB-231/CDDP cells (Fig. 6B). Afterward, we constructed a stable cell line with sh-NC/sh-UCHL1, which was established based on CDDP-resistant cell lines. We verified the knockdown efficiency of MDA-MB-231/CDDP cells in the sh-UCHL1 group by qPCR (Fig. 6C). The IC50 value of cell viability analysis was determined by the CCK-8 assay. Knocking down UCHL1 dramatically dampened the viability of MDA-MB-231/CDDP cells and reduced the IC50 value (Fig. 6D). Furthermore, compared to the control group, the knockdown of UCHL1 suppressed the colony number of MDA-MB-231/CDDP cells (Fig. 6E) and elevated the apoptosis rate (Fig. 6F). Collectively, knocking down UCHL1 represses resistance to CDDP in TNBC cells.
Fig. 6.
Knockdown of UCHL1 represses CDDP resistance in TNBC. (A) The cell viability of MDA-MB-231 and MDA-MB-231/CDDP cells treated with different concentrations of CDDP (0.1, 1, 5, 10, 25, 50, and 100 μM) was measured by the CCK-8 assay. The IC50 values were analyzed. (B) The expression level of UCHL1 in MDA-MB-231 and MDA-MB-231/CDDP was detected by qPCR. (C) Establishment of sh-NC/sh-UCHL1 MDA-MB-231/CDDP grouping. UCHL1 expression level was detected by qPCR. (D) The cell viability of MDA-MB-231/CDDP was measured by the CCK-8 method and the IC50 value was analyzed. (E) Cell proliferation was analyzed by colony formation assay. (F) Flow cytometry was used to analyze apoptosis. * represents p<0.05.
Knockdown of UCHL1 depresses CDDP resistance in TNBC by facilitating ferroptosis
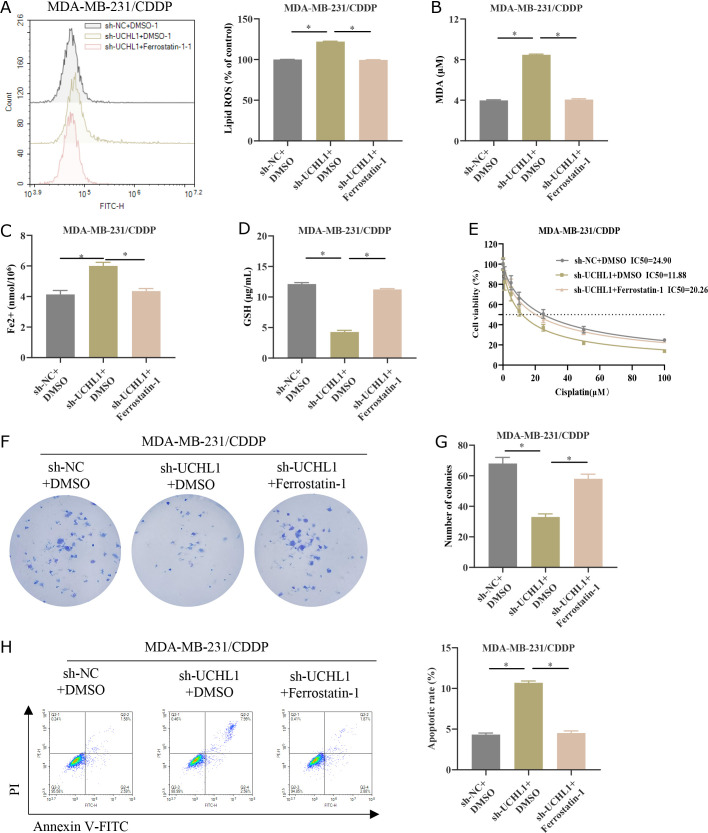
KEGG analysis identified UCHL1 in the ferroptosis pathway, so we further investigate whether UCHL1 affected CDDP resistance in TNBC through the regulation of ferroptosis. Firstly, we constructed the following groups based on MDA-MB-231/CDDP cells: sh-NC + DMSO, sh-UCHL1 + DMSO, and sh-UCHL1 + Ferrostatin-1 (ferroptosis inhibitor). We detected the levels of lipid ROS in three groups of MDA-MB-231/CDP cells. Knocking down UCHL1 increased the accumulation of lipid ROS in MDA-MB-231/CDP, while the addition of Ferrostatin-1 weakened the promoting effect of knocking down UCHL1 on lipid ROS accumulation (Fig. 7A). In addition, knocking down UCHL1 significantly increased the levels of MDA and Fe2+ in MDA-MB-231/CDDP, but decreased GSH levels. The addition of Ferrostatin-1 weakened the promoting or inhibitory effects caused by knocking down UCHL1 (Fig. 7B–D). The above experiments indicated that knocking down UCHL1 can promote ferroptosis in TNBC cells. After treatment with different concentrations of CDDP (0.1, 1, 5, 10, 25, 50, and 100 μM), the IC50 values were analyzed by the CCK-8 method. Ferrostatin-1 attenuated the inhibitory effect of knockdown UCHL1 on the IC50 value of CDDP (Fig. 7E).(27) The subsequent colony formation assay uncovered that the addition of Ferrostatin-1 reversed the inhibition of tumor cell proliferative ability conferred by UCHL1 knockdown (Fig. 7F and G). Additionally, the facilitating effect of UCHL1 knockdown on MDA-MB-231/CDDP apoptosis was also reversed by Ferrostatin-1 treatment (Fig. 7H). Given the above results, knocking down UCHL1 can repress CDDP resistance in TNBC by enhancing ferroptosis.
Fig. 7.
Knockdown of UCHL1 suppresses CDDP resistance in TNBC by facilitating ferroptosis. (A) MDA-MB-231/CDDP cell groups of sh-NC/sh-UCHL1 were established. The lipid ROS levels in the cells were detected by flow cytometry. (B–D) MDA, Fe2+ and GSH levels in MDA-MB-231/CDDP cells were detected by kits. (E) MDA-MB-231/CDDP cell groups of sh-NC + DMSO, sh-UCHL1 + DMSO, and sh-UCHL1 + Ferrostatin-1 (ferroptosis inhibitor) were established. Cell viability under different concentrations of CDDP (0.1, 1, 5, 10, 25, 50, and 100 μM) was measured by the CCK-8 assay. IC50 values were analyzed. (F, G) Cell proliferation was analyzed by colony formation assay. (H) Flow cytometry was used to analyze apoptosis. * represents p<0.05.
Discussion
Currently, chemotherapy is still the standard treatment for TNBC, but drug resistance has severely limited the efficiency of treatment.(28) Tumor heterogeneity is one of the important factors leading to chemotherapy resistance. The scRNA-seq can help us identify the variability and gene expression of individual cells. It can better manifest tumor-intrinsic heterogeneity to innovate new resistance treatment targets and biomarkers.(29,30) Therefore, this research analyzed TNBC scRNA-seq data from public databases, revealed the heterogeneity of malignant epithelial cells in TNBC, and identified drug-resistant and sensitive cell clusters in malignant epithelial cells. We also identified UCHL1 as a potential regulator driving TNBC resistance and dissected its enriched ferroptosis pathway, which was confirmed through in vitro experiments.
We selected scRNA-seq data from 9 TNBC samples and identified the cellular and molecular characteristics of TNBC. After dimensionality reduction, clustering, and cell annotation, 7 major cell types were obtained, with epithelial cells, T cells, and macrophages being the most prevalent cells. DEGs between different cell populations were screened. The tumor-intrinsic heterogeneity of TNBC was reflected. Normal breast epithelial cells are the origin cells of TNBC. Under the influence of specific genetic and environmental factors, they gradually lose their normal cell regulatory mechanisms and transform into malignant form TNBC.(31) Through an in-depth study of epithelial cells, we can better interpret the mechanisms of occurrence and development of TNBC. Therefore, we further clustered malignant epithelial cells into drug-resistant and sensitive clusters to select TNBC-resistant treatment targets. We also utilized pseudo-temporal analysis to dissect the developmental trajectories of resistant and sensitive cells, finding that drug-sensitive cells were in an early stage of cellular development and could differentiate into resistant cells along the developmental trajectory. Additionally, numerous works have proven that metabolic reprogramming is an instrumental participant in tumor proliferation, metastasis, and resistance mechanisms.(32,33) Therefore, interpreting the metabolic characteristics of resistant and sensitive cells will proffer new theoretical references and a foundation for the treatment of TNBC patients. The analysis results of metabolic pathways in resistant and sensitive epithelial cells indicated that oxidative pathways such as phosphorylation and glycolysis were greatly enriched by resistant epithelial cells. These findings deepened a comprehensive understanding of the heterogeneity of drug resistance and sensitive cell clusters and provided a reference for understanding the link between cancer metabolism and drug resistance.
Next, we analyzed DEGs in drug-resistant and sensitive epithelial cells to identify potential regulatory factors driving TNBC resistance. Among them, the gene UCHL1, which was greatly upregulated in drug-resistant epithelial cells, attracted our attention. UCHL1, as a member of the DUB family, is greatly expressed in multiple cancers, including cervical squamous cell carcinoma,(34) bladder cancer,(14) and uterine serous cancer,(35) and exerts a cancer-causing influence. We herein collected BC mRNA expression data in the TCGA database to assess the expression of UCHL1 in normal tissues adjacent to cancer and four BC subtypes (HER2 + BC, Luminal A BC, Luminal B BC, and TNBC). UCHL1 was only greatly up-regulated in TNBC, which was consistent with the results observed by Chen et al.(36) in patient-derived BC samples that suggested that UCHL1 may be a specific biomarker for treatment decision-making in TNBC.
Given the great overexpression of UCHL1 in resistant epithelial TNBC, UCHL1 may play a pivotal part in TNBC resistance. Therefore, we further constructed CDDP-resistant TNBC cells and unraveled that the expression of UCHL1 in drug-resistant cell lines was remarkably up-regulated, and the knockdown of UCHL1 dramatically potentiated the sensitivity of TNBC cells to CDDP treatment. UCHL1 is found to be closely linked to cancer chemotherapy resistance. Lu et al.(37) asserted that up-regulated UCHL1 was positively linked with chemotherapy resistance in BC patients, especially in HER2 + BC patients. Cell experiments confirmed that UCHL1 can induce resistance to doxorubicin in HER2 + BC cells,(37) which supports our findings. However, in OC, UCHL1 possesses a role in amplifying CDDP sensitivity,(17) which contradicts our conclusions and can be explained by the specific molecular characteristics of different cancer types and differences in tumor microenvironment.
To deeply dig out the mechanism by which UCHL1 influenced TNBC resistance, further enrichment analysis of UCHL1 revealed that UCHL1 was greatly enriched in the ferroptosis pathway. A growing number of former studies have proven that the activation of the ferroptosis pathway can effectively curb tumor progression. In addition, ferroptosis can enhance the efficiency of chemotherapy, targeted therapy, and even immunotherapy.(38–40) We herein unraveled that knocking down UCHL1 can reinforce ferroptosis in TNBC cells and potentiate sensitivity to CDDP treatment, while the addition of the ferroptosis inhibitor Ferrostatin-1 can reverse this effect. Currently, in NSCLC,(27) OC,(41) and TNBC,(42) activation of ferroptosis can reverse resistance to CDDP treatment in tumors. Therefore, targeting ferroptosis could serve as a potential strategy to overcome CDDP resistance in TNBC.
Overall, we learned about the heterogeneity of TNBC through scRNA-seq data from public databases and screened out the gene UCHL1 associated with TNBC resistance. UCHL1 is enriched in the ferroptosis pathway, boosting CDDP resistance in TNBC by suppressing ferroptosis. This project, based on scRNA-seq data, greatly expanded our understanding of the resistance mechanisms in TNBC and brought new insights for reversing TNBC resistance. There are still certain shortcomings in our research. For example, single-cell samples should be further expanded to reduce selection bias and ensure randomness. In addition, the development of tumor resistance involves complex regulatory networks, awaiting further in-depth research centering on differential metabolic pathways between drug-resistant and sensitive epithelium.
Author Contributions
Conception and design: HL and SC; Administrative support: WZ; Provision of study materials: HL and HH; Collection and assembly of data: HL, HH, and ZL; Data analysis and interpretation: SC, YZ, and WZ; Manuscript writing: HL, SC, and HH; Manuscript revising: ZL, YZ, and WZ; Final approval of manuscript: all authors.
Availability of Data and Materials
The data and materials in the current study are available from the corresponding author on reasonable request.
Conflict of Interest
No potential conflicts of interest were disclosed.
References
- 1.Siegel RL, Giaquinto AN, Jemal A. Cancer statistics, 2024. CA Cancer J Clin 2024; 74: 12–49. [DOI] [PubMed] [Google Scholar]
- 2.Penault-Llorca F, Viale G. Pathological and molecular diagnosis of triple-negative breast cancer: a clinical perspective. Ann Oncol 2012; 23 Suppl 6: vi19–vi22. [DOI] [PubMed] [Google Scholar]
- 3.Won KA, Spruck C. Triple‑negative breast cancer therapy: current and future perspectives (Review). Int J Oncol 2020; 57: 1245–1261. [DOI] [PMC free article] [PubMed] [Google Scholar]
- 4.Yan H, Luo B, Wu X, et al. Cisplatin induces pyroptosis via activation of MEG3/NLRP3/caspase-1/GSDMD pathway in triple-negative breast cancer. Int J Biol Sci 2021; 17: 2606–2621. [DOI] [PMC free article] [PubMed] [Google Scholar]
- 5.Lim S, Kim Y, Lee SB, et al. Inhibition of Chk1 by miR-320c increases oxaliplatin responsiveness in triple-negative breast cancer. Oncogenesis 2020; 9: 91. [DOI] [PMC free article] [PubMed] [Google Scholar]
- 6.Asleh K, Riaz N, Nielsen TO. Heterogeneity of triple negative breast cancer: current advances in subtyping and treatment implications. J Exp Clin Cancer Res 2022; 41: 265. [DOI] [PMC free article] [PubMed] [Google Scholar]
- 7.Li J, Cao F, Yin HL, et al. Ferroptosis: past, present and future. Cell Death Dis 2020; 11: 88. [DOI] [PMC free article] [PubMed] [Google Scholar]
- 8.Chen X, Kang R, Kroemer G, Tang D. Broadening horizons: the role of ferroptosis in cancer. Nat Rev Clin Oncol 2021; 18: 280–296. [DOI] [PubMed] [Google Scholar]
- 9.Ozkan E, Bakar-Ates F. Ferroptosis: a trusted ally in combating drug resistance in cancer. Curr Med Chem 2022; 29: 41–55. [DOI] [PubMed] [Google Scholar]
- 10.Fu D, Wang C, Yu L, Yu R. Induction of ferroptosis by ATF3 elevation alleviates cisplatin resistance in gastric cancer by restraining Nrf2/Keap1/xCT signaling. Cell Mol Biol Lett 2021; 26: 26. [DOI] [PMC free article] [PubMed] [Google Scholar]
- 11.Song X, Wang X, Chen X, Yu Z, Zhou Y. SRSF1 inhibits ferroptosis and reduces cisplatin chemosensitivity of triple-negative breast cancer cells through the circSEPT9/GCH1 axis. J Proteomics 2024; 292: 105055. [DOI] [PubMed] [Google Scholar]
- 12.Wang X, Zhang N, Li M, Hong T, Meng W, Ouyang T. Ubiquitin C‑terminal hydrolase‑L1: a new cancer marker and therapeutic target with dual effects (Review). Oncol Lett 2023; 25: 123. [DOI] [PMC free article] [PubMed] [Google Scholar]
- 13.Tian C, Liu Y, Liu Y, et al. UCHL1 promotes cancer stemness in triple-negative breast cancer. Pathol Res Pract 2022; 240: 154235. [DOI] [PubMed] [Google Scholar]
- 14.Zheng Y, Shi D, Chen L, Yang Y, Yao M. UCHL1-PKM2 axis dysregulation is associated with promoted proliferation and invasiveness of urothelial bladder cancer cells. Aging (Albany NY) 2023; 15: 10593–10606. [DOI] [PMC free article] [PubMed] [Google Scholar]
- 15.Lu G, Li J, Ding L, et al. The deubiquitinating enzyme UCHL1 induces resistance to doxorubicin in HER2+ breast cancer by promoting free fatty acid synthesis. Front Oncol 2021; 11: 629640. [DOI] [PMC free article] [PubMed] [Google Scholar]
- 16.Ding X, Gu Y, Jin M, et al. The deubiquitinating enzyme UCHL1 promotes resistance to pemetrexed in non-small cell lung cancer by upregulating thymidylate synthase. Theranostics 2020; 10: 6048–6060. [DOI] [PMC free article] [PubMed] [Google Scholar]
- 17.Jin C, Yu W, Lou X, et al. UCHL1 is a putative tumor suppressor in ovarian cancer cells and contributes to cisplatin resistance. J Cancer 2013; 4: 662–670. [DOI] [PMC free article] [PubMed] [Google Scholar]
- 18.Zhang Y, Wang D, Peng M, et al. Single-cell RNA sequencing in cancer research. J Exp Clin Cancer Res 2021; 40: 81. [DOI] [PMC free article] [PubMed] [Google Scholar]
- 19.Li F, Zhang H, Huang Y, et al. Single-cell transcriptome analysis reveals the association between histone lactylation and cisplatin resistance in bladder cancer. Drug Resist Updat 2024; 73: 101059. [DOI] [PubMed] [Google Scholar]
- 20.Gene Expression Omnibus. National Center for Biotechnology Information. https://www.ncbi.nlm.nih.gov/geo/. Accessed 24 Apr, 2025. [Google Scholar]
- 21.Wu T, Zhang X, Liu X, et al. Single-cell sequencing reveals the immune microenvironment landscape related to anti-PD-1 resistance in metastatic colorectal cancer with high microsatellite instability. BMC Med 2023; 21: 161. [DOI] [PMC free article] [PubMed] [Google Scholar]
- 22.Xiao Z, Dai Z, Locasale JW. Metabolic landscape of the tumor microenvironment at single cell resolution. Nat Commun 2019; 10: 3763. [DOI] [PMC free article] [PubMed] [Google Scholar]
- 23.Cai L, Shi B, Zhu K, et al. Bioinformatical analysis of the key differentially expressed genes for screening potential biomarkers in Wilms tumor. Sci Rep 2023; 13: 15404. [DOI] [PMC free article] [PubMed] [Google Scholar]
- 24.DAVID Bioinformatics . National Institutes of Health. https://david.ncifcrf.gov/. Accessed 24 Apr, 2025. [Google Scholar]
- 25.Genomic Data Commons Data Portal. National Cancer Institute at the National Institutes of Health. https://portal.gdc.cancer.gov/. Accessed 24 Apr, 2025. [Google Scholar]
- 26.Qi Y, Li M, Li S, et al. Notch1 promotes resistance to cisplatin by up-regulating Ecto-5'-nucleotidase (CD73) in triple-negative breast cancer cells. Cell Death Discov 2023; 9: 204. [DOI] [PMC free article] [PubMed] [Google Scholar]
- 27.Chen H, Wang L, Liu J, et al. LncRNA ITGB2-AS1 promotes cisplatin resistance of non-small cell lung cancer by inhibiting ferroptosis via activating the FOSL2/NAMPT axis. Cancer Biol Ther 2023; 24: 2223377. [DOI] [PMC free article] [PubMed] [Google Scholar]
- 28.Kumar H, Gupta NV, Jain R, et al. A review of biological targets and therapeutic approaches in the management of triple-negative breast cancer. J Adv Res 2023; 54: 271–292. [DOI] [PMC free article] [PubMed] [Google Scholar]
- 29.Ding S, Chen X, Shen K. Single-cell RNA sequencing in breast cancer: understanding tumor heterogeneity and paving roads to individualized therapy. Cancer Commun (Lond) 2020; 40: 329–344. [DOI] [PMC free article] [PubMed] [Google Scholar]
- 30.Cohen YC, Zada M, Wang SY, et al. Identification of resistance pathways and therapeutic targets in relapsed multiple myeloma patients through single-cell sequencing. Nat Med 2021; 27: 491–503. [DOI] [PMC free article] [PubMed] [Google Scholar]
- 31.Derakhshan F, Reis-Filho JS. Pathogenesis of triple-negative breast cancer. Annu Rev Pathol 2022; 17: 181–204. [DOI] [PMC free article] [PubMed] [Google Scholar]
- 32.Faubert B, Solmonson A, DeBerardinis RJ. Metabolic reprogramming and cancer progression. Science 2020; 368: eaaw5473. [DOI] [PMC free article] [PubMed] [Google Scholar]
- 33.Lv L, Yang S, Zhu Y, et al. Relationship between metabolic reprogramming and drug resistance in breast cancer. Front Oncol 2022; 12: 942064. [DOI] [PMC free article] [PubMed] [Google Scholar]
- 34.Jia Q, Wang H, Xiao X, et al. UCHL1 acts as a prognostic factor and promotes cancer stemness in cervical squamous cell carcinoma. Pathol Res Pract 2023; 247: 154574. [DOI] [PubMed] [Google Scholar]
- 35.Kwan SY, Au-Yeung CL, Yeung TL, et al. Ubiquitin carboxyl-terminal hydrolase L1 (UCHL1) promotes uterine serous cancer cell proliferation and cell cycle progression. Cancers (Basel) 2020; 12: 118. [DOI] [PMC free article] [PubMed] [Google Scholar]
- 36.Chen XS, Wang KS, Guo W, et al. UCH-L1-mediated down-regulation of estrogen receptor α contributes to insensitivity to endocrine therapy for breast cancer. Theranostics 2020; 10: 1833–1848. [DOI] [PMC free article] [PubMed] [Google Scholar]
- 37.Lu G, Li J, Ding L, et al. The deubiquitinating enzyme UCHL1 induces resistance to doxorubicin in HER2+ breast cancer by promoting free fatty acid synthesis. Front Oncol 2021; 11: 629340. (Erratum, Front Oncol 2021; 11: 687249.) [DOI] [PMC free article] [PubMed] [Google Scholar]
- 38.Guo J, Xu B, Han Q, et al. Ferroptosis: a novel anti-tumor action for cisplatin. Cancer Res Treat 2018; 50: 445–460. [DOI] [PMC free article] [PubMed] [Google Scholar]
- 39.Sun X, Niu X, Chen R, et al. Metallothionein-1G facilitates sorafenib resistance through inhibition of ferroptosis. Hepatology 2016; 64: 488–500. [DOI] [PMC free article] [PubMed] [Google Scholar]
- 40.Wang W, Green M, Choi JE, et al. CD8+ T cells regulate tumour ferroptosis during cancer immunotherapy. Nature 2019; 569: 270–274. [DOI] [PMC free article] [PubMed] [Google Scholar]
- 41.Guo W, Wang W, Lei F, et al. Angelica sinensis polysaccharide combined with cisplatin reverses cisplatin resistance of ovarian cancer by inducing ferroptosis via regulating GPX4. Biomed Pharmacother 2024; 175: 116680. [DOI] [PubMed] [Google Scholar]
- 42.Wang Y, Pang X, Liu Y, Mu G, Wang Q. SOCS1 acts as a ferroptosis driver to inhibit the progression and chemotherapy resistance of triple-negative breast cancer. Carcinogenesis 2023; 44: 708–715. [DOI] [PubMed] [Google Scholar]
Associated Data
This section collects any data citations, data availability statements, or supplementary materials included in this article.
Data Availability Statement
The data and materials in the current study are available from the corresponding author on reasonable request.


