

Abstract
Intravascular optical coherence tomography (IVOCT) is emerging as an effective imaging technique for accurately characterizing coronary atherosclerotic plaques. This technique provides detailed information on plaque morphology and composition, enabling the identification of high-risk features associated with coronary artery disease and adverse cardiovascular events. However, despite advancements in imaging technology and image assessment, the adoption of IVOCT in clinical practice remains limited. Manual plaque assessment by experts is time-consuming, prone to errors, and affected by high inter-observer variability. To increase productivity, precision, and reproducibility, researchers are increasingly integrating artificial intelligence (AI)-based techniques into IVOCT analysis pipelines. Machine learning algorithms, trained on labelled datasets, have demonstrated robust classification of various plaque types. Deep learning models, particularly convolutional neural networks, further improve performance by enabling automatic feature extraction. This reduces the reliance on predefined criteria, which often require domain-specific expertise, and allow for more flexible and comprehensive plaque characterization. AI-driven approaches aim to facilitate the integration of IVOCT into routine clinical practice, potentially transforming this technique from a research tool into a powerful aid for clinical decision-making. This narrative review aims to (i) provide a comprehensive overview of AI-based methods for analyzing IVOCT images of coronary arteries, with a focus on plaque characterization, and (ii) explore the clinical translation of AI to IVOCT, highlighting AI-powered tools for plaque characterization currently intended for commercial and/or clinical use. While these technologies represent significant progress, current solutions remain limited in the range of plaque features these methods can assess. Additionally, many of these solutions are confined to specific regulatory or research settings. Therefore, this review highlights the need for further advancements in AI-based IVOCT analysis, emphasizing the importance of additional validation and improved integration with clinical systems to enhance plaque characterization, support clinical decision-making, and advance risk prediction.
Keywords: intravascular imaging, optical coherence tomography, atherosclerotic plaque, artificial intelligence, machine learning, deep learning, automated plaque characterization, clinical decision support systems
1. Introduction
Intravascular optical coherence tomography (IVOCT) is a catheter-based imaging modality that provides high-resolution cross-sectional images of the coronary arteries [1]. The IVOCT system uses a Michelson interferometer [2], which splits a broadband near-infrared light source into reference and sample beams to generate interference patterns for depth-resolved imaging. This technique detects backscattered and back-reflected signals, enabling high-resolution visualization of vascular structures, both at the surface and subsurface [3]. Intravascular image acquisition is performed using a probe mounted on a specialized catheter, which is inserted into the coronary artery and moved through a controlled pullback motion at a constant velocity. Since blood causes high backscatter due to light interaction with its particles, intermittent saline flushes are required during acquisition to maintain a blood-free imaging zone, ensuring optimal visualization of arterial structures. IVOCT is characterized by an excellent spatial resolution (10–20 µm) as compared to the typical imaging modalities used for coronary arteries, including conventional coronary angiography (100–200 µm), computed tomography angiography (400–700 µm), and intravascular ultrasound (IVUS, 100–200 µm) [4, 5]. IVOCT has a penetration depth of 1–2 mm, which may limit its ability to image deeper layers of the arterial wall, especially in the presence of highly attenuating structures [3]. Due to its unique characteristics, IVOCT enables the rapid observation of microscopic features in vascular cross-sections, making it a valuable tool for diagnosing coronary atherosclerosis [6]. The primary goal of IVOCT is to identify the edges of the vascular lumen and stent struts (if a stent is implanted). Additionally, image processing techniques enable the identification of atherosclerotic plaque features [7].
From a clinical perspective, IVOCT has several important applications. It enables the in vivo identification of plaque morphology such as thin cap fibroatheroma (TCFA), validates TCFA rupture, plaque erosion, and calcified nodules as key mechanisms of acute coronary syndromes, and differentiates between red and white thrombi [1]. Additionally, IVOCT (i) provides valuable insights into the temporal evolution of coverage in bare metal and drug-eluting stents, as well as bioresorbable scaffolds, (ii) supports the identification of neoatherosclerosis as a cause of late stent failure, and (iii) contributes to identifying vascular retraction as a toxic response to drug-eluting stents and stent malapposition [3, 8]. Consequently, IVOCT is increasingly used to guide percutaneous coronary interventions and is currently recommended with a Class IA recommendation by the latest European Society of Cardiology (ESC) guidelines in complex lesions [9]. Despite its high-resolution diagnostic capabilities, the impact of IVOCT on clinical practice remains limited. Challenges include the transition from IVUS, complex image interpretation, the lack of a standardized intervention guidance pipeline, and limited data from prospective clinical trials [3, 10].
In clinical practice, IVOCT is used for tasks such as measuring the minimum lumen area and minimum stent area, aided by the automatic annotations provided by the IVOCT systems software. However, for more complex analyses, such as plaque component categorization, cardiologists still rely on expert interpretation of IVOCT images, despite the detailed morphological information available. To address this, researchers have begun exploring artificial intelligence (AI) because of its high standards, reproducibility, and ability to process vast amounts of data [11, 12]. Some studies have focused on extracting features to automatically identify and classify different plaque types. However, systematic identification strategies and further research on plaque composition and characterization are still lacking [13].
Plaque regions in IVOCT images may be automatically characterized using traditional machine learning (ML) algorithms (like support vector machines, random forests, etc.) [14, 15, 16, 17]. Conventional ML approaches typically require multiple processing steps, including feature extraction, selection, and pixel classification. However, errors or inaccuracies at any stage can compromise the overall classification accuracy. An alternative approach involves deep learning (DL) techniques, which have gained popularity in medical image analysis [18, 19, 20, 21]. Among these, convolutional neural networks (CNNs) stand out for their ability to automatically and efficiently extract features from images, reducing the risk of errors in the feature extraction process.
This narrative review provides a comprehensive overview of AI-based methods applied to IVOCT images of coronary arteries for identifying atherosclerotic plaque components. The review is structured as follows: Section 2 describes key atherosclerotic plaque features detectable through IVOCT, including composition, microstructure, and rupture; Section 3 discusses state-of-the-art AI models for plaque composition characterization; Section 4 explores AI approaches for assessing plaque microstructure; Section 5 presents AI-based systems for detecting plaque rupture; Section 6 describes the most relevant AI-based systems for plaque characterization currently intended for commercial and/or clinical use; Sections 7 and 8 discuss the challenges and current limitations of these methodologies, propose potential solutions, and outline prospects for integrating AI into clinical decision support systems and risk prediction tools.
2. Atherosclerotic Plaque and its Components as Identified by IVOCT
As previously mentioned, due to its excellent spatial resolution and despite limitations in penetration depth, IVOCT enables the visualization of atherosclerotic plaques within the arterial wall of coronary arteries, allowing for the analysis of plaque components, microstructures, and rupture (Fig. 1, Ref. [22, 23, 24]) [6]. This facilitates the identification of high-risk features such as plaque layering, spotty calcification, the presence of lipids, thin fibrous caps, macrophage infiltration, microchannels, and cholesterol crystals, all of which are recognized as predictors of rapid plaque growth, and determinants of biomechanical stress [25]. These plaque features have been associated with the occurrence of major adverse cardiovascular events such as myocardial infarction and sudden cardiac death, even if the role they play remains to be further investigated [26].
Fig. 1.
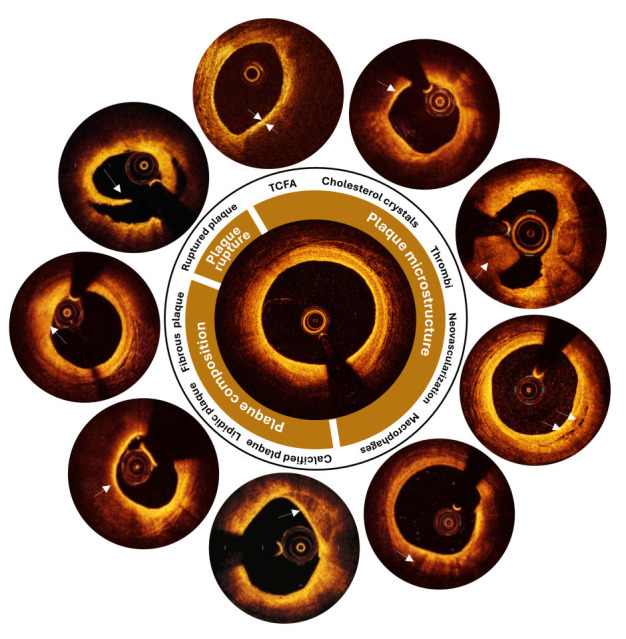
Main components of an atherosclerotic plaque as visible in intravascular optical coherence tomography images. Each plaque is characterized by its composition and microstructure, both of which can contribute to plaque rupture under certain conditions. The primary components of an atherosclerotic plaque include fibrous, lipidic, or calcified tissues. The microstructures commonly found in atherosclerotic plaques may include thin cap fibroatheroma, cholesterol crystals, thrombi, neovascularization, and macrophages. Image features are indicated by white arrows. Adapted with permission from [22, 23, 24]. TCFA, thin cap fibroatheroma.
This section describes the appearance of atherosclerotic plaques in IVOCT images, with specific reference to plaque components, microstructures, and rupture. The description is based on the consensus document prepared by the International Working Group for IVOCT Standardization and Validation (IWG-IVOCT), which establishes standard nomenclature, usage guidelines, image interpretation criteria, measurement methodologies, and reports recommended practices for interpreting coronary IVOCT results [1].
2.1 Plaque Composition
Lipid plaques appear in IVOCT images as low-signal regions with poorly defined borders (Fig. 1) [27, 28]. These plaques are more prevalent in cases with severe stenosis [29]. Lipid-rich plaques that are not treated with stenting often exhibit an unfavorable natural history, contributing to disease progression and an increased risk of adverse cardiovascular events [30, 31, 32, 33]. The presence of lipids within stented segments has been associated with in-stent plaque prolapse and intra-stent thrombus [34].
Fibrous plaques are characterized by a high-backscattering, slightly homogeneous IVOCT signal (Fig. 1), with occasional identification of the internal elastic lamina and external elastic lamina [1]. If elastic membranes cannot be identified, caution is advised when attempting to define this type of lesion [1]. Collagen or smooth muscle cells may also be observed in fibrous plaques using IVOCT [1]. Occasionally, due to the limited penetration depth of IVOCT, necrotic cores or calcium behind fibrous tissue may not be identified [1]. IVOCT allows clinicians to obtain precise measures of fibrous cap thickness, which is a significant predictor of plaque vulnerability [35].
Calcified plaques are characterized by well-defined, low-backscattering heterogeneous zones in IVOCT images (Fig. 1) [1]. They are often marked by superficial calcification at the affected region, without signs of burst lipid plaque. Calcification is a hallmark of advanced atherosclerosis, and its presence and severity are significantly associated with poor prognosis [36]. Additionally, small calcium deposits may contribute to the destabilization of lipid plaques [37].
2.2 Plaque Microstructure
A TCFA is typically defined as a necrotic core of an atherosclerotic plaque, delineated by an overlying thin fibrous cap with a minimum thickness below a predefined threshold (usually 65 µm) (Fig. 1) [1]. The necrotic core can be visualized in IVOCT images as a signal-poor region within an atherosclerotic plaque, with poorly outlined boundaries, rapid IVOCT signal drop-off, and minimal or no signal backscattering within a lesion covered by a fibrous cap. The fibrous cap is generally visible as a signal-rich tissue layer overlying a signal-poor region. To define TCFA, some studies specify that the necrotic core should cover more than one quadrant of an image in Cartesian coordinates or span an arc greater than 90° [1]. Delineating TCFA in IVOCT images requires caution, as artifacts can easily be misinterpreted as necrotic cores [1]. Previous research on the natural history of coronary lesions revealed that the presence of a TCFA is an independent predictor of future unfavorable cardiac outcomes [38, 39].
Cholesterol crystals appear as thin, linear regions of high intensity, typically associated with a fibrous cap or necrotic core (Fig. 1) [1]. Previous research revealed a possible link between clinical metabolic disorders and the presence of cholesterol crystals in patients with stable and unstable coronary syndromes [40].
Thrombi are visualized in IVOCT as masses attached to the luminal surface or floating within the lumen (Fig. 1) [1]. IVOCT distinguishes between two forms of thrombi: red thrombi, which exhibit marked backscattering and high attenuation, and white thrombi, which is less backscattering, homogenous, and has low attenuation. Thrombi can sometimes be mistaken for small dissections or intimal ruptures. For example, a red thrombus may be misdiagnosed as a necrotic core fibroatheroma. Additionally, thrombi may cause shadowing or obscure underlying structures. By recognizing thrombi, IVOCT is effective in identifying culprit lesions and understanding the underlying mechanisms of acute coronary syndrome [41].
Macrophage accumulations can be detected by IVOCT as signal-rich, discrete, or confluent punctate regions (Fig. 1), which are more intense than the background speckle noise. These findings should be evaluated only in the context of a fibroatheroma, as no macrophage validation studies have been reported for normal vessel walls or intimal hyperplasia [1]. Macrophages are often found close to the junction of a necrotic core and its cap, and their accumulation may sometimes be mistaken for microcalcification, cholesterol crystals, internal elastic lamina, or external elastic lamina. Macrophage accumulations may also attenuate IVOCT light, resulting in surface macrophages to shadow deeper tissue, giving a necrotic appearance [1]. A recent study demonstrated that macrophage infiltration at the culprit lesion in acute coronary syndrome patients with plaque erosion is linked to more susceptible plaque characteristics and a worse prognosis over time [42].
2.3 Plaque Rupture
Ruptured plaques often exhibit intimal ripping, disruption, or cap dissection and appear in IVOCT as regions of signal loss and/or irregular morphology (Fig. 1) [1]. A previous study revealed that patients with acute coronary syndrome presenting with plaque rupture as the culprit lesion on IVOCT had a worse prognosis than patients with intact fibrous caps did [42].
3. AI-based Methods for Characterizing Plaque Composition
This section reviews the most relevant AI models developed for plaque composition characterization, as summarized in Tables 1,2,3. It begins with approaches based on ML techniques, progresses to more recent DL applications, and concludes with examples of hybrid approaches that integrate both ML and DL elements.
Table 1.
List of published studies that applied machine learning-based models to intravascular optical coherence tomography images for atherosclerotic plaque characterization, focusing on plaque composition, microstructure characterization, and plaque rupture identification.
| First author, year [Ref.] | Plaque characterization | Development dataset | AI architecture | Test performance | External validation | Consensus expert validation | Commercial software | Execution time | ||
| Plaque composition | Plaque microstructure | Plaque rupture | ||||||||
| Athanasiou, 2011 [44] | Fibrous, calcified, lipidic, and mixed plaques image pixel classification | No | No | 3 patients (50 frames) | Random forest classifier | Overall accuracy 0.80, 0.93 (fibrous), 0.82 (calcified), 0.77 (lipidic), 0.69 (mixed) | No | No | No | NA |
| Ughi, 2013 [45] | Fibrous, calcified, and lipidic plaques image pixel classification | No | No | 49 patients (64 frames) | Random forest classifier | Overall accuracy 0.82, 0.90 (fibrous), 0.72 (calcified), 0.80 (lipidic) | No | No | No | 30 s per frame |
| Athanasiou, 2013 [46] | Calcified plaques image pixel classification | No | No | 10 patients (27 frames) | K-means algorithm | Sensitivity 0.83 | No | Two experts independently examined the IVOCT images and detected all the calcified plaques | No | 5 s per frame |
| Athanasiou, 2014 [47] | Fibrous, calcified, and lipidic plaques image pixel classification | No | No | 22 patients (200 frames) | K-means algorithm (plaque segmentation), random forest classifier (image pixel classification) | Overlapping - nonoverlapping area, 0.87–0.37 (fibrous), 0.81–0.35 (calcified), 0.71–0.51 (lipidic) | No | 2 experts selected 200 images and labeled them | No | 40 s per frame |
| Rico-Jimenez, 2016 [48] | Fibrous, fibro-lipidic, and superficial-lipidic plaques A-line classification | No | No | 57 cadaveric human coronary arteries, with histological samples for validation | Linear discriminant analysis classifier | Sensitivity 0.83 (fibrous), 0.85 (fibro-lipidic), 1.00 (superficial-lipidic) | Sensitivity 0.77 lipidic (visual), 0.86 (automatic) | Visual assessment performed by a trained IVOCT expert compared to the results obtained with the automatic approach | No | 1.5 s per frame |
| Xu, 2016 [49] | No plaque, fibrous, fibrocalcified plaques, detect and fibroatheroma classification | No | Yes | 47 patients (1000 frames) | Support vector machine classifier | Overall accuracy 0.90, 0.94 (no plaque), 0.95 (fibrous), 0.85 (fibrocalcified), 0.86 (fibroatheroma), 0.89 (plaque rupture) | No | No | No | NA |
| Zhou, 2017 [50] | Lipidic, and mixed plaques image pixel classification | No | No | 9 patients (217 frames) | Random forest classifier | Accuracy 0.92 (lipidic), 0.78 (mixed) | No | No | No | 10.9 s (computing features) and 1.7 s (classification) per frame |
| Huang, 2018 [51] | Calcified, lipidic, and fibrous plaques image pixel classification | No | No | 11 patients (28 frames) | Support vector machine classifier | Overall accuracy 0.83, 0.79 (calcified), 0.87 (lipidic), 0.89 (fibrous) | No | 3 well-trained IVOCT image readers implemented manual segmentation | No | 2–3 min per frame |
| Prabhu, 2019 [43] | Fibrocalcified, fibro-lipidic, and mixed plaques A-line classification | No | No | In vivo: 49 pullbacks (6556 frames), ex vivo: 10 pullbacks (440 frames) | Support vector machine | Overall accuracy 0.82, sensitivity 0.75 (fibrocalcified), 0.94 (fibro-lipidic), 0.81 (other) | No | NA | No | 3 s per frame (excluding features computation) |
Note: AI, artificial intelligence; IVOCT, Intravascular optical coherence tomography; NA, not available.
Table 2.
List of published studies that applied deep learning-based models to intravascular optical coherence tomography images for atherosclerotic plaque characterization, focusing on plaque composition, microstructure characterization, and plaque rupture identification.
| First author, year [Ref.] | Plaque characterization | Development dataset | AI architecture | Test performance | External validation | Consensus expert validation | Commercial software | Execution time | ||
| Plaque composition | Plaque microstructure | Plaque rupture | ||||||||
| He, 2018 [69] | Calcified, lipidic, fibrous, and mixed plaques image pixel classification | No | No | 22 patients (269 frames) | Convolutional neural network (CNN) architecture | Average sensitivity 0.87, 0.26 (calcified), 0.61 (lipidic), 0.90 (fibrous), 0.67 (mixed) | No | The ground truth data were manually established by expert observers | No | NA |
| Kolluru, 2018 [70] | Fibrocalcified, fibro-lipidic, and other plaques A-line classification | No | No | 48 patients (4469 frames) | CNN architecture | Accuracy 0.78 (fibrocalcified), 0.87 (fibro-lipidic), 0.85 (other) | No | Consensus of 2 expert IVOCT readers | No | 1 s per frame |
| Gharaibeh, 2019 [71] | Calcified and other plaques segmentation | No | No | 34 patients (2646 frames) | SegNet architecture | Dice coefficient 0.73 (calcified), 0.98 (other) | No | Consensus of 2 expert IVOCT readers | No | NA |
| Gessert, 2018 [72] | Plaques, calcified and lipidic/fibrous plaques classification | No | No | 49 patients (4000 frames) | ResNet50-V2 and DenseNet-121 architectures | Accuracy 0.92 (plaque, ResNet50-V2), 0.78 (calcified), 0.85 (lipidic/fibrous), 0.90 (no plaque, DenseNet-121) | No | Consensus of 3 trained experts | No | NA |
| Athanasiou, 2019 [73] | Calcified, lipidic, fibrous, and mixed plaques image pixel classification | No | No | 28 patients (700 frames) | CNN architecture | Accuracy 0.72 (calcified), 0.93 (lipidic), 0.96 (fibrous), 0.84 (mixed) | No | Consensus of 2 medical experts | No | NA |
| Gharaibeh, 2019 [68] | Calcified and other plaques segmentation | No | No | 34 patients (2640 frames) | SegNet architecture | Dice coefficient 0.76 (calcified), 0.98 (other) | No | Consensus of 2 expert readers | No | NA |
| Lee, 2019 [74] | Calcified, lipidic, and other plaques A-line classification and segmentation | No | No | 55 patients (4892 frames) | SegNet architecture | Dice coefficient 0.90 (calcified), 0.83 (lipidic) for A-lines classification, 0.73 (calcified), 0.80 (lipidic), 0.91 (other) for segmentation | 600 frames. Dice coefficient 0.99 (other) | No | No | 0.27 s per frame |
| Liu, 2020 [75] | Fibrous plaque detection | No | No | 1000 frames | Multi-scale CNN | Accuracy 0.94 | No | 3 trained experts | No | NA |
| Abdolmanafi, 2020 [76] | Calcified and fibrous plaques classification | Macrophage and neovascularization classification | No | 19 pullbacks | AlexNet, VGG-19, and Inceptionv3 architectures for feature extraction, random forest for classification | Accuracy 0.90 (calcified), 0.94 (fibrous), 0.92 (macrophage), 0.95 (neovascularization) | No | Each annotated image was reviewed by two cardiologists and if there was any disagreement, a consensus was reached by reviewing carefully each region of interest | No | NA |
| Baruah, 2020 [77] | Calcified, lipidic, fibrous, fibrocalcified, and fibroatheroma plaques segmentation | Thick versus thin-cap fibroatheroma segmentation | No | 76 ex vivo coronary arteries (400 frames), 13 in vivo patients | Neural networks | Sensitivity 0.85 (calcified), 0.86 (lipidic), 0.87 (fibrous), 0.72 (fibrocalcified), 0.72 (fibroatheroma), 0.99 (thick-cap versus thin-cap fibroatheroma) | Sensitivity 0.80 (calcified), 0.82 (lipidic), 0.86 (fibrous) | 2 expert IVOCT readers and 2 cardiovascular pathologists with guidance from histology | No | NA |
| Lee, 2020 [36] | Calcified plaques segmentation | No | No | 68 patients (8231 frames) | 3D CNN architecture (classification), SegNet: VGG-16 architecture (segmentation) | F1 score 0.92 (calcium classification), F1 score 0.78 (calcium segmentation) | Qualitative evaluation on 4320 ex vivo cadaveric images from 4 hearts with 4 vessels | Clinical images labeled by 2 expert cardiologists | No | 0.3 s per frame |
| Abdolmanafi, 2021 [78] | Atherosclerotic tissue segmentation, fibrous, fibrocalcified tissue, and fibroatheroma classification | Micro-vessels, and thrombi tissue classification | No | 41 pullbacks (2052 frames) | ResNet-based spatial pyramid pooling module, custom ResNet architecture coupled with sparse auto-encoder neural network architecture | BF-Score 0.84 (atherosclerotic tissue), 0.99 (fibrocalcified), 0.99 (fibroatheroma), 0.90 (micro-vessels), 0.98 (thrombi) | No | Trained operator with review by 2 cardiologists to reach a consensus | No | 0.3 s per frame |
| Yin, 2021 [79] | Fibrous, calcified, and lipidic plaques image pixel classification | No | No | 31 patients (2000 frames) | TwoPathCNN architecture | F1 score 0.86 (fibrous, calcified and lipidic average) | No | 3 experienced observers manually segmented each image, double-checking the results. Disagreement was confirmed by an interventional cardiologist | No | 2 s per frame |
| Avital, 2021 [80] | Calcified plaques segmentation | No | No | 540 frames | U-Net architecture | Dice coefficient 0.71 | No | Manual segmentation from 2 independent individuals | No | NA |
| Chu, 2021 [90] | Fibrous, calcified, and lipidic plaques segmentation | Cholesterol crystals, macrophages, and micro-vessels plaques segmentation | No | 391 patients (11,673 frames) | U-shaped encoder-decoder architecture | Dice coefficient 0.91 (fibrous), 0.85 (calcified), 0.77 (lipidic), 0.53 (cholesterol crystals), 0.49 (macrophages), 0.60 (micro-vessels) | 30 patients (300 frames). Accuracy 97.6% (fibrous), 90.5% (lipidic), 88.5% (calcified), 48.1% (macrophages), 94.7% (cholesterol crystals), based on consensus |
Development: 2 experienced IVOCT analysts, verification by IVOCT specialist under supervision of senior cardiologist. External validation: 3 independent core labs. Consensus defined as agreement between 2 core labs |
Integrated into OctPlus software (Pulse Medical Imaging Technology, Shanghai, China) | Median analysis time: 21.4 s per pullback |
| Cheimariotis, 2021 [81] | Plaques, fibrous, calcified, lipidic, and other plaques A-line classification | No | No | 33 patients (183 frames) | CNN architecture | Accuracy 0.75 (plaques), overall accuracy 0.53 (fibrous, calcified, lipidic, and other), 0.83 (fibrocalcified and fibro-lipidic) | No | Expert cardiologists | No | NA |
| Rico-Jimenez, 2022 [82] | Lipidic plaques A-line classification | No | No | 5 cadaveric human hearts (98 frames) | CNN-time-series classifier | Accuracy 0.90 | No | No | No | 9.6 ms per frame |
| Lee, 2022 [83] | No | Microchannel segmentation | No | 41 patients (3075 frames) | Encoder (Xception network) decoder architecture coupled with CNN | Dice coefficient 0.81 | No | Two expert cardiologists | No | NA |
| Shi, 2023 [84] | No | Thin-cap fibroatheroma A-line classification | No | 2300 frames | Weakly supervised object detection method based on a deep CNN architecture | Sensitivity 0.88 | No | Medical experts | No | 0.51 s per frame |
| Lee, 2023 [91] | Plaque segmentation, calcified plaques segmentation | No | No | 68 patients (8231 frames for calcified plaques classification, 8231 clinical, and 4320 ex vivo cadaveric frames for calcified plaques segmentation) | 3D CNN model (classification), SegNet (segmentation) | Dice coefficient 0.92 (calcified classification), 0.78 (calcified segmentation) | 34 pullbacks (2723 frames), 12.2% of the frames required significant manual modifications | No | OCTOPUS software 2023.3, (based on Matlab R2019b, MathWorks, Natick, MA, USA) | 0.6 s per frame |
| Tang, 2023 [85] | Calcified and lipidic plaques segmentation | No | No | 14 patients (2388 frames, 378 with calcium and 1355 with lipid) | Self-attention ResNet (classification), Convolution AutoEncoder (CAE) U-Net (segmentation) | Accuracy 1.00 (calcified), 0.98 (lipidic), Dice 0.72 (calcified), 0.60 (lipidic) | No | Labels delineated by experienced cardiologists | No | NA |
| Wang, 2023 [86] | No | Macrophages, cavities/dissections, and thrombi classification | No | 69 patients (2988 frames) | G-Swin transformer architecture | Sensitivity 0.91 (macrophages), 0.90 (cavities/dissections), 0.95 (thrombi) | No | 2 expert physicians, senior doctors | No | NA |
| Liu, 2024 [87] | Calcified plaques segmentation | No | No | 62 clinical pullbacks (2151 frames) | Transformer-based pyramid network | Dice coefficient 0.84 | No | Yes | No | 74.20 ms per frame |
| Lee, 2024 [88] | No | Fibrous cap segmentation | No | 77 patients (8970 frames) | Modified SegNet architecture | Dice coefficient 0.85 | 74 patients (1362 frames). Dice coefficient 0.85 | OCTOPUS software and 2 experts | No | 0.02 s per frame |
| Chu, 2024 [89] | No | Thrombi segmentation | No | 339 patients (5649 frames) | Multi-head crossattention, self-attention, and convolutional-based feedforward network | Dice coefficient 71% | 52 patients (548 frames) | Two experienced IVOCT analysts | No | 2–3 s per pullback |
Note: VGG, visual geometry group; BF-Score, Boundary F1 Score.
Table 3.
List of published studies that applied hybrid artificial intelligence-based approaches to intravascular optical coherence tomography images for atherosclerotic plaque characterization, focusing on plaque composition, microstructure characterization, and plaque rupture identification.
| First author, year [Ref.] | Plaque characterization | Development dataset | AI architecture | Test performance | External validation | Consensus expert validation | Commercial software | Execution time | ||
| Plaque composition | Plaque microstructure | Plaque rupture | ||||||||
| Xu, 2017 [102] | Fibroatheroma classification | No | No | 18 patients (360 frames) | Deep features extracted by VGG-19 coupled to linear support vector machine classifier | Accuracy 0.76 | No | Trained experts labeled the frames | No | NA |
| Abdolmanafi, 2018 [103] | Calcified and fibrous plaques classification | Macrophage and neovascularization classification | No | 33 patients (3149 frames) | AlexNet, VGG-19, and Inceptionv3 architectures for feature extraction, random forest for classification | Accuracy 0.95 (calcified), 0.95 (fibrous), 0.91 (macrophage), 0.98 (neovascularization) | No | Annotated images are validated by expert cardiologists | No | NA |
| Lee, 2020 [104] | Fibrocalcified, fibro-lipidic, and other plaques A-line classification | No | No | 49 patients (6556 frames) | Hybrid learning approach, combining deep learning convolutional and hand-crafted, lumen morphological features. Random forest classifier | F1 score 0.72 (fibrocalcified), 0.89 (fibro-lipidic), 0.98 (other) | No | Labels delineated by 2 experienced readers | No | 1 s per frame |
3.1 Methods Based on ML
This section presents and compares the most relevant ML-based methods proposed in the literature over recent years for plaque composition characterization (Table 1, Ref. [43, 44, 45, 46, 47, 48, 49, 50, 51]). In general, each ML pipeline follows a similar structure, as illustrated in Fig. 2 (Ref. [43]), applying different models after the feature extraction step. The process begins with a preprocessing phase to clean, normalize, and correct the IVOCT images, preparing them as inputs for the downstream analysis. The next step is the feature extraction phase, where visual features are extracted in numerical format, containing potentially useful information for identifying plaque components. These data are then used as inputs to feed the ML algorithm and train it for the classification or segmentation task, which classifies and/or segments the images.
Fig. 2.

Main pipeline of machine learning (ML)-based systems for plaque composition characterization from intravascular optical coherence tomography. Specifically, the process outlined by Prabhu et al. [43], which includes the preprocessing phase, features extraction phase, ML model application, and A-line classification, is detailed as an example. Adapted with permission from [43]. 2D, 2-Dimensional; 3D, 3-Dimensional.
In this context, the pioneering work published by Athanasiou et al. [44] in 2011 is the first example of a semi-automatic method based on ML to classify atherosclerotic plaque in IVOCT images into four possible types: calcium, lipid pool, fibrous tissue, and mixed plaque. The authors extracted features from grayscale IVOCT images and used them to train a random forest classifier [52] able to perform a pixel-level classification of the plaque types. The dataset used to train and test the method was small, consisting of 50 IVOCT annotated frames from three patients, which limited the generalizability of the algorithm. The extracted features included intensity-based (entropy and mean value [53]) and texture-based (co-occurrence matrix [54] and local binary patterns [55]) image characteristics. For each pixel in the plaque areas, features were extracted from an 11 11 pixel neighborhood. Of the 50 annotated IVOCT frames, 46 were used for training and testing, whereas four were reserved for qualitative application examples. A 10-fold cross-validation was applied to the 46 frames, resulting in an overall accuracy of 80%. However, these IVOCT frames are part of a sequence and are not truly independent, potentially affecting the validity of the results, introducing bias, and possibly overestimating model performance.
In 2013, Ughi et al. [45] proposed a more generalized algorithm for the semi-automated characterization of atherosclerotic plaques in IVOCT images. The authors employed a random forest classifier [52], a ML algorithm based on ensemble learning that builds multiple decision trees and combines their outputs to improve classification accuracy and control overfitting. The random forest classifier was developed using geometrical and texture features (spatial gray-level dependence matrices [56, 57]) and coupled them with the estimation of the attenuation coefficient µt(d), calculated for each image pixel, indicating the extent to which the light intensity is reduced as it passes through the tissue [58]. The dataset included 49 patients, with a total of 64 plaques manually identified by a single medical expert, who visually selected only one IVOCT frame per plaque to avoid redundant information during training and testing. A balanced training set of 3100 pixels for each class was created. The ML model classified each image pixel into four classes: fibrotic plaque, calcified plaque, lipid plaque, and outliers. The resulting classification was visualized as a color-coded tissue map overlaid on the original IVOCT image. The overall classification accuracy was 81.5%.
After these two foundational works [44, 45], several studies have explored plaque composition characterization in IVOCT using ML techniques, aiming to overcome the limitations of earlier approaches (Table 1). In particular, the main limitation of these first two studies was their semi-automatic workflow, which required the manual identification of a region of interest before the actual application of the method. This process is time-consuming and prone to potential bias introduced from experts’ annotations.
An automated method for detecting calcified plaques in IVOCT images was proposed by Athanasiou et al. [46] to address the aforementioned challenges. The first step of the method involves detecting the penetration area in each IVOCT frame, defined as the distance between the lumen border and the maximum penetration depth of IVOCT from the lumen border itself (1.5 mm). Lumen border detection was performed automatically, using a customized method described in the same paper [46]. The k-means algorithm [59], an unsupervised ML technique that partitions data into k distinct clusters based on feature similarity, was then applied to classify each pixel within the penetration area into three clusters. Calcium is identified as the radial region between two distinct colors, corresponding to the area beneath the catheter artifact (located at the border of the penetration area). The dataset used for this study consisted of 10 patients, each independently examined by two experts, resulting in a total of 27 IVOCT frames selected. The proposed method achieved a sensitivity of 83%. Athanasiou et al. [47] improved the generalizability of their previously proposed plaque characterization method [44] by developing an automatic approach to detect four tissue types: calcium, lipid tissue, fibrous tissue, and mixed tissue. The algorithm implemented the following steps: lumen border detection and lumen border expansion of 1.5 mm in the radial direction based on the gravitational center of the lumen border, plaque region identification within the expanded area between the lumen border and the expanded border, and tissue characterization. The plaque region was identified using a k-means algorithm. For classification, calcium was first identified based on the k-means results, and then a set of texture and intensity-based features [53, 55, 60, 61] was extracted from the remaining regions and used in a random forest classifier [52] to classify lipid tissue, fibrous tissue, and mixed tissue.
Another notable study was conducted by Rico-Jimenez et al. [48], who introduced a tissue characterization method for IVOCT images that does not rely on estimating optical characteristics from the scans. Instead, this approach leverages the intrinsic morphological properties of the so-called “A-lines” in IVOCT scans. Specifically, each A-line is modelled as a linear combination of N depth profiles, which are classified based on their morphological traits to determine the exact tissue type (i.e., Intimal-Thickening, Fibrotic, Superficial-Lipid, and Fibrotic-Lipid) using a linear discriminant analysis algorithm. The feature set included 11 morphological features extracted from the IVOCT images. The dataset consisted of 57 IVOCT pullbacks, and the overall accuracy of the automatic method was 88%. More in detail, the sensitivity for fibrous tissue was 83%, that for fibro-lipidic tissue 85%, and that for superficial lipidic tissue was 100%. The main limitation of the proposed method was that blood was not considered as a class, potentially leading to blood artifacts influencing the results [62].
Xu et al. [49] were the first to automatically classify the IVOCT images into 5 classes, including not only normal tissue, fibrous plaque, fibroatheroma, and fibrocalcific plaque, but also plaque rupture. To achieve this goal, they extracted texture features from IVOCT images, including the Fisher vector [63], intensity, local binary patterns [64], histograms of oriented gradients [65], and bag-of-visual words [66], all of which are descriptors capturing the surface texture and details in the images and can be used by ML algorithms. Then, they used these texture features to train a linear support vector classifier [67], a supervised ML algorithm used for classification problems, achieving overall accuracies of 93.5%, 95.0%, 85.5%, 89.0%, and 84.5%, for normal tissue, fibrous plaque, fibroatheroma, plaque rupture, and fibrocalcific plaque, respectively. A similar approach, involving support vector machines coupled with feature extraction, was also applied in other studies to identify calcified, lipidic, and fibrous plaques [51] as well as fibro-calcified, fibro-lipidic, and mixed plaques [43]. By transforming raw data into a structured representation, feature extraction enabled the enhancement of the support vector machine’s efficiency in distinguishing between different plaque categories.
As highlighted in this overview, an arsenal of ML algorithms has been proposed over the years to characterize atherosclerotic plaques using IVOCT images, each algorithm presenting unique advantages and limitations. The foundational studies by Athanasiou et al. [44] and Ughi et al. [45] demonstrated that the effectiveness of random forest classifiers is hampered by a manual feature extraction phase that could introduce bias and limit scalability. Automated methods, such as those later proposed by Athanasiou et al. [46], improved reproducibility but still faced limitations when simple clustering techniques such as k-means were used. Rico-Jimenez et al. [48] introduced a novel methodology based on the morphological features of “A-lines”, which outperformed manual methods but struggled with real-world issues, such as blood artifacts. Xu et al. [49] advanced the field by incorporating texture features and support vector machines, but their generalizability was constrained by model complexity and small sample sizes. In conclusion, while ML-based approaches for plaque characterization have progressed, many challenges remain to be faced. The reliance on small datasets and feature engineering continues to hinder clinical application. The development of automated, generalized systems that use larger, more diverse datasets to increase resilience and eliminate expert bias is imperative in this field.
3.2 Methods Based on DL
This section presents and compares the most relevant DL-based methods proposed in the literature over recent years for plaque composition characterization (Table 2, Ref. [36, 68, 69, 70, 71, 72, 73, 74, 75, 76, 77, 78, 79, 80, 81, 82, 83, 84, 85, 86, 87, 88, 89, 90, 91]). In general, DL pipelines resemble ML pipelines, as illustrated in Fig. 3 (Ref. [36, 68]). In fact, as for ML pipelines, a preprocessing phase is first performed to clean, normalize, and correct the IVOCT images before they are used as input for the analysis. However, unlike ML pipelines, there is no explicit feature extraction phase in DL models, as these models directly extract features from images through their hidden layers. Compared with the ML approach, this process reduces errors or inaccuracies in feature extraction. Finally, the extracted features are used for image classification and/or segmentation purposes.
Fig. 3.

Main pipeline of deep learning (DL)-based systems for plaque composition characterization from intravascular optical coherence tomography (IVOCT). The main steps involved in plaque composition characterization, including preprocessing phase, DL model application, and IVOCT image segmentation, are illustrated. Adapted with permission from [36] and [68].
In this context, the first studies employing DL methods for characterizing plaque composition date back to 2018 [69, 70]. In particular, He et al. [69], proposed an approach based on a CNN for the automatic identification of plaque components in IVOCT images. The five identified classes were lipid tissue, fibrous tissue, mixed tissue, calcified tissue, and background. The method consisted of two steps: extracting the IVOCT tissue area using Otsu’s automatic thresholding [92], and performing a CNN-based pixel classification for each image patch. The dataset used in the study included 269 IVOCT images acquired from 22 patients. The average prediction accuracy of the CNN-based approach was 87%, with sensitivity values of 97%, 61%, 90%, 67%, and 26% for background, lipid tissue, fibrous tissue, mixed tissue, and calcified tissue, respectively. The results indicated low performance in the characterization of calcium. This might be due to the low number of pixels labeled as calcium. Kolluru et al. [70] also applied a CNN-based approach to classify IVOCT A-lines into fibrocalcific (i.e., fibrous layer followed by calcification), fibrolipid (i.e., fibrous layer followed by lipid deposit), or other layers. Their dataset comprised 48 patients and 4469 IVOCT frames, labeled by consensus of two expert image readers. The model performance was assessed using 10-fold cross-validation using held-out data, increasing the robustness of the proposed method. They achieved accuracies of 77.7 4.1%, 86.5 2.3%, and 85.3 2.5% for fibrocalcific, fibrolipid, and other layers, respectively.
Other examples of standard CNN architecture applications for plaque composition characterization are represented by the studies by Athanasiou et al. [73] and Cheimariotis et al. [81]. In the former study [73], the goal was to subdivide the arterial wall into six classes: calcium, lipid tissue, fibrous tissue, mixed tissue, non-pathological tissue, and no visible tissue. The dataset contained 700 IVOCT frames from 28 patients, annotated by two medical experts. The reported accuracies were 72%, 93%, 96%, 84%, and 99% for calcium, lipid tissue, fibrous tissue, mixed tissue, and non-pathological tissue, respectively. Calcium remained the most challenging class to predict, although improvements have been observed compared to the study of He et al. [69]. In the latter study [81], the aim was to automatically classify IVOCT image A-lines into four classes: lipid, mixed, fibrous, and calcified plaque. The dataset was made of 183 frames from 33 patients. The overall accuracy was 53%, whereas when the classification of fibrocalcific versus fibrolipid plaques was considered, it was 83%.
Other groups have proposed slightly different versions of the standard CNN architecture. Liu et al. [75] introduced a multi-scale CNN consisting of a contracting path and an extracting path to generate a bounding box identifying fibrous plaques, achieving an accuracy of 94%. Lee et al. [36] applied a three-dimensional CNN to classify calcified plaques, reporting a sensitivity of 97.7 2.4% and an F1 score of 92.2 2.1%. Yin et al. [79] proposed a two-path CNN architecture to classify each IVOCT image pixel into fibrous, calcified, or lipidic categories, achieving sensitivities of 95 3%, 87 6%, and 81 11% for fibrous, calcified, and lipidic classes, respectively.
Several studies have employed U-Net architectures for plaque segmentation tasks in IVOCT [93]. These architectures are characterized by a symmetric encoder-decoder structure with skip connections that preserve spatial information. Three relevant examples of U-Net applications are those of Avital et al. [80], Tang et al. [85], and Chu et al. [90]. Avital et al. [80] used a U-Net model to segment calcified plaques, resulting in a Dice coefficient of 71%, while Tang et al. [85] used a U-Net architecture to segment calcified and lipid plaques, obtaining Dice coefficients of 72% and 60%. Chu et al. [90] also used a U-shaped encoder-decoder architecture based on U-Net principles to segment fibrous, calcified, and lipidic plaques. Their model achieved Dice values of 91% for fibrous plaques, 85% for calcified plaques, and 77% for lipid plaques. External validation of this study revealed good plaque classification accuracy, with 97.6% for fibrous, 88.5% for calcified, and 90.5% for lipidic plaques, as validated by three separate core labs. The algorithm was integrated into the OctPlus software (Pulse Medical Technology Inc., Shanghai, China), enabling practical implementation and real-time plaque analysis. The features of this software are detailed in Section 6.
An improvement over the standard CNN-based approach involves leveraging pre-trained neural networks through transfer learning. Popular networks employed in these techniques are AlexNet [94, 95], Visual Geometry Group (VGG) models [95, 96], and GoogleNet [97]. AlexNet, one of the first models to demonstrate the power of DL in image classification, uses convolutional layers to extract hierarchical features. The VGG models, known for their simplicity and depth, focus on using small convolutional filters while increasing the network depth, making them particularly effective for detailed feature extraction. GoogleNet, with its innovative Inception modules, introduced the concept of multi-scale feature extraction, allowing for more efficient and flexible architectures. Among the variations of GoogleNet, the Inception-v3 model [95, 97, 98] refines these concepts, offering improvements in accuracy and computational efficiency through techniques like factorized convolutions and label-smoothing. In this context, Gessert et al. [72] applied transfer learning to detect the presence or absence of atherosclerotic plaques in IVOCT images and further classified plaque types as calcified or fibrous/lipid. Their dataset included 4000 IVOCT frames from 49 patients. The authors used ResNet50-V2 [99] and DenseNet-121 [100] architectures, considering both Cartesian and polar representations of IVOCT images as input. ResNet50-V2 leverages residual connections to ease the training of deeper networks, while DenseNet-121 employs dense layer connections for efficient feature reuse. The best results were obtained using ResNet coupled with the Cartesian representation of IVOCT images, which achieved 90% accuracy for plaque classification. The class-specific accuracies were 78% for calcified plaques, 85% for fibrous/lipid plaques, and 90% for the absence of plaques. Abdolmanafi et al. [78] applied transfer learning to perform semantic segmentation of atherosclerotic tissues, followed by a sparse-autoencoder, designed to enforce sparsity in neural activations, for tissue characterization into fibrous or fibrocalcified plaques, fibroatheroma, thrombus or microvessel. In the first step, a ResNet-based spatial pyramid pooling module was employed. In the second step, sparse-autoencoders were trained on the CNN features extracted during the segmentation phase, with a softmax layer used for tissue classification. This approach achieved a Boundary F1 Score (BF-Score) of 84 18% for semantic segmentation and classification accuracies of 96%, 99%, and 99% for fibrous plaques, fibrocalcific plaques, and fibroatheromas, respectively. The results for thrombi and microvessels are presented in Section 4.
In the context of transfer learning approaches, other studies have utilized the SegNet architecture [101], an encoder-decoder network optimized for semantic pixel-wise segmentation. In particular, IVOCT image calcium segmentation works were presented by Gharaibeh et al. in 2019 [68, 71]. The authors employed a pre-trained CNN architecture for semantic pixel-wise segmentation SegNet [101], to segment calcifications inside IVOCT images. Their dataset comprised 2640 IVOCT frames from 34 patients, labeled through consensus between two expert readers. The achieved Dice coefficients were 76 3%, 98 1%, and 98 1% for calcifications, lumen, and other tissue segmentation, respectively. An additional application of a pre-trained SegNet architecture was that by Lee et al. [74], who segmented both lipidic and calcified plaques, obtaining a Dice coefficient of 80 4%, 73 9%, 91 3% for fibrolipid, fibrocalcific, and other tissue segmentation. More recently, Lee et al. [91] developed the “Optical Coherence TOmography PlaqUe and Stent (OCTOPUS)” analysis software, which employs the SegNet architecture (pre-trained) for segmenting calcified plaques. Further details about this software are provided in Section 6. The approaches presented in this section, which are rapidly being integrated into clinical software, provide real-time analysis and increased plaque categorization accuracy, improving the objectivity of IVOCT-guided treatments.
3.3 Hybrid-based Systems
As described in Sections 3.1 and 3.2, ML-based and DL-based approaches are increasingly used in plaque composition characterization in IVOCT images, leveraging their ability to automatically discover patterns and characteristics from large datasets. These methods often rely on conventional ML classifiers, such as support vector machines and random forests, or fully on DL models, such as CNNs or transfer learning approaches. While effective, these stand-alone techniques may struggle to capture the complexities of plaque heterogeneity, especially in cases where limited datasets are available for model training and validation, or where complex anatomical structures are involved.
In contrast, hybrid ML approaches combine the capabilities of both traditional ML and DL techniques, offering greater flexibility, interpretability, and generalizability abilities (Table 3, Ref. [102, 103, 104]). They exploit the advantages of deep feature extraction while avoiding the hazards of overfitting inherent in purely DL models. For example, Xu et al. [102] achieved an accuracy of 76% by combining deep features extracted from the VGG-19 network [78], a deep CNN known for its depth and feature extraction capabilities [79], with a linear support vector machine [67] for fibroatheroma classification. This hybrid model effectively leveraged the powerful representational capabilities of CNNs while avoiding overfitting in smaller datasets by integrating deep feature extraction with a simpler classifier. Abdolmanafi et al. [103] designed a tissue characterization model to detect pathological formations (i.e., calcifications, fibrosis, macrophages, neovascularization), alongside normal coronary artery tissues, specifically caused by Kawasaki disease [105, 106]. Although its clinical application is highly specific, as it is related to a very specific disease, the study is particularly noteworthy for the proposed methodology and for the characterization of atherosclerotic plaques. The dataset consisted of 33 patients (3149 IVOCT frames). The output classes included calcification, fibrosis, macrophages, and neovascularization. The CNNs AlexNet, VGG-19, and Inception-v3 were used as feature extractors, combined with a random forest classifier as the final classifier applied to the extracted features. AlexNet, VGG-19, and Inception-v3 are all CNNs designed for image analysis. Specifically, AlexNet, one of the first successful CNNs, uses multiple convolutional layers with rectified linear unit (ReLU) activation function to extract features [95]. VGG-19 employs a deeper architecture with 3 3 convolutions to enhance hierarchical feature learning [95]. Inception-v3 introduces inception modules, which combine convolutions of different sizes to capture patterns at multiple scales [95]. The best-performing architecture was a random forest with majority voting, which incorporated all three CNN models as feature extractors. The model achieved accuracies of 95 5% and 95 4% for calcification and fibrosis, respectively. The results for macrophages and neovascularization are reported in Section 4, which focuses on plaque microstructure characterization. Similarly, Lee et al. [104] applied a hybrid technique to classify fibrocalcific plaques, fibro-lipidic plaques, and other plaque types by integrating deep convolutional features with hand-crafted lumen morphological parameters. The two above-mentioned sets of features were used to train and evaluate a random forest classifier, which produced high sensitivity outputs (91.2 6.4% for fibrocalcific plaques, 84.8 8.2% for fibro-lipidic plaques, and 96.5 1.1% for other plaques), and F1 scores (71.9 7.0% for fibrocalcified plaques, 88.7 4.0% for fibro-lipidic plaques, and 97.7 0.8% for other plaques). The integration of DL’s ability to capture complicated, high-level characteristics with hand-crafted features emphasizing domain-specific anatomical elements proved particularly beneficial.
4. AI-based Methods for Characterizing Plaque Microstructure
This section presents and compares the most relevant DL-based methods proposed in the literature over recent years for plaque microstructure characterization (Table 2). To the authors’ knowledge, no studies have focused solely on ML-based approaches for plaque microstructure characterization, unlike plaque composition characterization (Section 3 of this review).
Concerning TCFA identification, Baruah et al. [77] developed a system that, in addition to categorizing plaque types (i.e., calcified, lipidic, and fibrous), differentiated between thick- and TCFAs using neural networks. Their dataset included pullbacks from 76 ex vivo coronary arteries (400 IVOCT frames) and 13 patients. They obtained accuracy scores of 72% for fibroatheroma detection and 99% for distinguishing thin-cap versus thick-cap fibroatheromas, based on comparison with s graded against the pathologists’ classification. The patients were used for a qualitative performance analysis. Shi et al. [84] introduced a weakly supervised object detection approach that uses a deep CNN architecture to classify TCFA, reporting a sensitivity of 88%. Although expert readers verified this approach, it lacked external validation and commercial implementation. In these studies [77, 84], the TCFA was identified, but no estimate of the fibroatheroma thickness or its location within the IVOCT frame was provided. More recently, Lee et al. [88] employed a modified SegNet architecture to segment fibrous caps, allowing for the estimation of fibroatheroma thickness. Their system was applied to both development (8970 IVOCT frames) and external (1362 IVOCT frames) datasets, analyzing a total of 77 patients. The model achieved a Dice coefficient of 85% in both cases. This approach was also integrated into the OCTOPUS software (see Section 6 for more details on this software).
Concerning the presence of structures such as cholesterol, macrophages, and micro-vessels, as anticipated in Section 3.3, Abdolmanafi et al. [103] employed AlexNet, VGG-19, and Inceptionv3 CNN architectures for feature extraction, combined with a random forest classifier, to classify macrophages and neovascularization, among other features. Using a dataset of 3149 IVOCT frames from 33 patients and considering annotations from expert cardiologists in model training, they achieved remarkable accuracy (91 6% for detecting macrophages and 98 2% for neovascularization). However, despite its high performance, the lack of external validation and commercial implementation restricts its broader clinical applicability. In subsequent work, Abdolmanafi et al. [78] developed a ResNet-based spatial pyramid pooling module combined with sparse auto-encoders to classify micro-vessels, achieving an accuracy of 90% as validated by expert IVOCT readers. Chu et al. [90] utilized a U-shaped encoder-decoder architecture to segment cholesterol crystals, macrophages, and micro-vessels, among other IVOCT features. This model, validated internally on 391 patients and externally on 30 patients, achieved Dice coefficients of 53%, 49%, and 60% for these features, respectively. Importantly, this model was integrated into the commercial OctPlus software, enhancing its clinical applicability (see Section 6 for details on this software). Lee et al. [83] applied an encoder-decoder architecture based on the Xception network for microchannel segmentation, achieving a Dice coefficient of 81%. In the last two studies [83, 90], thanks to the segmentation approach, a measure of the location and the area of the plaque components is also given. Finally, Wang et al. [86] used the G-Swin transformer [107], a vision transformer architecture that uses hierarchical representations and shifted windows for efficient feature extraction, to classify macrophages and cavities/dissections, achieving sensitivities of 91% and 90%, respectively.
Concerning thrombus identification, Abdolmanafi et al. [78] developed a ResNet-based spatial pyramid pooling module that works with sparse auto-encoders, which can also classify thrombi. The method, validated by expert IVOCT readers, achieved an accuracy of 98% for thrombi. Wang et al. [86], as previously mentioned, employed the G-Swin transformer [107] for thrombus classification, achieving a sensitivity of 95%. Finally, Chu et al. [89] introduced the first automatic thrombus segmentation in IVOCT using a dual-coordinate cross-attention transformer network, which can be readily integrated into other established transform models to improve performance. Unlike previous studies [78, 86], Chu et al. [89] also provides an estimate of thrombus location and area. Their model, trained on 5649 IVOCT frames from 339 patients, was externally tested on 548 frames from 52 individuals, achieving a Dice coefficient of 71%.
5. AI-based Methods for Detecting Plaque Rupture
To the authors’ knowledge, the work of Xu et al. [49] (Table 1) is the only study that has applied AI-based methods to IVOCT images for detecting the presence of plaque rupture. More in detail, a support vector machine classifier, using image texture features, was employed to classify IVOCT images into five classes: normal, fibrous plaque, fibroatheroma, plaque rupture, and fibrocalcified plaque. The dataset consisted of 1000 IVOCT frames from 47 patients, annotated manually by one single cardiologist. The mean accuracy for plaque rupture detection was 89%. The main limitation of this study is represented by the manual labels provided by only one cardiologist (no consensus was employed). This work opens the way to testing more advanced AI-based methods (such as DL approaches) to perform plaque rupture detection.
6. AI-based Software
While numerous AI approaches have been developed for assessing coronary artery plaques in IVOCT in research, they are not yet widely available for clinical usage. In general, published studies lack access to source code, data, and trained models in public repositories, hindering reproducibility and broader implementation. The only available software for plaque assessment from IVOCT are the OCTPlus software (Pulse Medical Imaging Technology, Shanghai, China) [90], the OCTOPUS software [91], and the Ultreon software (Abbott Laboratories, Abbott Park, IL, USA) [108]. Among these, Ultreon is the only software to have received both FDA and CE approval (FDA 510(k), CE mark April 2021, approval number: K210458) [109, 110].
OCTPlus [90], whose AI-based method was introduced in Section 3.2, is intended for the automated analysis of IVOCT pullbacks. The software accurately segments and characterizes atherosclerotic plaques, identifying components such as fibrous and lipidic tissue and calcifications. The OCTPlus interface displays both 2-Dimensional (2D) cross-sectional and 3-Dimensional (3D) views of the analyzed regions, offering an intuitive representation of plaque composition. Users can quantify plaques, perform real-time analysis, and detect markers of plaque instability, including macrophages, cholesterol crystals, and microvessels.
OCTOPUS [91], whose AI-based method was introduced in Section 3.2, offers automated analysis of IVOCT pullbacks, enabling both plaque and stent evaluation. The software provides lumen and calcification segmentation, and assesses stent deployment by recognizing struts, categorizing them as covered or uncovered, and quantifying tissue coverage and malapposition.
Ultreon [108] automatically detects the lumen, stent, external elastic membrane, and calcium (Fig. 4) [109, 110]. One of its most notable features for atherosclerotic plaque characterization is its advanced calcium detection and analysis. Using AI-based algorithms, the software automatically identifies calcified plaques on IVOCT frames and provides measurements of the calcium arc and thickness.
Fig. 4.

Graphical user interface of the Ultreon 2.0 software (Abbott Laboratories). (A) Angiographic view of a coronary vessel imaged using IVOCT. (B) Example of a cross-sectional IVOCT image (i.e., IVOCT frame) of the analyzed vessel, with Ultreon’s morphological assessment view showing automated calcium detection (calcium is highlighted by an orange arc). (C) Quantitative display of the calcium arc, thickness, and longitudinal extent, along with lumen diameter information. (D) Longitudinal reconstruction of the vessel from IVOCT imaging data: the current IVOCT frame is indicated by a thicker white line, while IVOCT frames with a total calcium angle greater than 180° are marked by orange lines.
7. Challenges and Limitations of the Current AI Approaches
AI-based approaches for studying atherosclerosis and characterizing plaque formations in coronary artery images, particularly IVOCT images, have advanced extraordinarily in recent years [11]. However, many open issues remain to be addressed. In general, the application of AI in detecting atherosclerotic disease remains a “black-box” concept that hampers the implementation of AI-based tools in clinical processes [111]. Although AI technologies have become more common in simple segmentation tasks, AI-based models for risk prediction are still approached with caution [112], primarily due to a lack of explainability and interpretability. To address this perception, several factors should be considered.
The datasets used in computational studies should be carefully evaluated for both quantity and quality. Specifically, it is crucial to conduct large-scale multicenter studies to assess the AI-based models in an unbiased, reproducible, and statistically significant manner. External validation datasets are necessary to confirm the prognostic power of the developed methodologies. Moreover, benchmarking datasets are urgently needed to enable fair testing and comparisons of the various models developed over the years. Additionally, ensuring the robustness of ground truth labels and segmentations performed by human operators is crucial to minimize bias caused by inter- and intra-observer variability. One potential solution to reduce this bias is the use of histopathological data from post-mortem studies, as seen in a few studies [43, 48, 77, 82, 91].
Another critical issue is the risk of shortcut learning in DL models, where the algorithm may memorize spurious correlations or irrelevant patterns present in the training data rather than learning true disease-related features. This issue is particularly relevant in medical imaging, where biases in the dataset, such as artifacts or acquisition-specific features, can mislead the learning process. To mitigate this, it is important to carefully select model architectures that are appropriate for the size and diversity of the available data and to apply rigorous data augmentation strategies during training to improve generalizability [113].
Furthermore, integrating AI models into healthcare software and workflows would markedly increase their practical use. Clinicians need models that are not only accurate in their predictions, but also interpretable, explainable, and easy to integrate into existing hospital information systems and electronic health records. The development of user-friendly interfaces and visualization tools is essential to support AI-driven decision-making. However, regulatory approval and compliance with clinical guidelines must be addressed before these models can be fully implemented in healthcare settings. This is a critical aspect, considering that due to strict regulations bringing novel medical devices or software to market is a complex and time-consuming procedure. Multiple stages are needed, including pre-clinical studies, clinical trials, and comprehensive documentation to demonstrate safety, efficacy, and industry compliance. Regulatory agencies often mandate extensive testing and review, which can take several years. Additionally, ongoing post-market surveillance and the need to comply with evolving regulations further complicate the process from innovation to commercialization, making it both time-consuming and resource-intensive. Finally, continuous updates to the models and real-time learning from new patient data will be essential to ensure that AI tools remain relevant and perform effectively in clinical practice.
8. Toward Integration Into Clinical Risk Prediction Systems
AI-based algorithms can not only automate the classification and segmentation of the lumen contours, stent struts, plaque components and other features in IVOCT images, but also integrate imaging biomarkers with established cardiovascular risk factors to improve the prediction of event recurrence at follow-up (Fig. 5, Ref. [114]), as demonstrated with other imaging techniques. For example, in coronary computed tomography angiography (CCTA), the standardized fat attenuation index (FAI) score is used in a risk prediction algorithm alongside variables such as age, gender, and cardiovascular risk factors such as hypertension, diabetes, smoking, and hyperlipidemia, to calculate the absolute 8-year risk of fatal cardiac events [114]. Integrating image-derived biomarkers, particularly those extracted from IVOCT alone [11] or in combination with other imaging modalities such as CCTA [115], with established cardiovascular risk factors in AI-based models for predicting adverse events at follow-up could provide additional prognostic insights for patients with coronary artery disease and help predict the risk of death, new myocardial infarction, or coronary artery stenosis. This approach may lead to more accurate risk prediction in symptomatic patients undergoing coronary angiogram than traditional risk scores, which are based solely on clinical factors and were originally designed for primary prevention in the general population. Another possibility is the use of biomarkers extracted from IVOCT images to build cardiovascular risk predictors. While this is a challenging task, to the best of the authors’ knowledge, no study has yet successfully addressed this issue using IVOCT. A study by Araki et al. [116] addressed a similar problem by employing ML techniques to predict coronary artery disease based on plaque morphology information extracted from IVUS, but a major adverse cardiovascular risk predictor system based on IVOCT data is still lacking. Establishing large-scale multinational cohorts could further pave the way for developing novel imaging biomarkers linked to reliable outcomes, advancing the creation of clinical risk prediction systems in secondary prevention. By incorporating adverse events over an extended follow-up period, AI-based models could be trained to predict atherosclerotic plaque vulnerability and assess patient risk. This approach would enable a more comprehensive risk evaluation, identifying high-risk individuals and guiding personalized treatment plans that target specific risk factors.
Fig. 5.

Schematic of the process for integrating image-derived biomarkers with patients’ clinical characteristics in artificial intelligence models to evaluate coronary artery disease, assess risk, and create individualized medical care. Adapted with permission from [114].
9. Conclusions
This work provides a comprehensive overview of AI-based approaches for identifying atherosclerotic plaque components in IVOCT images of coronary arteries. Despite significant advances in this research field, only a few systems are commercially accessible and used in clinical settings. The analysis highlights key limitations, such as a lack of standardization, reproducibility, explainability, interpretability, and integration into existing clinical systems, which are critical factors for developing effective AI-based models. Addressing these gaps is essential, particularly for atherosclerotic plaque characterization and adverse event risk prediction. While advanced methods have improved over time, there is an urgent need for standardized applications to assess major adverse cardiovascular events in clinical practice, as well as regulatory approval. With additional testing using large-scale outcome cohorts, these models can be recalibrated and updated regularly, eventually being integrated into risk prediction and management systems. In this context, AI-based techniques have the potential to drive risk-guided management strategies for both primary and secondary prevention in the near future.
Acknowledgment
Not applicable.
Funding Statement
This study was carried out within the project “Adverse cardiovascular events in coronary Plaques not undeRgoing pErcutaneous coronary intervention evaluateD with optical Coherence Tomography. The PREDICT machine-learning risk score”, funded by the European Union–NextGenerationEU, Italian Ministry of University and Research, within the PRIN 2022 program (D.D.104 del 02/02/2022). UM was supported by the project “COMbined biomarker criteria for coronary atherosclerotic Plaque rUpTurE aSsessment (COMPUTES)”, funded by the European Union–NextGenerationEU, Italian Ministry of University and Research, within the PRIN 2022 program (D.D.104 del 02/02/2022).
Footnotes
Publisher’s Note: IMR Press stays neutral with regard to jurisdictional claims in published maps and institutional affiliations.
Author Contributions
MS: Conceptualization, Literature review, Methodology, Writing—Original Draft, Writing—Review & Editing, Visualization, Data curation. CCar: Literature review, Writing—review & editing, Data curation. FBru: Literature review, Writing—review & editing, Validation. STHS: Writing—review & editing, validation. KP: Writing—review & editing, Validation. KK: Writing—review & editing, Validation. GDN: Writing—review & editing, Validation. UM: Writing—review & editing, Funding acquisition, Resources, Validation. RP: Writing—review & editing, Funding acquisition, Validation. FBur: Writing—review & editing, Funding acquisition, Validation. FDA: Writing—review & editing, Funding acquisition, Validation. MAD: Writing—review & editing, Funding acquisition, Resources, Validation. CChi: Conceptualization, Methodology, Writing—original draft, Writing—review & editing, Supervision, Funding acquisition, Project administration, Validation. All the authors made substantial contributions through the analysis and interpretation of the data. Furthermore, the authors participated in the validation process, which involves verifying and confirming the reliability and consistency of the results, methods, or conclusions presented in the studies reviewed, ensuring that the evidence is robust and aligns with the established scientific literature. All authors have participated sufficiently in the work and agreed to be accountable for all aspects of the work. All authors read and approved the final manuscript.
Ethics Approval and Consent to Participate
Not applicable.
Funding
This study was carried out within the project “Adverse cardiovascular events in coronary Plaques not undeRgoing pErcutaneous coronary intervention evaluateD with optical Coherence Tomography. The PREDICT machine-learning risk score”, funded by the European Union–NextGenerationEU, Italian Ministry of University and Research, within the PRIN 2022 program (D.D.104 del 02/02/2022). UM was supported by the project “COMbined biomarker criteria for coronary atherosclerotic Plaque rUpTurE aSsessment (COMPUTES)”, funded by the European Union–NextGenerationEU, Italian Ministry of University and Research, within the PRIN 2022 program (D.D.104 del 02/02/2022).
Conflict of Interest
The authors declare no conflict of interest. FDA is serving as one of the Editorial Boards of this journal. We declare that FDA had no involvement in the peer review of this article and has no access to information regarding its peer review. Full responsibility for the editorial process for this article was delegated to Zhonghua Sun. FBru has received speaker honoraria from Abbott and Boston Scientific. FBur has received speaker honoraria from Abbott, Abiomed, Edwards, Medtronic, and Terumo. FDA has received personal and institutional grant from Abbott. All other authors declare no conflict of interest.
References
- [1].Tearney GJ, Regar E, Akasaka T, Adriaenssens T, Barlis P, Bezerra HG, et al. Consensus standards for acquisition, measurement, and reporting of intravascular optical coherence tomography studies: a report from the International Working Group for Intravascular Optical Coherence Tomography Standardization and Validation. Journal of the American College of Cardiology . 2012;59:1058–1072. doi: 10.1016/j.jacc.2011.09.079. [DOI] [PubMed] [Google Scholar]
- [2].Giacomo P. The michelson interferometer. Microchimica Acta . 1987;93:19–31. doi: 10.1007/BF01201680. [DOI] [Google Scholar]
- [3].Ali ZA, Karimi Galougahi K, Mintz GS, Maehara A, Shlofmitz RA, Mattesini A. Intracoronary optical coherence tomography: state of the art and future directions. EuroIntervention: Journal of EuroPCR in Collaboration with the Working Group on Interventional Cardiology of the European Society of Cardiology . 2021;17:e105–e123. doi: 10.4244/EIJ-D-21-00089. [DOI] [PMC free article] [PubMed] [Google Scholar]
- [4].Zimmerman SK, Vacek JL. Imaging techniques in acute coronary syndromes: a review. ISRN Cardiology . 2011;2011:359127. doi: 10.5402/2011/359127. [DOI] [PMC free article] [PubMed] [Google Scholar]
- [5].Bluemke DA, Achenbach S, Budoff M, Gerber TC, Gersh B, Hillis LD, et al. Noninvasive coronary artery imaging: magnetic resonance angiography and multidetector computed tomography angiography: a scientific statement from the american heart association committee on cardiovascular imaging and intervention of the council on cardiovascular radiology and intervention, and the councils on clinical cardiology and cardiovascular disease in the young. Circulation . 2008;118:586–606. doi: 10.1161/CIRCULATIONAHA.108.189695. [DOI] [PubMed] [Google Scholar]
- [6].Tearney GJ. Intravascular optical coherence tomography. European Heart Journal . 2018;39:3685–3686. doi: 10.1093/eurheartj/ehy646. [DOI] [PubMed] [Google Scholar]
- [7].van Soest G, Marcu L, Bouma BE, Regar E. Intravascular imaging for characterization of coronary atherosclerosis. Current Opinion in Biomedical Engineering . 2017;3:1–12. doi: 10.1016/j.cobme.2017.07.001. [DOI] [Google Scholar]
- [8].Nakazawa G, Otsuka F, Nakano M, Vorpahl M, Yazdani SK, Ladich E, et al. The pathology of neoatherosclerosis in human coronary implants bare-metal and drug-eluting stents. Journal of the American College of Cardiology . 2011;57:1314–1322. doi: 10.1016/j.jacc.2011.01.011. [DOI] [PMC free article] [PubMed] [Google Scholar]
- [9].Vrints C, Andreotti F, Koskinas KC, Rossello X, Adamo M, Ainslie J, et al. 2024 ESC Guidelines for the management of chronic coronary syndromes. European Heart Journal . 2024;45:3415–3537. doi: 10.1093/eurheartj/ehae177. [DOI] [PubMed] [Google Scholar]
- [10].Almajid F, Kang DY, Ahn JM, Park SJ, Park DW. Optical coherence tomography to guide percutaneous coronary intervention. EuroIntervention: Journal of EuroPCR in Collaboration with the Working Group on Interventional Cardiology of the European Society of Cardiology . 2024;20:e1202–e1216. doi: 10.4244/EIJ-D-23-00912. [DOI] [PMC free article] [PubMed] [Google Scholar]
- [11].van der Waerden RGA, Volleberg RHJA, Luttikholt TJ, Cancian P, van der Zande JL, Stone GW, et al. Artificial intelligence for the analysis of intracoronary optical coherence tomography images: a systematic review. European Heart Journal. Digital Health . 2025;6:270–284. doi: 10.1093/ehjdh/ztaf005. [DOI] [PMC free article] [PubMed] [Google Scholar]
- [12].Samant S, Bakhos JJ, Wu W, Zhao S, Kassab GS, Khan B, et al. Artificial Intelligence, Computational Simulations, and Extended Reality in Cardiovascular Interventions. JACC. Cardiovascular Interventions . 2023;16:2479–2497. doi: 10.1016/j.jcin.2023.07.022. [DOI] [PubMed] [Google Scholar]
- [13].Qin N, Wang J, Liu D, Liu Y, Huang L, Li Q. Research progress of coronary artery calcification based on optical coherence tomography. In: Carney PS, Yuan XC, Shi K, Somekh MG, editors. Advanced Optical Imaging Technologies II . SPIE: Hangzhou, China; Hangzhou, China: 2019. p. 48. [DOI] [Google Scholar]
- [14].Kuppili V, Biswas M, Sreekumar A, Suri HS, Saba L, Edla DR, et al. Extreme Learning Machine Framework for Risk Stratification of Fatty Liver Disease Using Ultrasound Tissue Characterization. Journal of Medical Systems . 2017;41:152. doi: 10.1007/s10916-017-0797-1. [DOI] [PubMed] [Google Scholar]
- [15].Saba L, Jain PK, Suri HS, Ikeda N, Araki T, Singh BK, et al. Plaque Tissue Morphology-Based Stroke Risk Stratification Using Carotid Ultrasound: A Polling-Based PCA Learning Paradigm. Journal of Medical Systems . 2017;41:98. doi: 10.1007/s10916-017-0745-0. [DOI] [PubMed] [Google Scholar]
- [16].Sharma AM, Gupta A, Kumar PK, Rajan J, Saba L, Nobutaka I, et al. A Review on Carotid Ultrasound Atherosclerotic Tissue Characterization and Stroke Risk Stratification in Machine Learning Framework. Current Atherosclerosis Reports . 2015;17:55. doi: 10.1007/s11883-015-0529-2. [DOI] [PubMed] [Google Scholar]
- [17].Acharya UR, Mookiah MRK, Vinitha Sree S, Afonso D, Sanches J, Shafique S, et al. Atherosclerotic plaque tissue characterization in 2D ultrasound longitudinal carotid scans for automated classification: a paradigm for stroke risk assessment. Medical & Biological Engineering & Computing . 2013;51:513–523. doi: 10.1007/s11517-012-1019-0. [DOI] [PubMed] [Google Scholar]
- [18].Biswas M, Kuppili V, Edla DR, Suri HS, Saba L, Marinhoe RT, et al. Symtosis: A liver ultrasound tissue characterization and risk stratification in optimized deep learning paradigm. Computer Methods and Programs in Biomedicine . 2018;155:165–177. doi: 10.1016/j.cmpb.2017.12.016. [DOI] [PubMed] [Google Scholar]
- [19].Dong Y, Pan Y, Zhao X, Li R, Yuan C, Xu W. In 2017 IEEE International Conference on Smart Computing (SMARTCOMP) Hong Kong, China. IEEE: 2017. Identifying carotid plaque composition in MRI with convolutional neural networks; pp. 1–8. [Google Scholar]
- [20].Lekadir K, Galimzianova A, Betriu A, Del Mar Vila M, Igual L, Rubin DL, et al. A Convolutional Neural Network for Automatic Characterization of Plaque Composition in Carotid Ultrasound. IEEE Journal of Biomedical and Health Informatics . 2017;21:48–55. doi: 10.1109/JBHI.2016.2631401. [DOI] [PMC free article] [PubMed] [Google Scholar]
- [21].Menchón-Lara RM, Sancho-Gómez JL, Bueno-Crespo A. Early-stage atherosclerosis detection using deep learning over carotid ultrasound images. Applied Soft Computing . 2016;49:616–628. doi: 10.1016/j.asoc.2016.08.055. [DOI] [Google Scholar]
- [22].Hau WKT, Yan BPY. Role of Intravascular Imaging in Primary PCI. 2018 Jul 14. In: Watson TJ, Ong Pjl, Tcheng JE, editors. Primary Angioplasty: A Practical Guide (Internet) Springer; Singapore: 2018. pp. 179–195. [DOI] [PubMed] [Google Scholar]
- [23].Zhao ZW, Liu C, Zhao Q, Xu YK, Cheng YJ, Sun TN, et al. Triglyceride-glucose index and non-culprit coronary plaque characteristics assessed by optical coherence tomography in patients following acute coronary syndrome: A cross-sectional study. Frontiers in Cardiovascular Medicine . 2022;9:1019233. doi: 10.3389/fcvm.2022.1019233. [DOI] [PMC free article] [PubMed] [Google Scholar]
- [24].Kubo T, Ino Y, Tanimoto T, Kitabata H, Tanaka A, Akasaka T. Optical coherence tomography imaging in acute coronary syndromes. Cardiology Research and Practice . 2011;2011:312978. doi: 10.4061/2011/312978. [DOI] [PMC free article] [PubMed] [Google Scholar]
- [25].Dawson LP, Layland J. High-Risk Coronary Plaque Features: A Narrative Review. Cardiology and Therapy . 2022;11:319–335. doi: 10.1007/s40119-022-00271-9. [DOI] [PMC free article] [PubMed] [Google Scholar]
- [26].Gallone G, Bellettini M, Gatti M, Tore D, Bruno F, Scudeler L, et al. Coronary Plaque Characteristics Associated With Major Adverse Cardiovascular Events in Atherosclerotic Patients and Lesions: A Systematic Review and Meta-Analysis. JACC. Cardiovascular Imaging . 2023;16:1584–1604. doi: 10.1016/j.jcmg.2023.08.006. [DOI] [PubMed] [Google Scholar]
- [27].Jang IK, Tearney GJ, MacNeill B, Takano M, Moselewski F, Iftima N, et al. In vivo characterization of coronary atherosclerotic plaque by use of optical coherence tomography. Circulation . 2005;111:1551–1555. doi: 10.1161/01.CIR.0000159354.43778.69. [DOI] [PMC free article] [PubMed] [Google Scholar]
- [28].Sibbald M, Pinilla-Echeverri N, Alameer M, Chavarria J, Dutra G, Sheth T. Using Optical Coherence Tomography to Identify Lipid and Its Impact on Interventions and Clinical Events - A Scoping Review. Circulation Journal: Official Journal of the Japanese Circulation Society . 2021;85:2053–2062. doi: 10.1253/circj.CJ-21-0377. [DOI] [PubMed] [Google Scholar]
- [29].Pinilla-Echeverri N, Mehta SR, Wang J, Lavi S, Schampaert E, Cantor WJ, et al. Nonculprit Lesion Plaque Morphology in Patients With ST-Segment-Elevation Myocardial Infarction: Results From the COMPLETE Trial Optical Coherence Tomography Substudys. Circulation. Cardiovascular Interventions . 2020;13:e008768. doi: 10.1161/CIRCINTERVENTIONS.119.008768. [DOI] [PubMed] [Google Scholar]
- [30].Prati F, Romagnoli E, Gatto L, La Manna A, Burzotta F, Ozaki Y, et al. Relationship between coronary plaque morphology of the left anterior descending artery and 12 months clinical outcome: the CLIMA study. European Heart Journal . 2020;41:383–391. doi: 10.1093/eurheartj/ehz520. [DOI] [PubMed] [Google Scholar]
- [31].Araki M, Yonetsu T, Kurihara O, Nakajima A, Lee H, Soeda T, et al. Predictors of Rapid Plaque Progression: An Optical Coherence Tomography Study. JACC. Cardiovascular Imaging . 2021;14:1628–1638. doi: 10.1016/j.jcmg.2020.08.014. [DOI] [PubMed] [Google Scholar]
- [32].Kubo T, Ino Y, Mintz GS, Shiono Y, Shimamura K, Takahata M, et al. Optical coherence tomography detection of vulnerable plaques at high risk of developing acute coronary syndrome. European Heart Journal. Cardiovascular Imaging . 2021:jeab028. doi: 10.1093/ehjci/jeab028. [DOI] [PubMed] [Google Scholar]
- [33].Xing L, Higuma T, Wang Z, Aguirre AD, Mizuno K, Takano M, et al. Clinical Significance of Lipid-Rich Plaque Detected by Optical Coherence Tomography. Journal of the American College of Cardiology . 2017;69:2502–2513. doi: 10.1016/j.jacc.2017.03.556. [DOI] [PubMed] [Google Scholar]
- [34].Bernelli C, Shimamura K, Komukai K, Capodanno D, Saia F, Garbo R, et al. Impact of Culprit Plaque and Atherothrombotic Components on Incomplete Stent Apposition in Patients With ST-Elevation Myocardial Infarction Treated With Everolimus-Eluting Stents - An OCTAVIA Substudy. Circulation Journal: Official Journal of the Japanese Circulation Society . 2016;80:895–905. doi: 10.1253/circj.CJ-15-1140. [DOI] [PubMed] [Google Scholar]
- [35].Kubo T, Tanaka A, Ino Y, Kitabata H, Shiono Y, Akasaka T. Assessment of coronary atherosclerosis using optical coherence tomography. Journal of Atherosclerosis and Thrombosis . 2014;21:895–903. doi: 10.5551/jat.25452. [DOI] [PubMed] [Google Scholar]
- [36].Lee J, Gharaibeh Y, Kolluru C, Zimin VN, Dallan LAP, Kim JN, et al. Segmentation of Coronary Calcified Plaque in Intravascular OCT Images Using a Two-Step Deep Learning Approach. IEEE Access: Practical Innovations, Open Solutions . 2020;8:225581–225593. doi: 10.1109/access.2020.3045285. [DOI] [PMC free article] [PubMed] [Google Scholar]
- [37].Sugiyama T, Yamamoto E, Fracassi F, Lee H, Yonetsu T, Kakuta T, et al. Calcified Plaques in Patients With Acute Coronary Syndromes. JACC. Cardiovascular Interventions . 2019;12:531–540. doi: 10.1016/j.jcin.2018.12.013. [DOI] [PubMed] [Google Scholar]
- [38].Stone GW, Maehara A, Lansky AJ, de Bruyne B, Cristea E, Mintz GS, et al. A prospective natural-history study of coronary atherosclerosis. The New England Journal of Medicine . 2011;364:226–235. doi: 10.1056/NEJMoa1002358. [DOI] [PubMed] [Google Scholar]
- [39].Calvert PA, Obaid DR, O’Sullivan M, Shapiro LM, McNab D, Densem CG, et al. Association between IVUS findings and adverse outcomes in patients with coronary artery disease: the VIVA (VH-IVUS in Vulnerable Atherosclerosis) Study. JACC. Cardiovascular Imaging . 2011;4:894–901. doi: 10.1016/j.jcmg.2011.05.005. [DOI] [PubMed] [Google Scholar]
- [40].Nishimura S, Ehara S, Hasegawa T, Matsumoto K, Yoshikawa J, Shimada K. Cholesterol crystal as a new feature of coronary vulnerable plaques: An optical coherence tomography study. Journal of Cardiology . 2017;69:253–259. doi: 10.1016/j.jjcc.2016.04.003. [DOI] [PubMed] [Google Scholar]
- [41].Kerensky RA, Wade M, Deedwania P, Boden WE, Pepine CJ, Veterans Affairs Non-Q-Wave Infarction Stategies in-Hospital (VANQWISH) Trial Investigators Revisiting the culprit lesion in non-Q-wave myocardial infarction. Results from the VANQWISH trial angiographic core laboratory. Journal of the American College of Cardiology . 2002;39:1456–1463. doi: 10.1016/s0735-1097(02)01770-9. [DOI] [PubMed] [Google Scholar]
- [42].Montone RA, Vetrugno V, Camilli M, Russo M, Fracassi F, Khan SQ, et al. Macrophage infiltrates in coronary plaque erosion and cardiovascular outcome in patients with acute coronary syndrome. Atherosclerosis . 2020;311:158–166. doi: 10.1016/j.atherosclerosis.2020.08.009. [DOI] [PubMed] [Google Scholar]
- [43].Prabhu D, Bezerra H, Kolluru C, Gharaibeh Y, Mehanna E, Wu H, et al. Automated A-line coronary plaque classification of intravascular optical coherence tomography images using handcrafted features and large datasets. Journal of Biomedical Optics . 2019;24:1–15. doi: 10.1117/1.JBO.24.10.106002. [DOI] [PMC free article] [PubMed] [Google Scholar]
- [44].Athanasiou LS, Exarchos TP, Naka KK, Michalis LK, Prati F, Fotiadis DI. Atherosclerotic plaque characterization in Optical Coherence Tomography images. Annual International Conference of the IEEE Engineering in Medicine and Biology Society. IEEE Engineering in Medicine and Biology Society. Annual International Conference . 2011:4485–4488. doi: 10.1109/IEMBS.2011.6091112. [DOI] [PubMed] [Google Scholar]
- [45].Ughi GJ, Adriaenssens T, Sinnaeve P, Desmet W, D’hooge J. Automated tissue characterization of in vivo atherosclerotic plaques by intravascular optical coherence tomography images. Biomedical Optics Express . 2013;4:1014–30. doi: 10.1364/BOE.4.001014. [DOI] [PMC free article] [PubMed] [Google Scholar]
- [46].Athanasiou LS, Bourantas CV, Rigas GA, Exarchos TP, Sakellarios AI, Siogkas PK, et al. Fully automated calcium detection using optical coherence tomography. Annual International Conference of the IEEE Engineering in Medicine and Biology Society. IEEE Engineering in Medicine and Biology Society. Annual International Conference . 2013;2013:1430–1433. doi: 10.1109/EMBC.2013.6609779. [DOI] [PubMed] [Google Scholar]
- [47].Athanasiou LS, Bourantas CV, Rigas G, Sakellarios AI, Exarchos TP, Siogkas PK, et al. Methodology for fully automated segmentation and plaque characterization in intracoronary optical coherence tomography images. Journal of Biomedical Optics . 2014;19:026009. doi: 10.1117/1.JBO.19.2.026009. [DOI] [PubMed] [Google Scholar]
- [48].Rico-Jimenez JJ, Campos-Delgado DU, Villiger M, Otsuka K, Bouma BE, Jo JA. Automatic classification of atherosclerotic plaques imaged with intravascular OCT. Biomedical Optics Express . 2016;7:4069–4085. doi: 10.1364/BOE.7.004069. [DOI] [PMC free article] [PubMed] [Google Scholar]
- [49].Xu M, Cheng J, Wong DWK, Taruya A, Tanaka A, Liu J, et al. In 2016 IEEE Region 10 Conference (TENCON) Singapore. IEEE: 2016. Automatic image classification in intravascular optical coherence tomography images; pp. 1544–1547. [Google Scholar]
- [50].Zhou P, Zhu T, He C, Li Z. Automatic classification of atherosclerotic tissue in intravascular optical coherence tomography images. Journal of the Optical Society of America. A, Optics, Image Science, and Vision . 2017;34:1152–1159. doi: 10.1364/JOSAA.34.001152. [DOI] [PubMed] [Google Scholar]
- [51].Huang Y, He C, Wang J, Miao Y, Zhu T, Zhou P, et al. Intravascular Optical Coherence Tomography Image Segmentation Based on Support Vector Machine Algorithm. Molecular & Cellular Biomechanics . 2018;15:117–125. doi: 10.3970/mcb.2018.02478. [DOI] [Google Scholar]
- [52].Breiman L. Random forests. Machine Learning . 2001;45:5–32. doi: 10.1023/A:1010933404324. [DOI] [Google Scholar]
- [53].Gonzalez RC, Woods RE. Digital Image Processing . Prentice-Hall, Inc.; USA: 2006. 3nd edn. [Google Scholar]
- [54].Tuceryan M, Jain AK. Texture analysis. Handbook of Pattern Recognition and Computer Vision . 1993:235–276. doi: 10.1142/9789814343138_0010. [DOI] [Google Scholar]
- [55].Nanni L, Lumini A, Brahnam S. Local binary patterns variants as texture descriptors for medical image analysis. Artificial Intelligence in Medicine . 2010;49:117–125. doi: 10.1016/j.artmed.2010.02.006. [DOI] [PubMed] [Google Scholar]
- [56].Haralick RM, Shanmugam K, Dinstein IH. Textural features for image classification. IEEE Transactions on Systems, Man, and Cybernetics . 1973;SMC-3:610–621. doi: 10.1109/TSMC.1973.4309314. [DOI] [Google Scholar]
- [57].Conners RW, Harlow CA. A theoretical comparison of texture algorithms. IEEE Transactions on Pattern Analysis and Machine Intelligence . 1980;2:204–222. doi: 10.1109/tpami.1980.4767008. [DOI] [PubMed] [Google Scholar]
- [58].van der Meer FJ, Faber DJ, Baraznji Sassoon DM, Aalders MC, Pasterkamp G, van Leeuwen TG. Localized measurement of optical attenuation coefficients of atherosclerotic plaque constituents by quantitative optical coherence tomography. IEEE Transactions on Medical Imaging . 2005;24:1369–1376. doi: 10.1109/TMI.2005.854297. [DOI] [PubMed] [Google Scholar]
- [59].Bishop CM, Hinton G. Neural Networks for Pattern Recognition . Oxford University Press: Oxford, NY; 1995. [Google Scholar]
- [60].Chen CH, Pau LF, Wang PSP. World scientific: Singapore; 1993. Handbook of Pattern Recognition and Computer Vision. [DOI] [Google Scholar]
- [61].Guo Z, Zhang L, Zhang D. Rotation invariant texture classification using LBP variance (LBPV) with global matching. Pattern Recognition . 2010;43:706–719. doi: 10.1016/j.patcog.2009.08.017. [DOI] [Google Scholar]
- [62].Boi A, Jamthikar AD, Saba L, Gupta D, Sharma A, Loi B, et al. A Survey on Coronary Atherosclerotic Plaque Tissue Characterization in Intravascular Optical Coherence Tomography. Current Atherosclerosis Reports . 2018;20:33. doi: 10.1007/s11883-018-0736-8. [DOI] [PubMed] [Google Scholar]
- [63].Perronnin F, Sánchez J, Mensink T. Improving the Fisher Kernel for Large-Scale Image Classification. In: Daniilidis K, Maragos P, Paragios N, editors. Computer Vision – ECCV 2010. ECCV 2010. Lecture Notes in Computer Science . Springer Berlin Heidelberg: Berlin, Heidelberg; 2010. pp. 143–156. [DOI] [Google Scholar]
- [64].Ojala T, Pietikainen M, Maenpaa T. Multiresolution gray-scale and rotation invariant texture classification with local binary patterns. IEEE Transactions on Pattern Analysis and Machine Intelligence . 2002;24:971–987. [Google Scholar]
- [65].Dalal N, Triggs B. In 2005 IEEE Computer Society Conference on Computer Vision and Pattern Recognition (CVPR’05) San Diego, CA, USA. IEEE; 2005. Histograms of oriented gradients for human detection; pp. 886–893. [Google Scholar]
- [66].Fei-Fei L, Perona P. In 2005 IEEE Computer Society Conference on Computer Vision and Pattern Recognition (CVPR’05) San Diego, CA, USA. IEEE; 2005. A bayesian hierarchical model for learning natural scene categories; pp. 524–531. [Google Scholar]
- [67].Cortes C, Vapnik V. Support-vector networks. Machine Learning . 1995;20:273–297. doi: 10.1007/BF00994018. [DOI] [Google Scholar]
- [68].Gharaibeh Y, Prabhu D, Kolluru C, Lee J, Zimin V, Bezerra H, et al. Coronary calcification segmentation in intravascular OCT images using deep learning: application to calcification scoring. Journal of Medical Imaging (Bellingham, Wash.) . 2019;6:045002. doi: 10.1117/1.JMI.6.4.045002. [DOI] [PMC free article] [PubMed] [Google Scholar]
- [69].He S, Zheng J, Maehara A, Mintz G, Tang D, Anastasio M, et al. In Medical Imaging 2018: Image Processing . SPIE; Houston, United States: 2018. Convolutional neural network based automatic plaque characterization for intracoronary optical coherence tomography images; p. 107. [DOI] [Google Scholar]
- [70].Kolluru C, Prabhu D, Gharaibeh Y, Bezerra H, Guagliumi G, Wilson D. Deep neural networks for A-line-based plaque classification in coronary intravascular optical coherence tomography images. Journal of Medical Imaging (Bellingham, Wash.) . 2018;5:044504. doi: 10.1117/1.JMI.5.4.044504. [DOI] [PMC free article] [PubMed] [Google Scholar]
- [71].Gharaibeh Y, Dong P, Prabhu D, Kolluru C, Lee J, Zimin V, et al. Deep learning segmentation of coronary calcified plaque from intravascular optical coherence tomography (IVOCT) images with application to finite element modeling of stent deployment. Proceedings of SPIE–the International Society for Optical Engineering . 2019;10951:109511C. doi: 10.1117/12.2515256. [DOI] [PMC free article] [PubMed] [Google Scholar]
- [72].Gessert N, Lutz M, Heyder M, et al. Automatic plaque detection in IVOCT pullbacks using convolutional neural networks. IEEE Transactions on Medical Imaging . 2018;38:426–434. doi: 10.1109/TMI.2018.2865659. [DOI] [PubMed] [Google Scholar]
- [73].Athanasiou LS, Olender ML, de la Torre Hernandez JM, Ben-Assa E, Edelman ER. In Medical Imaging 2019: Computer-Aided Diagnosis . SPIE; San Diego, United States: 2019. A deep learning approach to classify atherosclerosis using intracoronary optical coherence tomography; pp. 163–170. [DOI] [Google Scholar]
- [74].Lee J, Prabhu D, Kolluru C, Gharaibeh Y, Zimin VN, Bezerra HG, et al. Automated plaque characterization using deep learning on coronary intravascular optical coherence tomographic images. Biomedical Optics Express . 2019;10:6497–6515. doi: 10.1364/BOE.10.006497. [DOI] [PMC free article] [PubMed] [Google Scholar]
- [75].Liu X, Du J, Yang J, Xiong P, Liu J, Lin F. Coronary artery fibrous plaque detection based on multi-scale convolutional neural networks. Journal of Signal Processing Systems . 2020;92:325–333. doi: 10.1007/s11265-019-01501-5. [DOI] [Google Scholar]
- [76].Abdolmanafi A, Cheriet F, Duong L, Ibrahim R, Dahdah N. An automatic diagnostic system of coronary artery lesions in Kawasaki disease using intravascular optical coherence tomography imaging. Journal of Biophotonics . 2020;13:e201900112. doi: 10.1002/jbio.201900112. [DOI] [PubMed] [Google Scholar]
- [77].Baruah V, Zahedivash A, Hoyt T, McElroy A, Vela D, Buja LM, et al. Automated Coronary Plaque Characterization With Intravascular Optical Coherence Tomography and Smart-Algorithm Approach: Virtual Histology OCT. JACC. Cardiovascular Imaging . 2020;13:1848–1850. doi: 10.1016/j.jcmg.2020.02.022. [DOI] [PubMed] [Google Scholar]
- [78].Abdolmanafi A, Duong L, Ibrahim R, Dahdah N. A deep learning-based model for characterization of atherosclerotic plaque in coronary arteries using optical coherence tomography images. Medical Physics . 2021;48:3511–3524. doi: 10.1002/mp.14909. [DOI] [PubMed] [Google Scholar]
- [79].Yin Y, He C, Xu B, Li Z. Coronary Plaque Characterization From Optical Coherence Tomography Imaging With a Two-Pathway Cascade Convolutional Neural Network Architecture. Frontiers in Cardiovascular Medicine . 2021;8:670502. doi: 10.3389/fcvm.2021.670502. [DOI] [PMC free article] [PubMed] [Google Scholar]
- [80].Avital Y, Madar A, Arnon S, Koifman E. Identification of coronary calcifications in optical coherence tomography imaging using deep learning. Scientific Reports . 2021;11:11269. doi: 10.1038/s41598-021-90525-8. [DOI] [PMC free article] [PubMed] [Google Scholar]
- [81].Cheimariotis GA, Riga M, Haris K, Toutouzas K, Katsaggelos AK, Maglaveras N. Automatic classification of A-lines in intravascular OCT images using deep learning and estimation of attenuation coefficients. Applied Sciences . 2021;11:7412. doi: 10.3390/app11167412. [DOI] [Google Scholar]
- [82].Rico-Jimenez JJ, Jo JA. Rapid lipid-laden plaque identification in intravascular optical coherence tomography imaging based on time-series deep learning. Journal of Biomedical Optics . 2022;27:106006. doi: 10.1117/1.JBO.27.10.106006. [DOI] [PMC free article] [PubMed] [Google Scholar]
- [83].Lee J, Kim JN, Pereira GT, Gharaibeh Y, Kolluru C, Zimin VN, et al. In Proceedings of SPIE–the International Society for Optical Engineering . SPIE; San Diego, United States: 2022. Automatic microchannel detection using deep learning in intravascular optical coherence tomography images; p. 120340S. [DOI] [PMC free article] [PubMed] [Google Scholar]
- [84].Shi P, Xin J, Wu J, Deng Y, Cai Z, Du S, et al. Detection of thin-cap fibroatheroma in IVOCT images based on weakly supervised learning and domain knowledge. Journal of Biophotonics . 2023;16:e202200343. doi: 10.1002/jbio.202200343. [DOI] [PubMed] [Google Scholar]
- [85].Tang H, Zhang Z, He Y, Shen J, Zheng J, Gao W, et al. Automatic classification and segmentation of atherosclerotic plaques in the intravascular optical coherence tomography (IVOCT) Biomedical Signal Processing and Control . 2023;85:104888. doi: 10.1016/j.bspc.2023.104888. [DOI] [Google Scholar]
- [86].Wang Z, Shao Y, Sun J, Huang Z, Wang S, Li Q, et al. Vision transformer based multi-class lesion detection in ivoct. In: Greenspan H, Madabhushi A, Mousavi P, Salcudean S, Duncan J, Syeda-Mahmood T, editors. Medical Image Computing and Computer Assisted Intervention – MICCAI 2023. Lecture Notes in Computer Science . Springer Nature Switzerland; Cham: 2023. pp. 327–336. [DOI] [Google Scholar]
- [87].Liu Y, Nezami FR, Edelman ER. A transformer-based pyramid network for coronary calcified plaque segmentation in intravascular optical coherence tomography images. Computerized Medical Imaging and Graphics: the Official Journal of the Computerized Medical Imaging Society . 2024;113:102347. doi: 10.1016/j.compmedimag.2024.102347. [DOI] [PMC free article] [PubMed] [Google Scholar]
- [88].Lee J, Kim JN, Dallan LAP, Zimin VN, Hoori A, Hassani NS, et al. Deep learning segmentation of fibrous cap in intravascular optical coherence tomography images. Scientific Reports . 2024;14:4393. doi: 10.1038/s41598-024-55120-7. [DOI] [PMC free article] [PubMed] [Google Scholar]
- [89].Chu M, De Maria GL, Dai R, Benenati S, Yu W, Zhong J, et al. DCCAT: Dual-Coordinate Cross-Attention Transformer for thrombus segmentation on coronary OCT. Medical Image Analysis . 2024;97:103265. doi: 10.1016/j.media.2024.103265. [DOI] [PubMed] [Google Scholar]
- [90].Chu M, Jia H, Gutiérrez-Chico JL, Maehara A, Ali ZA, Zeng X, et al. Artificial intelligence and optical coherence tomography for the automatic characterisation of human atherosclerotic plaques. EuroIntervention: Journal of EuroPCR in Collaboration with the Working Group on Interventional Cardiology of the European Society of Cardiology . 2021;17:41–50. doi: 10.4244/EIJ-D-20-01355. [DOI] [PMC free article] [PubMed] [Google Scholar]
- [91].Lee J, Kim JN, Gharaibeh Y, Zimin VN, Dallan LAP, Pereira GTR, et al. OCTOPUS - Optical coherence tomography plaque and stent analysis software. Heliyon . 2023;9:e13396. doi: 10.1016/j.heliyon.2023.e13396. [DOI] [PMC free article] [PubMed] [Google Scholar]
- [92].Otsu N. In IEEE Transactions on Systems, Man, and Cybernetics . IEEE; 1979. A Threshold Selection Method from Gray-Level Histograms; pp. 62–66. [Google Scholar]
- [93].Ronneberger O, Fischer P, Brox T. Cham. Springer International Publishing; 2015. U-net: Convolutional networks for biomedical image segmentation. In Medical Image Computing and Computer-assisted Intervention–MICCAI 2015; pp. 234–241. [DOI] [Google Scholar]
- [94].Krizhevsky A, Sutskever I, Hinton GE. ImageNet classification with deep convolutional neural networks. Communications of the ACM . 2017;60:84–90. doi: 10.1145/3065386. [DOI] [Google Scholar]
- [95].Litjens G, Kooi T, Bejnordi BE, Setio AAA, Ciompi F, Ghafoorian M, et al. A survey on deep learning in medical image analysis. Medical Image Analysis . 2017;42:60–88. doi: 10.1016/j.media.2017.07.005. [DOI] [PubMed] [Google Scholar]
- [96].Simonyan K, Zisserman A. Very deep convolutional networks for large-scale image recognition. arXiv . 2014 doi: 10.48550/arXiv.1409.1556. (preprint) [DOI] [Google Scholar]
- [97].Szegedy C, Vanhoucke V, Ioffe S, Shlens J, Wojna Z. Rethinking the inception architecture for computer vision. In Proceedings of the IEEE Conference on Computer Vision and Pattern Recognition . 2016:2818–2826. [Google Scholar]
- [98].Szegedy C, Liu W, Jia Y, Sermanet P, Reed S, Anguelov D, et al. Going Deeper with Convolutions. arXiv . 2014 doi: 10.48550/arXiv.1409.4842. (preprint) [DOI] [Google Scholar]
- [99].He K, Zhang X, Ren S, Sun J. Deep residual learning for image recognition. In Proceedings of the IEEE Conference on Computer Vision and Pattern Recognition . 2016:770–778. [Google Scholar]
- [100].Huang G, Liu Z, Van Der Maaten L, Weinberger KQ. Densely connected convolutional networks. In Proceedings of the IEEE Conference on Computer Vision and Pattern Recognition . 2017:4700–4708. [Google Scholar]
- [101].Badrinarayanan V, Kendall A, Cipolla R. SegNet: A Deep Convolutional Encoder-Decoder Architecture for Image Segmentation. IEEE Transactions on Pattern Analysis and Machine Intelligence . 2017;39:2481–2495. doi: 10.1109/TPAMI.2016.2644615. [DOI] [PubMed] [Google Scholar]
- [102].Xu M, Cheng J, Li A, Lee JA, Wong DWK, Taruya A, et al. Fibroatheroma identification in Intravascular Optical Coherence Tomography images using deep features. Annual International Conference of the IEEE Engineering in Medicine and Biology Society. IEEE Engineering in Medicine and Biology Society. Annual International Conference . 2017;2017:1501–1504. doi: 10.1109/EMBC.2017.8037120. [DOI] [PubMed] [Google Scholar]
- [103].Abdolmanafi A, Duong L, Dahdah N, Adib IR, Cheriet F. Characterization of coronary artery pathological formations from OCT imaging using deep learning. Biomedical Optics Express . 2018;9:4936–4960. doi: 10.1364/BOE.9.004936. [DOI] [PMC free article] [PubMed] [Google Scholar]
- [104].Lee J, Prabhu D, Kolluru C, Gharaibeh Y, Zimin VN, Dallan LAP, et al. Fully automated plaque characterization in intravascular OCT images using hybrid convolutional and lumen morphology features. Scientific Reports . 2020;10:2596. doi: 10.1038/s41598-020-59315-6. [DOI] [PMC free article] [PubMed] [Google Scholar]
- [105].JCS Joint Working Group. Guidelines for diagnosis and management of cardiovascular sequelae in Kawasaki disease (JCS 2013). Digest version. Circulation Journal: Official Journal of the Japanese Circulation Society . 2014;78:2521–2562. doi: 10.1253/circj.cj-66-0096. [DOI] [PubMed] [Google Scholar]
- [106].McCrindle BW, Rowley AH, Newburger JW, Burns JC, Bolger AF, Gewitz M, et al. Diagnosis, Treatment, and Long-Term Management of Kawasaki Disease: A Scientific Statement for Health Professionals From the American Heart Association. Circulation . 2017;135:e927–e999. doi: 10.1161/CIR.0000000000000484. [DOI] [PubMed] [Google Scholar]
- [107].Liu Z, Lin Y, Cao Y, Hu H, Wei Y, Zhang Z, et al. In 2021 IEEE/CVF International Conference on Computer Vision (ICCV) Montreal, QC, Canada. IEEE; 2021. Swin Transformer: Hierarchical Vision Transformer using Shifted Windows; pp. 9992–10002. [Google Scholar]
- [108].Chandramohan N, Hinton J, O’Kane P, Johnson TW. Artificial Intelligence for the Interventional Cardiologist: Powering and Enabling OCT Image Interpretation. Interventional Cardiology (London, England) . 2024;19:e03. doi: 10.15420/icr.2023.13. [DOI] [PMC free article] [PubMed] [Google Scholar]
- [109].Föllmer B, Williams MC, Dey D, Arbab-Zadeh A, Maurovich-Horvat P, Volleberg RHJA, et al. Roadmap on the use of artificial intelligence for imaging of vulnerable atherosclerotic plaque in coronary arteries. Nature Reviews. Cardiology . 2024;21:51–64. doi: 10.1038/s41569-023-00900-3. [DOI] [PubMed] [Google Scholar]
- [110].Abbott MediaRoom. Abbott Receives FDA Clearance for its Imaging Technology Using Artificial Intelligence for Vessels in the Heart. 2024. [(Accessed: 8 May 2024)]. Available at: https://abbott.mediaroom.com/2021-08-03-Abbott-Receives-FDA-Clearance-for-its-Imaging-Technology-Using-Artificial-Intelligence-for-Vessels-in-the-Heart .
- [111].Klüner LV, Chan K, Antoniades C. Using artificial intelligence to study atherosclerosis from computed tomography imaging: A state-of-the-art review of the current literature. Atherosclerosis . 2024;398:117580. doi: 10.1016/j.atherosclerosis.2024.117580. [DOI] [PMC free article] [PubMed] [Google Scholar]
- [112].Lambert SI, Madi M, Sopka S, Lenes A, Stange H, Buszello CP, et al. An integrative review on the acceptance of artificial intelligence among healthcare professionals in hospitals. NPJ Digital Medicine . 2023;6:111. doi: 10.1038/s41746-023-00852-5. [DOI] [PMC free article] [PubMed] [Google Scholar]
- [113].Geirhos R, Jacobsen J H, Michaelis C, Zemel R, Brendel W, Bethge M, et al. Shortcut learning in deep neural networks. Nature Machine Intelligence . 2020;2:665–673. doi: 10.1038/s42256-020-00257-z. [DOI] [Google Scholar]
- [114].Oikonomou EK, Antonopoulos AS, Schottlander D, Marwan M, Mathers C, Tomlins P, et al. Standardized measurement of coronary inflammation using cardiovascular computed tomography: integration in clinical care as a prognostic medical device. Cardiovascular Research . 2021;117:2677–2690. doi: 10.1093/cvr/cvab286. [DOI] [PubMed] [Google Scholar]
- [115].Han J, Wang Z, Chen T, Liu S, Tan J, Sun Y, et al. Artificial intelligence driven plaque characterization and functional assessment from CCTA using OCT-based automation: A prospective study. International Journal of Cardiology . 2025;428:133140. doi: 10.1016/j.ijcard.2025.133140. [DOI] [PubMed] [Google Scholar]
- [116].Araki T, Ikeda N, Shukla D, Jain PK, Londhe ND, Shrivastava VK, et al. PCA-based polling strategy in machine learning framework for coronary artery disease risk assessment in intravascular ultrasound: A link between carotid and coronary grayscale plaque morphology. Computer Methods and Programs in Biomedicine . 2016;128:137–158. doi: 10.1016/j.cmpb.2016.02.004. [DOI] [PubMed] [Google Scholar]