

Abstract
Patients with cirrhosis face an elevated risk of developing sepsis, leading to an escalating mortality rate. This study focuses on the link between natural killer (NK) cells, cirrhosis, and sepsis. Our goal is to identify NK cell-related genes that could serve as common diagnostic biomarkers for both conditions. The datasets pertaining to cirrhosis and sepsis were obtained from the Gene Expression Omnibus database. Initially, a single sample Gene set enrichment analysis (ssGSEA) concentrated on the NK cell gene set. Subsequently, the ssGSEA score was utilized as the phenotype data for the weighted gene co-expression network analysis (WGCNA). Feature genes for cirrhosis and sepsis were selected from a combination of cirrhosis differentially expressed genes (DEGs), sepsis DEGs, and key genes identified by WGCNA and screened using support vector machine-recursive feature elimination (SVM-RFE) and Random Forest machine learning algorithms. To rigorously validate the diagnostic significance of the feature genes, we performed receiver operating characteristic (ROC) curve and decision curve analysis (DCA) across both training and independent validation datasets. Additionally, CIBERSORT was employed to assess the infiltration of immune cells in cirrhosis and sepsis. qRT-PCR was further used to experimentally confirm the mRNA expression levels of candidate genes in peripheral blood samples. Finally, we conducted subtype identification of cirrhosis and sepsis based on the feature genes, and the infiltration of immune cells between subtypes was evaluated. Two genes associated with NK cells, MS4A4A and CD59, serve as biomarkers for diagnosing cirrhosis and sepsis. Additionally, the presence of MS4A4A and CD59 associated immune cells alongside naive B cells and dendritic cells (DCs) decrease, whereas M0 macrophages increases. Based on MS4A4A and CD59, cirrhosis and sepsis each comprise two distinct subtypes. This classification enables clear differentiation of immune cell infiltration patterns across the subtypes. The correlation between liver cirrhosis and sepsis is strongly associated with NK cells. Our multi-level bioinformatic and experimental validations demonstrate that MS4A4A and CD59 are robust diagnostic markers for both diseases, offering valuable insights into the shared immune mechanisms and interactions between cirrhosis and sepsis.
Supplementary Information
The online version contains supplementary material available at 10.1007/s10238-025-01808-7.
Keywords: Cirrhosis, Sepsis, NK cells, Diagnostic markers, Immune infiltration
Introduction
Cirrhosis is a prevalent and chronic disease worldwide, primarily caused by viral hepatitis, alcoholic liver disease, and non-alcoholic steatohepatitis [1]. In advanced stages, fibrosis progresses to cirrhosis, with liver transplantation being the sole effective intervention [2]. Liver fibrosis represents a wound healing response during severe liver injury, during which activated mesenchymal stromal cells (MSCs) and myofibroblasts, specifically hepatic stellate cells (HSCs), produce extracellular matrix proteins, leading to fibrotic scar tissue [3]. In an effort to address this, the use of MSCs has emerged as a promising therapeutic approach to repair liver injury and promote regeneration [2]. Additionally, natural killer (NK) cells play a crucial role in the liver's innate immunity, and have been found to alleviate fibrosis by targeting and killing activated HSCs [4]. Research by Liu et al. revealed a significant reduction in CD8+T cells and NK cells within the immune microenvironment of cirrhosis patients, while CD4+T memory cells were increased [5]. Furthermore, NK cells have been shown to possess anti-fibrotic properties in liver fibrosis (LF) by inhibiting the population of activated HSCs with the E-prostaglandin 3 receptor (EP3) is crucial for NK cell adhesion and cytotoxicity to HSCs [6]. These findings highlight the potential of targeting NK cells as a therapeutic strategy for treating liver fibrosis in cirrhosis.
The process of cirrhosis typically progresses from the asymptomatic stage (compensatory cirrhosis) to the symptomatic stage (decompensated cirrhosis). Bacterial infections are more common and severe in patients with advanced liver disease [7], and sepsis and septic shock are common causes of hospitalization and death in patients with cirrhosis. The mortality rate caused by sepsis in patients with cirrhosis is four times higher [8]. Sepsis is defined as life-threatening organ dysfunction caused by abnormal host response to infection [9]. Respiratory, gastrointestinal, urogenital, skin, and soft tissue infections are the most common sources of sepsis [10]. Research [11] has shown that increasing NK cell activity can promote the alleviation of viral infections, even severe sepsis induced by infection [12]. These findings emphasize the promise of directing efforts towards NK cells as a treatment approach for sepsis.
Sepsis in cirrhotic patients can trigger a severe dysregulation in cytokine responses, referred to as a cytokine storm. This condition alters the typically beneficial immune response, turning it into harmful inflammation. Patients with cirrhosis often face organ failure and increased mortality due to sepsis [13]. Studies indicate that the prognosis for sepsis is particularly grim in individuals with comorbid conditions like cirrhosis, and liver failure significantly increases the mortality risk [14]. Thus, it is crucial to identify diagnostic markers for cirrhosis complicated by sepsis. This research utilized bioinformatics to identify NK cell-related feature genes in cirrhosis and sepsis, employing WGCNA, SVM-RFE, and RandomForest methodologies. We evaluated the diagnostic significance through ROC curves, gene expression analysis, and nomograms. Furthermore, we applied CIBERSORT algorithms to explore the relationship between feature genes and immune infiltration. Ultimately, we categorized cirrhosis and sepsis into two subtypes based on feature genes and assessed the immune cell infiltration across these subtypes.
Methods
Data download
The GSE25097 and GSE14323 microarray datasets on cirrhosis, as well as the GSE26440 and GSE57065 datasets on sepsis, were obtained from the Gene Expression Omnibus (GEO, https://www.ncbi.nlm.nih.gov/geo/) data repository. Each dataset was processed independently without merging. Expression matrices were normalized using the normalize Between Arrays() function from the limma R package with default parameters, which applies quantile normalization to remove technical variations between arrays. The GSE25097 dataset includes 6 normal samples and 40 cirrhosis samples, while the GSE14323 dataset includes 19 normal samples and 41 cirrhosis samples. Additionally, the GSE26440 dataset contains 32 normal samples and 98 sepsis samples, and the GSE57065 dataset contains 25 normal samples and 82 sepsis samples. The GSE14323 and GSE57065 datasets were used as the validation sets for cirrhosis and sepsis, respectively. The feature gene set of natural killer (NK) cells was obtained from a reference source [15].
Weighted gene co-expression network analysis (WGCNA)
The GSVA package was utilized to analyze the cirrhosis dataset GSE25097 and perform single sample Gene set enrichment analysis (ssGSEA) with a specific focus on the NK cell gene set. Subsequently, the ssGSEA score was used as the phenotype data for WGCNA. The one-step network construction function within the WGCNA package was then employed to create a scale-free co-expressed gene network for the cirrhosis data. The soft threshold (β = 10) was determined using the power estimate function and was utilized as the weight value. Subsequently, the weighted adjacency matrix transformed into a topological overlap matrix (TOM) for assessing network connectivity. Hierarchical clustering methods helped in building the clustering tree structure of TOM, allowing for the identification of different gene modules. After generating the modules, those with the strongest correlation between sample phenotype and various modules were selected by Pearson correlation analysis. In the end, module membership (MM) scores and gene significance (GS) within each module were assessed to identify key genes according to |GS|> 0.2 and |MM|> 0.8.
Analysis of differentially expressed genes (DEGs)
Gene differential analysis was performed using the limma package, a stringent threshold of |logFC|> 1 and adjusted P value < 0.05 was applied. Subsequently, heat maps were generated to visualize the expression patterns of DEGs, with the heat map specifically highlighting the top 20 DEGs in terms of |logFC|.
Construction of protein and protein interaction (PPI) network
The candidate genes were identified through the intersection of DEGs in cirrhosis and sepsis, as well as the module genes of WGCNA. A PPI network of these candidate genes (with a confidence level > 0.4) was constructed using the STRING database [16], and then visualized using Cytoscape v3.10.2 [17].
Enrichment analysis
Gene Ontology (GO) [18] and Kyoto Encyclopedia of Genes and Genomes (KEGG) [19] pathway enrichment analysis of the candidate genes was acquired by using the clusterProfile package (P < 0.05). The results were visualized using GOplot and ggplot2 packages. We conducted GO analysis to identify intersecting biological processes (BP), molecular functions (MF), and cellular components (CC) linked to genes. KEGG analysis was conducted to identify the enriched signaling pathways associated with the potential targets.
Screening feature genes based on machine learning
The caret package was utilized to conduct support vector machine-recursive feature elimination (SVM-RFE) analysis. Subsequently, the top 10 genes were selected based on their importance ranking, determined by MeanDecreaseGini following the implementation of the randomForest package for random forest analysis.
Construction of competing endogenous RNA (ceRNA) network
The miRNAs interacting with feature genes were screened using the R package multiMiR. The interaction data between lncRNA and miRNA was downloaded from the Encyclopedia of RNA Interactomes database (ENCORI, https://rnasysu.com/encori/), and lncRNAs with clipExpNum > 10 were selected. All the aforementioned data were then visualized using ggalluvial package.
Receiver operating characteristic (ROC) curves and expression level validation
The R package pROC was used to generate ROC curves for the expression levels of feature genes, encompassing both training and validation sets. Significant differences in expression levels underwent analysis through the Wilcoxon test.
Construction of diagnostic model
To develop a diagnostic model, we employed a multi-faceted analytical approach involving the rms, pROC, and rmda packages. The rms package played a pivotal role in the creation of nomograms and calibration curves, demonstrating the model accuracy and predictive power. The pROC package was instrumental in ROC curves, providing a visual representation of sensitivity versus specificity across various thresholds. Lastly, the rmda package was utilized for Decision Curve Analysis (DCA).
Immune cell infiltration analysis
To assess the infiltration and accumulation of immune cells, we utilized the CIBERSORT algorithm on both case and normal samples via the IOBR package. We analyzed the correlations between differential immune cell types and also between key genes and these immune cells using the ggcorrplot package.
Consensus clustering analysis
To delineate distinct subtypes of cirrhosis and sepsis, we harnessed the sophisticated capabilities of the ConsensusClusterPlus package, leveraging the nuanced expression profiles of feature genes. To ensure the reliability and stability of the clustering results, we employed the Euclidean distance metric for measuring dissimilarity between gene expression profiles and conducted a thorough sampling procedure, iterating the process a rigorous 1,000 times.
qRT-PCR
To detect the expression of key genes predicted by bioinformatics in clinical samples. Gene amplification was performed according to the manufacturer’s instructions (GeniuScript III Select RT Kit for qPCR, U&G Bio). Primer sequences used for quantitative real time PCR (qRT-PCR) were as follows: MS4A4A forward 5’-CTACAAAAGGCCTGGGTCTGG-3’, reverse 5’-CACCAGGGGTACAACAGAGC-3’; CD59 forward 5’-CTGGAAGAGGATCTT GGGCG-3’, reverse 5’-GACGGCTGTTTTGCAGTCAG-3’; GAPDH forward 5’-ACATCGCTCAGACACCATG-3’, reverse 5’- TGTAGTTGAGGTCAATGAAGGG-3’. Gene expression levels were quantified as relative fold changes, normalized against GAPDH expression.
Results
Screening key module genes in the dataset through weighted gene co-expression network analysis (WGCNA)
To examine the relationship between cirrhosis and natural killer (NK) cells, we conducted single sample Gene set enrichment analysis (ssGSEA) scoring using the NK cell gene set on GSE25097 dataset (Fig. 1A). The analysis indicated that cirrhosis samples had elevated scores relative to normal samples, highlighting a significant association between cirrhosis and NK cells. To identify the key genes related to cirrhosis and NK cells, we executed WGCNA (Fig. 1B–F). This approach focused on detecting gene modules that exhibited the closest correlation with NK cells in cirrhosis samples. To assess data quality, we constructed a systematic clustering tree using samples from the GSE25097 dataset (Fig. 1B). The absence of outliers pointed to effective clustering and suggested that there is no need to remove any samples. Then, based on the principles of scale independence and mean connectivity, a soft-thresholding power of 10 was selected (Fig. 1C). Subsequently, 8 modules were identified based on the average adjacency and dissimilarity coefficients among genes, along with dynamic tree clipping (Fig. 1D). The brown module showed a highly positive correlation with ssGSEA scores (Fig. 1E). Thus, it was identified as a crucial module linked to NK cells for further analysis. Moreover, 509 genes with GS > 0.2 and MM > 0.8 were selected as key genes for the brown module, and we found a strong association between module membership and gene significance in the brown module (r = 0.91, p < 1e − 200) (Fig. 1F, Supplementary Table 1).
Fig. 1.

WGCNA of the cirrhosis dataset GSE25097. A Comparison of ssGSEA score between cirrhosis and normal control, green represents normal samples and red represent cirrhosis samples. B The cluster dendrogram presents clustering effect of dataset GSE25097. C Scale independence and mean connectivity are functions of soft threshold power, the higher the scale-free topological fitting index R^2, the closer the network is to the scale-free distribution, and β = 10 was selected as the soft threshold based on mean connectivity and scale independence. D The weighted gene co-expression network, which utilizes adjacency and dissimilarity coefficients among genes, employs a dynamic pruning technique (at a pruning height of 0.25) to partition the tree into distinct modules (each containing at least 300 genes). Each color signifies a specific co-expression module. E The correlation between gene modules and ssGSEA scores, red represents positive correlation and bule represents negative correlation. F MM-GS analysis of brown module. GS represents the correlation between all gene expression profiles and the features of this module, while MM represents the absolute value of the correlation between genes and phenotypic traits. Genes with GS > 0.2 and MM > 0.8 were selected as key genes for the brown module
Identification of candidate genes and their functional enrichment
We used GSE26440 microarray dataset, which includes 32 normal samples and 98 sepsis samples (Fig. 2A), along with the GSE25097 dataset, comprising 6 normal samples and 40 cirrhosis samples (Fig. 2B), to identify the differentially expressed genes (DEGs) (Supplementary Table 2, 3). Candidate genes were defined as the overlapping genes among cirrhosis DEGs (1963 genes), sepsis DEGs (1684 genes), and key genes (509 genes) identified by WGCNA (Fig. 2C, Supplementary Table 4). This process yielded 60 candidate genes. The protein and protein interaction (PPI) network, comprising 46 nodes and 197 edges (Fig. 2E), demonstrated that the candidate genes exhibit significant interactions at the protein level. To examine the biological pathways linked to candidate genes, we conducted KEGG enrichment analysis. The analysis frequently identified pathways related to coronavirus disease-COVID-19, complement and coagulation cascades, and Staphylococcus aureus infection etc. in the KEGG enrichment outcomes (Fig. 2D). On the other hand, to examine the biological functions linked to potential genes, we conducted GO enrichment analysis. The GO enrichment analysis yielded 166 outcomes, comprising 134 biological processes (BP), 25 cellular components (CC), and 7 molecular functions (MF). Significantly, we observed strong enrichment in immune response activation, and leukocyte-mediated immunity, among others (Fig. 2F).
Fig. 2.

Identification, PPI analysis and functional enrichment of candidate genes. A Top 20 DEGs in cirrhosis database GSE25097. B Top 20 DEGs in sepsis database GSE26440, the left part represents normal samples, the right part represents case samples, yellow represents upregulation and bule represents downregulation. C UpSetR plots illustrates the quantity of overlapping genes among cirrhosis DEGs, sepsis DEGs, and key genes identified by WGCNA. D KEGG enrichment analysis for 60 candidate genes. The size of the bubbles corresponds to the number of candidate genes, where a larger circle signifies a greater quantity of genes. The color indicates the p value, with a deeper red representing a smaller p value. E Interaction map of 60 candidate genes PPI network. F GO enrichment analysis of 60 candidate genes, yellow bar indicates biological process (BP), bule bar denotes cellular component (CC) and green bar signifies molecular function (MF)
Selection of diagnostic biomarkers from candidate genes for cirrhosis and sepsis
We employed two machine learning algorithms to enhance the accuracy of diagnostic biomarkers for cirrhosis and sepsis derived from candidate genes. Initially, we identified 11 predictive genes for cirrhosis (Fig. 3A) and 52 predictive genes for sepsis (Fig. 3D) using the support vector machine-recursive feature elimination (SVM-RFE) method. Subsequently, we applied the RandomForest algorithm to assess the correlation between the error rate and the number of trees (Fig. 3B, ), resulting in a ranking of the top 10 genes according to MeanDecreaseGini (Fig. 3C, ). We then intersected the feature genes selected by the RandomForest with those from the SVM-RFE analysis, uncovering 7 feature genes for cirrhosis: IGSF6, MS4A4A, RAB32, GZMA, RPS7, RAB10, and CD59 (Fig. 3G, Supplementary Table 5), and 8 feature genes for sepsis: GYG1, CARD6, TSPO, CD59, LHFPL2, SH3GLB1, MS4A4A, and CST7 (Fig. 3H, Supplementary Table 6). Ultimately, common feature genes referred to the shared genes found within the feature sets for cirrhosis and sepsisc (Fig. 3I). This analysis revealed 2 feature genes: MS4A4A and CD59 (Supplementary Table 7). Additionally, we established the ceRNA network involving MS4A4A and CD59, which comprises 102 interactions, including 35 miRNAs, and 13 lncRNAs (Fig. 3J).
Fig. 3.

Selection of feature genes from candidate genes for cirrhosis and sepsis. A Cirrhosis features gene expression validated through SVM-RFE selection. B The RandomForest residual distribution chart for cirrhosis. The X-axis represents the number of trees, and the Y-axis represents the error rate. C RandomForest feature importance visualization for the candidate genes associated with cirrhosis. D Sepsis features gene expression validated through SVM-RFE selection. E The RandomForest residual distribution chart for sepsis. The X-axis represents the number of trees, and the Y-axis represents the error rate. F RandomForest feature importance visualization for the candidate genes associated with sepsis. The Venn diagram illustrates 7 common genes associated with cirrhosis, which are shared by both SVM-RFE and Random Forest methodologies. H The Venn diagram illustrates 8 common genes associated with sepsis, which are shared by both SVM-RFE and Random Forest methodologies. I UpSetR plots demonstrate the number of distinct and shared genes between the feature genes associated with cirrhosis and sepsis. J The ceRNA network includes two feature genes, MS4A4A and CD59, the ellipse symbolizes mRNA, the V-shape denotes miRNA, and the rhombus represents lncRNA
Diagnostic significance and expression profile of feature genes related to cirrhosis and sepsis
To comprehensively validate the diagnostic reliability of MS4A4A and CD59, we conducted multi-level assessments across independent datasets and analytical methods. In the cirrhosis training dataset GSE25097, the area under the curve (AUC) values for MS4A4A and CD59 were 1 and 0.988, respectively (Fig. 4A). Meanwhile, in the cirrhosis validation dataset GSE51588, the AUC values for MS4A4A and CD59 were 0.897 and 1, respectively (Fig. 4C). The consistent elevation of gene expression across both datasets was confirmed by Wilcoxon test, demonstrating statistical significance and reproducibility (Fig. 4B, D). In the sepsis datasets, similar diagnostic trends were observed. In both the training set GSE26440 and the external validation cohort GSE57065, MS4A4A and CD59 exhibited AUC values greater than 0.9, indicating excellent diagnostic utility (Fig. 4E, ). Moreover, the mRNA expression levels in the cases notably surpassed those in the control group (Fig. 4F, ). Together, these cross-validation results, involving multiple datasets, statistical comparisons, and ROC-based performance metrics, confirmed the robustness, consistency, and generalizability of MS4A4A and CD59 as diagnostic biomarkers in both diseases.
Fig. 4.

Diagnostic value and expression pattern of the feature genes for cirrhosis and sepsis. A ROC curve analysis of MS4A4A and CD59 for cirrhosis diagnosis in training set GSE25097. B Comparative expression levels of MS4A4A and CD59 in cirrhosis samples versus normal controls in training set GSE25097. C ROC curve analysis of MS4A4A and CD59 for cirrhosis diagnosis in validation set GSE14323. D Comparative expression levels of MS4A4A and CD59 in cirrhosis samples versus normal controls in validation set GSE14323. E ROC curve analysis of MS4A4A and CD59 for sepsis diagnosis in training set GSE26440. F Comparative expression levels of MS4A4A and CD59 in cirrhosis samples versus normal controls in training set GSE26440. G ROC curve analysis of MS4A4A and CD59 for cirrhosis diagnosis in validation set GSE57065. H Comparative expression levels of MS4A4A and CD59 in cirrhosis samples versus normal controls in validation set GSE57065. P values: ***P < 0.001, ****P < 0.0001
Prognostic model for feature genes associated with cirrhosis and sepsis
To assess the risk of cirrhosis and sepsis in patients, we developed diagnostic nomograms utilizing the two feature genes, MS4A4A and CD59 (Fig. 5A, ). The AUC for the cirrhosis nomogram reached 1, outperforming CD59 (Fig. 5B). In a similar vein, the sepsis nomogram achieved an AUC value of 0.953, surpassing MS4A4A and CD59 (Fig. 5F). These findings indicate that combining the two genes yields greater diagnostic efficacy than using either gene alone. To verify the diagnostic applicability for cirrhosis and sepsis, we created calibration curves for both cirrhosis (Fig. 5C) and sepsis (Fig. 5G), with p values exceeding 0.05, signifying strong model calibration. The near alignment of the predicted probabilities with actual outcomes suggests reliable estimation of disease risk. Additionally, we conducted decision curve analysis (DCA) for cirrhosis (Fig. 5D) and sepsis (Fig. 5H). Within the 0–0.7 thresholds, the net benefit of the nomograms exceeded the all and none lines, demonstrating their practical significance. These validations across ROC, calibration, and DCA analyses together confirm the stability, accuracy, and potential real-world applicability of the diagnostic models.
Fig. 5.

Predictive model for feature genes associated with cirrhosis and sepsis. A Nomogram for cirrhosis was created using MS4A4A and CD59. B ROC curve of MS4A4A, CD59, and the cirrhosis nomogram. C Calibration curve for cirrhosis, nomogram-predicted disease risk on the X-axis and actual disease proportion on the Y-axis. A line closer to the ideal dashed line reflects greater reliability in predictions. D DCA curve of MS4A4A, CD59, and cirrhosis nomogram, a greater distance from the grey line signifies improved accuracy. E Nomogram for sepsis was created using MS4A4A and CD59. F ROC curve of MS4A4A, CD59, and the sepsis nomogram. G Calibration curve for sepsis, nomogram-predicted disease risk on the X-axis and actual disease proportion on the Y-axis. A line that approaches the ideal dashed line denotes greater predictive reliability. H DCA curve of MS4A4A, CD59, and sepsis nomogram, a larger distance from the grey line corresponds to enhanced accuracy
Immune cells infiltration and its correlation with feature genes in cirrhosis and sepsis
The infiltration of immune cells within the immune microenvironment plays a vital role in diagnosing and treating cirrhosis and sepsis. We employed the CIBERSORT algorithm to assess the immune cell infiltration in cirrhosis, sepsis, and normal samples (Fig. 6A), Subsequently, we compared the variations in these immune cells between cirrhosis and normal samples, revealing significant differences in six immune cell types: follicular helper T cells, gamma delta T cells, resting NK cells, M0 macrophages, M1 macrophages, and activated dendritic cells (Fig. 6B). To determine the correlation among immune cells, we applied Spearman's correlation to analyze the differences between differentially infiltrated immune cells in cirrhotic (Fig. 6C). Furthermore, we investigated the correlation between feature genes MS4A4A, CD59, and immune cells by utilizing Spearman's analysis. The findings showed that MS4A4A and CD59 exhibited a significant negative correlation with activated dendritic cells and resting NK cells, and a significant positive correlation with CD8 T cells and CD4 memory activated T cells (Fig. 6D). Results with |correlation|> 0.3 and p < 0.05 were deemed statistically significant.
Fig. 6.

The CIBERSORT algorithm assessed immune cell infiltration in cirrhosis and sepsis. A Relative abundance of 22 immune cell types in cirrhosis and normal samples. B Infiltration of 22 immune cells between cirrhosis and normal controls. C Correlation matrix showing 6 differentially infiltrated immune cells in cirrhosis. D Correlation between MS4A4A and CD59 regarding immune cell infiltration in cirrhosis. E Relative abundance of 22 immune cells in sepsis and normal samples. F Comparison of immune cell infiltration between sepsis and normal controls followed. G Correlation matrix of 14 differentially infiltrated immune cells in sepsis. H Correlation of MS4A4A and CD59 with immune cell infiltration in sepsis. In B and F, a green indicates normal samples and an orange indicates sepsis samples. In C, D, G, and H, a red represents positive correlation and a blue represents negative correlation P values: ns, not significant, *P < 0.05, **P < 0.01, ***P < 0.001, ****P < 0.0001
Meanwhile, we compared 22 immune cell types between sepsis and control groups. Our analysis indicated notable differences across 14 immune cell types (Fig. 6F). To assess the relationships among these immune cells, we utilized Spearman’s method (Fig. 6G). The results showed that MS4A4A and CD59 had a significant positive correlation with monocytes, M0 macrophages, activated Mast cells, and neutrophils (Fig. 6H), while exhibiting a negative correlation with naive B cells, CD8 T cells, CD4 memory activated T cells, follicular helper T cells, gamma delta T cells, resting Dendritic cells, and resting Mast cells. We considered results significant when |correlation| was greater than 0.3 and p values were below 0.05.
Consensus clustering based on feature genes for cirrhosis and sepsis
To explore the relationship between MS4A4A and CD59 alongside immune infiltration in cirrhosis and sepsis, we performed consensus clustering analysis utilizing MS4A4A and CD59. This analysis aimed to identify the distinct subtypes of cirrhosis and sepsis (Fig. 7A–F). The consensus matrix heatmap of GSE25097 and GSE26440 microarray samples at k = 2 reveals a distinct separation into two clusters (Fig. 7A, D). Therefore, k = 2 is identified as the optimal parameter for consensus clustering. The cirrhosis patients in GSE25097 were categorized into cluster 1 and cluster 2 (Fig. 7A–C). Similarly, the sepsis patients in GSE25097 were also classified into cluster 1 and cluster 2 (Fig. 7D–F). This meticulous methodology not only facilitated the identification of meaningful subtypes but also provided a solid foundation for further in-depth analysis. We employed the GSE26440 microarray dataset alongside the GSE25097 dataset to pinpoint the DEGs according to the two aforementioned clusters (Fig. 7G, I). Then, we utilized the CIBERSORT algorithm to evaluate the infiltration of 22 immune cell types in cluster 1 and cluster 2 samples within cirrhosis and sepsis (Fig. 7H, J). Our findings demonstrated significant variations across 9 immune cell types in cirrhosis. Naive B cells, resting memory CD4 T cells, activated memory CD4 T cells, activated dendritic cells, and activated mast cells exhibited high infiltration levels in cluster 1. In contrast, memory B cells, CD8 T cells, M0 macrophages, and neutrophils showed low infiltration levels in cluster 1 (Fig. 7H). Additionally, M2 macrophages demonstrated high infiltration levels in cluster 1, whereas activated dendritic cells and activated mast cells had low infiltration levels in cluster 1 (Fig. 7J).
Fig. 7.

Consensus clustering and immune Infiltration based on feature genes for cirrhosis and sepsis. Consensus matrix heatmap of A GSE25097 and D GSE26440 microarray samples at k = 2 shows a clear division into two clusters. Consensus cumulative distribution function (CDF) curve of B cirrhosis and E sepsis. Delta area plot reflecting the relative changes in the area under the CDF curve of C cirrhosis F sepsis, with k ranging from 2 to 10. G Top 20 DEGs between cluseter1 and cluster2 of cirrhosis subtypes. H Comparison of immune cell infiltration between cluseter1 and cluster2 of cirrhosis subtypes, with green for cluster1 and orange for cluster2. I Top 20 DEGs between cluseter1 and cluster2 of sepsis subtypes. J Comparison of immune cell infiltration between cluseter1 and cluster2 of sepsis subtypes, with green for cluster1 and orange for cluster2. P values: ns, not significant, *P < 0.05, **P < 0.01
Validation of MS4A4A and CD59 expression in the peripheral blood of patients suffering from cirrhosis and sepsis
To assess the expression levels of the feature genes MS4A4A and CD59 in individuals diagnosed with cirrhosis and sepsis, we performed RT-qPCR analyses on peripheral blood samples obtained from both healthy individuals and those with cirrhosis, as well as from healthy individuals and those with sepsis. All experiments were conducted in triplicate using standardized kits to ensure reproducibility. The findings revealed that, in comparison to normal samples, the expression levels of MS4A4A and CD59 were significantly elevated in the patients suffering from cirrhosis (Fig. 8A) and sepsis (Fig. 8B). Statistical analysis using the Wilcoxon rank-sum test confirmed the significance of these differences (P < 0.05). This observation aligns with our bioinformatics analysis results, suggesting that MS4A4A and CD59 may serve as viable diagnostic biomarkers for cirrhosis and sepsis. The consistency between in silico predictions and experimental validations adds a crucial layer of confidence to the diagnostic relevance of these genes.
Fig. 8.
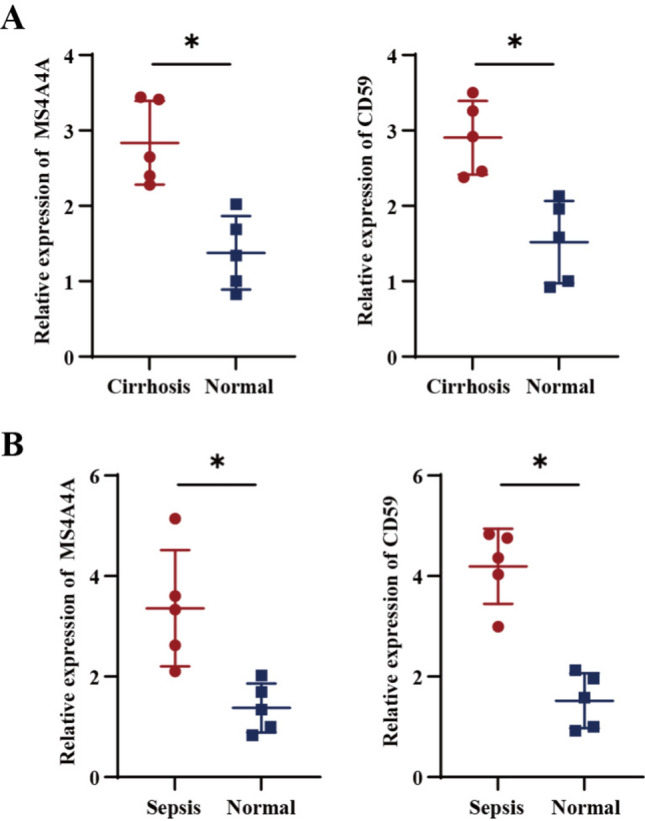
Validation of RT-qPCR in human peripheral blood. A Comparative mRNA expression levels of MS4A4A and CD59 in peripheral blood of normal and cirrhosis patients (n = 5). B Comparative mRNA expression levels of MS4A4A and CD59 in peripheral blood of normal and sepsis patients (n = 5). P values: *P < 0.05
Discussion
Cirrhosis develops as a result of long-term inflammation in the liver, leading to the replacement of healthy liver tissue with fibrotic tissue and regenerating nodules [20]. This condition makes cirrhotic patients more vulnerable to infections, which often result in complications and higher mortality rates, ranging from 18 to 60% [13]. The risk of sepsis in cirrhotic patients is significantly higher compared to the general population, with a 2.6-fold increase in comparison to those without underlying liver disease. In contrast, sepsis frequently correlates with the development of additional complications associated with cirrhosis [21]. Furthermore, these infections commonly serve as a significant factor in the readmission rates for cirrhosis patients. The mortality rate of sepsis in cirrhotic patients is approximately 38%, and this rate can climb to as high as 70% if sepsis progresses to septic shock [22]. Procalcitonin has been identified as a valuable biomarker for detecting infections in cirrhotic patients [13]. Additionally, Fischer et al. have shown that Preepsin and resistin exhibit certain diagnostic performance for bacterial infections in decompensated cirrhosis [23]. Consequently, early identification of infection through the use of procalcitonin tests and other biomarkers such as presepsin and resistin may help reduce sepsis-related mortality in cirrhotic patients. Furthermore, continued research into new methods and strategies is crucial for improving diagnosis and treatment of sepsis in liver cirrhosis.
The KEGG analysis results indicate a strong correlation between coronavirus disease-COVID-19, complement and coagulation cascades, and Staphylococcus aureus infection with cirrhosis and sepsis. A study conducted by Johnson et al. examined the risk factors and outcomes of sepsis/bacteremia in patients admitted with cirrhosis. Out of 103,165 hospitalized cirrhosis patients, 3951 experienced sepsis/bacteremia, and the most common pathogens identified were Escherichia coli and Staphylococcus aureus [24]. The results of the GO analysis indicate that candidate genes are closely connected to the activation of immune responses and leukocyte-mediated immunity. There are already numerous immune-related drugs being utilized for the treatment of cirrhosis and sepsis. The emergence of itaconate as a crucial immune metabolite has demonstrated multiple roles in immunity and inflammation. Itaconate and their derivatives have been shown to have anti-inflammatory effects in preclinical models, such as sepsis and viral infections [25]. The complete innate and adaptive immune response relies on albumin, and low serum albumin levels have been linked to inadequate antimicrobial therapy. Administering human albumin solution (HAS) to patients with cirrhosis can supplement endogenous albumin and effectively support antibacterial therapy, as evidenced in randomized controlled trials [26]. Albumin is widely utilized for fluid resuscitation in sepsis and critical illness [27].
Given the significant connection between NK cells and the development of cirrhosis and sepsis, this study utilized NK cell-related genes MS4A4A and CD59 as diagnostic markers for sepsis in liver cirrhosis, showing high diagnostic efficacy. MS4A4A encodes a member of the membrane-spanning 4A gene family [28], a four-crossing molecule selectively expressed in macrophages during differentiation and polarization, and is crucial for dectin-1-dependent activation of NK cell-mediated metastatic resistance [29]. Previous studies have suggested that MS4A4A may serve as a diagnostic gene for sepsis [30, 31]. These findings support our prediction that the NK cell-related gene MS4A4A could be a promising target for sepsis diagnosis and treatment. CD59 encodes a cell surface glycoprotein that regulates complement-mediated cell lysis and is involved in lymphocyte signal transduction [32]. This protein is a potent inhibitor of the complement membrane attack complex [33]. CD55 and CD59 are crucial for inducing complement dependent cytotoxic (CDC). It is worth noting that the expression of CD55 and CD59 is significantly increased in the late stage of natural killer T-cell lymphoma (NKTL) [34]. Nakamura et al. found that complement activation is considered one of the main causes of multiple organ dysfunction syndrome (MODS) in sepsis and trauma patients. Soluble CD59 may be an effective biomarker for measuring the severity of heat-related diseases [35]. Batudeligen et al. demonstrated that CCR1, CD59, and NAGA can promote liver fibrosis [36]. These results bolster our hypothesis that the NK cell-related gene CD59 presents a viable target for cirrhosis and sepsis diagnosis and treatment.
The study’s findings suggest that there is a decrease in naive B cells and an increase in M0 macrophage infiltration in cases of cirrhosis and sepsis associated with CD59. There is also a reduction in activated Dendritic cells (DCs) infiltration associated with MS4A4A in cases of cirrhosis and sepsis. Bai et al. found in HBV-related cirrhosis, there is a significant accumulation of mature B cells and a decrease in naive B cells [37]. On the other hand, Yang et al. observed a reduction in CD8 T cells, naive B cells, and resting dendritic cell subtypes in patients with sepsis [38]. In addition, Ramachandran et al. have identified a subpopulation of TREM2CD9 macrophages that are linked to scar formation and are known to proliferate during liver fibrosis. These macrophages differentiate from circulating monocytes and demonstrate pro-fibrotic properties [39]. In addition, Yang et al. have determined that fibroblast activation protein can activate macrophages, leading to liver parenchymal inflammation and fibrosis [40], potentially explaining the increased immune infiltration of M0 macrophages in liver cirrhosis samples. Furthermore, Gauthier et al. have discovered that TGF-β-induced macrophage glycolysis enhancement reduces the survival rate in septic mice, while Yuan et al. have shown that KLF14 can reduce macrophage glycolysis and the secretion of inflammatory cytokines by inhibiting the transcription of HK2, thereby preventing the occurrence of sepsis [41]. Xiang et al. discovered that DCs are pivotal regulatory factors in the pathological inflammatory environment of liver fibrosis (LF). Their study further revealed that kinsenoside can effectively inhibit dendritic cells through the PI3K-AKT-FoxO1 pathway, ultimately leading to a reduction in liver fibrosis-related inflammation [42]. In addition, DCs are known to play a critical role in the development of immune dysfunction during sepsis. Multiple strategies have been developed and successfully employed to ameliorate abnormal immune responses in sepsis, such as modulating DCs function and preventing DCs death [43]. Taken together, these findings highlight the crucial role of naive B cells reduction and macrophage activation in cirrhosis and sepsis, and suggest that controlling abnormal naive B cells and DCs reduction and macrophages activation could be a promising strategy for the treatment of these conditions.
Consensus clustering analysis has classified the cirrhosis and sepsis samples into two distinct subtypes using. This approach allows us to differentiate the immune cell infiltration patterns between the subtypes clearly. The differentiation outcomes align with previous findings. For instance, in the liver cirrhosis sample cluster 1, we observe significant infiltration of naive B cells, whereas M0 macrophages are less abundant. Additionally, the abundance of dendritic cells (DCs) remains relatively low in cluster 1 of the sepsis samples.
In conclusion, this study represents the inaugural use of NK cell-related genes in diagnosing sepsis in cirrhosis patients. It aims to enhance diagnostic accuracy for those with cirrhosis experiencing sepsis. Our findings indicate a correlation between NK cell-related genes MS4A4A and CD59 with cirrhosis and sepsis. These genes may have significant implications for managing and monitoring these patients. Nonetheless, this study has several limitations. Firstly, the diagnostic biomarkers we identified require further functional validation and experimental verification of their immunological relevance. Secondly, extensive prospective studies are necessary to validate these findings before they can be reliably applied in clinical practice.
Supplementary Information
Below is the link to the electronic supplementary material.
Author contributions
WYH and WXX contributed to the study design. WXX conducted the literature search and acquired the data. WYH performed data analysis. WYH and WXX drafted. WYH was a major contributor in writing the manuscript. All authors read and approved the final manuscript.
Funding
This study was supported in part by grants from Jinhua Science and Technology Bureau Key Project " the risk of decompensated sepsis in cirrhosis was predicted based on ascites mNGS and the correlation between antibiotic timing and prognosis was evaluated " (2023-3-124). The funders did not participate in the designing, performing or reporting in the current study.
Data availability
The data and materials in the current study are available from the corresponding author on reasonable request
Declarations
Conflict of interest
The authors declare no competing interests.
Ethical approval
This study was conducted in accordance with the Helsinki Declaration II and was approved by the Medical Ethics Committee of Jinhua People's Hospital.
Footnotes
Publisher's Note
Springer Nature remains neutral with regard to jurisdictional claims in published maps and institutional affiliations.
References
- 1.Devarbhavi H, Asrani SK, Arab JP, et al. Global burden of liver disease: 2023 update. J Hepatol. 2023;79:516–37. [DOI] [PubMed] [Google Scholar]
- 2.Yao L, Hu X, Dai K, et al. Mesenchymal stromal cells: promising treatment for liver cirrhosis. Stem Cell Res Ther. 2022;13: 308. [DOI] [PMC free article] [PubMed] [Google Scholar]
- 3.Kisseleva T, Brenner D. Molecular and cellular mechanisms of liver fibrosis and its regression. Nat Rev Gastroenterol Hepatol. 2021;18:151–66. [DOI] [PubMed] [Google Scholar]
- 4.Zhang Y, Wu Y, Shen W, et al. Crosstalk between NK cells and hepatic stellate cells in liver fibrosis (review). Mol Med Rep. 2022. 10.3892/mmr.2022.12724. [DOI] [PMC free article] [PubMed] [Google Scholar]
- 5.Liu Y, Dong Y, Wu X, et al. Identification of immune microenvironment changes and the expression of immune-related genes in liver cirrhosis. Front Immunol. 2022;13: 918445. [DOI] [PMC free article] [PubMed] [Google Scholar]
- 6.Tao X, Zhang R, Du R, et al. EP3 enhances adhesion and cytotoxicity of NK cells toward hepatic stellate cells in a murine liver fibrosis model. J Exp Med. 2022. 10.1084/jem.20212414. [DOI] [PMC free article] [PubMed] [Google Scholar]
- 7.Ferguson Toll J, Solà E, Perez MA, et al. Infections in decompensated cirrhosis: Pathophysiology, management, and research agenda. Hepatol Commun. 2024;8:E0539. [DOI] [PMC free article] [PubMed] [Google Scholar]
- 8.Kim TS, Choi DH. Liver dysfunction in sepsis. Korean J Gastroenterol. 2020;75:182–7. [DOI] [PubMed] [Google Scholar]
- 9.Srzić I, Nesek Adam V, Tunjić Pejak D. Sepsis definition: what’s new in the treatment guidelines. Acta Clin Croat. 2022;61:67–72. [DOI] [PMC free article] [PubMed] [Google Scholar]
- 10.Gauer R, Forbes D, Boyer N. Sepsis: diagnosis and management. Am Fam Physician. 2020;101:409–18. [PubMed] [Google Scholar]
- 11.Ma L, Li Q, Cai S, et al. The role of NK cells in fighting the virus infection and sepsis. Int J Med Sci. 2021;18:3236–48. [DOI] [PMC free article] [PubMed] [Google Scholar]
- 12.Hu Z, Dong D, Peng F, et al. Combination of NK and other immune markers at early phase stratify the risk of sepsis patients: a retrospective study. J Inflamm Res. 2023;16:4725–32. [DOI] [PMC free article] [PubMed] [Google Scholar]
- 13.Ndomba N, Soldera J. Management of sepsis in a cirrhotic patient admitted to the intensive care unit: a systematic literature review. World J Hepatol. 2023;15:850–66. [DOI] [PMC free article] [PubMed] [Google Scholar]
- 14.Wang T, Wang D, Shi R, et al. Relationship between coagulopathy score and survival in critically ill patients with liver cirrhosis and sepsis: a retrospective study. BMC Infect Dis. 2025;25:418. [DOI] [PMC free article] [PubMed] [Google Scholar]
- 15.Chi H, Xie X, Yan Y, et al. Natural killer cell-related prognosis signature characterizes immune landscape and predicts prognosis of HNSCC. Front Immunol. 2022;13: 1018685. [DOI] [PMC free article] [PubMed] [Google Scholar]
- 16.Szklarczyk D, Kirsch R, Koutrouli M, et al. The STRING database in 2023: protein-protein association networks and functional enrichment analyses for any sequenced genome of interest. Nucleic Acids Res. 2023;51:D638-d646. [DOI] [PMC free article] [PubMed] [Google Scholar]
- 17.Shannon P, Markiel A, Ozier O, et al. Cytoscape: a software environment for integrated models of biomolecular interaction networks. Genome Res. 2003;13:2498–504. [DOI] [PMC free article] [PubMed] [Google Scholar]
- 18.Resource TGO. 20 years and still GOING strong. Nucleic Acids Res. 2019;47:D330-d338. [DOI] [PMC free article] [PubMed] [Google Scholar]
- 19.Kanehisa M, Furumichi M, Sato Y, et al. KEGG for taxonomy-based analysis of pathways and genomes. Nucleic Acids Res. 2023;51:D587-d592. [DOI] [PMC free article] [PubMed] [Google Scholar]
- 20.Roehlen N, Crouchet E, Baumert TF. Liver fibrosis: mechanistic concepts and therapeutic perspectives. Cells. 2020;9:875. [DOI] [PMC free article] [PubMed] [Google Scholar]
- 21.Ginès P, Krag A, Abraldes JG, et al. Liver cirrhosis. Lancet. 2021;398:1359–76. [DOI] [PubMed] [Google Scholar]
- 22.Singer M, Deutschman CS, Seymour CW, et al. The third international consensus definitions for sepsis and septic shock (Sepsis-3). JAMA. 2016;315:801–10. [DOI] [PMC free article] [PubMed] [Google Scholar]
- 23.Fischer P, Grigoras C, Bugariu A, et al. Are presepsin and resistin better markers for bacterial infection in patients with decompensated liver cirrhosis? Dig Liver Dis. 2019;51:1685–91. [DOI] [PubMed] [Google Scholar]
- 24.Johnson AL, Ratnasekera IU, Irvine KM, et al. Bacteraemia, sepsis and antibiotic resistance in Australian patients with cirrhosis: a population-based study. BMJ Open Gastroenterol. 2021. 10.1136/bmjgast-2021-000695. [DOI] [PMC free article] [PubMed] [Google Scholar]
- 25.Peace CG, O’Neill LA. The role of itaconate in host defense and inflammation. J Clin Invest. 2022;132: 148548. [DOI] [PMC free article] [PubMed] [Google Scholar]
- 26.Wiedermann CJ. Hypoalbuminemia as surrogate and culprit of infections. Int J Mol Sci. 2021. 10.3390/ijms22094496. [DOI] [PMC free article] [PubMed] [Google Scholar]
- 27.Pompili E, Zaccherini G, Baldassarre M, et al. Albumin administration in internal medicine: a journey between effectiveness and futility. Eur J Intern Med. 2023;117:28–37. [DOI] [PubMed] [Google Scholar]
- 28.Arthur GK, Ehrhardt-Humbert LC, Snider DB, et al. The FcεRIβ homologue, MS4A4A, promotes FcεRI signal transduction and store-operated Ca(2+) entry in human mast cells. Cell Signal. 2020;71: 109617. [DOI] [PMC free article] [PubMed] [Google Scholar]
- 29.Mattiola I, Tomay F, De Pizzol M, et al. The macrophage tetraspan MS4A4A enhances dectin-1-dependent NK cell-mediated resistance to metastasis. Nat Immunol. 2019;20:1012–22. [DOI] [PMC free article] [PubMed] [Google Scholar]
- 30.Lu J, Li Q, Wu Z, et al. Two gene set variation indexes as potential diagnostic tool for sepsis. Am J Transl Res. 2020;12:2749–59. [PMC free article] [PubMed] [Google Scholar]
- 31.Xiao Y, Zhang G. Predictive value of a diagnostic five-gene biomarker for pediatric sepsis. J Inflamm Res. 2024;17:2063–71. [DOI] [PMC free article] [PubMed] [Google Scholar]
- 32.Tang J, Zhao Z, Zhou J, et al. Multiple CD59 polymorphisms in chinese patients with mycobacterium tuberculosis infection. J Immunol Res. 2023;2023:1216048. [DOI] [PMC free article] [PubMed] [Google Scholar]
- 33.Golay J, Taylor RP. The role of complement in the mechanism of action of therapeutic anti-cancer mAbs. Antibodies. 2020. 10.3390/antib9040058. [DOI] [PMC free article] [PubMed] [Google Scholar]
- 34.Mustafa N, Nee AHF, Chooi JY, et al. Determinants of response to daratumumab in Epstein-Barr virus-positive natural killer and T-cell lymphoma. J Immunother Cancer. 2021;9: e002123. [DOI] [PMC free article] [PubMed] [Google Scholar]
- 35.Nakamura Y, Sueyoshi K, Miyoshi Y, et al. Complement activation in patients with heat-related illnesses: soluble CD59 is a novel biomarker indicating severity of heat-related illnesses. Crit Care Explor. 2022;4: e0678. [DOI] [PMC free article] [PubMed] [Google Scholar]
- 36.Batudeligen Z Han, Chen H, et al. Luteolin alleviates liver fibrosis in rat hepatic stellate cell HSC-T6: a proteomic analysis. Drug Des Devel Ther. 2023;17:1819–29. [DOI] [PMC free article] [PubMed] [Google Scholar]
- 37.Bai Q, Hong X, Lin H, et al. Single-cell landscape of immune cells in human livers affected by HBV-related cirrhosis. JHEP Rep. 2023;5: 100883. [DOI] [PMC free article] [PubMed] [Google Scholar]
- 38.Yang L, Zhou L, Li F, et al. Diagnostic and prognostic value of autophagy-related key genes in sepsis and potential correlation with immune cell signatures. Front Cell Dev Biol. 2023;11: 1218379. [DOI] [PMC free article] [PubMed] [Google Scholar]
- 39.Zhang S, Wan D, Zhu M, et al. CD11b + CD43 hi Ly6C lo splenocyte-derived macrophages exacerbate liver fibrosis via spleen-liver axis. Hepatology. 2023;77:1612–29. [DOI] [PMC free article] [PubMed] [Google Scholar]
- 40.Yang AT, Kim YO, Yan XZ, et al. Fibroblast activation protein activates macrophages and promotes parenchymal liver inflammation and fibrosis. Cell Mol Gastroenterol Hepatol. 2023;15:841–67. [DOI] [PMC free article] [PubMed] [Google Scholar]
- 41.Gauthier T, Yao C, Dowdy T, et al. TGF-β uncouples glycolysis and inflammation in macrophages and controls survival during sepsis. Sci Signal. 2023;16: eade0385. [DOI] [PMC free article] [PubMed] [Google Scholar]
- 42.Xiang M, Liu T, Tian C, et al. Kinsenoside attenuates liver fibro-inflammation by suppressing dendritic cells via the PI3K-AKT-FoxO1 pathway. Pharmacol Res. 2022;177: 106092. [DOI] [PMC free article] [PubMed] [Google Scholar]
- 43.Zheng LY, Duan Y, He PY, et al. Dysregulated dendritic cells in sepsis: functional impairment and regulated cell death. Cell Mol Biol Lett. 2024;29: 81. [DOI] [PMC free article] [PubMed] [Google Scholar]
Associated Data
This section collects any data citations, data availability statements, or supplementary materials included in this article.
Supplementary Materials
Data Availability Statement
The data and materials in the current study are available from the corresponding author on reasonable request