Abstract
In this paper we present the results of an analysis of the physically measured surface reflectance spectra of 360 matte Munsell chromatic color chips plus 10 flat achromatic vectors corresponding to Munsell value levels 10 (white) to 1 (near black) for a total sample size of 370. Each of the 370 spectra was multiplied by the spectral radiant power distribution of D65 light so that the final results represent the spectra of reflected light from Munsell color chips under D65 illumination. We simultaneously model the structure of the color chips and the spectra in a common three-dimensional Euclidean space, oriented to yield the most interpretable structure with respect of the Munsell color structure. In this orientation, axis 1 roughly corresponds to the mean power of the spectral reflectance (approximate Munsell value), axis 2 goes from Munsell red to blue-green, and axis 3 goes from Munsell green-yellow to purple. Basis factors for the spectra are also plotted against wavelength and Munsell hue. These plots have implications for theories of opponent processes. By plotting the chips and spectra in the same space we obtain virtually exact correspondences between the various Munsell hues and spectral values in nanometers for comparison to those obtained by previous researchers. Mathematical derivations are provided to validate the common Euclidean model.
The main aim of this paper is to analyze the relationship between the structure of the Munsell color chips and the spectra based on reflected light of Munsell color chips under standard D65 illumination. The data derive from physical measures of reflected light spectra and involve no human judgments. In a previous paper, we demonstrated that most variation among spectral reflectance curves of 1,269 Munsell color chips was well represented in a three-dimensional Euclidean space (1). In that paper, although we did represent Munsell chips and the spectra in a common space with a singular value decomposition (SVD), we had no way of knowing if that joint space was Euclidean. In the present paper, we derive proof that with appropriate weighting, the method does represent the Munsell color chips and the spectra in a common Euclidean space. This allows us to explore in fairly precise ways the relationship between Munsell hues (H) and spectral values in nanometers. It also facilitates relating basis factors of the spectra with H. Another feature of the present analysis is that we take into account illumination. In the final section we discuss the implications of some of the results.
The Munsell system consists of painted standard color chips arranged according to cylindrical coordinates (H, V/C) where the vertical axis in the center represents lightness V (value) from black to white (2). The polar angle and radial distance from the center represents H and saturation C (chroma). Along each axis, adjacent chips are arranged to differ in intervals of equal perceptual size δ, although the size of δ in an attribute is not defined to be the same as that of another attribute. The scale V is from 0 to 10V (black to white), and how far the scale of C extends from 0 depends on H and V. The hue circle is divided into 10 H sectors, 5 principal hues [red (R), yellow (Y), green (G), blue (B), and purple (P)] and 5 intermediate hues such as YR, GY, etc. Each H sector is divided further into four finer categories, namely, 2.5H, 5H, 7.5H, and 10H (0 for the next H). The most representative color of each H sector is taken to be 5H. Based on very extensive visual examination in the early 1940s, the Optical Society of America determined the colorimetric data (x, y, Y) of each chip, and the chips are painted so as to meet these specifications (2).
Cohen was the first to reduce spectral reflectance curves s(λ) to a small number of basis factors (3). His data consisted of a sample of 150 Munsell color chips for which reflectances are given at 10-nm intervals from 380 to 770 nm (40 values). He extracted four eigenvectors from the minor product moment matrix STS, 40 × 40, and showed that 99.18% of the data was accounted for by the first three. Maloney (4) repeated Cohen's analysis on 462 Munsell master standard chips obtained from the Macbeth Corporation (400–700 nm with 10-nm intervals, 31 values) and 337 natural objects collected by Krinov (ref. 5; 400–650 nm with 10-nm intervals, 26 values). On the basis of these two analyses, he concluded that 5–7, not 3, basis factors were necessary to account for the data. The conclusion is retained in Maloney's more recent article (6). Many others have investigated the basis factors of spectra including Parkkinen et al. (7), Jaaskelainen et al. (8), and Vrhel et al. (9).
We are aware of only two previous studies that present empirically derived diagrams of color structure based on measured reflectance spectra of color samples. The first, by Lenz and Meer (10), analyzed “a database consisting of reflectance spectra of 2,782 color chips, 1,269 from the Munsell system and the rest from the NCS (Natural Color System) system.” (ref. 10, p. 103; the Munsell spectra are the same data analyzed in this paper). They found that the spectral data are described by coordinate vectors that lie in a cone, and they therefore define a hyperbolic coordinate system to represent the data. They present a three-dimensional figure of the distribution of the chips [ref. 10, figure 1(b), p. 104] that they characterized as a set of nested cone-like structures, each made up of a single C, with lower C values being inside higher values. The narrow tips of each cone-like structure are at the lowest V levels.
The second empirically derived diagram of color structure based on measured reflectance spectra was reported by Burns et al. (11). From a data set of 427 Munsell color chips under C illuminant measured from 380 to 770 nm in 10-nm steps, they plotted a configuration of color chips and a curve for wavelengths in “fundamental color space.” The space was spanned by three orthoganal axes, L (luminosity), R (red), and V (violet). Points of the same V level form a plane, and each plane is tilted with regard to vectors representing the power level of both equal energy illumination and illuminant C. Below we compare some of their results with those obtained in the present study.
The Data
Spectral reflectance measurements of the 1,269 chips in the Munsell color book (1976 matte edition) from 380 to 800 nm at 1-nm resolution (geometry 0/d) were obtained from www.it.lut.fi/research/color/database/database.html. We analyzed data between 430 and 660 nm to approximate the range of human vision. In the present paper, the analysis is limited to a sample of the 360 most representative Hs, namely, (5R, V/C), (5YR, V/C), … , (5RP V/C), where V covers 2, 2.5, 3, 4, 5, 6, 7, 8, 8.5, 9V, and C covers the whole range of chroma.
The data are denoted as S = (sjμ), where j = 1, 2, … , N represents the Munsell chips, and μ = 1, 2, … , M represents wavelength λ from 430 to 660 nm (M = 231). We added 10 flat reflectance vectors in which sjμ is constant over λ, and sV corresponds to V, where ideal white (10V), s10 = 1.0, and the other nine values are 0.78660 (9V), 0.59100 (8V), 0.43060 (7V), 0.30050 (6V), 0.19770 (5V), 0.12000 (4V), 0.06555 (3V), 0.03126 (2V), and 0.01210 (1V). Thus the sample size is N = 370 in this study. Each column μ of S370×231 = (sjμ) was multiplied by eμ, the spectral radiant power distribution of D65 light (with an arbitrary unit). All the main results of this paper are based on the analysis of SE370×231 = (sejμ), that is, the spectra of reflected light from Munsell chips under D65 illumination.
Simultaneous Representation of Color Chips and Spectra in a Common Space
In this section we show how an SVD of the matrix SE370×231 = (sejμ) facilitates the simultaneous representation of the Munsell color chips and the reflectance spectra in a common space. In general, SVD approximates (≈) a matrix X such as SE in the following way:
 |
 |
where both UUT and VVT are identity matrices, and Δmxm = ( ) is a diagonal matrix. Values of λα (>0) and νμα are obtained as eigenvalues and eigenvectors of XTX and U = XVΔ−1. In our case, m = 3 appears to provide adequate agreement between the two sides of Eq. 1. Let us write
 |
Using P, we can plot Munsell chips as a configuration of points {Pj} in an m-dimensional space spanned by orthogonal coordinate axes α with units  . That the three-dimensional approximation is sufficient can be seen as follows. Define d̂jk, the Euclidean distance between Pj and Pk in Eq. 2, as d̂jk =
 , and define djk, the Euclidean measure of dissimilarity between spectral reflectance curves of j and k, as djk =
 . If SE = PWT holds in Eq. 2, it means sejμ = Σα pjαwμα. Then d
 can be written
 |
 |
Because Σμw = 1 and Σμwμαwμβ = 0, d̂
 = d
= d . In fact, the correlation between three-dimensional SVD reconstruction of d̂jk and the Euclidean distances djk is 0.9998. The largest absolute difference |djk − d̂jk| is 0.7355, which may be compared to the maximum djk of 15.0786. Another way to look at it is to compare the mean error djk − d̂jk of 0.0322 (note that d̂jk ≤ djk because it contains fewer dimensions) to the mean djk of 3.7476. This indicates that P370×3 provides a satisfactory representation of the Munsell color chips in a three-dimensional Euclidean space.
Results of Simultaneous Representation of Color Chips and Spectra
Because the orientation of the structure obtained by plotting P (color samples) and WΔ (spectral points) is arbitrary, it is useful to make a final rotational adjustment for visual examination of the Munsell color structure. Because the space is regarded to be Euclidean, we can apply rigid rotation to the reference axes. The coordinates that we use for plotting the figures below are obtained from P and WΔ by a rigid orthogonal rotation, T = (tαγ) to obtain P̄ = (p̄jγ) = PT and W̄ = (w̄μγ) = (WΔ)T, and γ = 1, 2, 3. The matrix P̄ defines a configuration of points {P̄j}, and the goal was to find a T = (tαγ) that yields the most interpretable structure with respect to Munsell color.
T was obtained by trial-and-error visual rotation of P̄ and W̄ simultaneously by appending the coordinate columns of W̄ to those of P̄. The rotation and translation were rigid, ensuring that the Euclidean distances among the points were invariant. The axes were oriented to align the gray achromatic points along the first dimension as closely as possible. We next minimized the width of the V levels when viewed from the side perpendicular to the first axis. In this orientation axis 1 roughly corresponds to the mean power (the mean value of the spectra of a Munsell color sample) of sjμ (the correlation is 0.999), axis 2 goes from Munsell R to BG, and axis 3 goes from Munsell GY to P. By plotting both P̄ and W̄ in the same space we can see from inspection the correspondence between H and W̄ in the plane spanned by γ = 2, 3.
Colorimetric specification (xj, yj, Yj) uniquely determines Munsell chip j, but there can be many seju values that are specified as (xj, yj, Yj). When a set of Munsell colors that has (seju) values different from our data, SE, is analyzed in the same way; and then P and W in Eq. 2 may be different from ours, but there will be such T that gives the same results as stated above. With the same coordinate axes γ, we can plot
 |
to see how P̄ and W̄ are related (P̄370×3 and W̄231×3 are shown in Tables 2 and 3, which are published as supporting information on the PNAS web site, www.pnas.org).
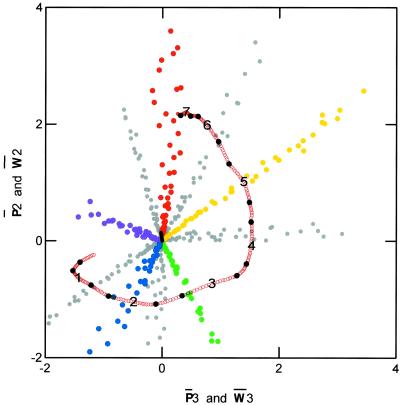
Fig. 1 shows the results of plotting P̄3 and W̄3 on the x axis and P̄2 and W̄2 on the y axis. The structure of the Munsell colors is represented in the plot of P̄, with the primary colors (i.e., R, Y, G, B, and P) indicated by matching colors for identification purposes only, and intermediate colors are all gray. The achromatic samples are plotted in black and occur in the middle of the plot. The spectral values are represented in the plot of W̄ from 430 to 660 nm. The black dots on the spectral plot are placed at 10-nm intervals, with the numbers being at 30-nm intervals beginning with the number 1 at 460 nm.
Fig 1.
Plot of the 370 color samples showing both the location of the Munsell color chips and each spectral position from 430 to 660 nm represented jointly in dimensions two and three of three-dimensional Euclidean space. The five primary colors are coded with the appropriate color, and the numbers on the spectral line represent intervals of 30 nm beginning in the lower left, where 1 indicates 460 nm. The black, filled circles indicate 10-nm intervals.
There are strong implications of the dual plot of color chips and spectral wavelength. One immediate observation is that the projection of a vector from the achromatic point out to the spectral curve provides a prediction of the relation between H and wavelength, λ, as represented by W̄. The fact that the spectral curve does not encircle all the hues is clearly consistent with the well known fact that there is no unique wavelength that produces a perceived color of Munsell P.
A tabulation of the correspondence between Hs (excluding nonspectral P and PR) and W̄ in nanometers is shown in Table 1. Burns et al. (11) present a similar analysis, and it is instructive to compare the methods and results with the present findings. The correspondence between H and the curve of γ was established on the plane perpendicular to vector C (ref. 11, figure 10, p. 38). The results are included in Table 1.
Table 1.
Comparison of values of W̄ for the Hs obtained in the present study with those found by Burns et al. (11)
| H | Present W̄, nm | Burns et al. W̄, nm |
|---|---|---|
| 5PB | 470 | 473 |
| 5B | 488 | 482 |
| 5BG | 501 | 490 |
| 5G | 512 | 520 |
| 5GY | 555 | 565 |
| 5Y | 580 | 574 |
| 5YR | 600 | 586 |
| 5R | 655 | 620 |
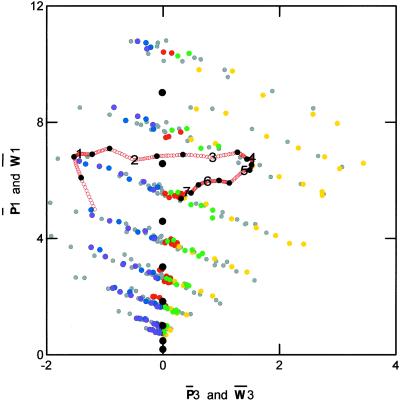
Fig. 2 shows a plot of P̄3 and W̄3 on the x axis and P̄1 and W̄1 on the y axis. The color labeling of the entries is the same as that described for Fig. 1. The sloping planes that are clearly visible in Fig. 2 represent the various levels of V with V = 2.5 at the bottom and V = 9 at the top. The tilt with regard to p̄j1 of planes of p̄j3 of colors of the same V is due to the fact that Munsell Vj = Σμ ȳμsejμ, where ȳμ is the CIE (Commission Internationale de l'Eclairage) luminosity function. In order to have the same Vj, sejμ must be larger for purplish colors than for greenish-yellow colors. The fact that black points, representing achromatic chips, differ from the planes of colors of the same V in Fig. 2 is due to the same reason. If YV = ΣμȳμsVeμ is used for the achromatic chips, the black dots join to the plane corresponding to V, and V = 4.143 Y − 1.6. This is in agreement with the 1976 CIE lightness function (12) except for the value of the coefficient. The present YV is defined with an arbitrary unit.
Fig 2.
A plot of the same information with the same codes as those shown in Fig. 1 using dimensions one and three of the three-dimensional Euclidean space.
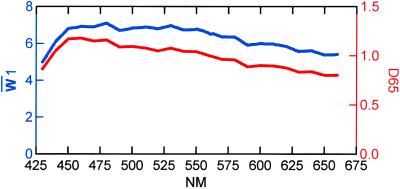
All information on the effect of λ on color perception resides in W̄, while P̄ characterizes the se spacing of Munsell colors as its modulations. When plotted against μ (and hence λ), each column of W̄ defines a curve. Fig. 3 shows the plot of W̄1 = (w̄λ1). The curve is almost parallel with eλ of D65, which implies that w̄λ1 roughly represents the flat reflectance (sλ = a constant). The curve W̄1(λ) is relatively smaller compared with the curve e(λ) of D65 at shorter wavelength. The term pj1w1μ is proportional to p̄j1w̄1μλ = (p̄j1λ
 )w̄1μ represents the general level of spectrum sejμ. If w̄1μ is such a component in sejμ that makes this term a constant, λ
 is independent of μ, and at purplish colors p̄j1 is larger, and hence w̄1μ is smaller. On the other hand, e(λ) is defined for a constant level of luminous component in λ. Hence, this may be the reason that curve w̄1(λ) is relatively smaller compared with the curve e(λ) of D65 at shorter wavelength.
Fig 3.
A plot of the first spectral dimension (blue) and D65 illumination (red) against nm.
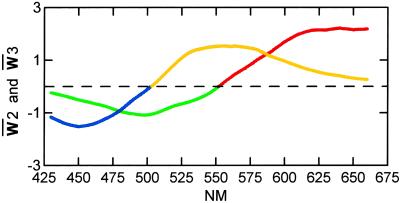
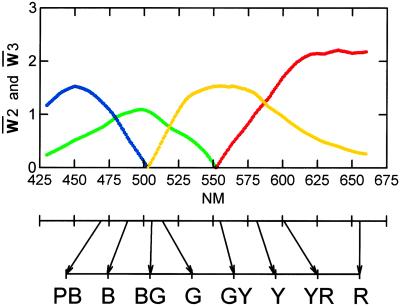
The curves defined by W̄2 = (w̄λ2) and W̄3 = (w̄λ3) represent two opponent processes, respectively. In Fig. 4, the positive and negative sides of w̄λ2 are shown by R and G, and those of w̄λ3 by Y and B. This is the usual way of plotting when opponent processes are determined with monochromatic light by the cancellation technique, as used for example, by Jameson and Hurvich (13) and Werner and Wooton (14).
Fig 4.
A plot of the second and third spectral dimensions against nm coded with the color of the assumed opponent process.
In Fig. 5, two negative curves, G and B, are flipped over to the positive side. This is the usual pattern when opponent components in surface colors are defined by assessment as used by Indow (15). These curves are different in meaning for monochromatic lights and for surface colors. For example, the value of a curve R for a monochromatic light of wavelength λ represents the strength of giving rise to redness impression in the light of this specific wavelength λ. On the other hand, that value for a surface color having λ as its dominant wavelength represents that strength in the entire range of the spectrum of reflected light from that surface.
Fig 5.
A plot of the absolute value of the second and third spectral dimensions against nm with the same color coding as that described for Fig. 4. The arrows at the bottom of the figure show the connection of 5H colors with nm as shown in Table 1.
Fig. 5 includes the correspondence between λ and H in Table 1. The curves in Figs. 4 and 5 are most different from other opponent curves in that the R = 0, G = 0, and Y = maximum at ≈550 nm that is close to 5GY. Usually, this occurs at ≈572 nm, which corresponds to 5Y as shown by Indow (ref. 16, figure 3).
Discussion
In this paper we have introduced procedures for modeling the reflectance spectra of Munsell chips under D65 illumination into the same three-dimensional Euclidean space as the color chips. This allows more precise determination of the relationship between spectral wavelength and H than in previous studies. The nature of the structure of the Munsell color solid in terms of physically measured spectra are modeled in some detail in this and a previous paper (1).
Our finding on the orientation of the axes of the color space may have implications for opponent process theories. The major axes of the hue circle as represented in Fig. 1 indicate that axis 2 goes from Munsell R to BG, and axis 3 goes from Munsell GY to P. The axes in traditional opponent process theory (13, 14) are generally considered to go from Munsell R to G and from Munsell Y to B. Jameson and D'Andrade (17) have drawn attention to this discrepancy between the axes posited by opponent process theory and the axes in the Munsell color system. They say that opponent process theory “… can never be patched up as long as unique hues are maintained as unitary sensations and antagonist channel zero-crossings. In light of these facts it seems wise to pursue alternate hue axes that model the empirical data more closely, and we suggest that one such model may be provided by a maximized interpoint-distance formulation in, for example, the Munsell color space, or in some other perceptual scaling space” (ref. 17, p. 308).
Two directions for future research suggested by the current work should be mentioned: (i) to investigate in detail the relationship between the perceptual structure of the Munsell color solid and the physical structure as represented in the current research, and (ii) to relate the cone sensitivity curves of the three receptors in the human retina to the physical model.
Supplementary Material
Acknowledgments
We thank Robert Newcomb for writing programs for rotating the color structure. Roy G. D'Andrade and Carmella C. Moore provided helpful advice. The research was funded in part by National Science Foundation Grant SES-0136115 (to A.K.R. and W. H. Batchelder).
Abbreviations
SVD, singular value decomposition
H, Munsell hue
V, Munsell value (brightness)
C, Munsell chroma (saturation)
R, red
Y, yellow
G, green
B, blue
P, purple
References
- 1.Romney, A. K. & Indow, T. (2002) Color Res. Appl., in press.
- 2.Newhall S. M., Nickerson, D. & Judd, D. B. (1943) J. Opt. Soc. Am. 33, 385-418. [Google Scholar]
- 3.Cohen J. (1964) Psychon. Sci. 1, 369-370. [Google Scholar]
- 4.Maloney L. T. (1986) J. Opt. Soc. Am. 3, 1673-1683. [DOI] [PubMed] [Google Scholar]
- 5.Krinov E. L. (1953) in Technical Translation: TT-439, trans., ed. Beldov, G. (National Research Council of Canada, Ottawa, ON).
- 6.Maloney L. T. (1999) in Color Vision: From Genes to Perception, eds. Gegenfurtner, K. R. & Sharpe, L. T. (Cambridge Univ. Press, Cambridge, U.K.), pp. 387–416.
- 7.Parkkinen J. P. S., Hallikainen, J. & Jaaskelainen, T. (1989) J. Opt. Soc. Am. A 6, 318-322. [Google Scholar]
- 8.Jaaskelainen T., Parkkinen, J. & Toyooka, S. (1990) J. Opt. Soc. Am. A 7, 725-730. [Google Scholar]
- 9.Vrhel M. J., Gershon, R. & Iwan, L. S. (1994) Color Res. Appl. 19, 4-9. [Google Scholar]
- 10.Lenz R. & Meer, P. (1999) in EUROPTO: Conference on Polarization and Color Techniques in Industrial Inspection, eds. Marszalec, E. A. & Trucco, E. (SPIE Proceedings, Munich), Vol. 3826, pp. 101–112. [Google Scholar]
- 11.Burns S. A., Cohen, J. B. & Kuznetsov, E. N. (1990) Color Res. Appl. 15, 29-51. [Google Scholar]
- 12.Wyszecki G. & Stiles, W. S., (1982) Color Science: Concepts and Methods, Quantitative Data and Formula (Wiley, New York).
- 13.Jameson D. & Hurvich, L. M. (1955) J. Opt. Soc. Am. 45, 546-552. [DOI] [PubMed] [Google Scholar]
- 14.Werner G. & Wooton, B. R. (1979) J. Opt. Soc. Am. 69, 422-434. [DOI] [PubMed] [Google Scholar]
- 15.Indow T. (1999) Color Res. Appl. 24, 19-32. [Google Scholar]
- 16.Indow T. (1987) Die Farbe 34, 253-260. [Google Scholar]
- 17.Jameson K. & D'Andrade, R. G. (1997) in Color Categories in Thought and Language, eds. Hardin, C. L. & Maffi, L. (Cambridge Univ. Press, Cambridge, U.K.), pp. 295–319.
Associated Data
This section collects any data citations, data availability statements, or supplementary materials included in this article.


