

Abstract
Glyphosate is one of the most widely used herbicides in the world and its continued use in agriculture and other scenarios is the focus of intense public and scientific interest. Glyphosate is also controversial in that it was declared ‘probably carcinogenic to humans (Group 2A)’ by the International Agency for Research on Cancer in 2015. However, since that time, regulatory agencies in many countries have reviewed the public literature and guideline studies submitted for regulatory purposes and have concluded that it is not a carcinogen. The acceptable daily intakes (ADIs) and the reference dose (RfD) have been revised and restrictions on use have been lifted in many locations. Risk assessment for any pesticide requires information on exposure in humans and the environment and this was reviewed in 2016 and in 2020. Since 2020 many studies have been published in the literature and by government departments. Most of these studies have focused on exposures of the general population, which is the subject of this paper. Based on the studies published since 2020, the overall conclusion is that exposure of applicators and the general population to glyphosate represents a de minimis risk. In addition, a general observation from the larger population‐based studies that conduct routine sampling is that exposures have declined somewhat since 2020. © 2025 The Author(s). Pest Management Science published by John Wiley & Sons Ltd on behalf of Society of Chemical Industry.
Keywords: applicators, dietary, systemic dose, population, exposure
This update examines exposure information for glyphosate in applicators and the general population published since 2020. The overall conclusions from these studies are that margins of exposure for applicators have not decreased since 2020 and still present de minimis risk. New studies on the general population show greater margins of exposure than applicators and de minimis risk. The larger population‐based studies using routine sampling indicate that exposures have declined somewhat since 2020.

1. INTRODUCTION
Glyphosate, (CAS# 1071‐83‐6 [N‐(phosphonomethyl)glycine]), has been on the market since the mid‐1970s and is still one of the most widely used herbicides in the world. The history of glyphosate was well described in Duke 1 , 2 and is not repeated here. However, it is worth reiterating that the site of herbicidal action in plants is the enzyme 5‐enolpyruvylshikimate‐3‐phosphate synthase (EPSPS), which is involved in the synthesis of the aromatic amino acids, phenylalanine, tyrosine, and tryptophan, which are all essential for plant growth. The enzyme EPSPS is not expressed in mammals and other vertebrates, so the active ingredient is likely to be of low toxicity to animals. Despite the view of the International Agency for Research on Cancer (IARC) that glyphosate was ‘probably carcinogenic to humans (Group 2A)’, 3 most regulatory agencies have not accepted this classification and have allowed its continued use. However, the allowable daily intakes (and the reference dose) have been reduced slightly in several jurisdictions (see more discussion of this in 4 ).
Information on exposure to pesticides and other chemicals is critical to assessing hazards and risks. This review builds on previous publications 4 , 5 and presents an updated characterization of exposures from papers and government reports published since 2020. The paper evaluates the risk from exposure to glyphosate in comparison to benchmarks established by several regulatory agencies.
Since 2020, 10 studies on exposures of applicators to glyphosate were found in the published literature. Many more studies have been published on exposures of the general population to glyphosate. For the sake of completeness, and to characterize possible trends, the four studies on the general population from the 2020 paper 4 have been included here.
2. METHODS
Literature searches followed the same protocol described in Solomon 2020. 4 The databases used were PubMed®, Google Scholar®, as well as reviews conducted by other researchers. The cut‐off date for these searches was December 2024. Concentrations of glyphosate in environmental matrices (e.g., air, water, and food) were not included in this paper because data on systemic exposures of humans were plentiful and more germane to the question of systemic exposures and risks. Because the systemic dose measured in the general population integrates exposures for all environmental sources, it is the most appropriate measure for characterizing hazard and risk for this group. Systemic dose is based on measured concentrations of glyphosate in bodily fluids, invariably urine for a chemical such as glyphosate, which is excreted primarily via the kidneys.
The best way to characterize exposures using urinary excretion is to collect total urinary output for 24 h over several days. However, this is time‐consuming and requires dedication on the part of volunteers, so it is more common to base characterization of exposures on spot‐samples or morning voids, and 24‐h total urine collection. These samples provide a snapshot in time but for non‐applicators, whose exposure is mostly via diet, spot‐samples provide a reasonable surrogate for amortized exposures over time. However, they should not be directly compared to exposures of applicators which might vary from day to day depending on work‐tasks.
As pointed out previously, 4 glyphosate in the environment breaks down into several transformation products with aminomethylphosphonic acid (AMPA), the most frequently detected. It is tempting to stoichiometrically sum residues of glyphosate and AMPA measured in urine and/or environmental samples as a surrogate for ∑‐glyphosate. However, doing this will result in overestimations of exposure to glyphosate as AMPA is also a transformation product of several other chemicals used in industry, water treatment, and domestically in detergents. 6 , 7 For this reason, exposures to AMPA were not included in this review and are a separate question.
2.1. Assessment benchmarks
For consistency with previous papers, the Reference Dose (RfD) or the Acceptable Daily Intake (ADI) were used as benchmarks for characterizing deterministic hazards. RfDs and ADIs are essentially the same and are derived from the no‐observed‐effect‐dose in the most sensitive animal tested for the most sensitive adverse response. Application (uncertainty) factors of ≥100‐fold are used to account for uncertainty in extrapolation from laboratory animals to humans and for differing sensitivity between humans. Because of the use of different responses from different studies, RfDs and ADIs might differ between jurisdictions. The most recent RfD proposed for glyphosate in the USA 8 is 1 mg kg−1 body mass (b.m.) day−1 which is the essentially the same as the ADI of 0–1 mg kg b.m.−1 day−1 determined by the FAO‐JMPR 9 and Food Safety Committee of Japan (FSCJ). 10 The ADI established by European Food Safety Authority (EFSA) is 0.5 mg kg b.m.−1 day−1 11 and that for the Australian Pesticides and Veterinary Medicines Authority (AVPMA) and Health Canada's Pest Management Regulatory AGENCY (PMRA) is 0.3 mg kg b.m.−1 day−1. 12 , 13 As pointed out before, 4 these values are suitable for comparison to the dietary intake but, for comparison to systemic doses as estimated from biological monitoring (urinary excretion), the ADIs and RfD were divided by 5 to account for only 20% absorption from the GI tract. 11 These normalized values are 0.06, 0.1, and 0.2 mg kg−1 day−1, for the APVMA, PMRA; EFSA; and the FSCJ and FAO ADIs, and USEAP RfD, respectively. These were used to characterize the exposures in the following sections.
2.2. Estimating the systemic dose in the general population
As before, 4 it was assumed that the general population is exposed daily through the environment and diet, and that these exposures are relatively constant and not episodic as they would be in an applicator. A single daily sample of urine was assumed to be a reasonable surrogate for daily systemic dose; however, it is recognized that lack of total daily urine output and lack of sampling across a greater time introduces uncertainty, as does lack of measurement of creatinine as an indicator of daily volume of urine. To be consistent with the previous review, the urinary concentration was used to calculate this on the conservative assumptions of 2 L (kg) of urine per day and a 60 kg person for an adult 14 or adolescent and 1 L for a 20 kg child. Some studies in this review corrected concentrations for creatinine and others for specific gravity; these were used as published. Some provided mean body‐mass and this was used to estimate the systemic ADI. This is noted in the comment column in Table 2.
Table 2.
Summary of exposure studies on glyphosate in the general population
| Year of last sampling | Source of samples a | Greatest mean or median conc. in urine μg L−¹ | Max or 95th centile conc. in urine μg L−¹ | Systemic dose in mg kg−¹ b.m. b | Comment | |
|---|---|---|---|---|---|---|
| Greatest mean or median | Max. or 95 th centile | |||||
| 1996 | Urine from 100 adults in CA, USA, 12 > LOD. 31 (1993‐1996). | 0.024 | 0.039 | 8.00 × 10⁻⁷ | 1.30 × 10⁻⁶ | Spot samples. Analysis by HPLC‐MS/MS. LOD = 0.03 μg L−¹. Concentration adjusted for SG of urine. Little other information on the analytical procedures. The arithmetic mean was used and 95% CI. No raw data or body‐mass reported. |
| 2000 | Urine from 100 from CA, USA, 30 > LOD. 31 (1999‐20000 | 0.053 | 0.074 | 1.77 × 10⁻⁶ | 2.47 × 10⁻⁶ | As in reference. 31 |
| 2001 | Urine from 23 male non‐farmers from Iowa, USA. Data were from table 2 of the paper. 32 (2001) | 1.4 | 1.5 | 4.67 × 10 −5 | 5.00 × 10 −5 | Spot samples. Analysis by ELISA (Abraxis LLC, Hatboro, PA). LOD 0.9 μg L−¹. Geomean and 95%CI. Raw data and body mass were not provided. |
| 2001 | Urine from 24 female non‐farmers from IA, USA. Data were from table 2 of the paper 32 (2001) | 1.2 | 5 | 4.00 × 10 −5 | 5.33 × 10 −5 | As in reference. 32 |
| 2001 | Urine from 25 children of non‐farmer from IA, USA Data from tab 2 of the paper. 32 (2001) | 2.5 | 3.1 | 4.50 × 10 −5 | 1.55 × 10 −4 | As in reference. 32 |
| 2002 | Urine from 100 from CA, USA, 43 > LOD. 31 (2001‐2002) | 0.11 | 0.146 | 5.50 × 10⁻⁶ | 4.87 × 10 −6 | Spot samples. Analysis by HPLC‐MS/MS. LOD = 0.03 μg L−¹. Concentration adjusted for SG of urine. Little other information on the analytical procedures. The arithmetic mean was used and 95% CI. No raw data or body mass reported. |
| 2005 | Urine from 100 adults from CA, USA, 38 >LOD. 31 (2004‐2005) | 0.111 | 0.152 | 3.70 × 10⁻⁶ | 5.07 × 10 −6 | As in reference. 31 |
| 2011 | Urine from 1826 pregnant women from 10 cities in Canada. 33 (2008‐2011). | 0.249 | 3.907 | 8.30 × 10⁻⁶ | 1.30 × 10⁻⁴ | Spot samples collected in the first trimester. UPLC‐MS/MS LOD = 0.8 μg L−¹. The analysis was well described, and QA and QC were good. Concentrations of glyphosates were corrected for specific gravity of urine sample. |
| 2011 | Urine from 14 children (7‐11 yr) in Denmark. 34 (2011). | 1.96 | 3.31 | 9.80 × 10⁻⁵ | 1.66 × 10⁻⁴ | Spot samples were used in the study. Analysis was by ELISA, LOD 0.075 μg L−1 reported in another study. Details on the analysis were sparse. |
| 2011 | Urine from mothers (13) in Denmark. 34 2011 | 1.28 | 3.2 | 4.27 × 10⁻⁵ | 1.07 × 10⁻⁴ | As in reference 34 |
| 2012 | Urine from 163 Pregnant women from the USA enrolled in the TIDES study. 35 2010‐2012 term and preterm combined | 0.25 | 3.4 | 8.33 × 10⁻⁶ | 1.13 × 10⁻⁴ | Spot samples were used in the study. Analysis was by UPLC MS/MS LOD = 0.014 μg/L. |
| 2013 | Urine from 172 men and 129 women from Germany. 36 (2012‐2013) | 0.16 | 1.36 | 8.00 × 10⁻⁶ | 6.80 × 10⁻⁵ | Samples of urine were 24 h. Analysis was conducted by LC MS/MS with isotopically labelled internal standards. LOD = 0.5 μg/L. Analysis was well documented. Body mass was measured but only aggregate values were reported. Of the 301 participants 208 had concentrations < LOD. Mean and range were calculated for samples > LOD only and are thus biased. |
| 2013 | Ten urine samples from each of 18 EU countries (total = 182. 37 (2013) | 0.21 | 1.56 | 7.00 × 10⁻⁶ | 5.20 × 10⁻⁵ | Spot samples assumed. Unpublished report. Analysis was by derivatization and GC‐MS/MS. LOD = 0.15 μg/L. Arithmetic mean used. Details on processing data were sparse (weakness) Greatest mean was in samples from Malta. |
| 2014 | Urine from 1625 adults from the USA. Samples from 2013 to 2014. 38 | 0.392 | 1.54 | 1.31 × 10 −5 | 5.13 × 10⁻⁵ | NHANES samples. Analysis by chromatography hy/IDMS LOD = 0.2 μg/L. Analytical procedures were well controlled and data have good provenance. |
| 2014 | Urine from 348 adolescents from the USA. Samples from 2013 to 2014. 38 | 0.481 | 1.7 | 2.58 × 10 −5 | 8.58 × 10 −5 | As in reference. 38 |
| 2014 | Urine from 324 children from the USA. Samples from 2015 to 2016. 38 | 0.515 | 1.7 | 2.58 × 10 −5 | 8.50 × 10 −5 | As in reference 38 |
| 2014 | Urine from 40 male and female students from Germany. 39 (2014). | ‐ | 0.65 | ‐ | 2.17 × 10⁻⁵ | Spot samples assumed. Unpublished report described in Niemann et al., 2015. 14 Presumed to be analyzed by GC. LOQ = 0.15 μg L−¹ Only the maximum concentration was reported. |
| 2015 | Urine from 1187 Canadian males aged 3 to 79 years CHMS biomonitoring glyphosate urine results. 30 (2015). | 0.54 | 2.9 | 1.80 × 10 −5 | 9.67 × 10 −5 | Spot samples. The method of analysis was not described on website but data are from a government organization and are trusted. |
| 2015 | Urine from 1191 Canadian females aged 3 to 79 y CHMS biomonitoring glyphosate urine results. 30 (2015). | 0.47 | 2.5 | 1.57 × 10 −5 | 8.33 × 10 −5 | As in reference. 30 |
| 2015 | Urine from 40 lactating women from Idaho. 27 | 0.18 | 1.04 | 9.33 × 10⁻⁶ | 3.47 × 10 −5 | Spot samples. Analysis was by HPLC MS/MS, LOD = 0.03 μg L−¹. All samples were analyzed in two laboratories (Monsanto and Covance). Upper 95th centile estimated from mean + 2SD. Concentrations of glyphosate in milk were all < LOD of 1.0 μg L−¹. |
| 2015 | Urine from 181 elderly adults from the Flemish population. 40 (2012‐2015). | 0.1 | 3.72 | < 3.3 × 10⁻⁶ | 1.24 × 10⁻⁴ | Spot samples assumed. Analysis was by GC‐MS‐MS after derivatization, LOQ = 0.1. Values were corrected for specific gravity. |
| 2015 | Urine samples from 97 lactating women from Valencia, Spain. 41 (2015) | 0.12 | 0.62 | 4.00 × 10⁻⁶ | 2.07 × 10 −4 | Spot samples of urine. Analysis was by LC MS/MS LOD = 0.1 μg/L. Description of methods was good as was QA/QC. Authors calculated the systemic dose but combined concentrations of glyphosate and the degradate, AMPA (data not used). |
| 2015 | Urine from 84 adults (some farmers) from Hopelchén, Campeche, Mexico. 42 (2015 assumed). | 0.234 | 0.875 | 7.80 × 10⁻⁶ | 2.07 × 10⁻⁵ | Spot samples. Analysis by ELISA method (PN 500086) by Abraxis. Median calculated from raw data provided in SI. Values < LOD (0.05 μg L−¹) assumed to zero, for 26 participants. |
| 2015 | Urine from 399 adults from Germany. 43 (2001‐2015). | 0.16 | 2.8 | 5.33 × 10 −6 | 9.33 × 10 −5 | Twenty‐four hr. urine sample. Time trend analysis, data combined here. Analysis of derivatized glyphosate by GC‐MS/MS. Isotopic labelled internal standards. Analytical parameters were well described. LOD = 0.1 μg/L. Greatest median and 95th centile were from Table 5 of the paper. 43 |
| 2016 | Urine from one hundred adults from CA, USA, 70 > LOD. 31 (2014‐2016). | 0.235 | 0.394 | 7.83 × 10⁻⁶ | 1.31 × 10 −5 | Spot samples. Analysis by HPLC‐MS/MS. LOD = 0.03 μg L−¹. Concentration adjusted for SG of urine. Little other information on the analytical procedures. Arithmetic means were used and 95% CI. |
| 2016 | Urine from 1443 adults from the USA. Samples from 2015 to 2016. 38 | 0.331 | 1.54 | 1.10 × 10 −5 | 5.13 × 10 −5 | NHANES spot samples. Analysis by chromatography hy/IDMS LOD = 0.2 μg/L. Analytical procedures have good quality assurance and quality control (QA/QC) |
| 2016 | Urine from 309 adolescents from the USA. Samples from 2015 to 2016. 38 | 0.414 | 1.46 | 1.38 × 10 −5 | 4.87 × 10 −5 | As in reference. 38 |
| 2016 | Urine from 324 children from the USA. Samples from 2015 to 2016. 38 | 0.509 | 2.31 | 2.55 × 10 −5 | 1.16 × 10⁻⁴ | As in reference. 38 |
| 2016 | Compilation C4 c . Urine from 223 children (6‐11 yr) from France, ESTEBAN study. 44 (2014‐2016). | 0.05 | 0.65 | 2.50 × 10 −6 | 3.25 × 10 −5 | Morning samples. Analysis by LC‐MS/MS LOQ = 0.05. Details of analysis not reported but referenced to original report. |
| 2016 | Compilation A4. Urine from 169 adults from France. ESTEBAN study. 45 (2014‐2016) | 0.05 | 0.24 | 1.67 × 10⁻⁶ | 8.00 × 10 −6 | Morning sample. Analysis was by LC‐MS/MS LOQ = 0.05 μg/L. Details of analysis not reported but referenced to original report. |
| 2017 | Urine from 1189 Canadian males aged 3 to 79 CHMS biomonitoring glyphosate urine results. 30 | 0.38 | 2.2 | 1.27 × 10 −5 | 1.10 × 10 −4 | Spot samples. The method of analysis was not described on website but data are from a government organization and are trusted. |
| 2017 | Urine from 1193 Canadian females aged 3 to 79. CHMS biomonitoring glyphosate urine results. 30 | 0.33 | 1.7 | 1.10 × 10 −5 | 8.50 × 10 −5 | As in reference. 30 |
| 2017 | Urine from 347 pregnant women from Puerto Rico in the PROTECT cohort. 46 2012‐2017 | 0.49 | 1.67 | 6.67 × 10 −6 | 1.60 × 10 −5 | Spot samples. Analysis of derivatized glyphosate by GC MS/MS method as reported in. 47 LOD 0.2 μg L−¹. The greatest median and 95th centile were from Table 2 of the paper. 46 |
| 2017 | Urine from 197 young adults from southern Sweden. 48 2017 | < 0.1 | 0.24 | 3.33 × 10⁻⁶ | 8.00 × 10⁻⁶ | LC‐MS/MS; QTRAP 5500. Analysis followed the German External Quality Assurance Scheme (G‐EQUAS) LOD = 0.1 μg L−¹. Analytical methods described in SI to the paper. 48 |
| 2017 | Urine from 2144 children and adolescents from Germany. German Environmental Survey 2014–2017 (GerES V). 49 (2014–2017) | 0.1 | 6.7 | 5.00 × 10⁻⁶ | 3.35 × 10⁻⁴ | Analysis by a validated method by Analytisch‐Biologisches Forschungslabor (ABF GmbH), Munich. GC‐MS/MS, LOD = 0.1 μg/L |
| 2017 | Urine from 171 (1st visit) & 208 (3rd visit) pregnant women from Puerto Rico in the PROTECT study. 47 (2011‐2017). | 0.5 | 1.48 | 1.60 × 10 −5 | 4.93 × 10 −5 | Spot samples were used. Analysis of derivatized glyphosate by GC MS/MS. Isotopically labelled internal standards used. LOD = 0.2 μg L−¹. Concentrations of glyphosate were corrected for SG. |
| 2017 | Urine from 10 of 50 adults from the general population in Ireland. 50 2016‐2017 | 0.79 | 1.32 | 2.90 × 10⁻⁵ | 4.50 × 10⁻⁵ | Spot samples were used. SPE extraction, analysis by LC‐MS/MS). The method was linear over the calibration range 0–20 μg L−¹, LOD was 0.5 μg L−¹. LOD and greatest values provided no mean or centiles. |
| 2017 | Urine from 16 Adults and children consuming conventional food. 51 (2017). | 0.51 | 6.22 | 1.70 × 10 −5 | 3.11 × 10⁻⁴ |
Spot samples. Analysis was by LC‐MS/MS and the method was approved under the US EPA CLIA program. Isotopically labeled internal standards of glyphosate were used. The analysis was satisfactory. LOD was 0.020 μg L−¹. Medians and max data were from Table 1 of the paper. 51 |
| 2017 | Compilation C1. Urine from 166 children (10‐11 yr) from Cyprus, ORGANIKO study. 44 (2017). | 0.1 | 1.03 | 5.00 × 10⁻⁶ | 5.15 × 10 −5 | Morning samples. Analysis by GC MS/MS LOQ = 0.1. Details of analysis not reported but referenced to original report. |
| 2017 | Compilation C2. Urine from 300 children (6‐12 yr) from Germany GerES V‐sub. 44 (2015–2017). | 0.1 | 0.43 | 5.00 × 10⁻⁶ | 2.15 × 10 −5 | Morning and spot samples. Analysis by GC MS/MS LOQ = 0.1. Details of analysis not reported but referenced to original report. |
| 2018 | Urine from 1160 males in the NHANES cohort in the USA. 38 | 0.287 | 1.34 | 9.57 × 10 −6 | 4.47 × 10⁻⁵ | NHANES spot samples. Analysis by chromatography hy/IDMS LOD = 0.2 μg/L. Analytical procedures are well controlled and data have good provenance. |
| 2018 | Urine from 1169 females in the NHANES cohort in the USA 38 | 0.251 | 1.39 | 8.37 × 10 −6 | 4.63 × 10 −5 | As in reference. 38 |
| 2018 | Urine from 17 men and 29 women from Portugal 52 | 0.19 | 0.32 | 3.33 × 10 −6 | 1.07 × 10 −5 | Spot samples. Analysis of derivatized glyphosate by GC MS/MS v LOD of 0.1 μg L−¹. Methods were not well described and processing of data difficult to follow. The geometric mean and 95th centile were from Table 2 of the paper. 52 |
| 2018 | Urine from 149 children (7–10) from Slovenia. 53 (2018, Jan to Mar) | 0.1 | 0.39 | 5.0 × 10⁻⁶ | 1.95 × 10⁻⁵ | Spot samples. Analysis of derivatized glyphosate by GC MS/MS. Described with sufficient detail. LOD = 0.1 μg/L. Calculations of systemic doses mentioned in methods but not presented in the paper. 1.5 L urine and body‐mass (BM) of 35 Kg assumed. Data were from Table 3 of the paper. 53 |
| 2018 | Urine from 97 adolescents (12–15) from Slovenia. 53 (2018, Jan to Mar) | 0.1 | 0.33 | 3.33 × 10⁻⁶ | 1.10 × 10⁻⁵ | As above, 1.5 L urine and body‐mass (BM) of 35 Kg assumed. |
| 2018 | Urine from 139 children (7–10) from Slovenia. 53 (2018, May to June) | 0.1 | 37 | 4.29 × 10⁻⁶ | 1.59 × 10⁻⁵ | Spot samples. Analysis of derivatized glyphosate by GC MS/MS. Described with sufficient detail. LOD = 0.1 μg/L. Calculations of systemic doses mentioned in methods but not presented in the paper. 1.5 L urine and BM of 35 Kg assumed. Data were from table 3 of the paper. 53 |
| 2018 | Urine from 86 adolescents (12–15) from Slovenia. 53 (2018, May to June) | 0.1 | 38 | 3.33 × 10⁻⁶ | 1.27 × 10⁻⁵ | As above, adult urine production and BM assumed. |
| 2019 | Urine from 1167 Canadian males aged 3 to 79 CHMS biomonitoring glyphosate urine results. 30 (2019). | 0.33 | 2.1 | 1.10 × 10 −5 | 1.05 × 10 −5 | Method of analysis not reported but from a trusted source. |
| 2019 | Urine from 1168 Canadian males aged 3 to 79 CHMS biomonitoring glyphosate urine results. 30 (2019). | 0.21 | 1.6 | 7.00 × 10 −6 | 8.00 × 10 −5 | Method of analysis not reported but from a trusted source. |
| 2019 | Urine from 48 children (3‐12 y) from an agricultural area in Morocco. 54 | 0.97 | 2.58 | 4.85 × 10 −5 | 2.15 × 10 −4 | Spot samples. Analysis by UPLC‐MS/MS well described LOD = 0.1 μg L−¹ (from SI). Concentrations of glyphosate in urine were from Table 4 of the paper. 54 Systemic dose was calculated, data were from Table 6 of the paper. 54 However, based on 20 kg body mass and 1 L urine day−¹ lower concentrations were estimated i.e., (4.85 × 10⁻⁵ and 1.29 × 10⁻⁴). d |
| 2019 | Urine from 41 children 3‐10 years from Portugal. 55 2018‐2019 | 1.77 | 4.35 | 8.85 × 10⁻⁵ | 2.18 × 10⁻⁴ | Spot samples. Analysis ELISA, Abraxis Glyphosate ELISA Plate Kit®, ABRAXIS, USA) LOD = 0.06 μg/L. |
| 2019 | Urine from 140 children (≤ 17 y old) from Agua Caliente, (Mexico). 56 Year of sampling not reported. | 0.363 | N/A | 1.85 × 10⁻⁵ | N/A | The authors of this paper published an erratum 57 stating that the concentrations reported were incorrect. The values were originally stated as μg ml−¹ but should have been ng L−¹. The values were corrected to μg L−¹ here and below. Spot samples. Analysis by LC‐MS/MS. LOD/LOQ not provided. Details of the analytical methods were sparse. Mean concentrations were from Table 4 of the paper 56 were corrected to μg L−¹ and an estimated mean weight of 29.4 (± SD 10.1) kg) was from Table 3 of the paper 56 and 1.5 L urine per day assumed from the greater body weight. |
| 2019 | Urine from 87 children (≤ 17 y old) from Ahuacapán, (Mexico). 56 Year of sampling not reported. | 0.606 | N/A | 2.81 × 10⁻⁵ | ‐N/A | As in reference. 56 The systemic dose was corrected for an estimated weight of 32.27 (± SD 11.73) kg. |
| 2019 | Urine from 108 children and infants from the USA. 58 Year of sampling not known | 0.278 | 2.125 | 1.39 × 10⁻⁵ | 1.06 × 10⁻⁵ | Spot samples. Analysis by LC MS/MS with the use of isotopically labelled internal standards and well described LOD = 0.1 μg/L. |
| 2020 | Urine from 6795 people from across France. 59 (2020). | 1.19 | 2.87 | 3.97 × 10⁻⁵ | 9.57 × 10⁻⁵ | Spot samples. The analysis was by ELISA (Abraxis, Inc., USA). LOQ and LOD were not reported. Only mean +‐ SD (0.84) was available corrected for BMI but not body mass Upper 96th centile estimated from 2× the SD of 0.84. A request for the raw data was refused. |
| 2020 | Urine from 217 children from across France. 59 (2020). | 2.05 | 4.63 | 1.03 × 10⁻⁴ | 2.32 × 10 −4 | Analysis as above. Only the mean of 2.05 μg L−¹ ± SD (1.29), corrected for BMI but not body mass, was available. The upper 96th centile was estimated from 2 × SD of 1.29. A request for raw data was refused. |
| 2020 | Compilation C3. Urine from 133 children (6‐8 yr) from Belgium, 3XG study. 44 (2019–2020). | 0.1 | 0.41 | 5.00 × 10⁻⁶ | 2.05 × 10 −5 | Morning and spot samples. Analysis by LC‐MS/MS, LOQ = 0.1. Details of analysis were not reported but referenced to original report. |
| 2020 | Compilation A1. Urine from 250 adults from Germany UBA ESB (Germany). 45 (2015‐2020). | 0.1 | 0.29 | 3.33 × 10⁻⁶ | 9.67 × 10 −6 | Twenty‐four hr. urine sample. GC MS/MS, LOQ = 0.1. Details of analysis not reported but referenced to original report. |
| 2020 | Compilation A2. Urine from 299 adults from Switzerland, Swiss HBM4EU study. 45 (2020). | 0.1 | 0.24 | 3.33 × 10⁻⁶ | 8.00 × 10 −6 |
Morning sample. Analysis was by LC‐MS/MS, LOQ = 0.1 μg L−1. Details of analysis not reported but referenced to original report. |
| Compilation A3.Urine from 195 adults from Iceland DIET‐HBM study. 45 (2019‐2020). | 0.1 | 0.37 | 3.33 × 10⁻⁶ | 1.23 × 10 −5 |
Spot sample. Analysis was by GC‐MS/MS, LOQ = 0.1 μg L−1. Details of analysis not reported but referenced to original report. |
|
| 2022 | Urine from 29 male Latino farmworkers from SW Idaho, USA. 60 (2022). | 0.16 | 3.6 | 5.33 × 10⁻⁶ | 1.20 × 10⁻⁴ | Spot samples. Analysis by HPLC MS/MS. Quality Assessment Scheme (OSEQAS; CTQ/INSPQ, Quebec, Canada). |
| 2022 | Urine from 30 female Latina farmworkers from SW Idaho, USA. 60 (2022). | 0.13 | 0.82 | 4.33 × 10⁻⁶ | 2.73 × 10⁻⁵ | Spot samples. Analysis by HPLC MS/MS. Quality Assessment Scheme (OSEQAS; CTQ/INSPQ, Québec, Canada). |
| 2022 | Urine from 54 non‐farm fathers from Ireland. 61 (2022). | < 0.05 | 0.11 | 1.67 × 10⁻⁶ | 3.67 × 10⁻⁶ | Full morning void. Analysis of derivatized glyphosate by GC MS/MS. Isotopically labelled internal standards used. Analysis well described. LOQ = 0.05 and as used as a substitute for the median concentration. |
| 2022 | Urine from 53 non‐farm mothers from Ireland. 61 (2022). | < 0.05 | 0.17 | 1.67 × 10⁻⁶ | 5.67 × 10⁻⁶ | As in reference. 61 |
| 2022 | Urine from 75 non‐farm children from Ireland. 61 (2022). | < 0.05 | 2.48 | 2.50 × 10⁻⁶ | 1.25 × 10⁻⁴ | As in reference. 61 |
| 2022 | Urine from 14 farm fathers from Ireland. 61 (2022). | < 0.05 | 3.21 | 1.67 × 10⁻⁶ | 1.07 × 10⁻⁴ | As in reference. 61 |
| 2022 | Urine from 13 farm (bystander) mothers from Ireland. 61 (2022). | < 0.05 | 0.23 | 2.50 × 10⁻⁶ | 7.67 × 10⁻⁶ | As in reference. 61 |
| 2022 | Urine from 18 farm (bystander) children from Ireland. 61 (2022). | < 0.05 | 0.23 | 1.67 × 10⁻⁶ | 1.15 × 10⁻⁵ | As in reference. 61 |
| 2023 | Urine from 725 pregnant women from the New York University Children's Health and Environment Study (NYU CHES). 62 (2016‐2023). | 0.36 | 1.20 × 10⁻⁵ | NA | Spot samples assumed for lack of reporting. Samples were taken at each trimester. Analysis by HPLC‐MS/MS. Isotopically labelled internal standards were used. Centiles not provided, only mean. | |
| 2023 | Urine from 48 bystanders (mostly female) in Taounate, located in the Fez‐Meknes region of Morocco 22 (2023). | 0.1 | 0.442 | 3.33 × 10⁻⁶ | 1.47 × 10 −5 | Morning samples. Analysis by LC‐MS/MS. Isotopically labelled standards were used. Good description of the analytical methods. |
| Female |
| Children |
| Male |
| Adults |
Subgroups color‐coded as per panel on the left.
Mean and/or maximum shown in regular font, medians and/or centiles shown in Italics.
C# or A# is a subset of data from the paper by Buekers et al. 2022. 44 A = Adults, C = Children. # = group.
The estimation of systemic dose in section 2.5 of the paper by Berni et al, 2023 54 appears to be incorrect.
Abbreviations: BM, body mass; SG, specific gravity.
Several new studies on exposure to glyphosate in applicators were found in the literature. None of these were conducted with multi‐day sampling following a single application as were discussed in Solomon 2016. 5 All were based on spot or one‐day samples, so it is not possible to compare these results to the earlier studies where total urine output was collected for ≥ 4 days. However, they are included for information and comparison to exposures in the general population.
3. RESULTS
3.1. Studies in applicators
The studies in applicators are summarized in Table 1. These studies were conducted in eight different countries, seven from the northern hemisphere, and one from the southern hemisphere. Several of these studies included evaluation of protective equipment by applicators rather than assessment of hazard. Only one paper provided raw data thus allowing calculation of centiles of concentrations. 15 None of the studies provided individual body mass, so a worst‐case mass of 60 kg for males and females (if they were sampled) was used to estimate the systemic dose. This makes the estimation of hazard more protective. All the data from a paper in the literature was not necessarily included in this review. For example, the study by Bootsikeaw et al, 16 on applicators of glyphosate in vegetable farms in Thailand included four subgroups using different application equipment. Only the two largest subgroups (those using battery‐powered pumps and those using motorized‐pumps) were included in this analysis (see the comment in Table 1).
Table 1.
Summary of new exposure studies on glyphosate in applicators
| Urinary concentration of glyphosate (μg L−¹) b | Systemic dose (mg kg−¹ day−¹) b | |||||
|---|---|---|---|---|---|---|
| Last year of sampling | Source of samples a | Greatest mean or median conc. in urine μg L−¹ | Max or 95th centile conc. in urine | Greatest mean or median | Max. or 95 th centile | Comments |
| 2017 | Urine from 18 male and 2 female sprayers from Ireland. Application of glyphosate in horticulture. 17 | 0.91 | 5.31 | 3.03 × 10⁻⁵ | 1.77 × 10⁻⁴ | Sprayers, using manual knapsack, pressurized lance, and controlled droplet applicator (20 total). Application in horticulture. The analysis was by LC‐MS/MS. LOQ = 0.5 μg L−¹. Combined data for all user‐ groups was used. Source, SI‐Table 1. 100% used gloves, 90% used Tyvek coverall, 97% used respiratory protective equipment (Table 2 of the paper 17 ). |
| 2018 | Urine from 17 male applicators in vineyards in Verona Italy. 15 | 2.30 | 47.2 | 7.67 × 10−¹ | 1.57 × 10⁻³ | The application method was not identified but all applicators (17 total). were trained and licensed. One‐day total urine samples were used. Analysis by LC‐QTRAP, recovery of Gly was 112%. Standards were isotopically labeled. LOQ = 0.1 μg L−¹. The use of gloves, overalls, and respiratory protective equipment ranged from 82 to 76% (table 1 of the paper 15 ). |
| 2018 | Urine from 98 male participants from Agricultural Health Study (AHS) in the USA. 18 | 0.79 | 0.98 c | 2.63 × 10⁻⁵ | 3.27 × 10⁻⁵ | Participants from Agricultural Health Study (AHS), a large prospective cohort of pesticide applicators in Iowa and North Carolina. Recently exposed via agricultural application of glyphosate, tractor sprayer assumed. Spot samples. Analysis by LC MS/MS. Recovery not stated but LOQ = 0.2 μg L−¹. Data were creatinine‐corrected. The systemic dose was based on 60‐kg person, so it was a worst‐case. About 50% use of gloves, less for other PPE. Greater exposures observed for those not using PPE (Table 3 of the paper 18 ). |
| 2019a | Urine from 16 applicators in vegetable farms in Thailand. 16 The gender of the applicators was not reported. | 43.1 | 239.9 | 1.44 × 10⁻³ | 7.99 × 10⁻³ | Application with battery powered spray. Users of manual pump and high‐pressure pump (5) omitted. Analysis was by HPLC of FMOC derivative. Concentrations were normalized to creatinine and volumetric measurements were not provided. Recovery and LOQ not reported. Of the applicators, 86% wore long sleeved shirts, 74% long pants, 55% head covering, and 51% boots. Exposures not correlated to choice of protection (from Table 3 of the paper 16 ). |
| 2019b | Urine from 22 applicators in vegetable farms in Thailand. The gender of applicators was not specified. 16 | 31.1 | 106.7 | 1.04 × 10⁻³ | 3.56 × 10⁻³ | Applicators in vegetable farms in Thailand. Application with motorized spray, the largest subgroup. Users of manual pump and high‐pressure pump (5) were omitted. Analysis and PPE as in reference. 16 |
| 2019 | Urine from 104 male farmer applicators in the UK. 19 | 1.7 | NA | 5.67 × 10⁻⁵ | NA |
Male applicators in the UK. Application was via tractor. Spot samples were taken from each applicator on the day of application and then again after seven days. Analysis was by LC‐MS/MS. Handling of samples was well described in the SI. Centiles and raw data were not provided but LOQ was 0.5 μg L−¹. Lower use of PPE, and less education/literacy were not consistently associated with exposure, but details were not provided. |
| 2019 | Urine from 65 male and 19 female applicators in Uganda. 19 | 7.6 | NA | 2.53 × 10⁻⁴ | NA | Applicators in Uganda. Application via manual sprayer. Three spot samples per applicator. Analysis by LC‐MS/MS. Centiles and raw data not provided but LOQ was 0.5 μg L−¹. Lower use of PPE, and less education/literacy were not consistently associated with exposure, but details not provided. |
| 2020 | Urine from 27 male farmers in New Zealand 2019‐2020. 20 | 2.7 | 150 | 9.00 × 10⁻⁵ | 5.00 × 10⁻³ | Occupational exposure presumably by tractor sprayer. Analysis by LC‐MS/MS with the inclusion of isotopic internal standard. Spot samples assumed. LC‐MS/MS, LOD = 0.2 μg L−¹. Use of PPE and working conditions not reported but “are to be analyzed and reported in a later study” |
| 2020 | Urine from 15 male applicators from Khon Kaen province, Thailand. 21 | 19.4 | 57.5 | 6.47 × 10⁻⁴ | 1.92 × 10⁻³ | Applicators. Backpack application in agricultural Spot samples. HPLC with fluorescence detection of glyphosate derivatized with FMOC. The analytical methods were well described but recovery was not stated. The LOD was 0.1 μg L−¹. PPE consisted of long‐sleeved shirts, long pants, gloves, mask, glasses, hat, and boots. Correlation to exposure not tested. |
| 2023 | Urine from 56 male farmers in Taounate, located in the Fez‐Meknes region of Morocco. 22 | 1.15 | 4.94 | 3.83 × 10⁻⁶ | 1.65 × 10⁻⁵ | Male farmers in Taounate, located in the Fez‐Meknes region of Morocco. Backpack application agricultural LC‐MS/MS. Isotopic standards. Spot samples. The study had well‐reported analytical methods. The LOD for glyphosate was 0.1 μg L−¹. Numbers using various PPE were provided but correlation to exposure was not tested. |
| Female |
| Male |
| Adult male and female or unreported |
Subgroups color‐coded as per panel on the left.
Mean and/or maximum shown in regular font, medians and/or centiles shown in Italics.
Upper 95% confidence limit.
Abbreviations: FMOC = 9‐fluorenylmethyloxycarbonyl chloride, a reagent used to derivatize glyphosate for analysis by chromatography.
The range of systemic doses in applicators varied and these data are illustrated graphically in Fig. 1. Margins of exposure between the most conservative median systemic ADI (RfD) ranged from 42 to 15 642. In addition, all exposures, including the upper 95th centiles or the maximum values were less than the most conservative systemic ADI, indicating a de minimis hazard from application of glyphosate.
Figure 1.

Graphical illustration of the range of exposures in applicators (greatest mean or median and 95th centile or maximum). The date in the legend is the last year of sampling and the source of the data and other relevant comments on the study are listed in Table 1. The horizontal green arrow shows the margin of exposure for the most highly exposed group of applicators. The ADIs shown with the pink stars are those of the agencies that are listed in Section 2.1. The blue stars are the ADIs converted to systemic ADIs as described in Section 2.1.
3.2. Studies in bystanders and the general population
Including the studies on exposures of the general population to glyphosate reviewed in the two earlier reviews, 4 , 5 71 study groups were available from the literature. These studies were conducted in 29 countries and one protectorate and one territory of the USA. Multiple studies were conducted in the USA, Germany, and the UK. Five papers were omitted from the analysis. 20 , 23 , 24 , 25 These were: Analyses of glyphosate in serum samples from pregnant women in Thailand 23 but systemic dose could not be estimated from the information presented. Analyses of 3‐day total daily urine samples for glyphosate from a single farmer and single child in a household in France 24 used good analytical methods, but a measurement from one person was considered unreliable for estimation of a population mean. Nevertheless, the reported peak exposure of 9.5 μg L−1 in this study was less than the most conservative equivalent systemic ADI. A study on urine samples from 125 people in southwest Queensland, Australia 20 was omitted because the samples of urine were pooled prior to analysis and variance could not be estimated. A study in Denmark was conducted on cows 25 and was included in the 2020 review 4 regarding exposures of animals but did not provide exposure data for humans. A paper on concentrations of glyphosate in breast milk from lactating women in the USA 26 was omitted because sufficient details of the analytical method (ELISA) were not provided. In addition, two other studies, McGuire et al. 27 and Steinborn et al. 28 reported no detection (LOD = 1 μg L−1) of glyphosate in milk of 40 and 114 lactating mothers from Idaho USA and Germany, respectively. The latter study 28 did not report concentrations in urine, so it was not possible to calculate systemic dose.
For the purposes in characterizing exposures in the balance of the studies, where data on gender and/or ages of sampled individuals were separated in the papers or reports, these were treated as individual exposure‐groups. These are color coded in Table 2 and in Fig. 2. Exposures were assumed to be via diet and not occupational or household use of glyphosate. Studies are arranged from earliest to most recent on the basis on the last year of sampling, not date of publication. Most urine collections were spot samples. Some studies used a morning‐void or a 24‐h urine sample. The 24‐h sample is the preferred for characterizing the systemic dose in members of the general population, who are exposed through water or foods daily. Some studies attempted to calculate systemic dose using body‐mass‐index (BMI), which is calculated from height and weight. The best way to characterize systemic dose is using body mass and a 24‐h urine sample and several correction factors noted in Solomon, 2016. 5 Therefore, systemic dose was calculated as described for applicators (section 3.1). From the data in Table 2 and Figs 2, 3, 4, 5. Exposure of the general population to glyphosate varied with geographical location of the sampled populations Nevertheless, the median (mean) exposures as well as to 95th centile (maximum exposures) were all less than the lowest ADI (0.1 mg kg d−1). In addition, no obvious trend over time was observed although exposures from some large datasets, such as NHANES 29 and Health Canada, 30 indicated declines in concentrations in recent years. Overall, there were no measurements that exceeded the ADIs and Reference Doses and exposures. Thus, dietary exposures in the general population do not present a hazard.
Figure 2.
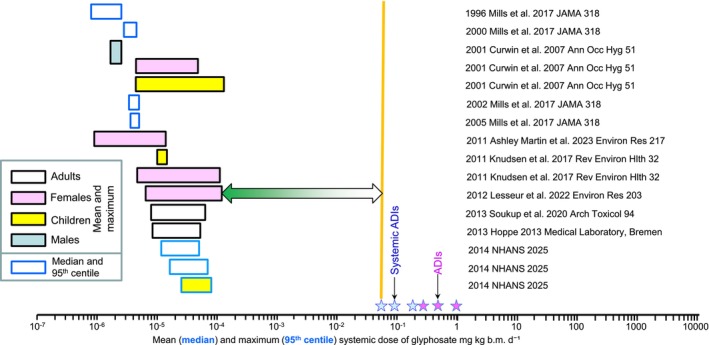
Graphical illustration of the range of exposures in public (greatest mean or median and 95th centile or maximum). The date in the legend is the last year of sampling and the source of the data and other relevant comments on the study are listed in Table 2. The horizontal green arrow shows the margin of exposure relative to the smallest systemic ADI.
Figure 3.

Graphical illustration of the range of exposures in applicators (greatest mean or median and 95th centile or maximum). The date in the legend is the last year of sampling and the source of the data and other relevant comments on the study are listed in Table 2. The horizontal green arrow shows the margin of exposure relative to the smallest systemic ADI.
Figure 4.

Graphical illustration of the range of exposures in public (greatest mean or median and 95th centile or maximum). The date in the legend is the last year of sampling and the source of the data and other relevant comments on the study are listed in Table 2. The horizontal green arrow shows the margin of exposure relative to the smallest systemic ADI.
Figure 5.

Graphical illustration of the range of exposures in applicators (greatest mean or median and 95th centile or maximum). The date in the legend is the last year of sampling and the source of the data and other relevant comments on the study are listed in Table 2. The horizontal green arrow shows the margin of exposure relative to the smallest systemic ADI.
4. DISCUSSION
4.1. Spray applicators
No further large studies on exposure of spray applicators to glyphosate such as those conducted for registration of glyphosate (see refs 4, 5) have been published. However, none of the newer studies suggested hazards or risks to applicators if appropriate measures are taken to reduce exposures of applicators (see Table 1 for information on use of personal protective equipment (PPE)). Inter alia, these include the use of PPE, training, and workplace safety inspections.
4.2. General population
Exposures of the general population are dietary, but there are insufficient data to apportion the source of exposure between water and food. However, as discussed in the 2020 review, 4 concentrations of glyphosate in surface waters are small and chlorination or ozonation during treatment of drinking water will reduce concentrations even further. 63 This points to food as the major source of exposure, a conclusion that was put forward in a study of a small number of volunteers who changed from a diet of conventionally produced food to ‘organic’ food where, presumably, glyphosate was not used. 51 However, all exposures in the ‘organic’ group did not decrease to non‐detect.
To better characterize hazards from exposure to glyphosate in the general population, margins of exposure (MoEs) were determined by dividing the most conservative systemic ADI (0.06 mg kg−1 d−1) by the mean or median exposure in each study group in Tables 1 and 2. The median or mean was selected as the best estimate of amortized exposures over time for the general population. These values were then ranked and plotted on a graph of percent rank against the log10 of exposures using SigmaPlot. 64 The results are shown in Fig. 6. Because the studies in applicators were based on spot samples, they can be compared to exposures in the general population. In general, the MOEs for applicators were smaller than those for the general population.
Figure 6.

Cumulative frequency distribution of margins of exposures for glyphosate in 10 study groups of applicators and 70 study groups from the general population (data from Tables 1 and 2).
5. CONCLUSIONS
Regardless of source and pathway, exposures to glyphosate in the general population were at least several orders of magnitude less than the revised and updated ADIs or RfD from USEAP, FAO, EFSA, FSCJ, and the APVMA. The 50th centile MoE for applicators was 590 and that for the general population was 6270. It should be noted that the ADIs and RfDs used in this assessment are derived from the most sensitive response in long‐term feeding studies in the most sensitive laboratory test species and that an uncertainty factor is applied to these values. Based on the current RfDs and ADIs, the risk from the use glyphosate under guidelines for good‐agricultural and landscape‐practice for the management of weeds and production of crops is considered de minimis.
Given the lack of an obvious trend across time in the studies on the general population, the value of continuing smaller studies on exposure of this group is questionable. This is especially the case as there are alternatives for monitoring the general population, such as NHANES in the USA, Health Canada, and similar institutional programs in other countries. The surveillance data from these studies provides information on exposures for many chemicals, including pesticides and chemicals from other industrial sources. However, these data should be normalized to body mass to provide a systemic ADI which would be more useful for assessing risks from measured exposures.
ACKNOWLEDGEMENTS
The author thanks the anonymous referees and the editor for their useful comments and suggestions for improving the MS. The author declares no financial or other conflict of interest.
DATA AVAILABILITY STATEMENT
Data used in the paper are from published papers and report that are cited in the paper. Where data were from Tables in published papers, they are named.
REFERENCES
- 1. Duke SO, The history and current status of glyphosate. Pest Manag Sci 74:1027–1034 (2018). [DOI] [PubMed] [Google Scholar]
- 2. Duke SO, Glyphosate exposure and toxicology. Pest Manag Sci 76:2873 (2020). [DOI] [PubMed] [Google Scholar]
- 3. IARC , Some Organophosphate Insecticides and Herbicides IARC Monographs on the Evaluation of Carcinogenic Risks to Humans Volume 112, Glyphosate. International Agency for Research on Cancer, Leon, France, pp. 1–92 (2015). [Google Scholar]
- 4. Solomon KR, Estimated exposure to glyphosate in humans via environmental, occupational, and dietary pathways: an updated review of the scientific literature. Pest Manag Sci 76:2878–2885 (2020). [DOI] [PubMed] [Google Scholar]
- 5. Solomon KR, Glyphosate in the general population and in applicators: a critical review of studies on exposures. Crit Rev Toxicol 46:21–27 (2016). 10.1080/10408444.2016.1214678 [DOI] [PubMed] [Google Scholar]
- 6. Grandcoin A, Piel S and Baurès E, AminoMethylPhosphonic acid (AMPA) in natural waters: its sources, behavior and environmental fate. Water Res 117:187–197 (2017). [DOI] [PubMed] [Google Scholar]
- 7. Huhn C, Schwientek M, Rügner H, Haderlein S, Schulz W, Wimmer B et al., Glyphosate contamination in European rivers not from herbicide application? Research Square 63:122140 (2024). [DOI] [PubMed] [Google Scholar]
- 8. USEPA , EPA Takes Next Step in Review Process for Herbicide Glyphosate, Reaffirms No Risk to Public Health https://www.epa.gov/newsreleases/epa-takes-next-step-review-process-herbicide-glyphosate-reaffirms-no-risk-public-health [accessed May 2019].
- 9. FAO , Pesticide Residues in Food 2013. Joint FAO/WHO Meeting on Pesticide Residues: Glyphosate (158) and Metabolites. World Health Organization & Food and Agriculture Organization of the United Nations, Rome, pp. 225–228 (2013). [Google Scholar]
- 10. FSCJ , Risk Assessment Report: Pesticides Glyphosate Summary. Food Safety Commission, Cabinet Office, Government of Japan, Tokyo, p. 10 (2016). [Google Scholar]
- 11. APVMA , Final Regulatory Position: Consideration of the Evidence for a Formal Reconsideration of Glyphosate. Australian Pesticides and Veterinary Medicines Authority: Canberra. ACT, Australia, p. 45 (2017). [Google Scholar]
- 12. PMRA , Proposed Re‐Evaluation Decision: Glyphosate. Pest Management Regulatory Agency, Health Canada, Ottawa, ON, p. 330 (2015). [Google Scholar]
- 13. EFSA , Conclusion on the peer review of the pesticide risk assessment of the active substance glyphosate. EFSA J 13:4302 (2015). [DOI] [PMC free article] [PubMed] [Google Scholar]
- 14. Niemann L, Sieke C, Pfeil R and Solecki R, A critical review of glyphosate findings in human urine samples and comparison with the exposure of operators and consumers. J Verbr Lebensm 10:3–12 (2015). [Google Scholar]
- 15. Porru S, Ferrian M, Mastrangelo G, Capovilla D, Corsini E, Fustinoni S et al., Short occupational exposure to glyphosate and its biomonitoring via urinary levels of glyphosate and metabolite AMPA (amino‐MethylPhosphonic acid), in Italian vineyard workers. Heliyon 10:e36407 (2024). [DOI] [PMC free article] [PubMed] [Google Scholar]
- 16. Bootsikeaw S, Kongtip P, Nankongnab N, Chantanakul S, Sujirarat D, Mahaboonpeeti R et al., Urinary glyphosate biomonitoring of sprayers in vegetable farm in Thailand. Hum Ecol Risk Assess 27:1019–1036 (2021). 10.1080/10807039.2020.1797471. [DOI] [PMC free article] [PubMed] [Google Scholar]
- 17. Connolly A, Basinas I, Jones K, Galea KS, Kenny L, McGowan P et al., Characterising glyphosate exposures among amenity horticulturists using multiple spot urine samples. Int J Hyg Environ Health 221:1012–1022 (2018). [DOI] [PubMed] [Google Scholar]
- 18. Chang VC, Ospina M, Xie S, Andreotti G, Parks CG, Liu D et al., Urinary biomonitoring of glyphosate exposure among male farmers and nonfarmers in the biomarkers of exposure and effect in agriculture (BEEA) study. Environ Int 187:108644 (2024). [DOI] [PMC free article] [PubMed] [Google Scholar]
- 19. Mueller W, Jones K, Fuhrimann S, Ahmad ZNBS, Sams C, Harding A‐H et al., Factors influencing occupational exposure to pyrethroids and glyphosate: an analysis of urinary biomarkers in Malaysia, Uganda and the United Kingdom. Environ Res 242:117651 (2024). [DOI] [PubMed] [Google Scholar]
- 20. Campbell G, Mannetje A, Keer S, Eaglesham G, Wang X, Lin C‐Y et al., Characterization of glyphosate and AMPA concentrations in the urine of Australian and New Zealand populations. Sci Total Environ 847:157585 (2022). 10.1016/j.scitotenv.2022.157585. [DOI] [PubMed] [Google Scholar]
- 21. Chaiklieng S, Uengchuen K, Gissawong N, Srijaranai S and Autrup H, Biological monitoring of glyphosate exposure among knapsack sprayers in Khon Kaen, Thailand. Toxics 12:337 (2024). [DOI] [PMC free article] [PubMed] [Google Scholar]
- 22. ben Khadda Z, Bungau SG, El Balkhi S, Ezrari S, Radu A‐F, Houssaini TS et al., Urinary biomonitoring of exposure to glyphosate and its metabolite amino‐methyl phosphonic acid among farmers and non‐farmers in Morocco. Environ Toxicol Pharmacol 113:104620 (2025). [DOI] [PubMed] [Google Scholar]
- 23. Kongtip P, Nankongnab N, Phupancharoensuk R, Palarach C, Sujirarat D, Sangprasert S et al., Glyphosate and paraquat in maternal and fetal serums in Thai women. J Agromedicine 22:282–289 (2017). 10.1080/1059924X.2017.1319315. [DOI] [PubMed] [Google Scholar]
- 24. Mesnage R, Moesch C, Grand R, Lauthier G, Vendômois J, Gress S et al., Glyphosate exposure in a farmer's family. J Environ Protect 3:1001–1003 (2012). [Google Scholar]
- 25. Krüger M, Schledorn P, Schrödl W, Hoppe H‐W, Lutz W and Shehata AA, Detection of glyphosate residues in animals and humans. J Environ Anal Toxicol 4:1000210 (2014). [Google Scholar]
- 26. Honeycutt Z and Rowlands H, Glyphosate Testing Report: Findings in American Mothers' Breast Milk, Urine and Water https://d3n8a8pro7vhmx.cloudfront.net/yesmaam/pages/774/attachments/original/1396803706/Glyphosate__Final__in_the_breast_milk_of_American_women_Draft6_.pdf?1396803706 [accessed 2015‐11‐20].
- 27. McGuire MK, McGuire MA, Price WJ, Shafii B, Carrothers JM, Lackey KA et al., Glyphosate and aminomethylphosphonic acid are not detectable in human milk. Am J Clin Nutr 103:1285–1290 (2016). 10.3945/ajcn.115.126854. [DOI] [PubMed] [Google Scholar]
- 28. Steinborn A, Alder L, Michalski B, Zomer P, Bendig P, Martinez SA et al., Determination of glyphosate levels in breast Milk samples from Germany by LC‐MS/MS and GC‐MS/MS. J Agric Food Chem 64:1414–1421 (2016). [DOI] [PubMed] [Google Scholar]
- 29. Ospina M, Schutze A, Morales‐Agudelo P, Vidal M, Wong LY and Calafat AM, Temporal trends of exposure to the herbicide glyphosate in the United States (2013‐2018): data from the National Health and nutrition examination survey. Chemosphere 364:142966 (2024). [DOI] [PMC free article] [PubMed] [Google Scholar]
- 30. Health Canada , Canadian biomonitoring dashboard, results https://health-infobase.canada.ca/biomonitoring/ [accessed January 2025].
- 31. Mills PJ, Kania‐Korwel I, Fagan J, McEvoy LK, Laughlin GA and Barrett‐Connor E, Excretion of the herbicide glyphosate in older adults between 1993 and 2016. JAMA 318:1610–1611 (2017). [DOI] [PMC free article] [PubMed] [Google Scholar]
- 32. Curwin BD, Hein MJ, Sanderson WT, Striley C, Heederik D, Kromhout H et al., Urinary pesticide concentrations among children, mothers and fathers living in farm and non‐farm households in Iowa. Ann Occ Hyg 51:53–65 (2007). [DOI] [PubMed] [Google Scholar]
- 33. Ashley‐Martin J, Huang R, MacPherson S, Brion O, Owen J, Gaudreau E et al., Urinary concentrations and determinants of glyphosate and glufosinate in pregnant Canadian participants in the MIREC study. Environ Res 217:114842 (2023). [DOI] [PubMed] [Google Scholar]
- 34. Knudsen LE, Hansen PW, Mizrak S, Hansen HK, Mørck TA, Nielsen F et al., Biomonitoring of Danish school children and mothers including biomarkers of PBDE and glyphosate. Rev Environ Health 32:279–290 (2017). [DOI] [PubMed] [Google Scholar]
- 35. Lesseur C, Pathak KV, Pirrotte P, Martinez MN, Ferguson KK, Barrett ES et al., Urinary glyphosate concentration in pregnant women in relation to length of gestation. Environ Res 203:111811 (2022). [DOI] [PMC free article] [PubMed] [Google Scholar]
- 36. Soukup ST, Merz B, Bub A, Hoffmann I, Watzl B, Steinberg P et al., Glyphosate and AMPA levels in human urine samples and their correlation with food consumption: results of the cross‐sectional KarMeN study in Germany. Arch Toxicol 94:1575–1584 (2020). [DOI] [PMC free article] [PubMed] [Google Scholar]
- 37. Hoppe H‐W , Determination of Glyphosate Residue in Human Unire Samples from 18 European Countries. Medical Laboratory, Bremen, Bremen, Germany, p. 18 (2013). [Google Scholar]
- 38. NHANES , New Urinary Glyphosate (N‐(Phosphonomethyl)glycine) Data Published (NHANES 2013‐2018) https://www.cdc.gov/exposurereport/data_tables.html [accessed Jan 28 2025].
- 39. Markard C. Ergebnisse der Vorstudie HBM von Glyphosat , Federal Environmental Agency (UBA), Umweltprobenbank des Bundes. Unpublished Report. German Federal Institute for Risk Assessment (BfR), Berlin, German: (2014). [Google Scholar]
- 40. Cosemans C, Van Larebeke N, Janssen BG, Martens DS, Baeyens W, Bruckers L et al., Glyphosate and AMPA exposure in relation to markers of biological aging in an adult population‐based study. Int J Hyg Environ Health 240:113895 (2022). [DOI] [PubMed] [Google Scholar]
- 41. Ruiz P, Dualde P, Coscollà C, Fernández SF, Carbonell E and Yusà V, Biomonitoring of glyphosate and AMPA in the urine of Spanish lactating mothers. Sci Total Environ 801:149688 (2021). [DOI] [PubMed] [Google Scholar]
- 42. von Rendón‐ Osten J and Dzul‐Caamal R, Glyphosate residues in groundwater, drinking water and urine of subsistence farmers from intensive agriculture localities: a survey in Hopelchén, Campeche, Mexico. Int J Environ Res Public Health 14:595 (2017). [DOI] [PMC free article] [PubMed] [Google Scholar]
- 43. Conrad A, Schroter‐Kermani C, Hoppe HW, Ruther M, Pieper S and Kolossa‐Gehring M, Glyphosate in German adults ‐ time trend (2001 to 2015) of human exposure to a widely used herbicide. Int J Hyg Environ Health 220:8–16 (2017). [DOI] [PubMed] [Google Scholar]
- 44. Buekers J, Remy S, Bessems J, Govarts E, Rambaud L, Riou M et al., Glyphosate and AMPA in human urine of HBM4EU aligned studies: part a children. Toxics 10:470 (2022). [DOI] [PMC free article] [PubMed] [Google Scholar]
- 45. Buekers J, Remy S, Bessems J, Govarts E, Rambaud L, Riou M et al., Glyphosate and AMPA in human urine of HBM4EU‐aligned studies: part B adults. Toxics 10:552 (2022). [DOI] [PMC free article] [PubMed] [Google Scholar]
- 46. Eaton JL, Cathey AL, Fernandez JA, Watkins DJ, Silver MK, Milne GL et al., The association between urinary glyphosate and aminomethyl phosphonic acid with biomarkers of oxidative stress among pregnant women in the PROTECT birth cohort study. Ecotoxicol Environ Saf 233:113300 (2022). 10.1016/j.ecoenv.2022.113300. [DOI] [PMC free article] [PubMed] [Google Scholar]
- 47. Silver MK, Fernandez J, Tang J, McDade A, Sabino J, Rosario Z et al., Prenatal exposure to glyphosate and its environmental degradate, aminomethylphosphonic acid (AMPA), and preterm birth: a nested case–control study in the PROTECT cohort (Puerto Rico). Environ Health Perspect 129:057011 (2021). [DOI] [PMC free article] [PubMed] [Google Scholar]
- 48. Faniband MH, Norén E, Littorin M and Lindh CH, Human experimental exposure to glyphosate and biomonitoring of young Swedish adults. Int J Hyg Environ Health 231:113657 (2021). [DOI] [PubMed] [Google Scholar]
- 49. Lemke N, Murawski A, Schmied‐Tobies MIH, Rucic E, Hoppe HW, Conrad A et al., Glyphosate and aminomethylphosphonic acid (AMPA) in urine of children and adolescents in Germany ‐ human biomonitoring results of the German environmental survey 2014‐2017 (GerES V). Environ Int 156:106769 (2021). [DOI] [PubMed] [Google Scholar]
- 50. Connolly A, Leahy M, Jones K, Kenny L and Coggins MA, Glyphosate in Irish adults – a pilot study in 2017. Environ Res 165:235–236 (2018). [DOI] [PubMed] [Google Scholar]
- 51. Fagan J, Bohlen L, Patton S and Klein K, Organic diet intervention significantly reduces urinary glyphosate levels in U.S. children and adults. Environ Res 189:109898 (2020). [DOI] [PubMed] [Google Scholar]
- 52. Nova P, Calheiros CS and Silva M, Glyphosate in Portuguese adults–a pilot study. Environ Toxicol Pharmacol 80:103462 (2020). [DOI] [PubMed] [Google Scholar]
- 53. Stajnko A, Tratnik JS, Kosjek T, Mazej D, Jagodic M, Eržen I et al., Seasonal glyphosate and AMPA levels in urine of children and adolescents living in rural regions of northeastern Slovenia. Environ Int 143:105985 (2020). 10.1016/j.envint.2020.105985. [DOI] [PubMed] [Google Scholar]
- 54. Berni I, Menouni A, Creta M, El Ghazi I, Duca R‐C, Godderis L et al., Exposure of children to glyphosate in Morocco: urinary levels and predictors of exposure. Environ Res 217:114868 (2023). [DOI] [PubMed] [Google Scholar]
- 55. Ferreira C, Duarte SC, Costa E, Pereira AM, Silva LJ, Almeida A et al., Urine biomonitoring of glyphosate in children: exposure and risk assessment. Environ Res 198:111294 (2021). [DOI] [PubMed] [Google Scholar]
- 56. Sierra‐Diaz E, de la Celis‐ Rosa AJ, Lozano‐Kasten F, Trasande L, Peregrina‐Lucano AA, Sandoval‐Pinto E et al., Urinary pesticide levels in children and adolescents residing in two agricultural communities in Mexico. Int J Environ Res Public Health 16:562 (2019). [DOI] [PMC free article] [PubMed] [Google Scholar]
- 57. Sierra‐Diaz E, de la Celis‐ Rosa AJ, Lozano‐Kasten F, Trasande L, Peregrina‐Lucano AA, Sandoval‐Pinto E et al., Erratum: Sierra‐Diaz, E.; Celis‐de la Rosa, a.J.; Lozano‐Kasten, F.; Trasande, L.; Peregrina‐Lucano, a.a.; Sandoval‐Pinto, E.; Gonzalez‐Chavez, H. Urinary pesticide levels in children and adolescents residing in two agricultural communities in Mexico. Int. J. Environ. Res. Public health 2019, 16, 562. Int J Environ Res Public Health 17 (2019). [DOI] [PMC free article] [PubMed] [Google Scholar]
- 58. Trasande L, Aldana SI, Trachtman H, Kannan K, Morrison D, Christakis DA et al., Glyphosate exposures and kidney injury biomarkers in infants and young children. Environ Pollut 256:113334 (2020). [DOI] [PMC free article] [PubMed] [Google Scholar]
- 59. Grau D, Grau N, Gascuel Q, Paroissin C, Stratonovitch C, Lairon D et al., Quantifiable urine glyphosate levels detected in 99% of the French population, with higher values in men, in younger people, and in farmers. Environ Sci Pollut Res Int 29:32882–32893 (2022). [DOI] [PMC free article] [PubMed] [Google Scholar]
- 60. Hyland C, Hernandez A, Gaudreau É, Larose J, Bienvenu J‐F, Meierotto L et al., Examination of urinary pesticide concentrations, protective behaviors, and risk perceptions among Latino and Latina farmworkers in southwestern Idaho. Int J Hyg Environ Health 255:114275 (2024). [DOI] [PubMed] [Google Scholar]
- 61. Connolly A, Koch HM, Bury D, Koslitz S, Kolossa‐Gehring M, Conrad A et al., A human biomonitoring study assessing glyphosate and aminomethylphosphonic acid (AMPA) exposures among farm and non‐farm families. Toxics 10:690 (2022). [DOI] [PMC free article] [PubMed] [Google Scholar]
- 62. Mellor E, Trasande L, Albergamo V, Kannan K, Li Z, Ghassabian A et al., Sociodemographic and dietary determinants of glyphosate exposure in a NYC‐based pregnancy cohort. Environ Pollut 363:125083 (2024). [DOI] [PMC free article] [PubMed] [Google Scholar]
- 63. Jönsson J, Camm R and Hall T, Removal and degradation of glyphosate in water treatment: a review. J Water Supply Res Technol 62:395 (2013). [Google Scholar]
- 64. Systat , SigmaPlot for Windows Version 11.2. Systat Software Inc., Chicago, IL: (2011). [Google Scholar]
Associated Data
This section collects any data citations, data availability statements, or supplementary materials included in this article.
Data Availability Statement
Data used in the paper are from published papers and report that are cited in the paper. Where data were from Tables in published papers, they are named.